EX-99.1
Published on May 14, 2012
Exhibit 99.1

| 2012 Second Quarter Investor Handout 1 May 14, 2012 |
| Table of Contents Current Topics 3 OCR Performance Review 9 Financial Review 17 Significant items impacting comparisons 23 Income Statement 25 Revenue Growth 26 Net interest margin 28 Noninterest income 30 Noninterest expense 33 Balance Sheet 35 Investment Securities 39 Loan Portfolio Overview 44 Credit exposure composition 45 Loan & lease trends 47 Total Commercial Loans 50 Granularity 51 Risk grade distribution 52 Commercial & industrial 53 Commercial real estate 56 CRE core / noncore 58 Total Consumer Loans and Leases 60 Indirect Auto 62 Home equity 64 Residential mortgages 65 Other consumer loans 67 Credit Quality Review 68 Credit quality trends overview 69 Delinquencies 70 Net charge-offs 73 Nonaccrual & nonperforming assets 75 Accruing 90 days past due and TDR loans 79 Allowance for credit losses 80 Peer credit comparisons 81 Deposits 85 Deposit trends 87 Capital 90 Peer capital comparisons 93 Franchise & Leadership 94 Business Segment Overview 103 Safe Harbor Disclosures 114 2 |

| Current Topics 3 |
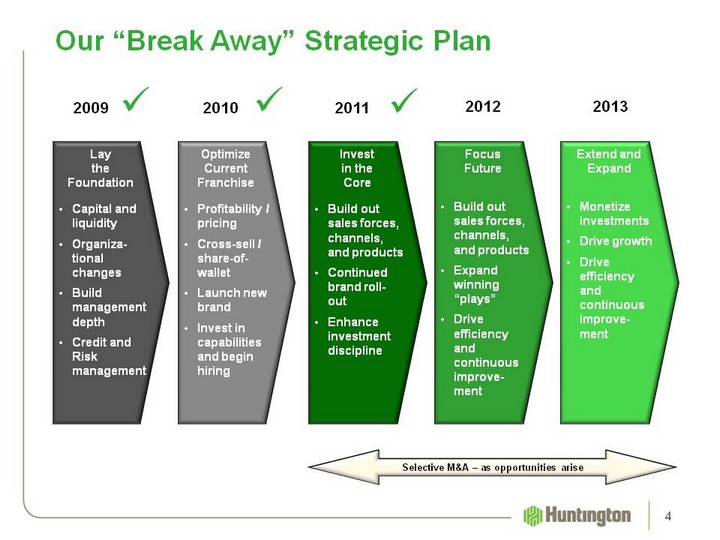
| Optimize Current Franchise Profitability / pricing Cross-sell / share-of-wallet Launch new brand Invest in capabilities and begin hiring Our "Break Away" Strategic Plan 4 Lay the Foundation Capital and liquidity Organiza-tional changes Build management depth Credit and Risk management Invest in the Core Build out sales forces, channels, and products Continued brand roll-out Enhance investment discipline Selective M&A - as opportunities arise 2009 Focus Future Build out sales forces, channels, and products Expand winning "plays" Drive efficiency and continuous improve-ment Extend and Expand Monetize investments Drive growth Drive efficiency and continuous improve-ment 2010 2011 2012 2013 |
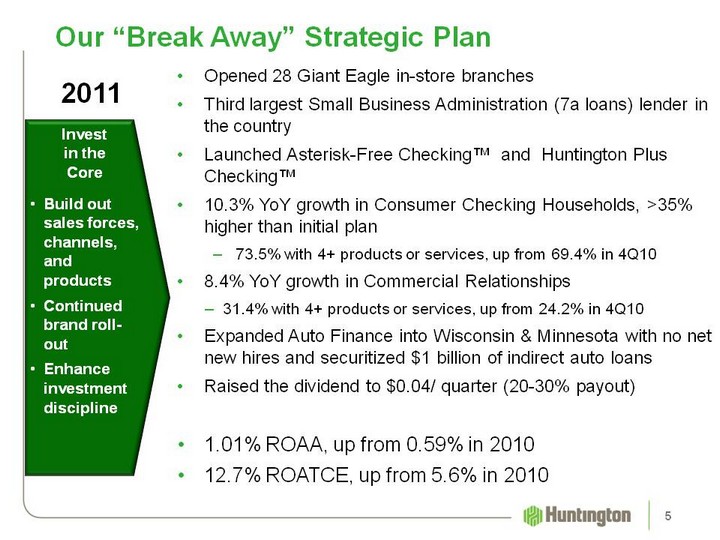
| Our "Break Away" Strategic Plan 5 Invest in the Core Build out sales forces, channels, and products Continued brand roll-out Enhance investment discipline 2011 Opened 28 Giant Eagle in-store branches Third largest Small Business Administration (7a loans) lender in the country Launched Asterisk-Free Checking(tm) and Huntington Plus Checking(tm) 10.3% YoY growth in Consumer Checking Households, >35% higher than initial plan 73.5% with 4+ products or services, up from 69.4% in 4Q10 8.4% YoY growth in Commercial Relationships 31.4% with 4+ products or services, up from 24.2% in 4Q10 Expanded Auto Finance into Wisconsin & Minnesota with no net new hires and securitized $1 billion of indirect auto loans Raised the dividend to $0.04/ quarter (20-30% payout) 1.01% ROAA, up from 0.59% in 2010 12.7% ROATCE, up from 5.6% in 2010 |
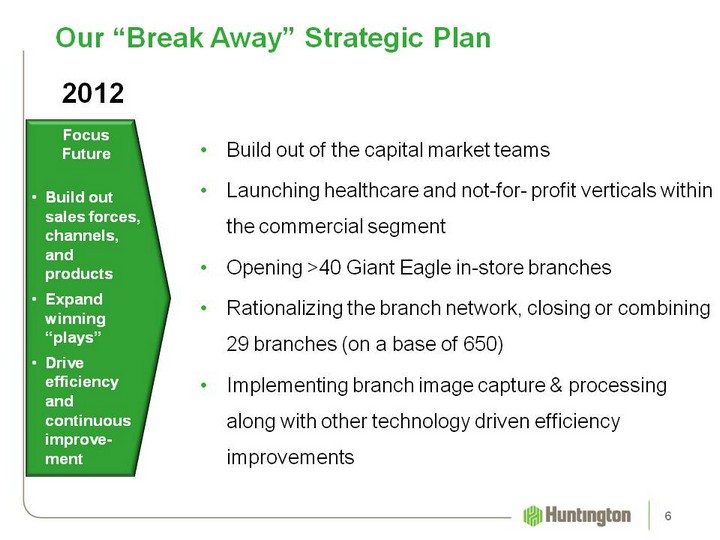
| Our "Break Away" Strategic Plan 6 Build out of the capital market teams Launching healthcare and not-for- profit verticals within the commercial segment Opening >40 Giant Eagle in-store branches Rationalizing the branch network, closing or combining 29 branches (on a base of 650) Implementing branch image capture & processing along with other technology driven efficiency improvements Focus Future Build out sales forces, channels, and products Expand winning "plays" Drive efficiency and continuous improve-ment 2012 |
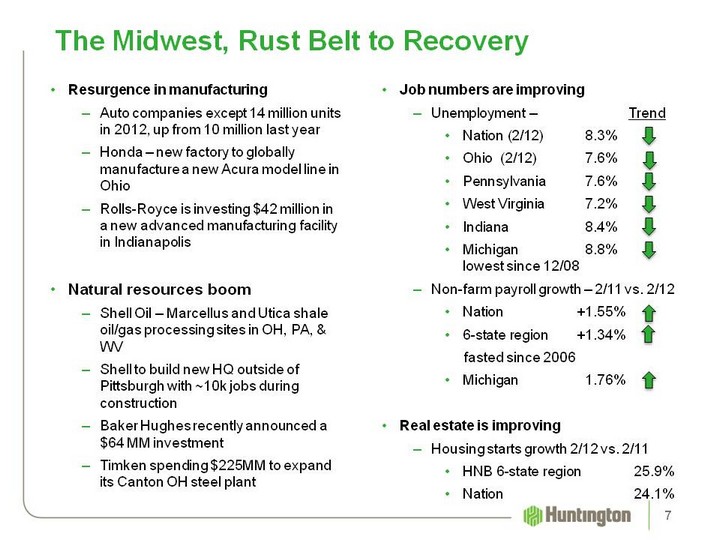
| Job numbers are improving Unemployment - Trend Nation (2/12) 8.3% Ohio (2/12) 7.6% Pennsylvania 7.6% West Virginia 7.2% Indiana 8.4% Michigan 8.8% lowest since 12/08 Non-farm payroll growth - 2/11 vs. 2/12 Nation +1.55% 6-state region +1.34% fasted since 2006 Michigan 1.76% Real estate is improving Housing starts growth 2/12 vs. 2/11 HNB 6-state region 25.9% Nation 24.1% The Midwest, Rust Belt to Recovery Resurgence in manufacturing Auto companies except 14 million units in 2012, up from 10 million last year Honda - new factory to globally manufacture a new Acura model line in Ohio Rolls-Royce is investing $42 million in a new advanced manufacturing facility in Indianapolis Natural resources boom Shell Oil - Marcellus and Utica shale oil/gas processing sites in OH, PA, & WV Shell to build new HQ outside of Pittsburgh with ~10k jobs during construction Baker Hughes recently announced a $64 MM investment Timken spending $225MM to expand its Canton OH steel plant 7 |
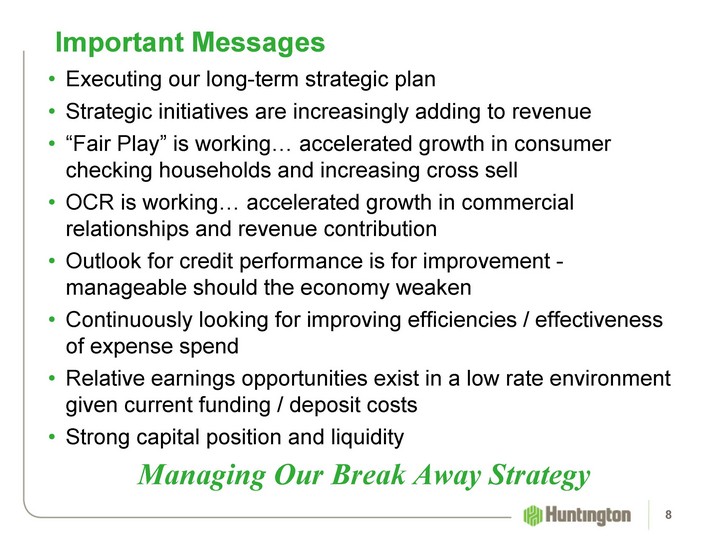
| Important Messages Executing our long-term strategic plan Strategic initiatives are increasingly adding to revenue "Fair Play" is working... accelerated growth in consumer checking households and increasing cross sell OCR is working... accelerated growth in commercial relationships and revenue contribution Outlook for credit performance is for improvement - manageable should the economy weaken Continuously looking for improving efficiencies / effectiveness of expense spend Relative earnings opportunities exist in a low rate environment given current funding / deposit costs Strong capital position and liquidity Managing Our Break Away Strategy 8 |
| OCR Performance Review 9 |
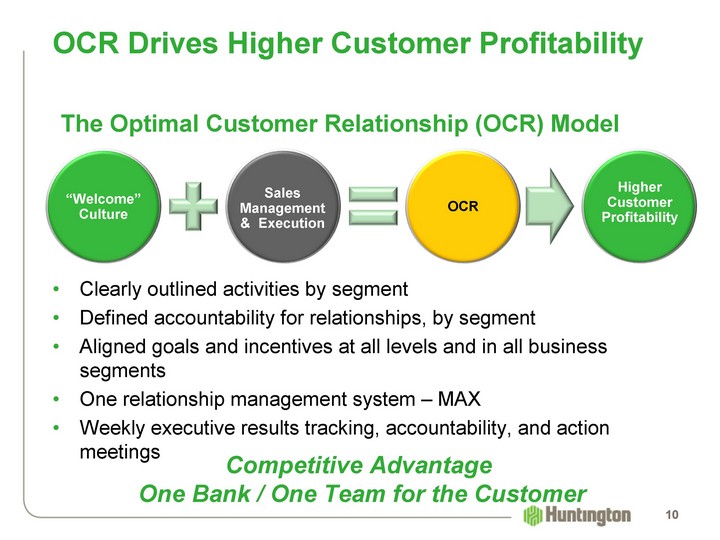
| OCR Drives Higher Customer Profitability Clearly outlined activities by segment Defined accountability for relationships, by segment Aligned goals and incentives at all levels and in all business segments One relationship management system - MAX Weekly executive results tracking, accountability, and action meetings Competitive Advantage One Bank / One Team for the Customer The Optimal Customer Relationship (OCR) Model "Welcome" Culture Sales Management & Execution OCR Higher Customer Profitability 10 |
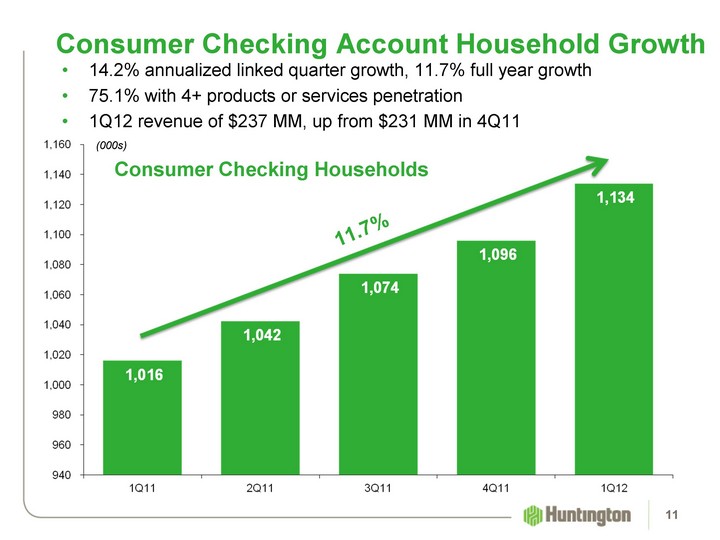
| Consumer Checking Account Household Growth 14.2% annualized linked quarter growth, 11.7% full year growth 75.1% with 4+ products or services penetration 1Q12 revenue of $237 MM, up from $231 MM in 4Q11 Consumer Checking Households 11.7% (000s) 11 |
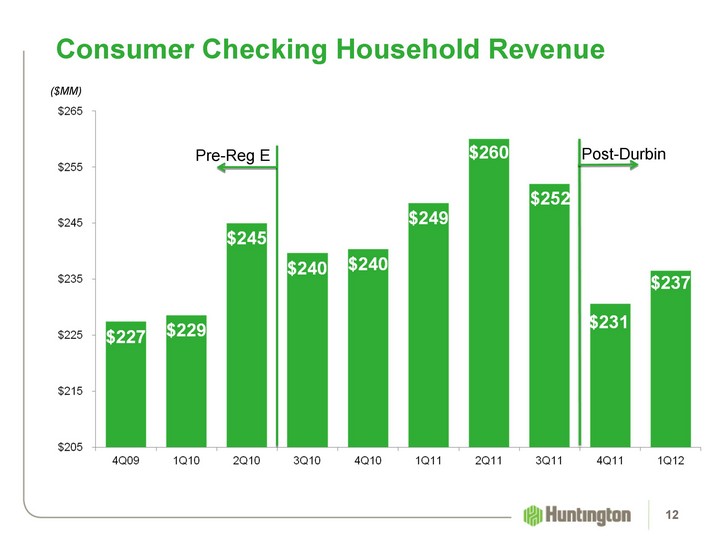
| Consumer Checking Household Revenue ($MM) 12 Pre-Reg E Post-Durbin |
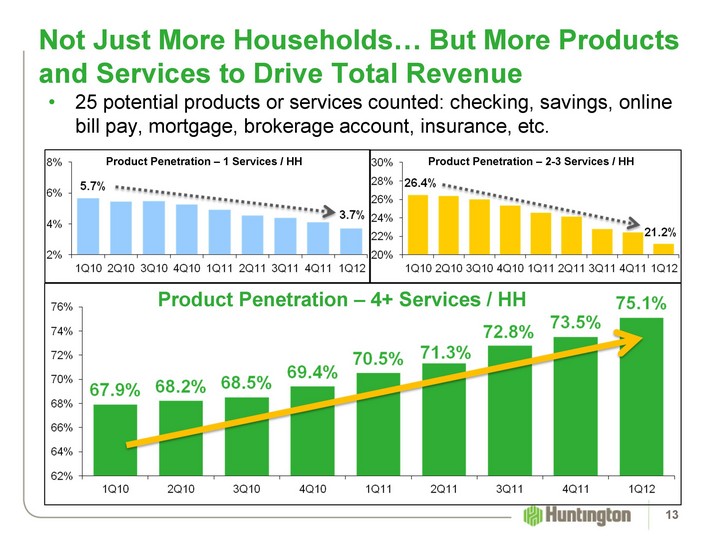
| Product Penetration - 4+ Services / HH Not Just More Households... But More Products and Services to Drive Total Revenue 25 potential products or services counted: checking, savings, online bill pay, mortgage, brokerage account, insurance, etc. Product Penetration - 1 Services / HH Product Penetration - 2-3 Services / HH 13 |
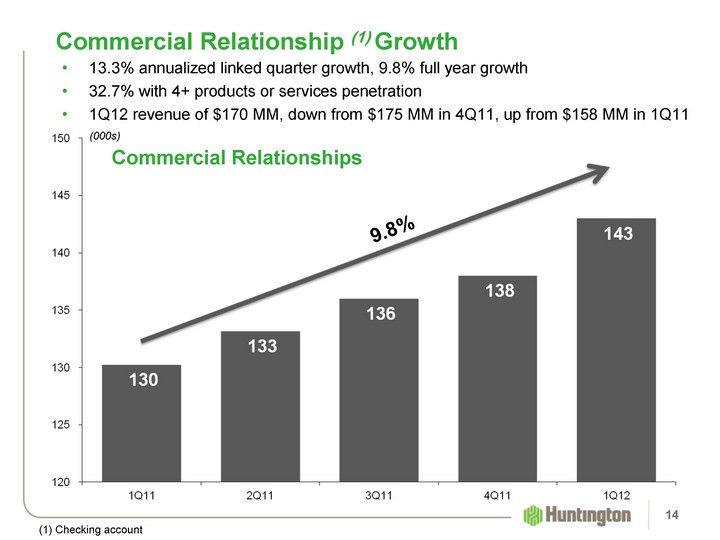
| Commercial Relationship (1) Growth Commercial Relationships 9.8% (1) Checking account 13.3% annualized linked quarter growth, 9.8% full year growth 32.7% with 4+ products or services penetration 1Q12 revenue of $170 MM, down from $175 MM in 4Q11, up from $158 MM in 1Q11 (000s) 14 |
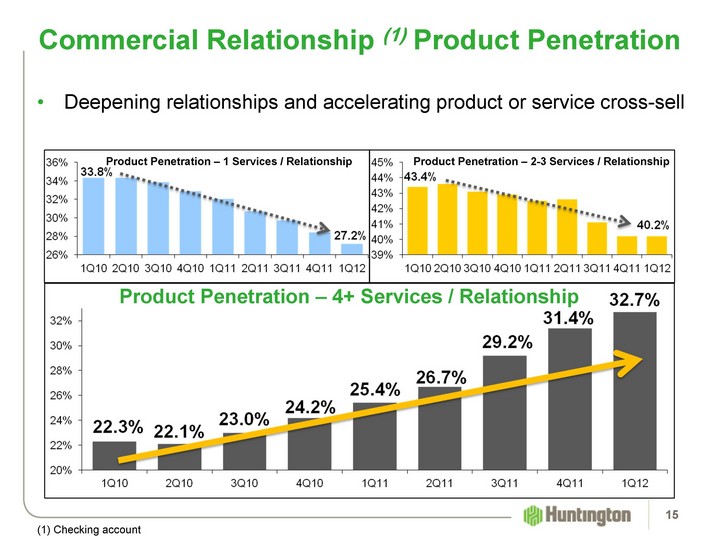
| Product Penetration - 2-3 Services / Relationship Commercial Relationship (1) Product Penetration Product Penetration - 4+ Services / Relationship Deepening relationships and accelerating product or service cross-sell Product Penetration - 1 Services / Relationship 15 (1) Checking account |
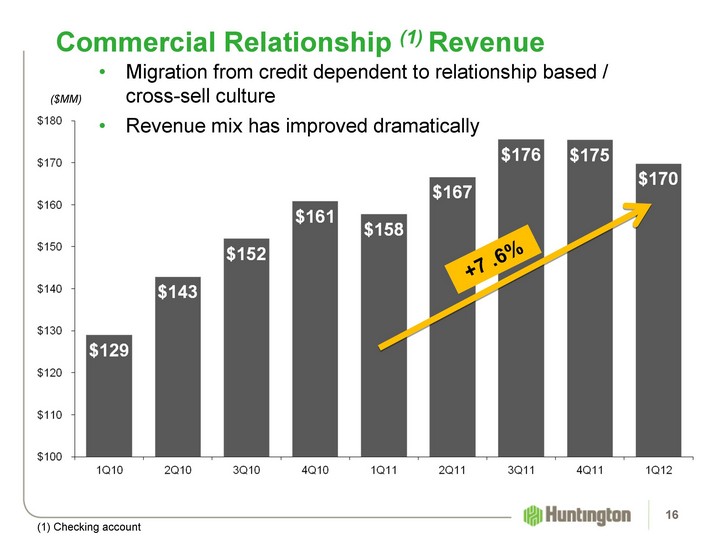
| Migration from credit dependent to relationship based / cross-sell culture Revenue mix has improved dramatically 16 Commercial Relationship (1) Revenue ($MM) +7 .6% (1) Checking account |

| Financial Review 17 |
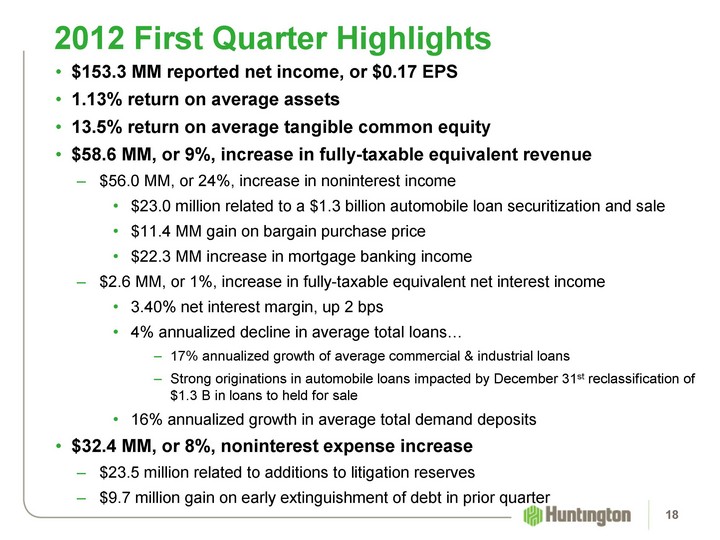
| $153.3 MM reported net income, or $0.17 EPS 1.13% return on average assets 13.5% return on average tangible common equity $58.6 MM, or 9%, increase in fully-taxable equivalent revenue $56.0 MM, or 24%, increase in noninterest income $23.0 million related to a $1.3 billion automobile loan securitization and sale $11.4 MM gain on bargain purchase price $22.3 MM increase in mortgage banking income $2.6 MM, or 1%, increase in fully-taxable equivalent net interest income 3.40% net interest margin, up 2 bps 4% annualized decline in average total loans... 17% annualized growth of average commercial & industrial loans Strong originations in automobile loans impacted by December 31st reclassification of $1.3 B in loans to held for sale 16% annualized growth in average total demand deposits $32.4 MM, or 8%, noninterest expense increase $23.5 million related to additions to litigation reserves $9.7 million gain on early extinguishment of debt in prior quarter 2012 First Quarter Highlights 18 |
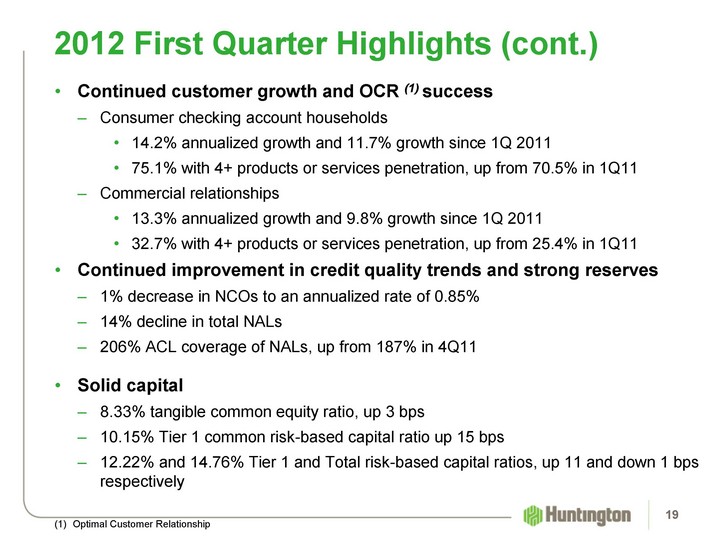
| Continued customer growth and OCR (1) success Consumer checking account households 14.2% annualized growth and 11.7% growth since 1Q 2011 75.1% with 4+ products or services penetration, up from 70.5% in 1Q11 Commercial relationships 13.3% annualized growth and 9.8% growth since 1Q 2011 32.7% with 4+ products or services penetration, up from 25.4% in 1Q11 Continued improvement in credit quality trends and strong reserves 1% decrease in NCOs to an annualized rate of 0.85% 14% decline in total NALs 206% ACL coverage of NALs, up from 187% in 4Q11 Solid capital 8.33% tangible common equity ratio, up 3 bps 10.15% Tier 1 common risk-based capital ratio up 15 bps 12.22% and 14.76% Tier 1 and Total risk-based capital ratios, up 11 and down 1 bps respectively 2012 First Quarter Highlights (cont.) Optimal Customer Relationship 19 |
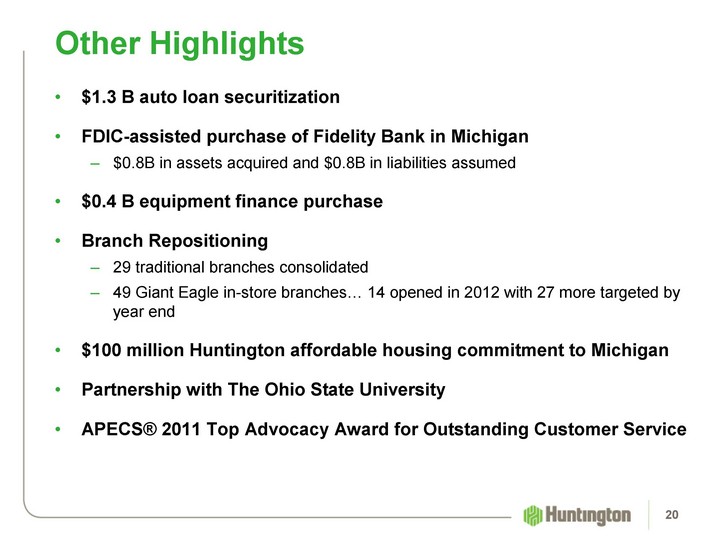
| $1.3 B auto loan securitization FDIC-assisted purchase of Fidelity Bank in Michigan $0.8B in assets acquired and $0.8B in liabilities assumed $0.4 B equipment finance purchase Branch Repositioning 29 traditional branches consolidated 49 Giant Eagle in-store branches... 14 opened in 2012 with 27 more targeted by year end $100 million Huntington affordable housing commitment to Michigan Partnership with The Ohio State University APECS(r) 2011 Top Advocacy Award for Outstanding Customer Service Other Highlights 20 |
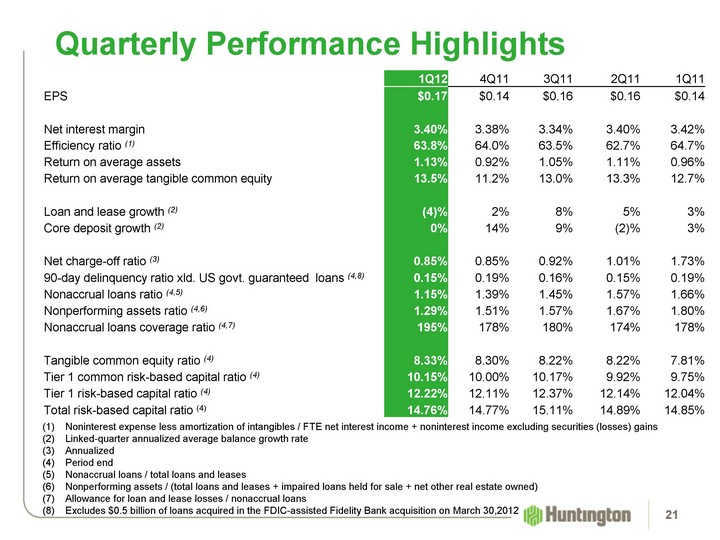
| Quarterly Performance Highlights 1Q12 4Q11 3Q11 2Q11 1Q11 EPS $0.17 $0.14 $0.16 $0.16 $0.14 Net interest margin 3.40% 3.38% 3.34% 3.40% 3.42% Efficiency ratio (1) 63.8% 64.0% 63.5% 62.7% 64.7% Return on average assets 1.13% 0.92% 1.05% 1.11% 0.96% Return on average tangible common equity 13.5% 11.2% 13.0% 13.3% 12.7% Loan and lease growth (2) (4)% 2% 8% 5% 3% Core deposit growth (2) 0% 14% 9% (2)% 3% Net charge-off ratio (3) 0.85% 0.85% 0.92% 1.01% 1.73% 90-day delinquency ratio xld. US govt. guaranteed loans (4,8) 0.15% 0.19% 0.16% 0.15% 0.19% Nonaccrual loans ratio (4,5) 1.15% 1.39% 1.45% 1.57% 1.66% Nonperforming assets ratio (4,6) 1.29% 1.51% 1.57% 1.67% 1.80% Nonaccrual loans coverage ratio (4,7) 195% 178% 180% 174% 178% Tangible common equity ratio (4) 8.33% 8.30% 8.22% 8.22% 7.81% Tier 1 common risk-based capital ratio (4) 10.15% 10.00% 10.17% 9.92% 9.75% Tier 1 risk-based capital ratio (4) 12.22% 12.11% 12.37% 12.14% 12.04% Total risk-based capital ratio (4) 14.76% 14.77% 15.11% 14.89% 14.85% (1) Noninterest expense less amortization of intangibles / FTE net interest income + noninterest income excluding securities (losses) gains Linked-quarter annualized average balance growth rate Annualized Period end Nonaccrual loans / total loans and leases Nonperforming assets / (total loans and leases + impaired loans held for sale + net other real estate owned) Allowance for loan and lease losses / nonaccrual loans Excludes $0.5 billion of loans acquired in the FDIC-assisted Fidelity Bank acquisition on March 30,2012 21 |
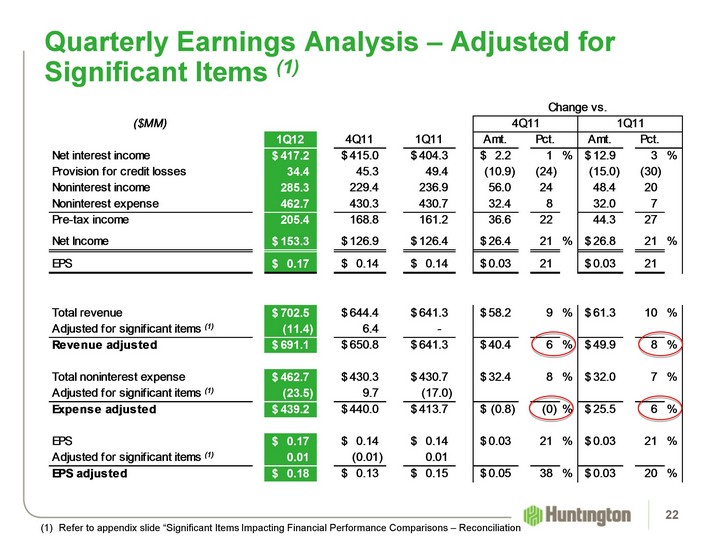
| Quarterly Earnings Analysis - Adjusted for Significant Items (1) 22 (1) Refer to appendix slide "Significant Items Impacting Financial Performance Comparisons - Reconciliation |
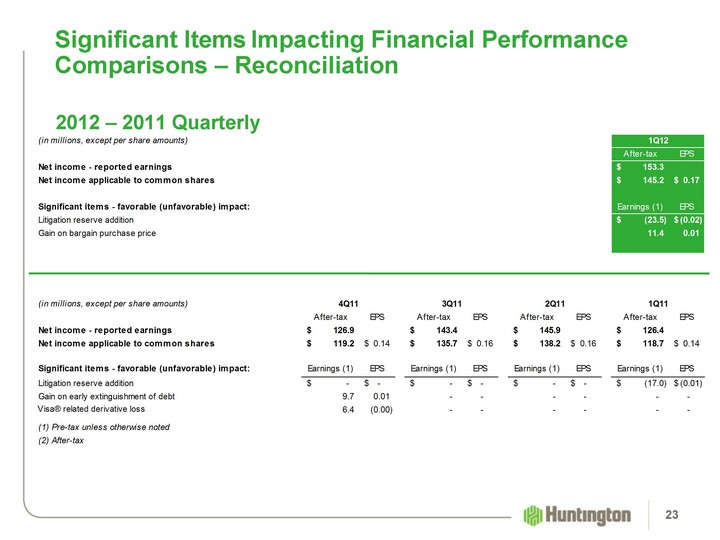
| Significant Items Impacting Financial Performance Comparisons - Reconciliation 2012 - 2011 Quarterly 23 |
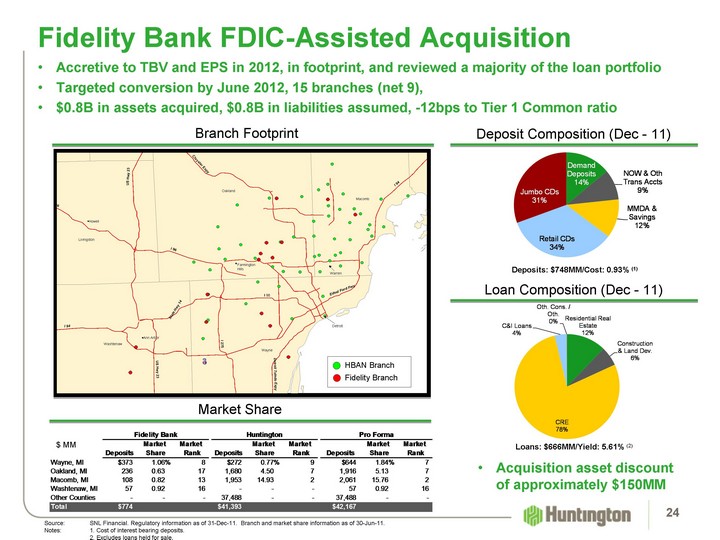
| 24 Fidelity Bank FDIC-Assisted Acquisition Deposit Composition (Dec - 11) Loan Composition (Dec - 11) Market Share Branch Footprint Loans: $666MM/Yield: 5.61% (2) Deposits: $748MM/Cost: 0.93% (1) Source: SNL Financial. Regulatory information as of 31-Dec-11. Branch and market share information as of 30-Jun-11. Notes: 1. Cost of interest bearing deposits. 2. Excludes loans held for sale. Henry and HBAN only Accretive to TBV and EPS in 2012, in footprint, and reviewed a majority of the loan portfolio Targeted conversion by June 2012, 15 branches (net 9), $0.8B in assets acquired, $0.8B in liabilities assumed, -12bps to Tier 1 Common ratio HBAN Branch Fidelity Branch Acquisition asset discount of approximately $150MM $ MM |

| Income Statement 25 |
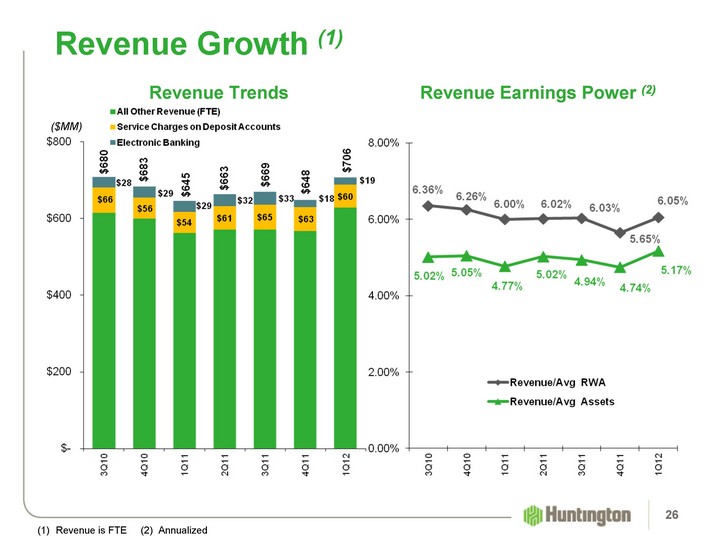
| Revenue Growth (1) ($MM) (1) Revenue is FTE (2) Annualized Revenue Earnings Power (2) Revenue Trends 26 |
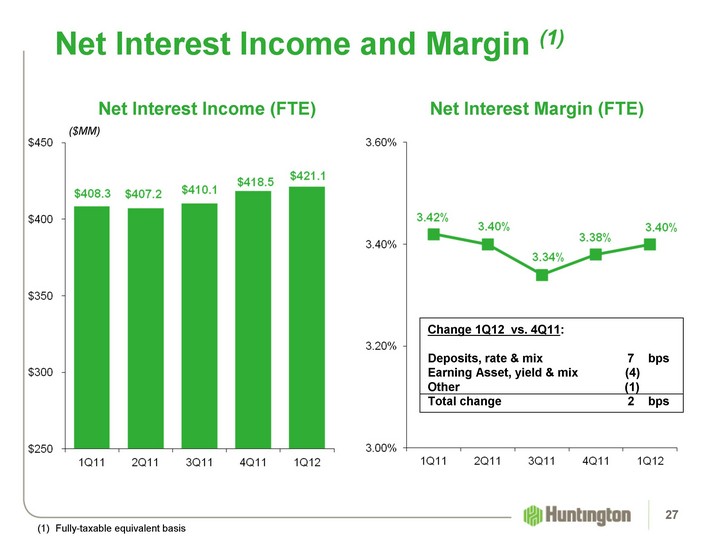
| Change 1Q12 vs. 4Q11: Deposits, rate & mix 7 bps Earning Asset, yield & mix (4) Other (1) Total change 2 bps Net Interest Income and Margin (1) ($MM) (1) Fully-taxable equivalent basis Net Interest Margin (FTE) Net Interest Income (FTE) 27 |
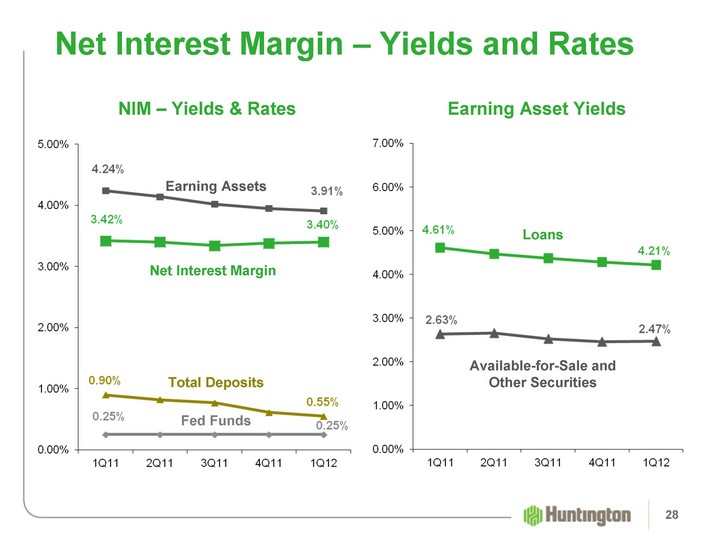
| Net Interest Margin - Yields and Rates Earning Assets Total Deposits Fed Funds Net Interest Margin Loans Available-for-Sale and Other Securities Earning Asset Yields NIM - Yields & Rates 28 |
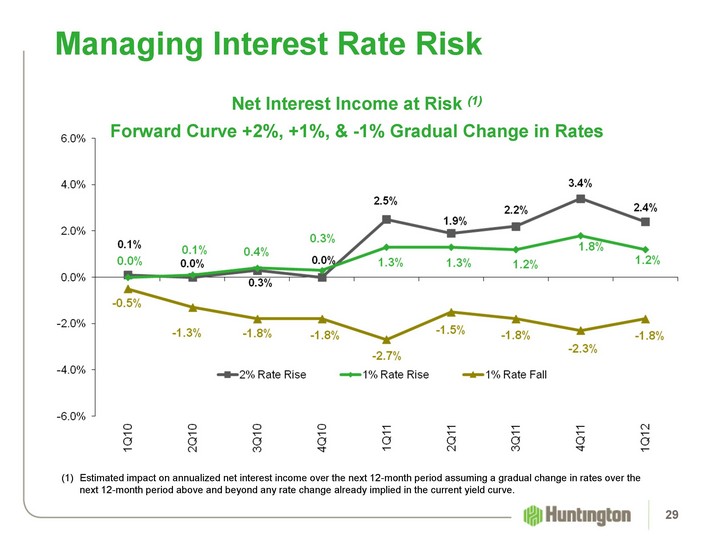
| Net Interest Income at Risk (1) Forward Curve +2%, +1%, & -1% Gradual Change in Rates Managing Interest Rate Risk Estimated impact on annualized net interest income over the next 12-month period assuming a gradual change in rates over the next 12-month period above and beyond any rate change already implied in the current yield curve. 29 |
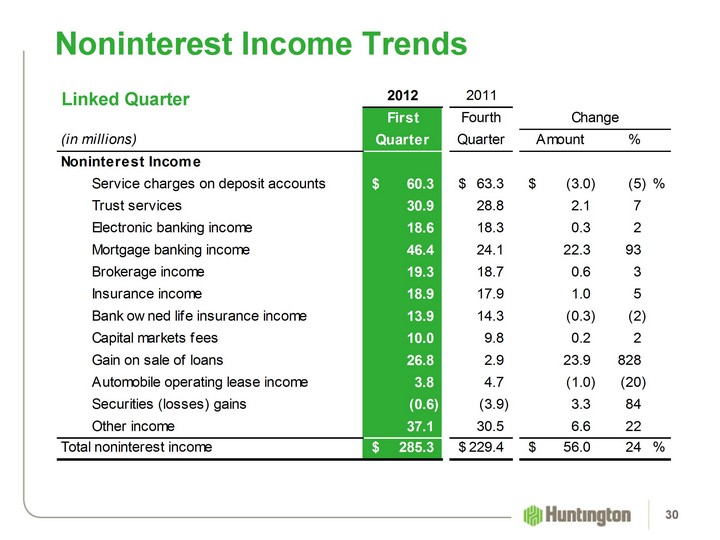
| Noninterest Income Trends Linked Quarter 30 |
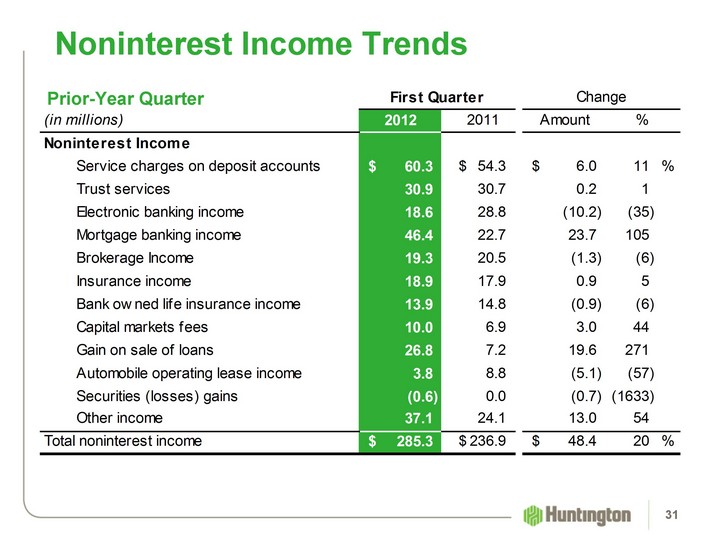
| Noninterest Income Trends Prior-Year Quarter 31 |
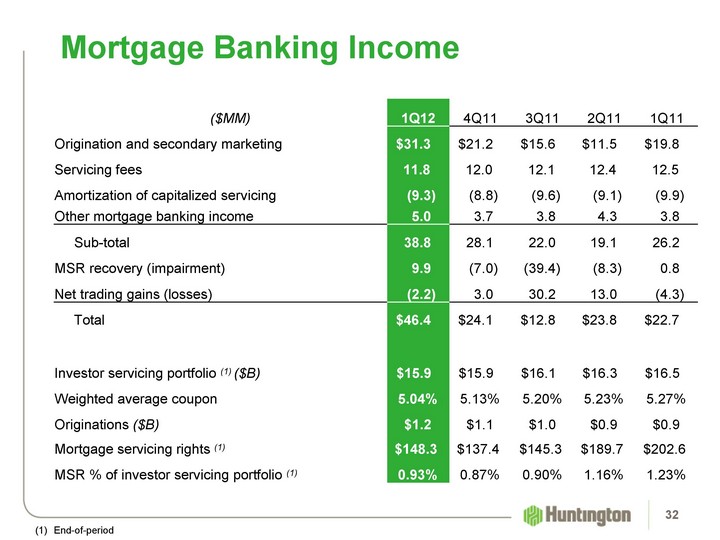
| Mortgage Banking Income ($MM) 1Q12 4Q11 3Q11 2Q11 1Q11 Origination and secondary marketing $31.3 $21.2 $15.6 $11.5 $19.8 Servicing fees 11.8 12.0 12.1 12.4 12.5 Amortization of capitalized servicing (9.3) (8.8) (9.6) (9.1) (9.9) Other mortgage banking income 5.0 3.7 3.8 4.3 3.8 Sub-total 38.8 28.1 22.0 19.1 26.2 MSR recovery (impairment) 9.9 (7.0) (39.4) (8.3) 0.8 Net trading gains (losses) (2.2) 3.0 30.2 13.0 (4.3) Total $46.4 $24.1 $12.8 $23.8 $22.7 Investor servicing portfolio (1) ($B) $15.9 $15.9 $16.1 $16.3 $16.5 Weighted average coupon 5.04% 5.13% 5.20% 5.23% 5.27% Originations ($B) $1.2 $1.1 $1.0 $0.9 $0.9 Mortgage servicing rights (1) $148.3 $137.4 $145.3 $189.7 $202.6 MSR % of investor servicing portfolio (1) 0.93% 0.87% 0.90% 1.16% 1.23% (1) End-of-period 32 |
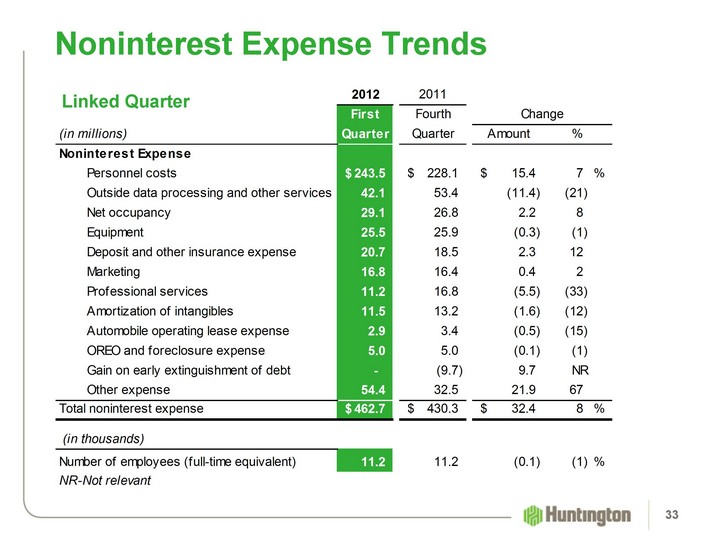
| Noninterest Expense Trends Linked Quarter 33 |
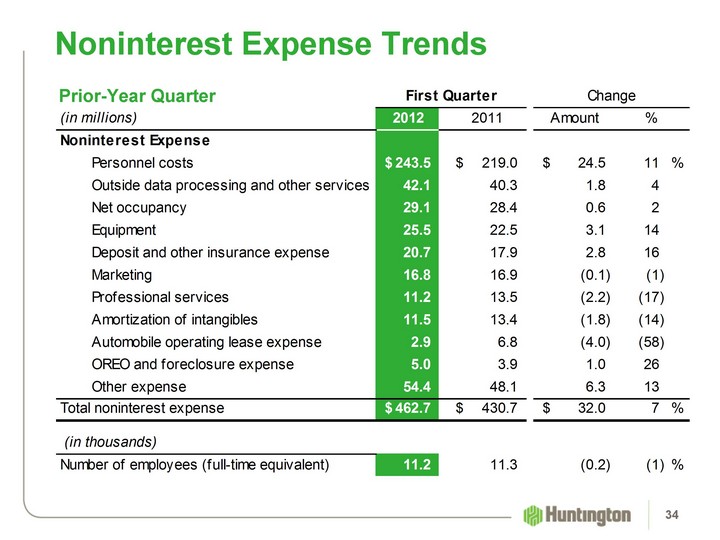
| Noninterest Expense Trends Prior-Year Quarter 34 |

| Balance Sheet 35 |
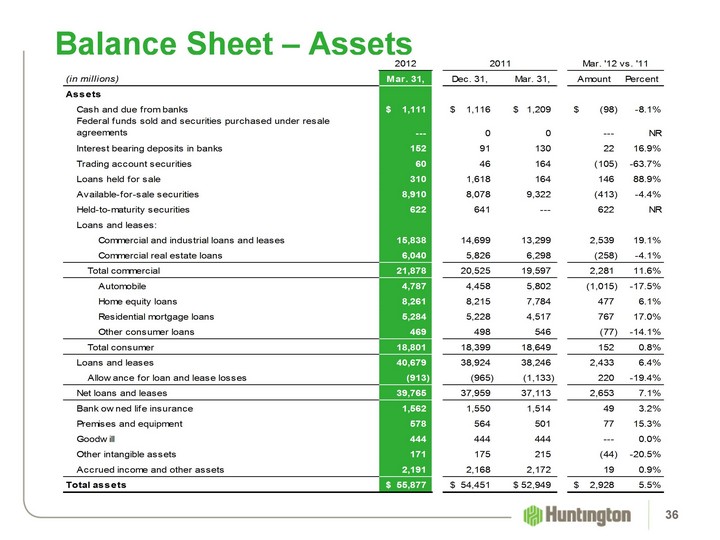
| Balance Sheet - Assets 36 |
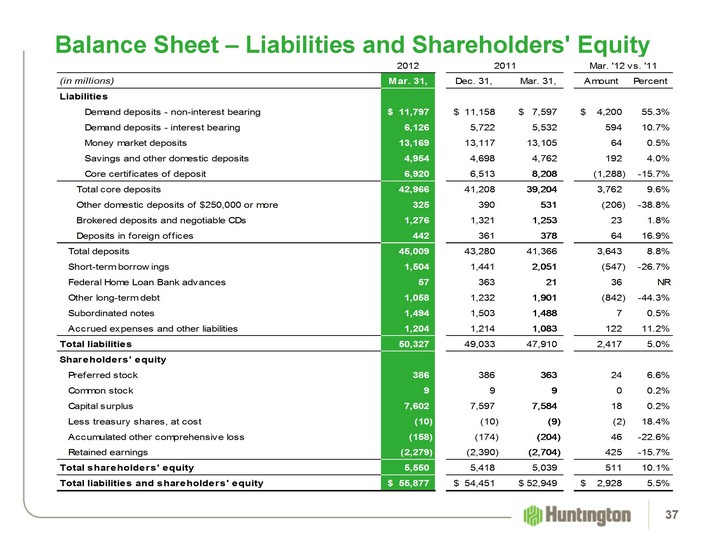
| Balance Sheet - Liabilities and Shareholders' Equity 37 |
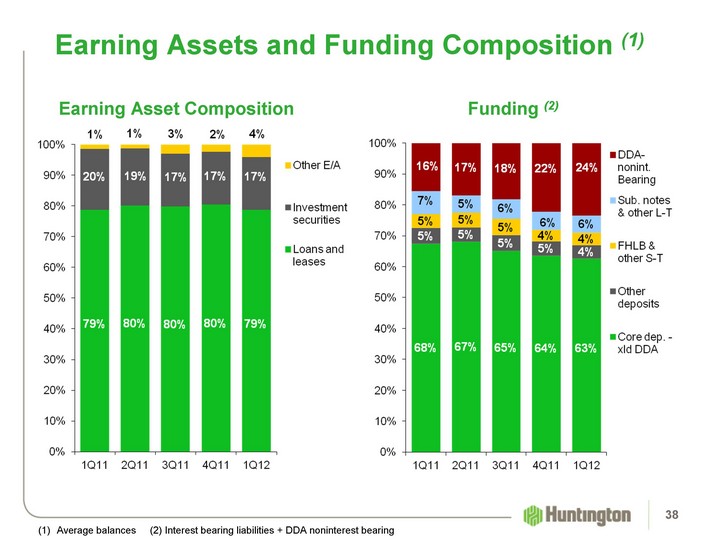
| Earning Assets and Funding Composition (1) (1) Average balances (2) Interest bearing liabilities + DDA noninterest bearing Funding (2) Earning Asset Composition 38 |

| Investment Securities 39 |
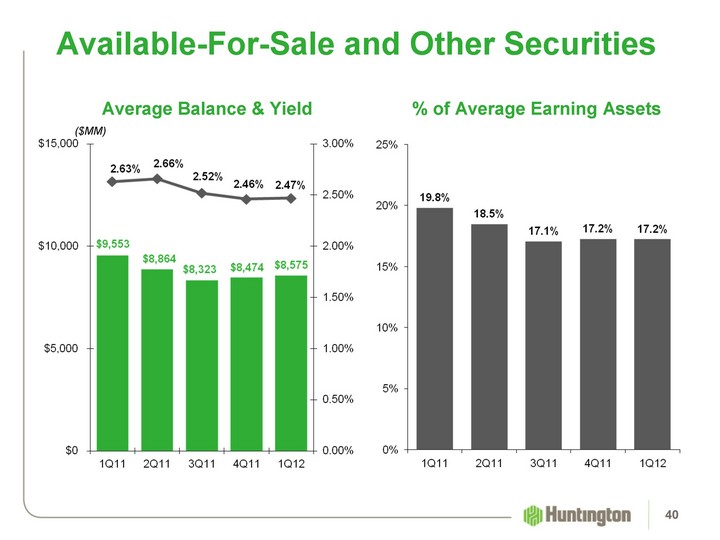
| Available-For-Sale and Other Securities ($MM) % of Average Earning Assets Average Balance & Yield 40 |
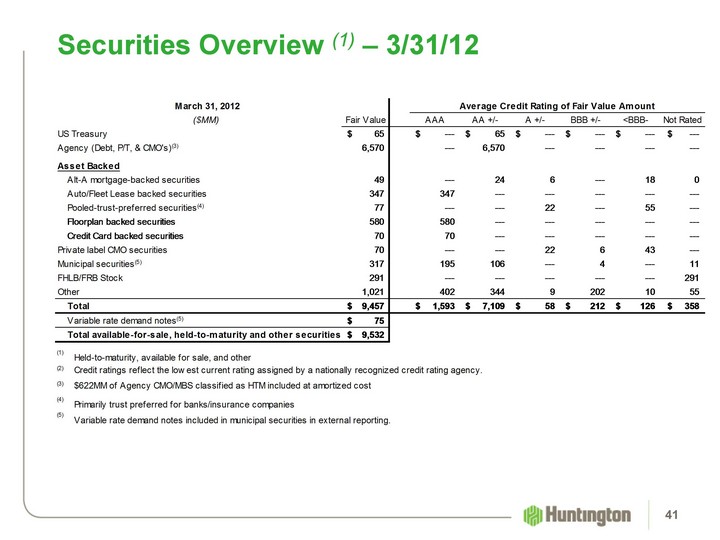
| Securities Overview (1) - 3/31/12 41 |
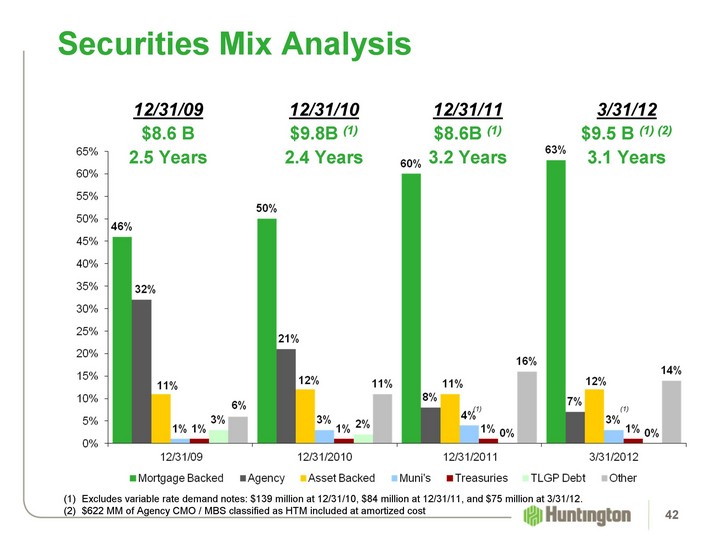
| Securities Mix Analysis 12/31/11 $8.6B (1) 3.2 Years 12/31/09 $8.6 B 2.5 Years 12/31/10 $9.8B (1) 2.4 Years Excludes variable rate demand notes: $139 million at 12/31/10, $84 million at 12/31/11, and $75 million at 3/31/12. $622 MM of Agency CMO / MBS classified as HTM included at amortized cost (1) 3/31/12 $9.5 B (1) (2) 3.1 Years 42 (1) |
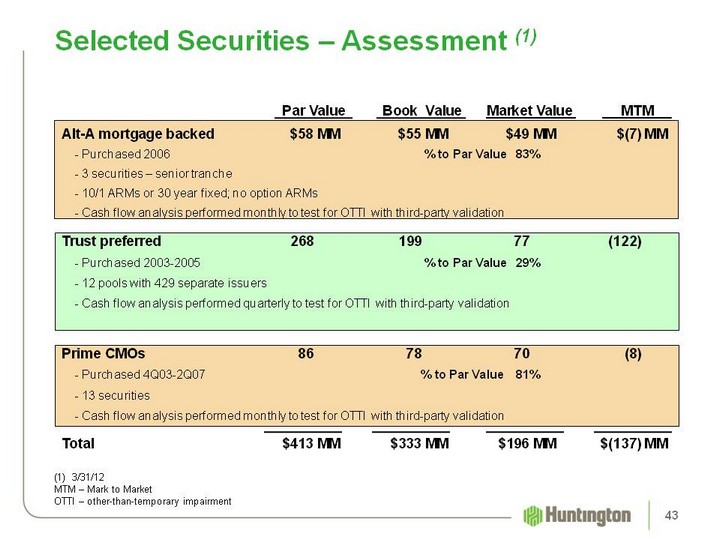
| Selected Securities - Assessment (1) Par Value Book Value Market Value MTM Alt-A mortgage backed $58 MM $55 MM $49 MM $(7) MM - Purchased 2006 % to Par Value 83% - 3 securities - senior tranche - 10/1 ARMs or 30 year fixed; no option ARMs - Cash flow analysis performed monthly to test for OTTI with third-party validation Trust preferred 268 199 77 (122) - Purchased 2003-2005 % to Par Value 29% - 12 pools with 429 separate issuers - Cash flow analysis performed quarterly to test for OTTI with third-party validation Prime CMOs 86 78 70 (8) - Purchased 4Q03-2Q07 % to Par Value 81% - 13 securities - Cash flow analysis performed monthly to test for OTTI with third-party validation Total $413 MM $333 MM $196 MM $(137) MM 3/31/12 MTM - Mark to Market OTTI - other-than-temporary impairment 43 |

| Loan Portfolio Overview 44 |
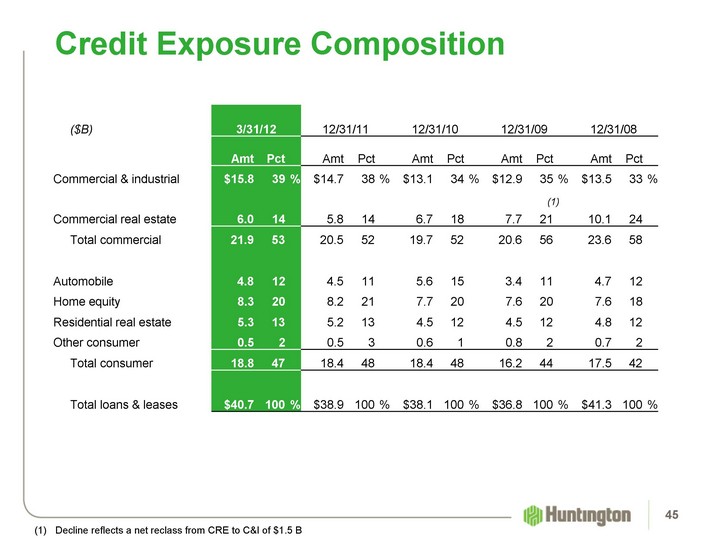
| ($B) 3/31/12 3/31/12 3/31/12 12/31/11 12/31/11 12/31/11 12/31/10 12/31/10 12/31/10 12/31/09 12/31/09 12/31/09 12/31/08 12/31/08 12/31/08 Amt Pct Amt Pct Amt Pct Amt Pct Amt Pct Commercial & industrial $15.8 39 % $14.7 38 % $13.1 34 % $12.9 35 % $13.5 33 % Commercial real estate 6.0 14 5.8 14 6.7 18 7.7 21 10.1 24 Total commercial 21.9 53 20.5 52 19.7 52 20.6 56 23.6 58 Automobile 4.8 12 4.5 11 5.6 15 3.4 11 4.7 12 Home equity 8.3 20 8.2 21 7.7 20 7.6 20 7.6 18 Residential real estate 5.3 13 5.2 13 4.5 12 4.5 12 4.8 12 Other consumer 0.5 2 0.5 3 0.6 1 0.8 2 0.7 2 Total consumer 18.8 47 18.4 48 18.4 48 16.2 44 17.5 42 Total loans & leases $40.7 100 % $38.9 100 % $38.1 100 % $36.8 100 % $41.3 100 % Credit Exposure Composition (1) 45 (1) Decline reflects a net reclass from CRE to C&I of $1.5 B |
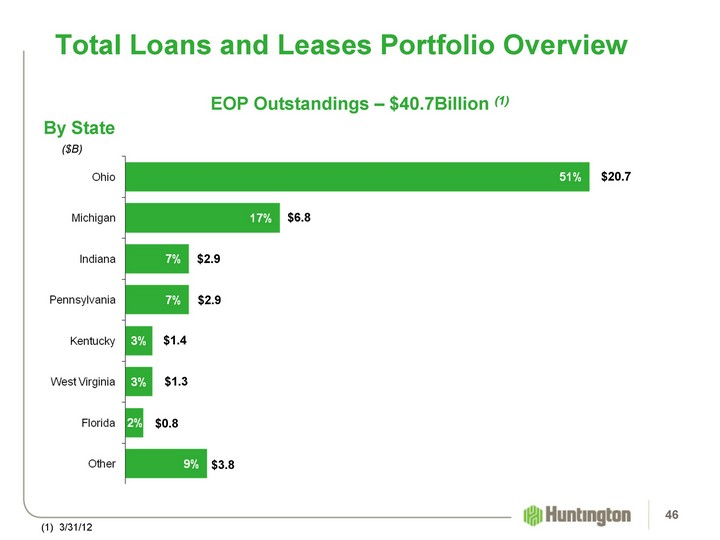
| Total Loans and Leases Portfolio Overview ($B) $20.7 $6.8 $2.9 $1.3 $2.9 $1.4 $0.8 $3.8 EOP Outstandings - $40.7Billion (1) (1) 3/31/12 By State 46 |
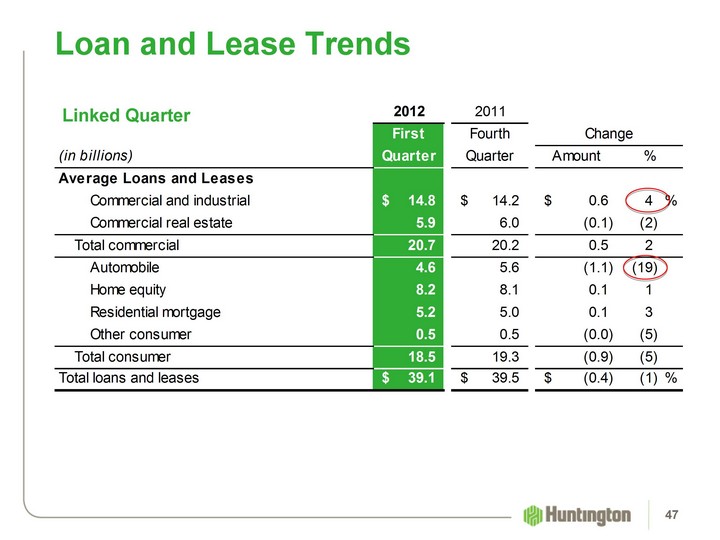
| Linked Quarter Loan and Lease Trends 47 |
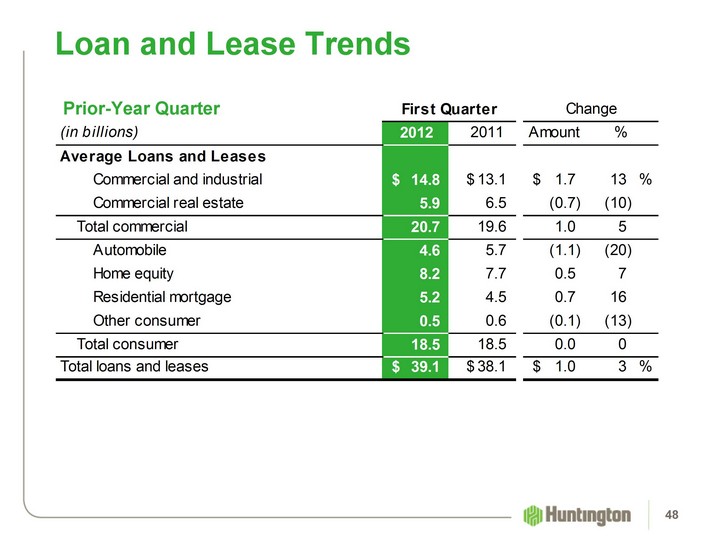
| Loan and Lease Trends 48 Prior-Year Quarter |
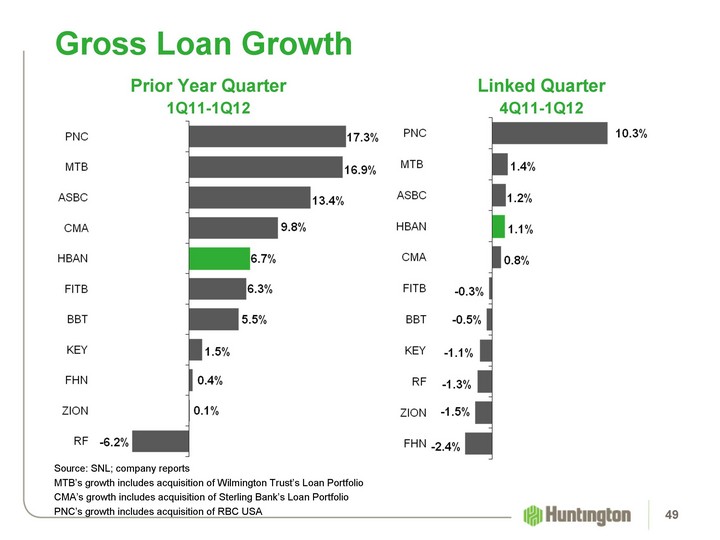
| Gross Loan Growth Source: SNL; company reports MTB's growth includes acquisition of Wilmington Trust's Loan Portfolio CMA's growth includes acquisition of Sterling Bank's Loan Portfolio PNC's growth includes acquisition of RBC USA Prior Year Quarter 1Q11-1Q12 Linked Quarter 4Q11-1Q12 49 |

| Total Commercial Loans 50 |
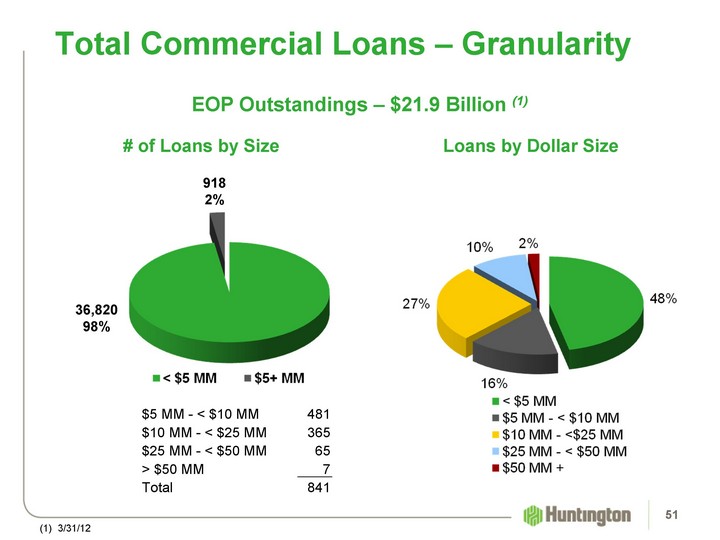
| Total Commercial Loans - Granularity EOP Outstandings - $21.9 Billion (1) 918 2% 36,820 98% (1) 3/31/12 Loans by Dollar Size # of Loans by Size $5 MM - < $10 MM 481 $10 MM - < $25 MM 365 $25 MM - < $50 MM 65 > $50 MM 7 Total 841 51 |
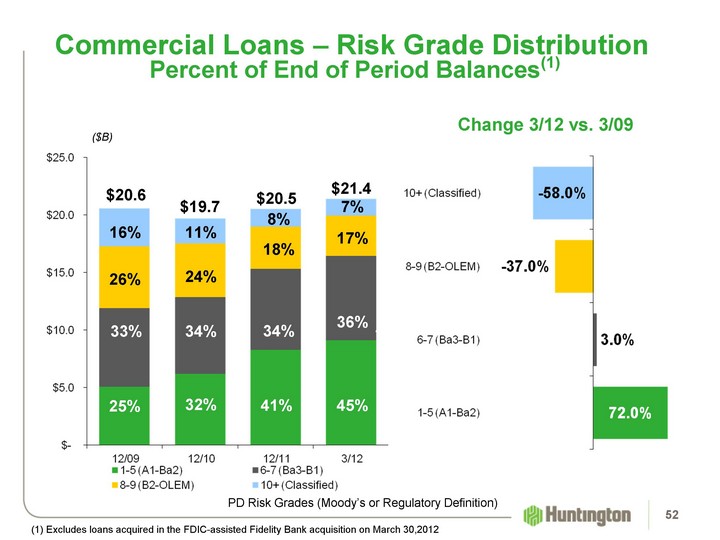
| Commercial Loans - Risk Grade Distribution PD Risk Grades (Moody's or Regulatory Definition) Percent of End of Period Balances(1) ($B) $20.6 $19.7 26% 11% 16% 33% 25% 8% $20.5 15% 7% $21.4 52 24% 34% 32% 18% 34% 41% 17% 36% 45% Change 3/12 vs. 3/09 (1) Excludes loans acquired in the FDIC-assisted Fidelity Bank acquisition on March 30,2012 |
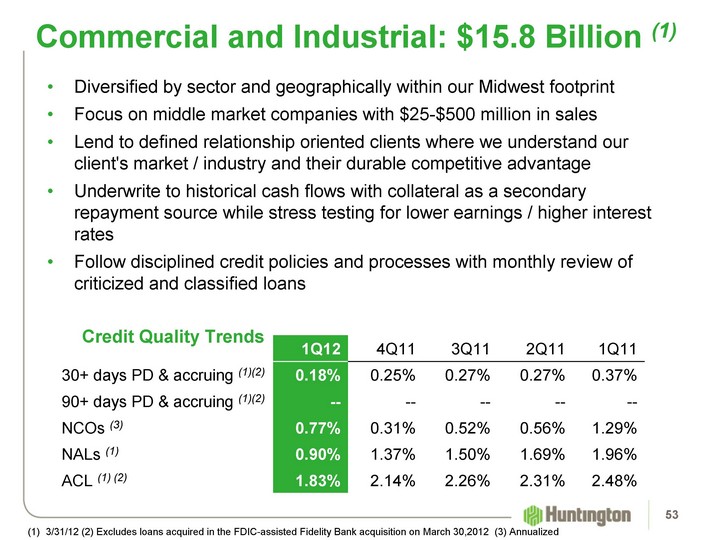
| Diversified by sector and geographically within our Midwest footprint Focus on middle market companies with $25-$500 million in sales Lend to defined relationship oriented clients where we understand our client's market / industry and their durable competitive advantage Underwrite to historical cash flows with collateral as a secondary repayment source while stress testing for lower earnings / higher interest rates Follow disciplined credit policies and processes with monthly review of criticized and classified loans Credit Quality Trends Commercial and Industrial: $15.8 Billion (1) 3/31/12 (2) Excludes loans acquired in the FDIC-assisted Fidelity Bank acquisition on March 30,2012 (3) Annualized 1Q12 4Q11 3Q11 2Q11 1Q11 30+ days PD & accruing (1)(2) 0.18% 0.25% 0.27% 0.27% 0.37% 90+ days PD & accruing (1)(2) -- -- -- -- -- NCOs (3) 0.77% 0.31% 0.52% 0.56% 1.29% NALs (1) 0.90% 1.37% 1.50% 1.69% 1.96% ACL (1) (2) 1.83% 2.14% 2.26% 2.31% 2.48% 53 |
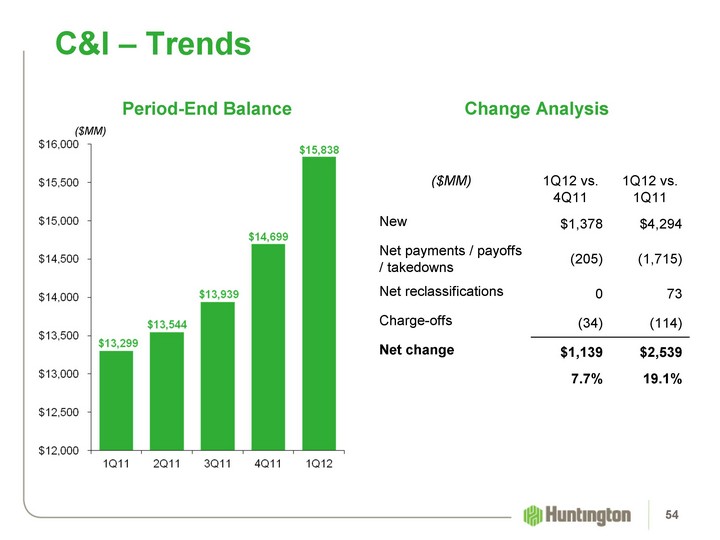
| C&I - Trends ($MM) Change Analysis Period-End Balance ($MM) 1Q12 vs. 4Q11 1Q12 vs. 1Q11 New $1,378 $4,294 Net payments / payoffs / takedowns (205) (1,715) Net reclassifications 0 73 Charge-offs (34) (114) Net change $1,139 $2,539 7.7% 19.1% 54 |
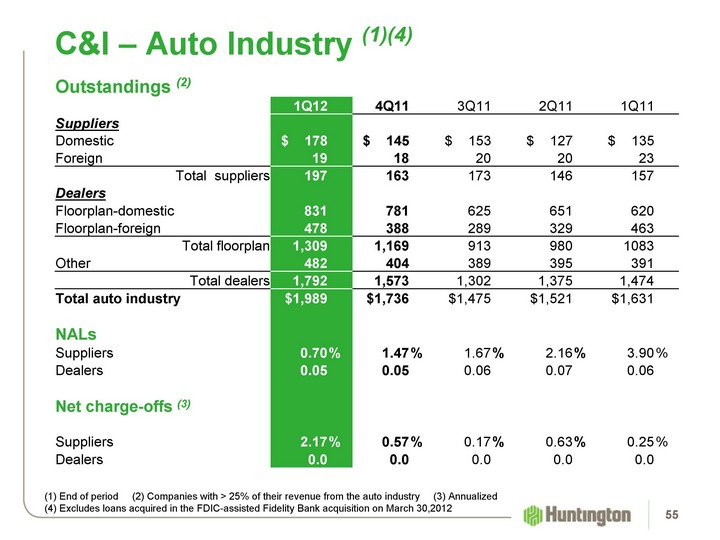
| C&I - Auto Industry (1)(4) Outstandings (2) 1Q12 4Q11 3Q11 2Q11 1Q11 Suppliers Domestic $ 178 $ 145 $ 153 $ 127 $ 135 Foreign 19 18 20 20 23 Total suppliers 197 163 173 146 157 Dealers Floorplan-domestic 831 781 625 651 620 Floorplan-foreign 478 388 289 329 463 Total floorplan 1,309 1,169 913 980 1083 Other 482 404 389 395 391 Total dealers 1,792 1,573 1,302 1,375 1,474 Total auto industry $1,989 $1,736 $1,475 $1,521 $1,631 NALs Suppliers 0.70 % 1.47 % 1.67 % 2.16 % 3.90 % Dealers 0.05 0.05 0.06 0.07 0.06 Net charge-offs (3) Suppliers 2.17 % 0.57 % 0.17 % 0.63 % 0.25 %% Dealers 0.0 0.0 0.0 0.0 0.0 (1) End of period (2) Companies with > 25% of their revenue from the auto industry (3) Annualized (4) Excludes loans acquired in the FDIC-assisted Fidelity Bank acquisition on March 30,2012 55 |
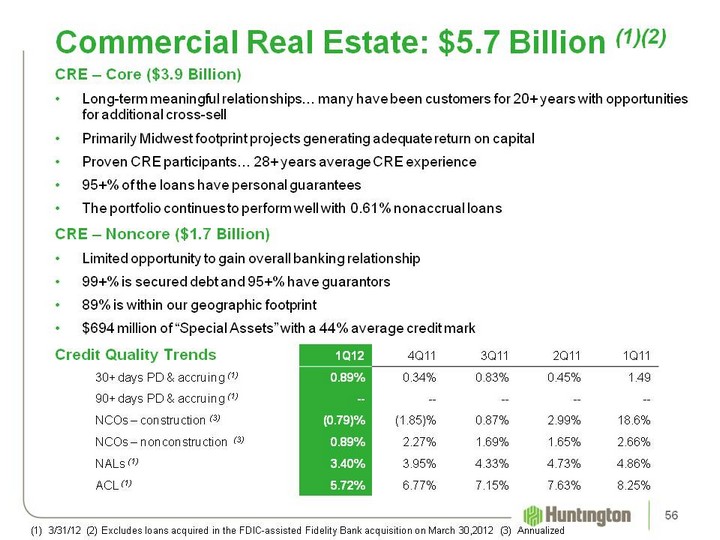
| Commercial Real Estate: $5.7 Billion (1)(2) CRE - Core ($3.9 Billion) Long-term meaningful relationships... many have been customers for 20+ years with opportunities for additional cross-sell Primarily Midwest footprint projects generating adequate return on capital Proven CRE participants... 28+ years average CRE experience 95+% of the loans have personal guarantees The portfolio continues to perform well with 0.61% nonaccrual loans CRE - Noncore ($1.7 Billion) Limited opportunity to gain overall banking relationship 99+% is secured debt and 95+% have guarantors 89% is within our geographic footprint $694 million of "Special Assets" with a 44% average credit mark Credit Quality Trends 1Q12 4Q11 3Q11 2Q11 1Q11 30+ days PD & accruing (1) 0.89% 0.34% 0.83% 0.45% 1.49 90+ days PD & accruing (1) -- -- -- -- -- NCOs - construction (3) (0.79)% (1.85)% 0.87% 2.99% 18.6% NCOs - nonconstruction (3) 0.89% 2.27% 1.69% 1.65% 2.66% NALs (1) 3.40% 3.95% 4.33% 4.73% 4.86% ACL (1) 5.72% 6.77% 7.15% 7.63% 8.25% 56 3/31/12 (2) Excludes loans acquired in the FDIC-assisted Fidelity Bank acquisition on March 30,2012 (3) Annualized |
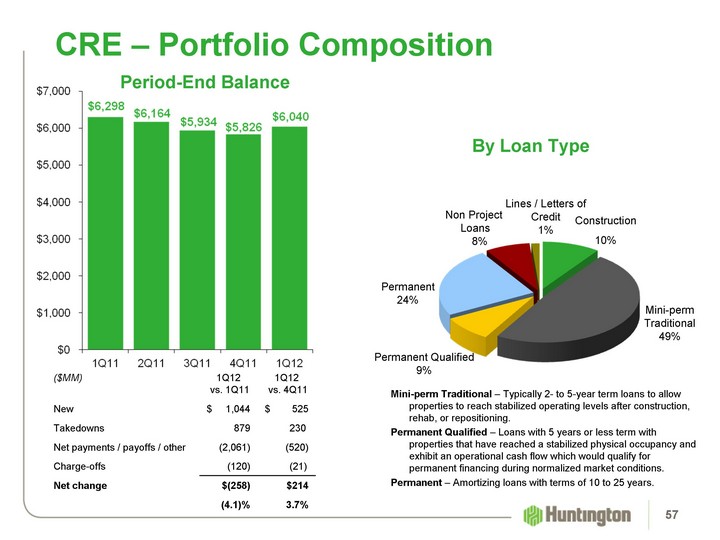
| CRE - Portfolio Composition Permanent 24% Mini-perm Traditional 49% Construction 10% Non Project Loans 8% Lines / Letters of Credit 1% Permanent Qualified 9% Mini-perm Traditional - Typically 2- to 5-year term loans to allow properties to reach stabilized operating levels after construction, rehab, or repositioning. Permanent Qualified - Loans with 5 years or less term with properties that have reached a stabilized physical occupancy and exhibit an operational cash flow which would qualify for permanent financing during normalized market conditions. Permanent - Amortizing loans with terms of 10 to 25 years. By Loan Type 57 Period-End Balance ($MM) 1Q12 vs. 1Q11 1Q12 vs. 4Q11 New $ 1,044 $ 525 Takedowns 879 230 Net payments / payoffs / other (2,061) (520) Charge-offs (120) (21) Net change $(258) $214 (4.1)% 3.7% |
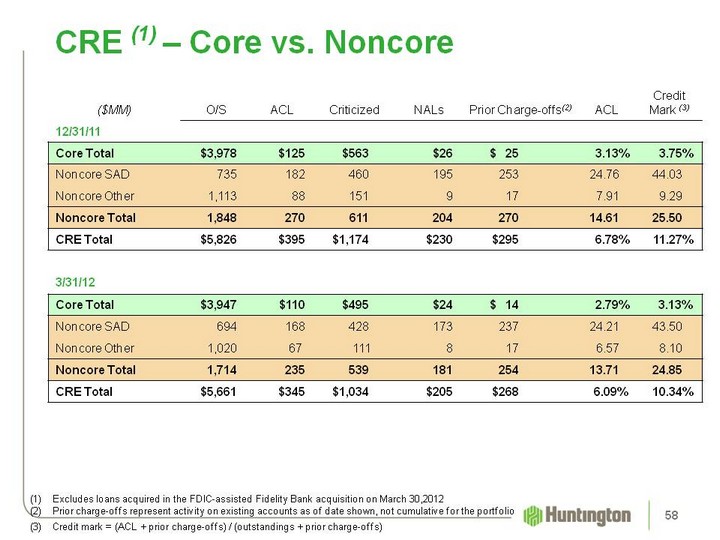
| CRE (1) - Core vs. Noncore ($MM) O/S ACL Criticized NALs Prior Charge-offs(2) ACL Credit Mark (3) 12/31/11 Core Total $3,978 $125 $563 $26 $ 25 3.13% 3.75% Noncore SAD 735 182 460 195 253 24.76 44.03 Noncore Other 1,113 88 151 9 17 7.91 9.29 Noncore Total 1,848 270 611 204 270 14.61 25.50 CRE Total $5,826 $395 $1,174 $230 $295 6.78% 11.27% 3/31/12 Core Total $3,947 $110 $495 $24 $ 14 2.79% 3.13% Noncore SAD 694 168 428 173 237 24.21 43.50 Noncore Other 1,020 67 111 8 17 6.57 8.10 Noncore Total 1,714 235 539 181 254 13.71 24.85 CRE Total $5,661 $345 $1,034 $205 $268 6.09% 10.34% (1) Excludes loans acquired in the FDIC-assisted Fidelity Bank acquisition on March 30,2012 (2) Prior charge-offs represent activity on existing accounts as of date shown, not cumulative for the portfolio (3) Credit mark = (ACL + prior charge-offs) / (outstandings + prior charge-offs) 58 |
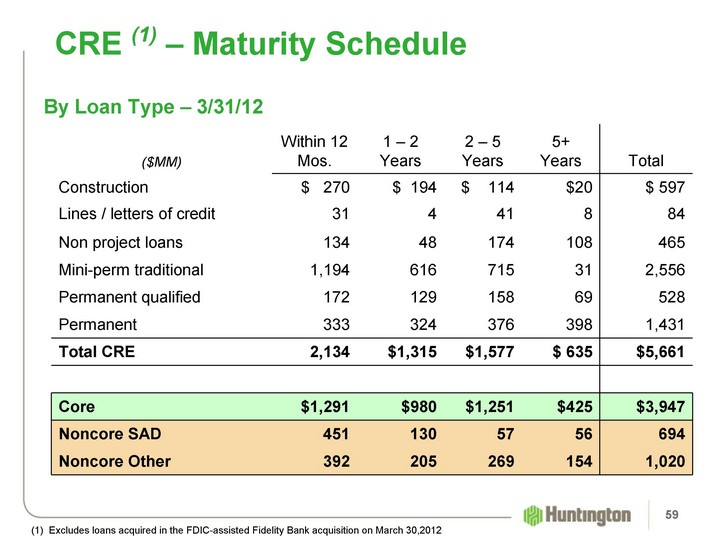
| CRE (1) - Maturity Schedule By Loan Type - 3/31/12 ($MM) Within 12 Mos. 1 - 2 Years 2 - 5 Years 5+ Years Total Construction $ 270 $ 194 $ 114 $20 $ 597 Lines / letters of credit 31 4 41 8 84 Non project loans 134 48 174 108 465 Mini-perm traditional 1,194 616 715 31 2,556 Permanent qualified 172 129 158 69 528 Permanent 333 324 376 398 1,431 Total CRE 2,134 $1,315 $1,577 $ 635 $5,661 Core $1,291 $980 $1,251 $425 $3,947 Noncore SAD 451 130 57 56 694 Noncore Other 392 205 269 154 1,020 59 (1) Excludes loans acquired in the FDIC-assisted Fidelity Bank acquisition on March 30,2012 |

| Total Consumer Loans and Leases 60 |
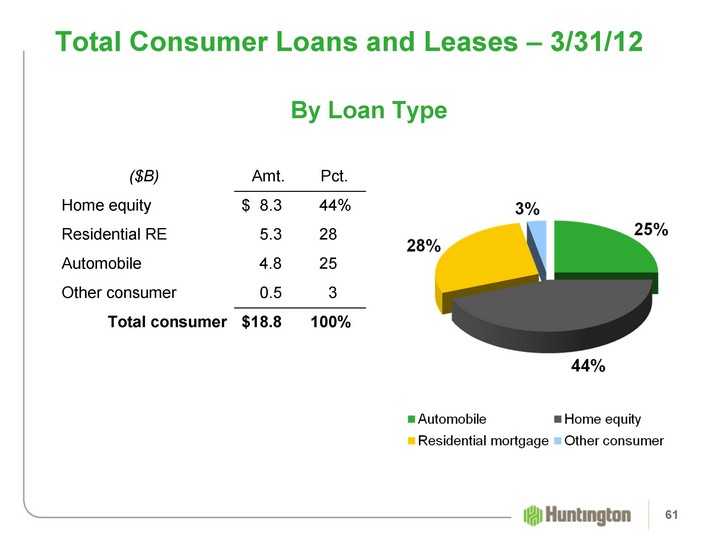
| Total Consumer Loans and Leases - 3/31/12 ($B) Amt. Pct. Home equity $ 8.3 44% Residential RE 5.3 28 Automobile 4.8 25 Other consumer 0.5 3 Total consumer $18.8 100% By Loan Type 61 |
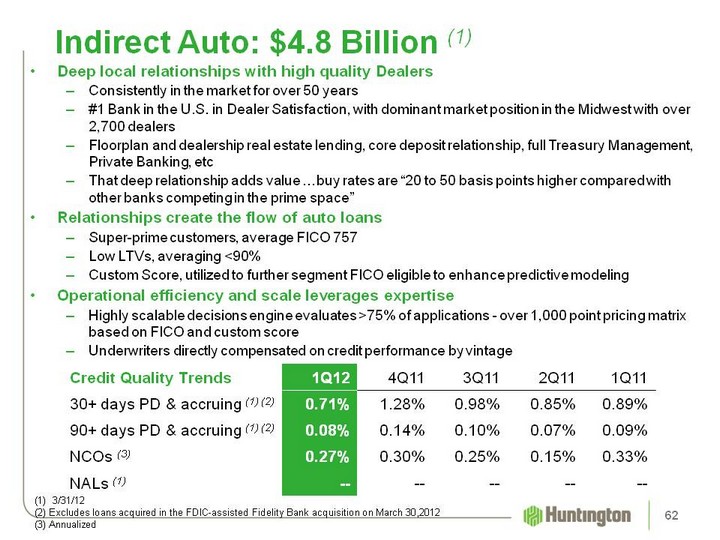
| Deep local relationships with high quality Dealers Consistently in the market for over 50 years #1 Bank in the U.S. in Dealer Satisfaction, with dominant market position in the Midwest with over 2,700 dealers Floorplan and dealership real estate lending, core deposit relationship, full Treasury Management, Private Banking, etc That deep relationship adds value ...buy rates are "20 to 50 basis points higher compared with other banks competing in the prime space" Relationships create the flow of auto loans Super-prime customers, average FICO 757 Low LTVs, averaging <90% Custom Score, utilized to further segment FICO eligible to enhance predictive modeling Operational efficiency and scale leverages expertise Highly scalable decisions engine evaluates >75% of applications - over 1,000 point pricing matrix based on FICO and custom score Underwriters directly compensated on credit performance by vintage Indirect Auto: $4.8 Billion (1) Credit Quality Trends 1Q12 4Q11 3Q11 2Q11 1Q11 30+ days PD & accruing (1) (2) 0.71% 1.28% 0.98% 0.85% 0.89% 90+ days PD & accruing (1) (2) 0.08% 0.14% 0.10% 0.07% 0.09% NCOs (3) 0.27% 0.30% 0.25% 0.15% 0.33% NALs (1) -- -- -- -- -- 62 3/31/12 (2) Excludes loans acquired in the FDIC-assisted Fidelity Bank acquisition on March 30,2012 (3) Annualized |
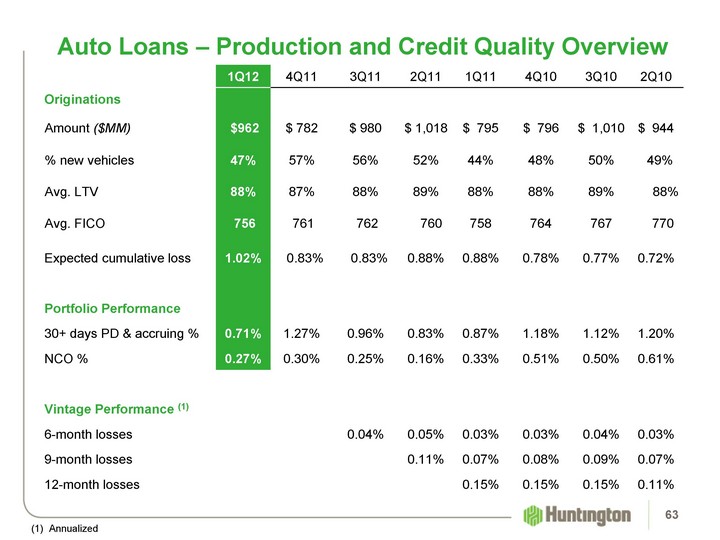
| Auto Loans - Production and Credit Quality Overview 1Q12 1Q12 4Q11 3Q11 2Q11 1Q11 4Q10 3Q10 2Q10 Originations Amount ($MM) $962 $962 $ 782 $ 980 $ 1,018 $ 795 $ 796 $ 1,010 $ 944 % new vehicles 47% 47% 57% 56% 52% 44% 48% 50% 49% Avg. LTV 88% 88% 87% 88% 89% 88% 88% 89% 88% Avg. FICO 756 756 761 762 760 758 764 767 770 Expected cumulative loss 1.02% 1.02% 0.83% 0.83% 0.88% 0.88% 0.78% 0.77% 0.72% Portfolio Performance 30+ days PD & accruing % 0.71% 0.71% 1.27% 0.96% 0.83% 0.87% 1.18% 1.12% 1.20% NCO % 0.27% 0.27% 0.30% 0.25% 0.16% 0.33% 0.51% 0.50% 0.61% Vintage Performance (1) Vintage Performance (1) Vintage Performance (1) 6-month losses 6-month losses 0.04% 0.05% 0.03% 0.03% 0.04% 0.03% 9-month losses 9-month losses 0.11% 0.07% 0.08% 0.09% 0.07% 12-month losses 12-month losses 0.15% 0.15% 0.15% 0.11% (1) Annualized 63 |
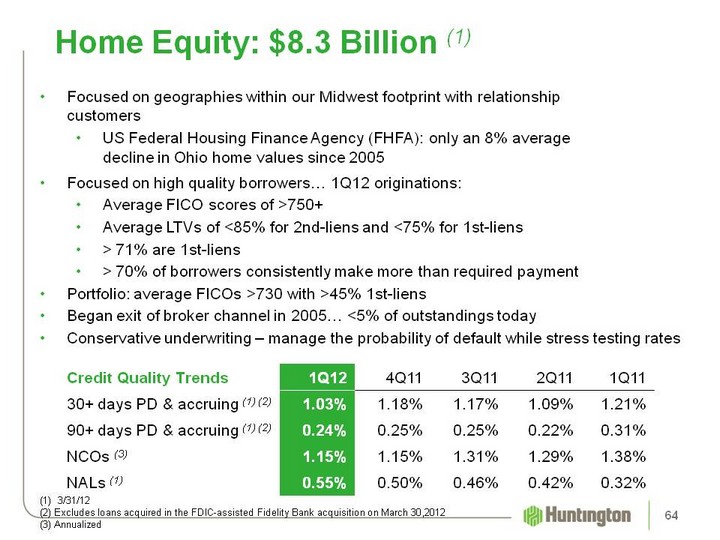
| Home Equity: $8.3 Billion (1) Focused on geographies within our Midwest footprint with relationship customers US Federal Housing Finance Agency (FHFA): only an 8% average decline in Ohio home values since 2005 Credit Quality Trends 1Q12 4Q11 3Q11 2Q11 1Q11 30+ days PD & accruing (1) (2) 1.03% 1.18% 1.17% 1.09% 1.21% 90+ days PD & accruing (1) (2) 0.24% 0.25% 0.25% 0.22% 0.31% NCOs (3) 1.15% 1.15% 1.31% 1.29% 1.38% NALs (1) 0.55% 0.50% 0.46% 0.42% 0.32% 64 3/31/12 (2) Excludes loans acquired in the FDIC-assisted Fidelity Bank acquisition on March 30,2012 (3) Annualized Focused on high quality borrowers... 1Q12 originations: Average FICO scores of >750+ Average LTVs of <85% for 2nd-liens and <75% for 1st-liens > 71% are 1st-liens > 70% of borrowers consistently make more than required payment Portfolio: average FICOs >730 with >45% 1st-liens Began exit of broker channel in 2005... <5% of outstandings today Conservative underwriting - manage the probability of default while stress testing rates |
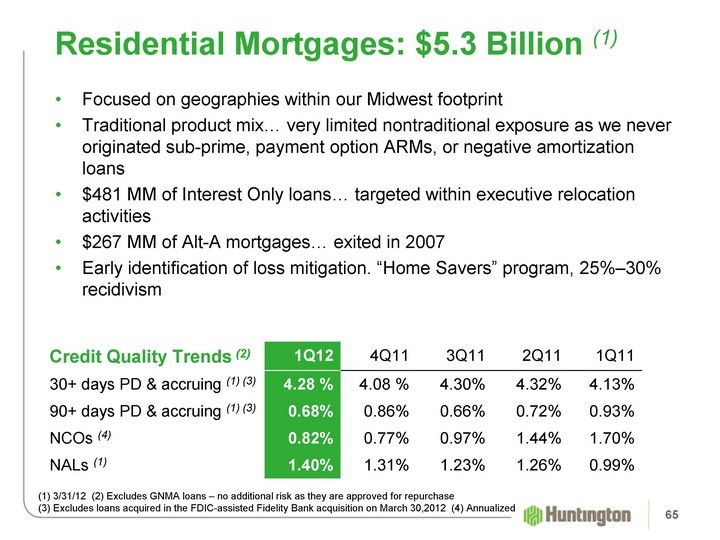
| Focused on geographies within our Midwest footprint Traditional product mix... very limited nontraditional exposure as we never originated sub-prime, payment option ARMs, or negative amortization loans $481 MM of Interest Only loans... targeted within executive relocation activities $267 MM of Alt-A mortgages... exited in 2007 Early identification of loss mitigation. "Home Savers" program, 25%-30% recidivism Credit Quality Trends (2) 1Q12 4Q11 3Q11 2Q11 1Q11 30+ days PD & accruing (1) (3) 4.28 % 4.08 % 4.30% 4.32% 4.13% 90+ days PD & accruing (1) (3) 0.68% 0.86% 0.66% 0.72% 0.93% NCOs (4) 0.82% 0.77% 0.97% 1.44% 1.70% NALs (1) 1.40% 1.31% 1.23% 1.26% 0.99% Residential Mortgages: $5.3 Billion (1) 65 (1) 3/31/12 (2) Excludes GNMA loans - no additional risk as they are approved for repurchase (3) Excludes loans acquired in the FDIC-assisted Fidelity Bank acquisition on March 30,2012 (4) Annualized |
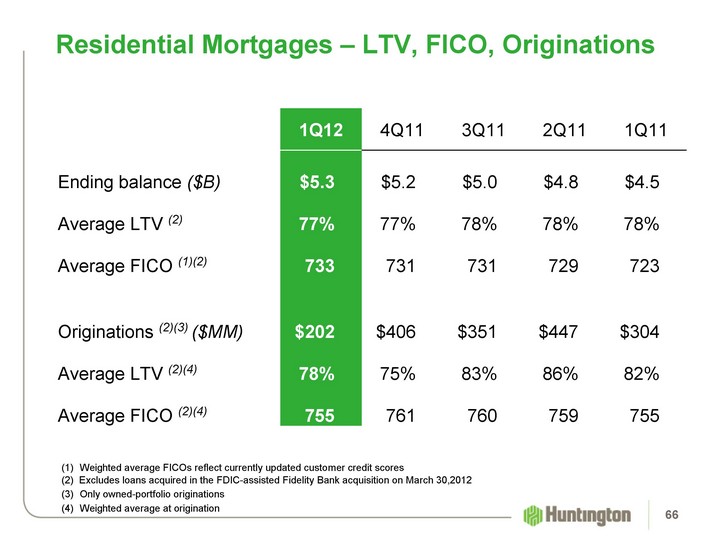
| Residential Mortgages - LTV, FICO, Originations Weighted average FICOs reflect currently updated customer credit scores (2) Excludes loans acquired in the FDIC-assisted Fidelity Bank acquisition on March 30,2012 Only owned-portfolio originations Weighted average at origination 1Q12 4Q11 3Q11 2Q11 1Q11 Ending balance ($B) $5.3 $5.2 $5.0 $4.8 $4.5 Average LTV (2) 77% 77% 78% 78% 78% Average FICO (1)(2) 733 731 731 729 723 Originations (2)(3) ($MM) $202 $406 $351 $447 $304 Average LTV (2)(4) 78% 75% 83% 86% 82% Average FICO (2)(4) 755 761 760 759 755 66 |
| Other Consumer loans EOP Outstandings - $0.5 Billion (1) Collateralized Autos, untitled vehicles, small boats, mobile homes and other miscellaneous Primarily for existing customers Performed within expectations over the past year, though varies by collateral type (1) 3/31/12 67 |

| Credit Quality Review 68 |
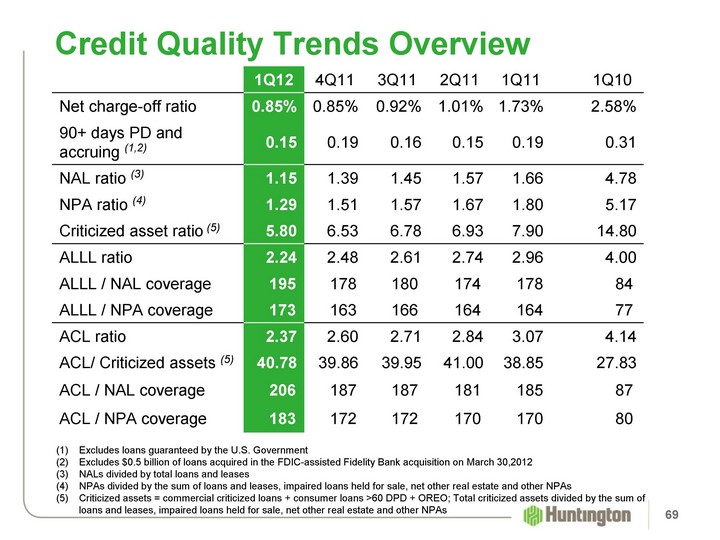
| Credit Quality Trends Overview 1Q12 4Q11 3Q11 2Q11 1Q11 1Q10 Net charge-off ratio 0.85% 0.85% 0.92% 1.01% 1.73% 2.58% 90+ days PD and accruing (1,2) 0.15 0.19 0.16 0.15 0.19 0.31 NAL ratio (3) 1.15 1.39 1.45 1.57 1.66 4.78 NPA ratio (4) 1.29 1.51 1.57 1.67 1.80 5.17 Criticized asset ratio (5) 5.80 6.53 6.78 6.93 7.90 14.80 ALLL ratio 2.24 2.48 2.61 2.74 2.96 4.00 ALLL / NAL coverage 195 178 180 174 178 84 ALLL / NPA coverage 173 163 166 164 164 77 ACL ratio 2.37 2.60 2.71 2.84 3.07 4.14 ACL/ Criticized assets (5) 40.78 39.86 39.95 41.00 38.85 27.83 ACL / NAL coverage 206 187 187 181 185 87 ACL / NPA coverage 183 172 172 170 170 80 Excludes loans guaranteed by the U.S. Government Excludes $0.5 billion of loans acquired in the FDIC-assisted Fidelity Bank acquisition on March 30,2012 NALs divided by total loans and leases (4) NPAs divided by the sum of loans and leases, impaired loans held for sale, net other real estate and other NPAs (5) Criticized assets = commercial criticized loans + consumer loans >60 DPD + OREO; Total criticized assets divided by the sum of loans and leases, impaired loans held for sale, net other real estate and other NPAs 69 |
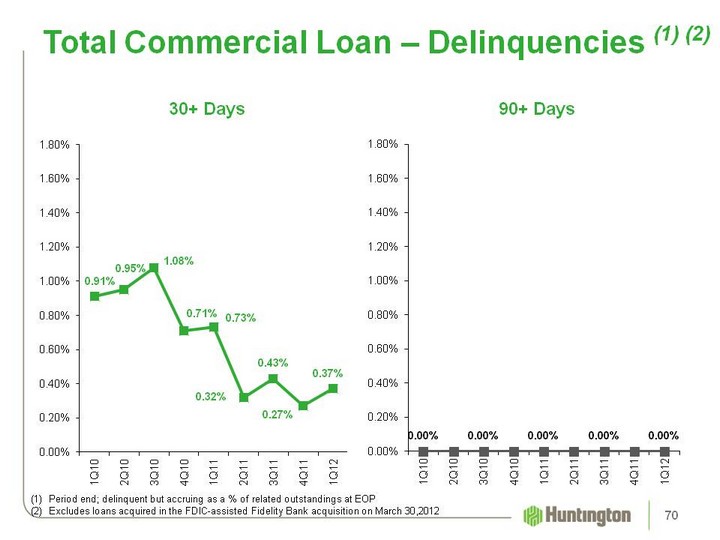
| Total Commercial Loan - Delinquencies (1) (2) Period end; delinquent but accruing as a % of related outstandings at EOP Excludes loans acquired in the FDIC-assisted Fidelity Bank acquisition on March 30,2012 90+ Days 30+ Days 70 |
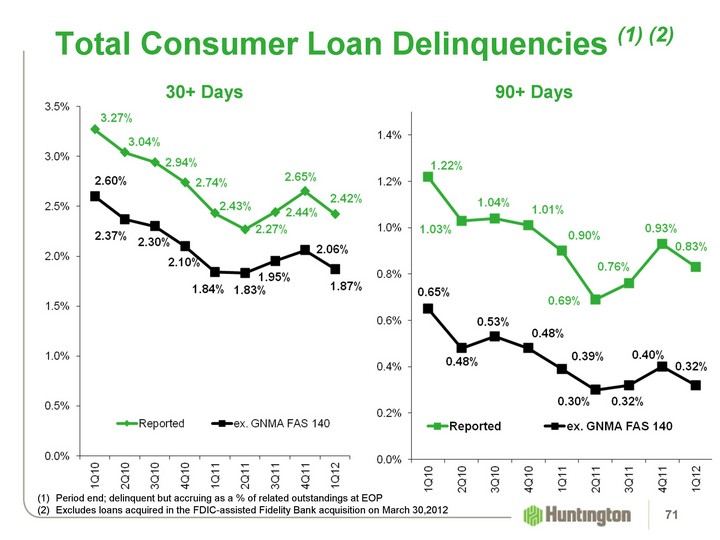
| Total Consumer Loan Delinquencies (1) (2) 90+ Days 30+ Days Period end; delinquent but accruing as a % of related outstandings at EOP Excludes loans acquired in the FDIC-assisted Fidelity Bank acquisition on March 30,2012 71 |
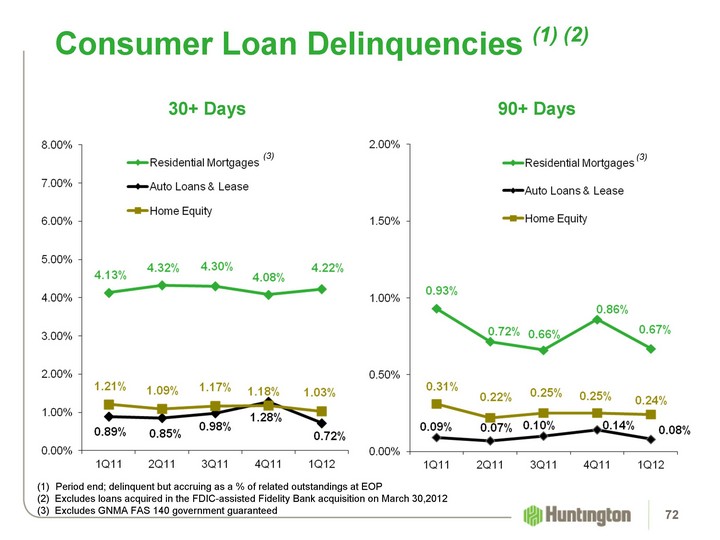
| Consumer Loan Delinquencies (1) (2) Period end; delinquent but accruing as a % of related outstandings at EOP (2) Excludes loans acquired in the FDIC-assisted Fidelity Bank acquisition on March 30,2012 (3) Excludes GNMA FAS 140 government guaranteed (3) (3) 90+ Days 30+ Days 72 |
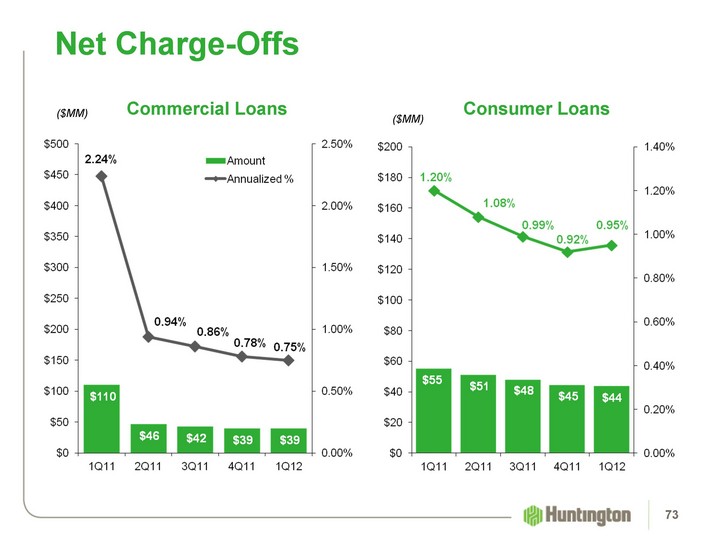
| Net Charge-Offs ($MM) ($MM) Consumer Loans Commercial Loans (2) (1) 73 |
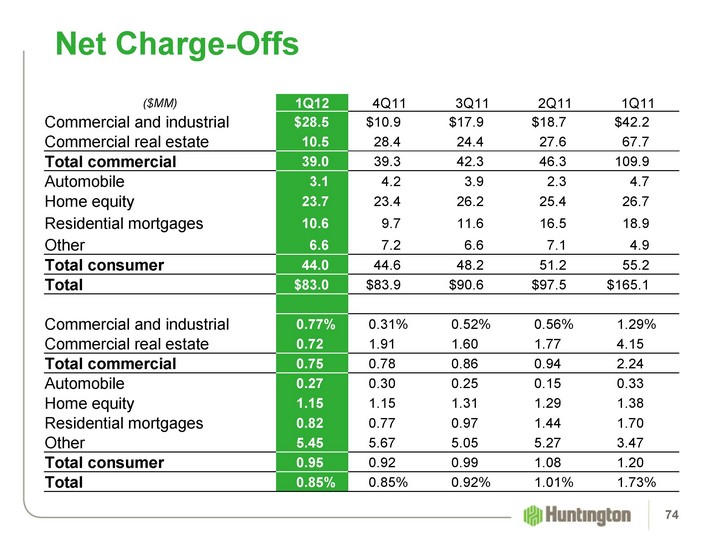
| Net Charge-Offs ($MM) 1Q12 4Q11 3Q11 2Q11 1Q11 Commercial and industrial $28.5 $10.9 $17.9 $18.7 $42.2 Commercial real estate 10.5 28.4 24.4 27.6 67.7 Total commercial 39.0 39.3 42.3 46.3 109.9 Automobile 3.1 4.2 3.9 2.3 4.7 Home equity 23.7 23.4 26.2 25.4 26.7 Residential mortgages 10.6 9.7 11.6 16.5 18.9 Other 6.6 7.2 6.6 7.1 4.9 Total consumer 44.0 44.6 48.2 51.2 55.2 Total $83.0 $83.9 $90.6 $97.5 $165.1 Commercial and industrial 0.77% 0.31% 0.52% 0.56% 1.29% Commercial real estate 0.72 1.91 1.60 1.77 4.15 Total commercial 0.75 0.78 0.86 0.94 2.24 Automobile 0.27 0.30 0.25 0.15 0.33 Home equity 1.15 1.15 1.31 1.29 1.38 Residential mortgages 0.82 0.77 0.97 1.44 1.70 Other 5.45 5.67 5.05 5.27 3.47 Total consumer 0.95 0.92 0.99 1.08 1.20 Total 0.85% 0.85% 0.92% 1.01% 1.73% 74 |
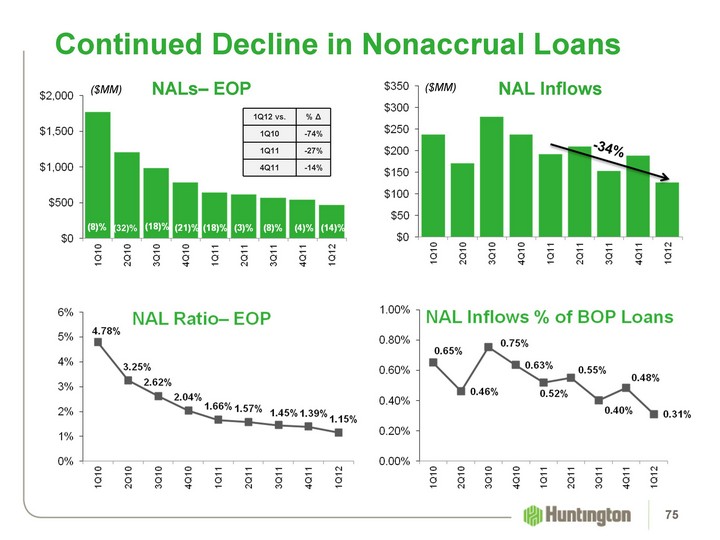
| Continued Decline in Nonaccrual Loans ($MM) ($MM) 10% (8)% (18)% (3)% (19)% NAL Inflows NALs- EOP (4)% (27)% (15)% (38)% 23% 75 1Q12 vs. % ^ 1Q10 -74% 1Q11 -27% 4Q11 -14% (32)% |
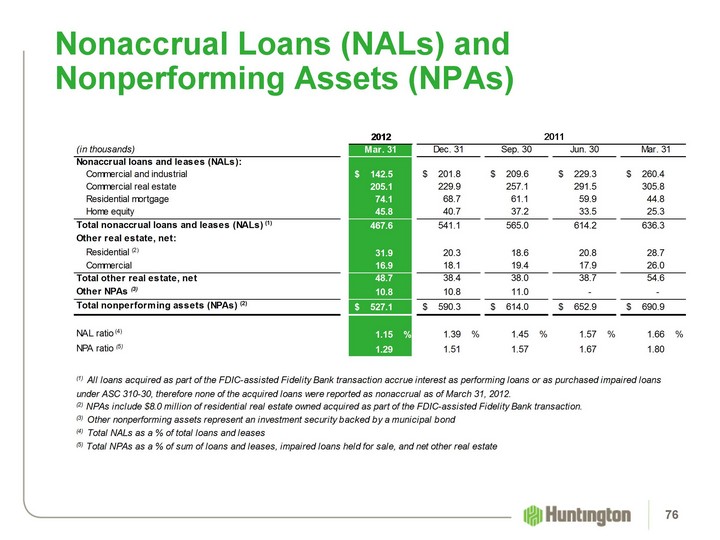
| Nonaccrual Loans (NALs) and Nonperforming Assets (NPAs) 76 |
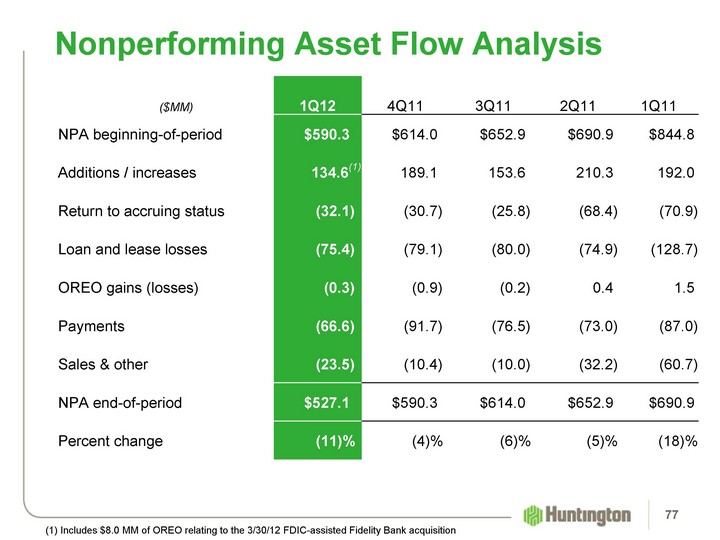
| ($MM) 1Q12 4Q11 3Q11 2Q11 1Q11 NPA beginning-of-period $590.3 $614.0 $652.9 $690.9 $844.8 Additions / increases 134.6(1) 189.1 153.6 210.3 192.0 Return to accruing status (32.1) (30.7) (25.8) (68.4) (70.9) Loan and lease losses (75.4) (79.1) (80.0) (74.9) (128.7) OREO gains (losses) (0.3) (0.9) (0.2) 0.4 1.5 Payments (66.6) (91.7) (76.5) (73.0) (87.0) Sales & other (23.5) (10.4) (10.0) (32.2) (60.7) NPA end-of-period $527.1 $590.3 $614.0 $652.9 $690.9 Percent change (11)% (4)% (6)% (5)% (18)% Nonperforming Asset Flow Analysis 77 (1) Includes $8.0 MM of OREO relating to the 3/30/12 FDIC-assisted Fidelity Bank acquisition |
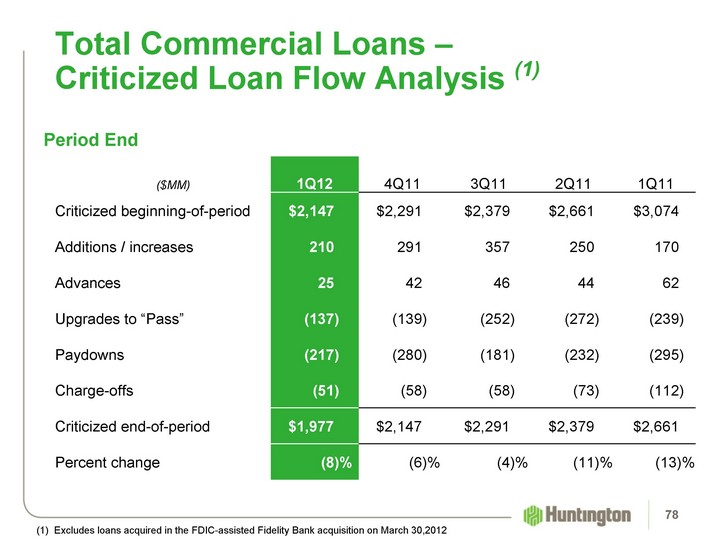
| ($MM) 1Q12 4Q11 3Q11 2Q11 1Q11 Criticized beginning-of-period $2,147 $2,291 $2,379 $2,661 $3,074 Additions / increases 210 291 357 250 170 Advances 25 42 46 44 62 Upgrades to "Pass" (137) (139) (252) (272) (239) Paydowns (217) (280) (181) (232) (295) Charge-offs (51) (58) (58) (73) (112) Criticized end-of-period $1,977 $2,147 $2,291 $2,379 $2,661 Percent change (8)% (6)% (4)% (11)% (13)% Total Commercial Loans - Criticized Loan Flow Analysis (1) Period End 78 (1) Excludes loans acquired in the FDIC-assisted Fidelity Bank acquisition on March 30,2012 |
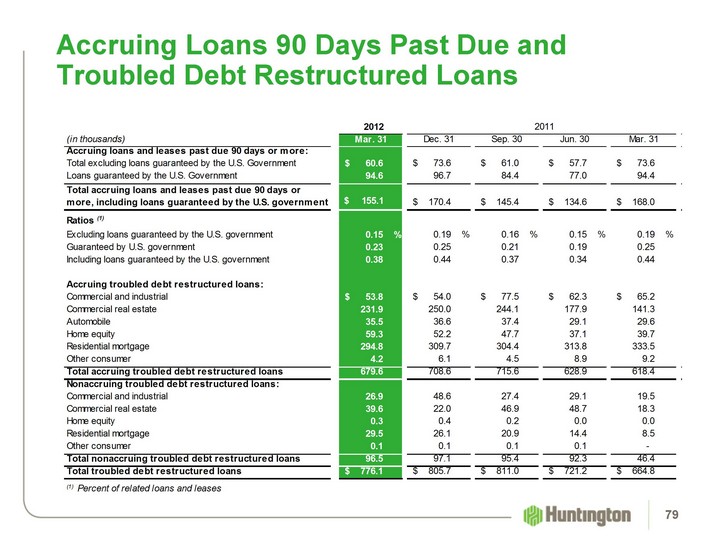
| Accruing Loans 90 Days Past Due and Troubled Debt Restructured Loans 79 |
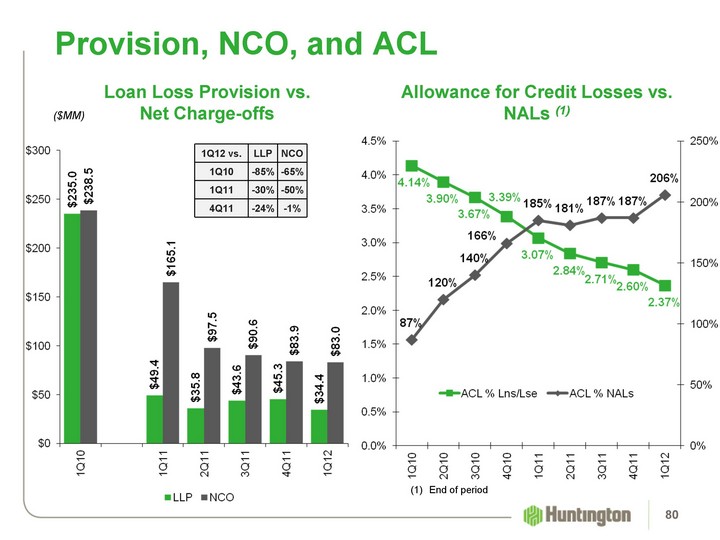
| Provision, NCO, and ACL ($MM) (1) End of period Allowance for Credit Losses vs. NALs (1) Loan Loss Provision vs. Net Charge-offs 80 1Q12 vs. LLP NCO 1Q10 -85% -65% 1Q11 -30% -50% 4Q11 -24% -1% |
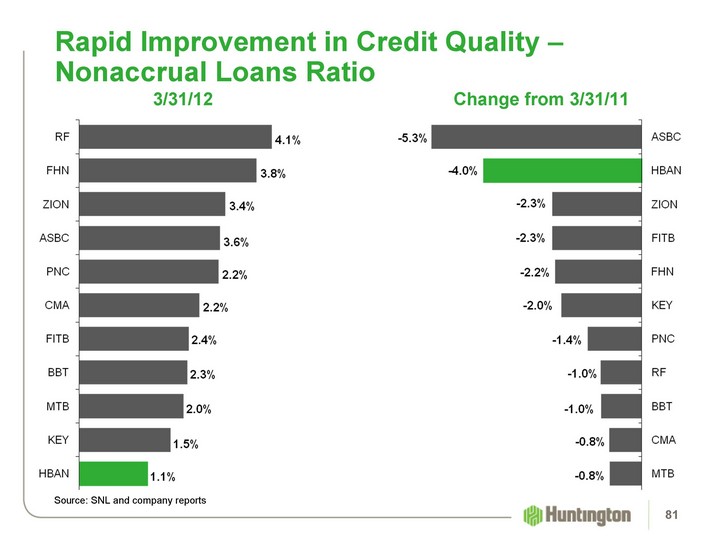
| Rapid Improvement in Credit Quality - Nonaccrual Loans Ratio 3/31/12 Change from 3/31/11 Source: SNL and company reports 81 |
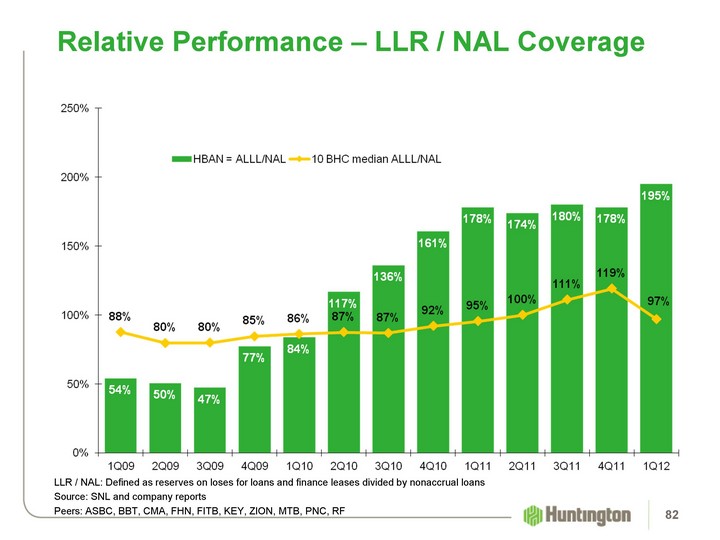
| Relative Performance - LLR / NAL Coverage LLR / NAL: Defined as reserves on loses for loans and finance leases divided by nonaccrual loans Source: SNL and company reports Peers: ASBC, BBT, CMA, FHN, FITB, KEY, ZION, MTB, PNC, RF 82 |
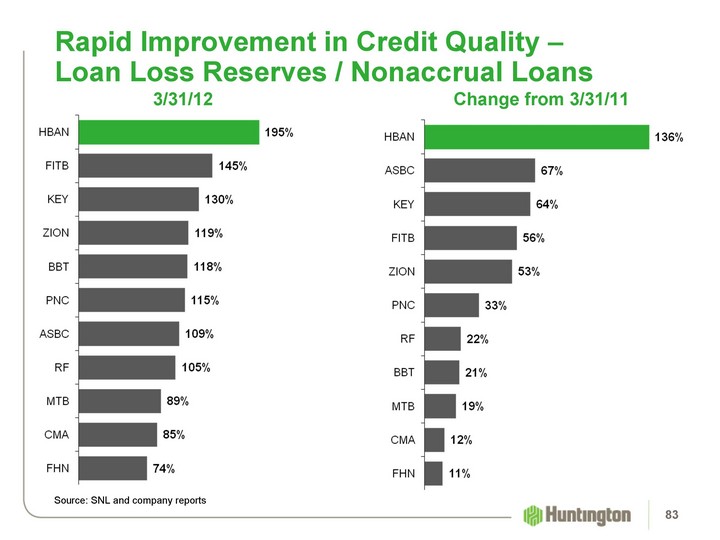
| Rapid Improvement in Credit Quality - Loan Loss Reserves / Nonaccrual Loans Source: SNL and company reports 3/31/12 Change from 3/31/11 83 |
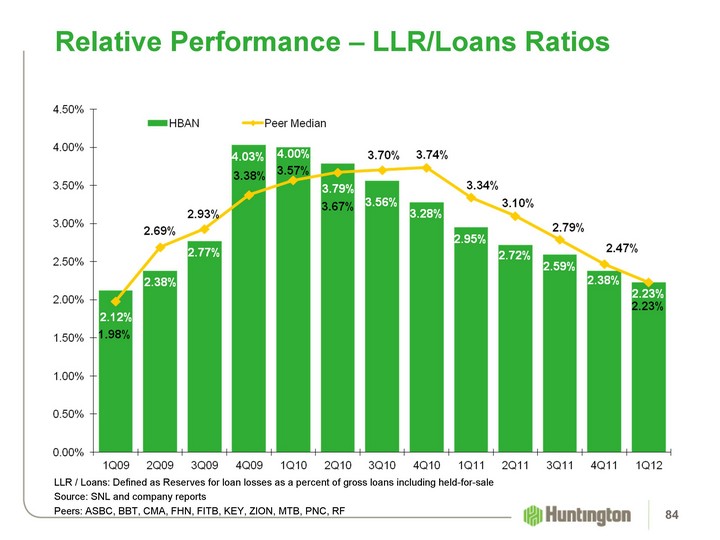
| Relative Performance - LLR/Loans Ratios 84 LLR / Loans: Defined as Reserves for loan losses as a percent of gross loans including held-for-sale Source: SNL and company reports Peers: ASBC, BBT, CMA, FHN, FITB, KEY, ZION, MTB, PNC, RF |

| Deposits 85 |
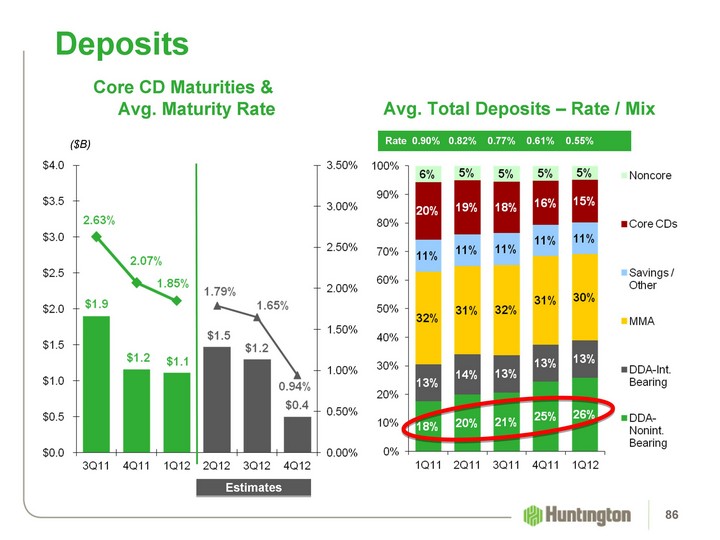
| Deposits ($B) Avg. Total Deposits - Rate / Mix Core CD Maturities & Avg. Maturity Rate Rate 0.90% 0.82% 0.77% 0.61% 0.55% Estimates 86 |
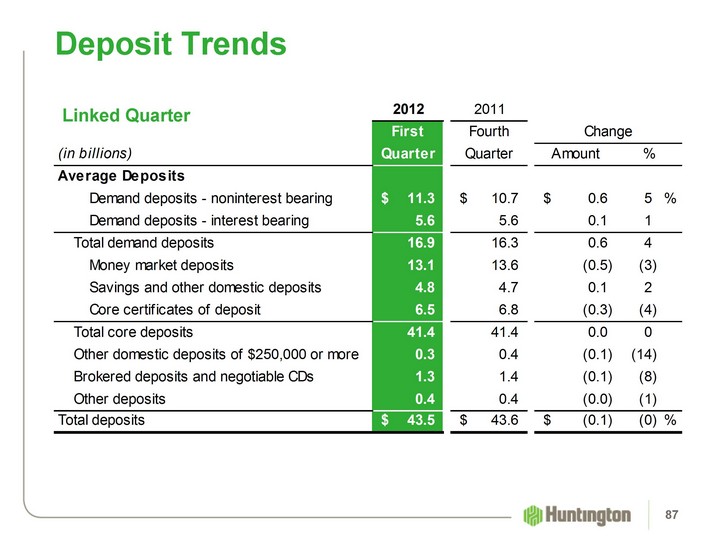
| Deposit Trends Linked Quarter 87 |
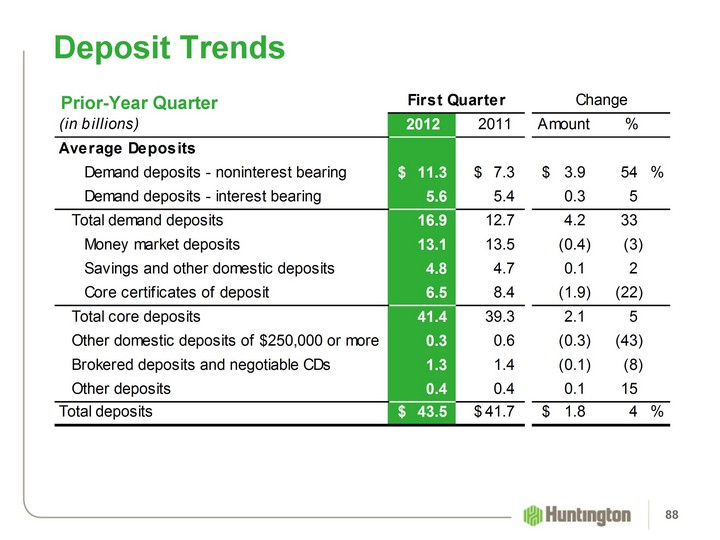
| Deposit Trends Prior-Year Quarter 88 |
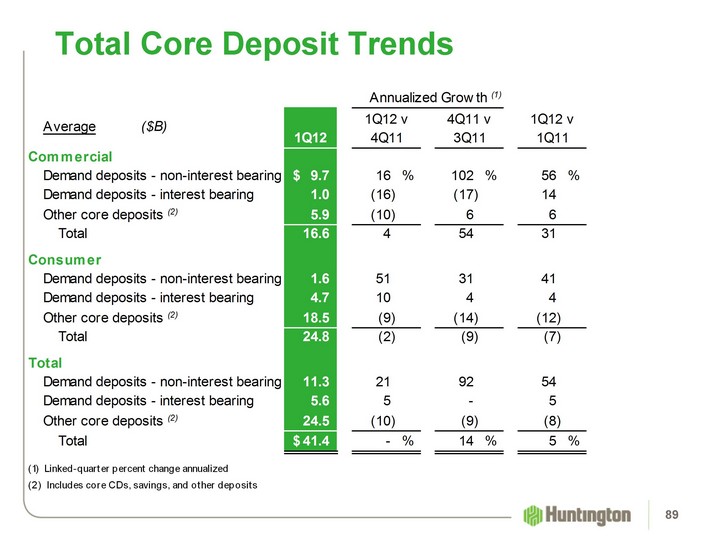
| Total Core Deposit Trends 89 |

| Capital 90 |
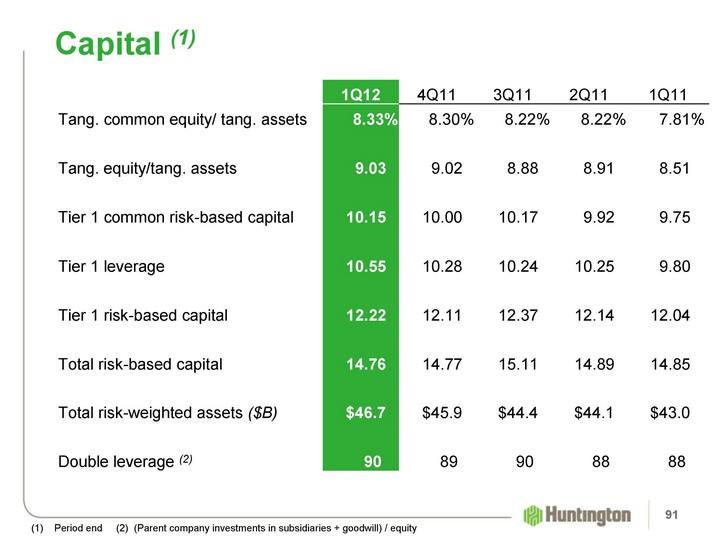
| 1Q12 4Q11 3Q11 2Q11 1Q11 Tang. common equity/ tang. assets 8.33% 8.30% 8.22% 8.22% 7.81% Tang. equity/tang. assets 9.03 9.02 8.88 8.91 8.51 Tier 1 common risk-based capital 10.15 10.00 10.17 9.92 9.75 Tier 1 leverage 10.55 10.28 10.24 10.25 9.80 Tier 1 risk-based capital 12.22 12.11 12.37 12.14 12.04 Total risk-based capital 14.76 14.77 15.11 14.89 14.85 Total risk-weighted assets ($B) $46.7 $45.9 $44.4 $44.1 $43.0 Double leverage (2) 90 89 90 88 88 Capital (1) (1) Period end (2) (Parent company investments in subsidiaries + goodwill) / equity 91 |
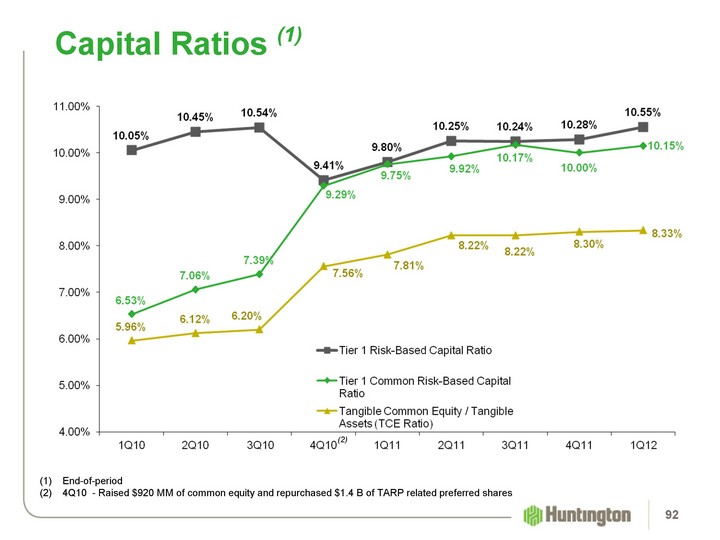
| Capital Ratios (1) End-of-period 4Q10 - Raised $920 MM of common equity and repurchased $1.4 B of TARP related preferred shares (2) 92 |
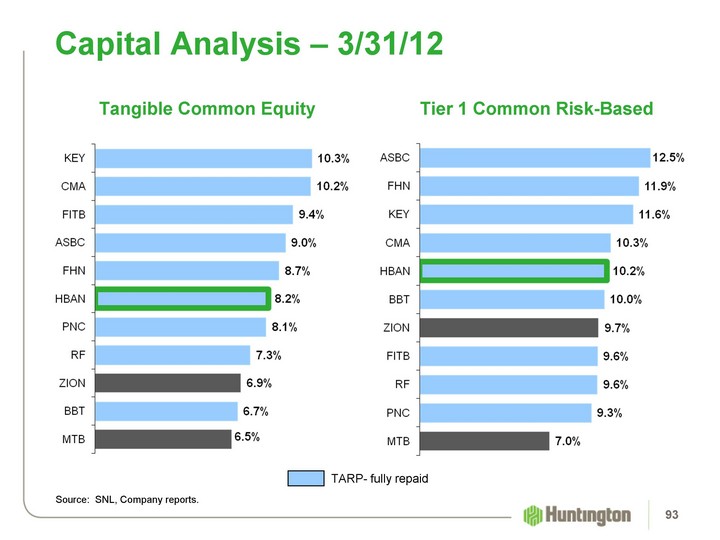
| Capital Analysis - 3/31/12 Source: SNL, Company reports. Tier 1 Common Risk-Based Tangible Common Equity TARP- fully repaid 93 |

| Franchise and Leadership 94 |
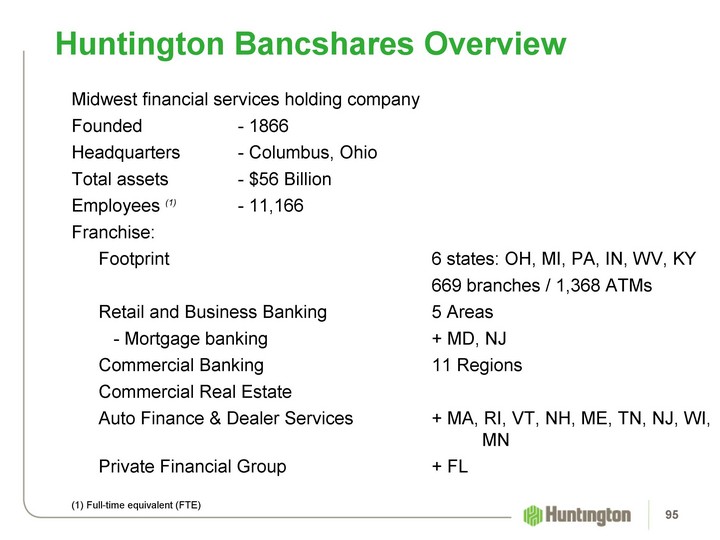
| Huntington Bancshares Overview Midwest financial services holding company Founded - 1866 Headquarters - Columbus, Ohio Total assets - $56 Billion Employees (1) - 11,166 Franchise: Footprint 6 states: OH, MI, PA, IN, WV, KY 669 branches / 1,368 ATMs Retail and Business Banking 5 Areas - Mortgage banking + MD, NJ Commercial Banking 11 Regions Commercial Real Estate Auto Finance & Dealer Services + MA, RI, VT, NH, ME, TN, NJ, WI, MN Private Financial Group + FL (1) Full-time equivalent (FTE) 95 |
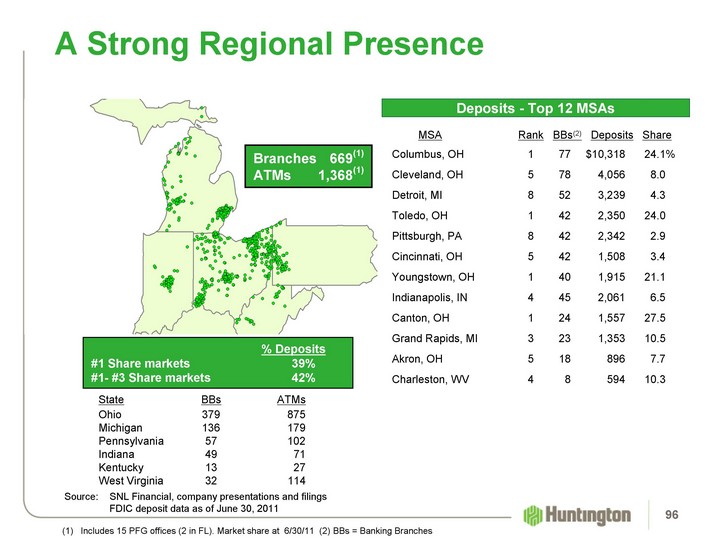
| A Strong Regional Presence Source: SNL Financial, company presentations and filings FDIC deposit data as of June 30, 2011 Deposits - Top 12 MSAs MSA Rank BBs(2) Deposits Share Columbus, OH 1 77 $10,318 24.1% Cleveland, OH 5 78 4,056 8.0 Detroit, MI 8 52 3,239 4.3 Toledo, OH 1 42 2,350 24.0 Pittsburgh, PA 8 42 2,342 2.9 Cincinnati, OH 5 42 1,508 3.4 Youngstown, OH 1 40 1,915 21.1 Indianapolis, IN 4 45 2,061 6.5 Canton, OH 1 24 1,557 27.5 Grand Rapids, MI 3 23 1,353 10.5 Akron, OH 5 18 896 7.7 Charleston, WV 4 8 594 10.3 % Deposits #1 Share markets 39% #1- #3 Share markets 42% 96 Includes 15 PFG offices (2 in FL). Market share at 6/30/11 (2) BBs = Banking Branches Branches 669(1) ATMs 1,368(1) State BBs ATMs Ohio 379 875 Michigan 136 179 Pennsylvania 57 102 Indiana 49 71 Kentucky 13 27 West Virginia 32 114 |
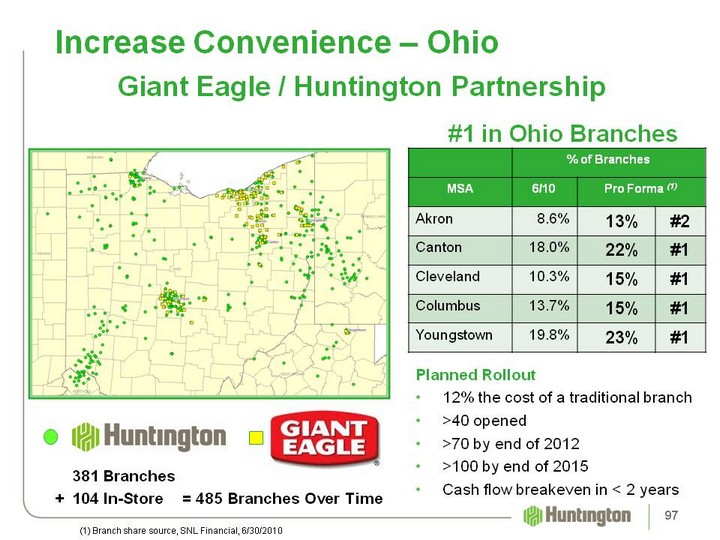
| #1 in Ohio Branches Planned Rollout 12% the cost of a traditional branch >40 opened >70 by end of 2012 >100 by end of 2015 Cash flow breakeven in < 2 years Increase Convenience - Ohio (1) Branch share source, SNL Financial, 6/30/2010 % of Branches % of Branches % of Branches MSA 6/10 Pro Forma (1) Pro Forma (1) Akron 8.6% 13% #2 Canton 18.0% 22% #1 Cleveland 10.3% 15% #1 Columbus 13.7% 15% #1 Youngstown 19.8% 23% #1 381 Branches + 104 In-Store = 485 Branches Over Time Giant Eagle / Huntington Partnership 97 97 |
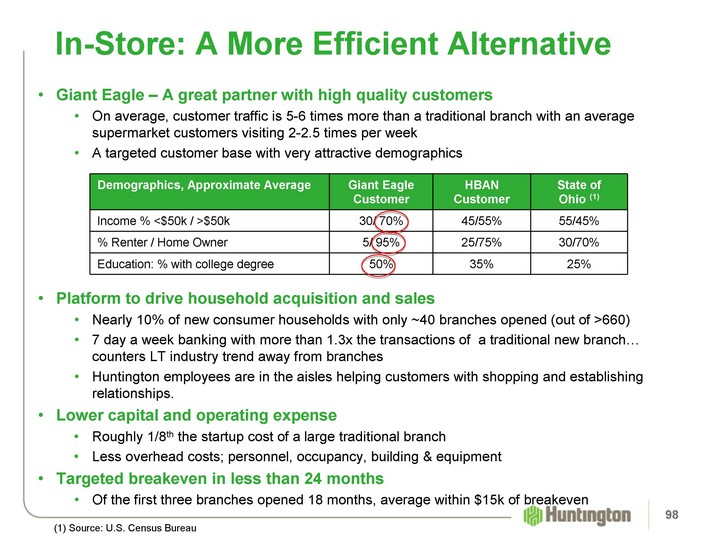
| In-Store: A More Efficient Alternative Giant Eagle - A great partner with high quality customers On average, customer traffic is 5-6 times more than a traditional branch with an average supermarket customers visiting 2-2.5 times per week A targeted customer base with very attractive demographics Platform to drive household acquisition and sales Nearly 10% of new consumer households with only ~40 branches opened (out of >660) 7 day a week banking with more than 1.3x the transactions of a traditional new branch... counters LT industry trend away from branches Huntington employees are in the aisles helping customers with shopping and establishing relationships. Lower capital and operating expense Roughly 1/8th the startup cost of a large traditional branch Less overhead costs; personnel, occupancy, building & equipment Targeted breakeven in less than 24 months Of the first three branches opened 18 months, average within $15k of breakeven 98 (1) Source: U.S. Census Bureau Demographics, Approximate Average Giant Eagle Customer HBAN Customer State of Ohio (1) Income % <$50k / >$50k 30/ 70% 45/55% 55/45% % Renter / Home Owner 5/ 95% 25/75% 30/70% Education: % with college degree 50% 35% 25% |
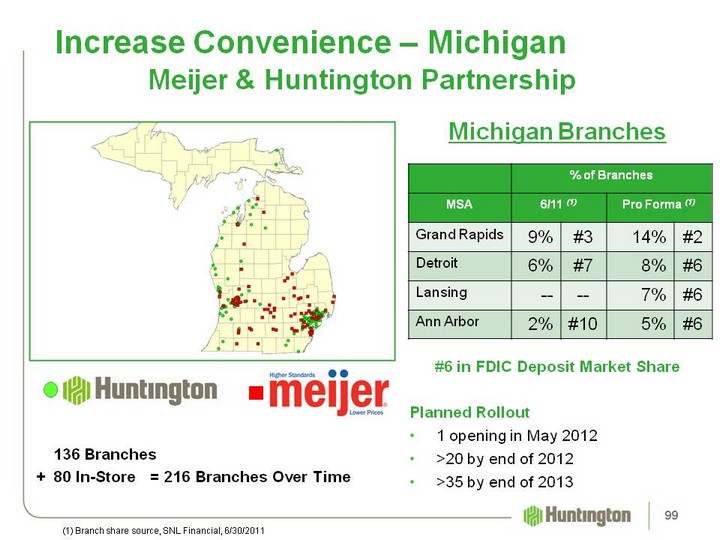
| 136 Branches + 80 In-Store = 216 Branches Over Time Michigan Branches #6 in FDIC Deposit Market Share Planned Rollout 1 opening in May 2012 >20 by end of 2012 >35 by end of 2013 Increase Convenience - Michigan (1) Branch share source, SNL Financial, 6/30/2011 % of Branches % of Branches % of Branches % of Branches MSA 6/11 (1) 6/11 (1) Pro Forma (1) Pro Forma (1) Grand Rapids 9% #3 14% #2 Detroit 6% #7 8% #6 Lansing -- -- 7% #6 Ann Arbor 2% #10 5% #6 Meijer & Huntington Partnership 99 99 |
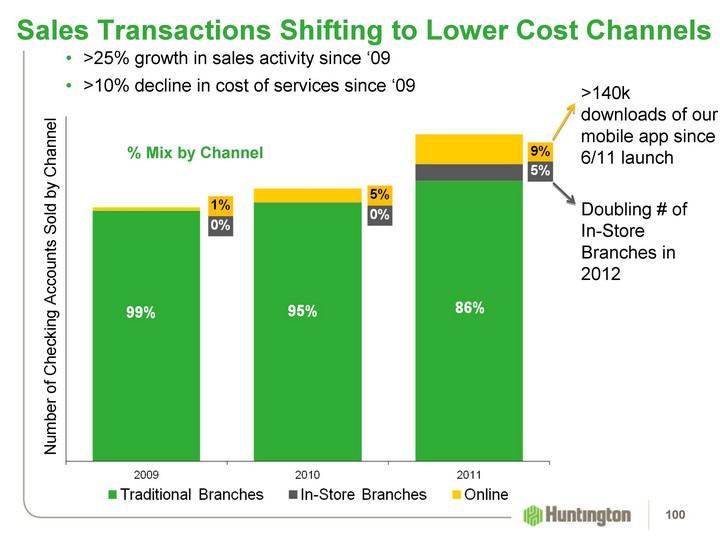
| Sales Transactions Shifting to Lower Cost Channels >25% growth in sales activity since '09 >10% decline in cost of services since '09 100 % Mix by Channel >140k downloads of our mobile app since 6/11 launch Doubling # of In-Store Branches in 2012 Number of Checking Accounts Sold by Channel |
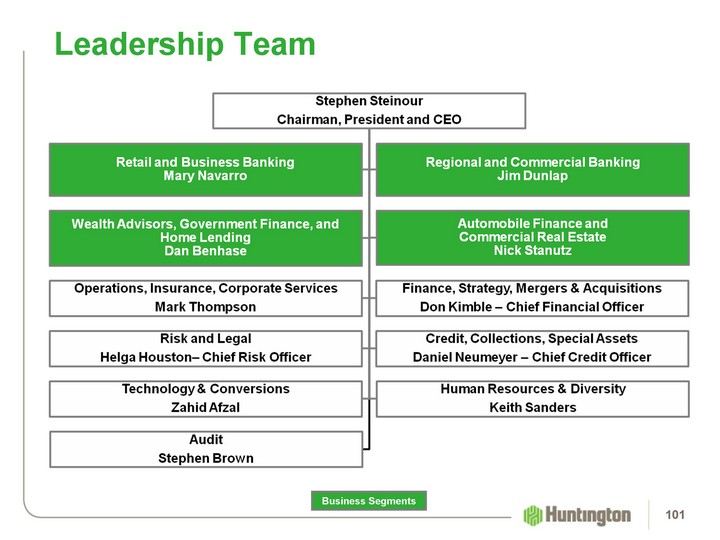
| Leadership Team Leadership Team Business Segments 101 |
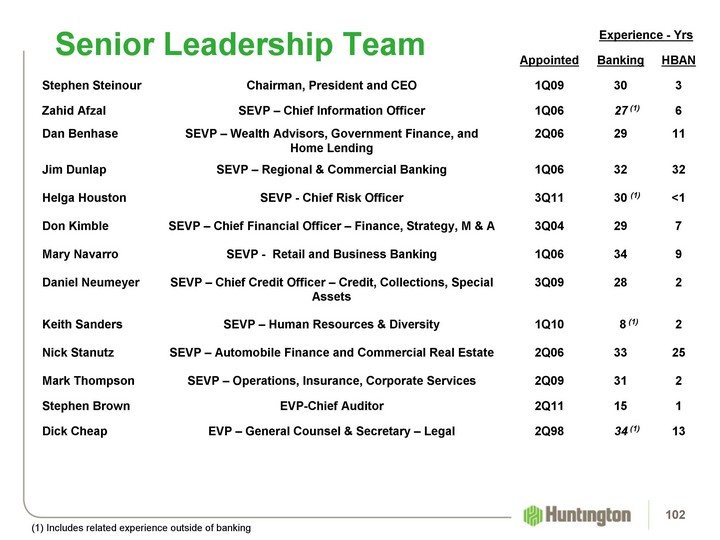
| Experience - Yrs Experience - Yrs Appointed Banking HBAN Stephen Steinour Chairman, President and CEO 1Q09 30 3 Zahid Afzal SEVP - Chief Information Officer 1Q06 27 (1) 6 Dan Benhase SEVP - Wealth Advisors, Government Finance, and Home Lending 2Q06 29 11 Jim Dunlap SEVP - Regional & Commercial Banking 1Q06 32 32 Helga Houston SEVP - Chief Risk Officer 3Q11 30 (1) <1 Don Kimble SEVP - Chief Financial Officer - Finance, Strategy, M & A 3Q04 29 7 Mary Navarro SEVP - Retail and Business Banking 1Q06 34 9 Daniel Neumeyer SEVP - Chief Credit Officer - Credit, Collections, Special Assets 3Q09 28 2 Keith Sanders SEVP - Human Resources & Diversity 1Q10 8 (1) 2 Nick Stanutz SEVP - Automobile Finance and Commercial Real Estate 2Q06 33 25 Mark Thompson SEVP - Operations, Insurance, Corporate Services 2Q09 31 2 Stephen Brown EVP-Chief Auditor 2Q11 15 1 Dick Cheap EVP - General Counsel & Secretary - Legal 2Q98 34 (1) 13 Senior Leadership Team (1) Includes related experience outside of banking 102 |

| Business Segment Overview 103 |
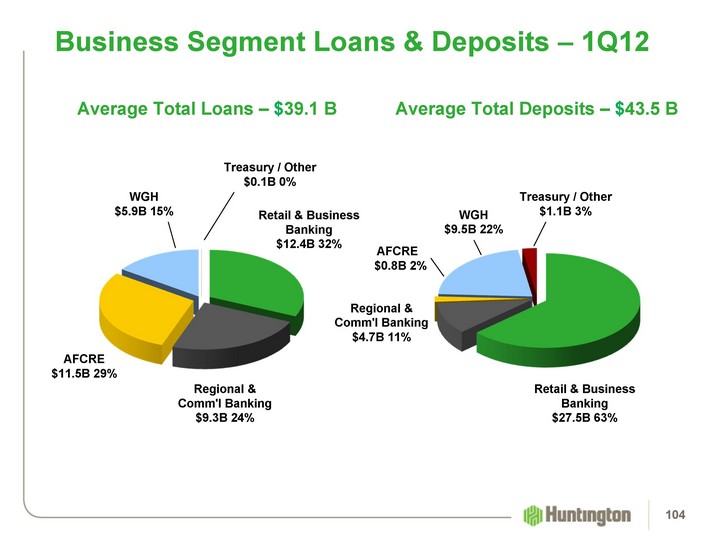
| Business Segment Loans & Deposits - 1Q12 Average Total Deposits - $43.5 B Average Total Loans - $39.1 B AFCRE $11.5B 29% Retail & Business Banking $12.4B 32% Treasury / Other $0.1B 0% Regional & Comm'l Banking $9.3B 24% WGH $5.9B 15% AFCRE $0.8B 2% Treasury / Other $1.1B 3% Retail & Business Banking $27.5B 63% Regional & Comm'l Banking $4.7B 11% WGH $9.5B 22% 104 |
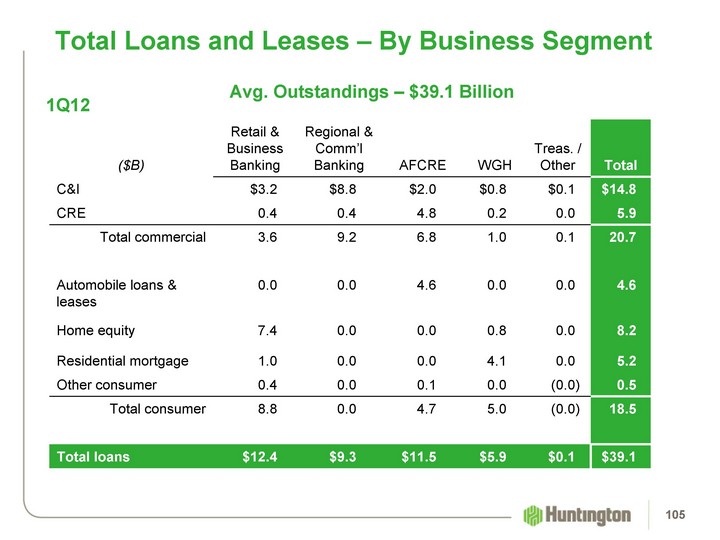
| Total Loans and Leases - By Business Segment ($B) Retail & Business Banking Regional & Comm'l Banking AFCRE WGH Treas. / Other Total C&I $3.2 $8.8 $2.0 $0.8 $0.1 $14.8 CRE 0.4 0.4 4.8 0.2 0.0 5.9 Total commercial 3.6 9.2 6.8 1.0 0.1 20.7 Automobile loans & leases 0.0 0.0 4.6 0.0 0.0 4.6 Home equity 7.4 0.0 0.0 0.8 0.0 8.2 Residential mortgage 1.0 0.0 0.0 4.1 0.0 5.2 Other consumer 0.4 0.0 0.1 0.0 (0.0) 0.5 Total consumer 8.8 0.0 4.7 5.0 (0.0) 18.5 Total loans $12.4 $9.3 $11.5 $5.9 $0.1 $39.1 Avg. Outstandings - $39.1 Billion 1Q12 105 |
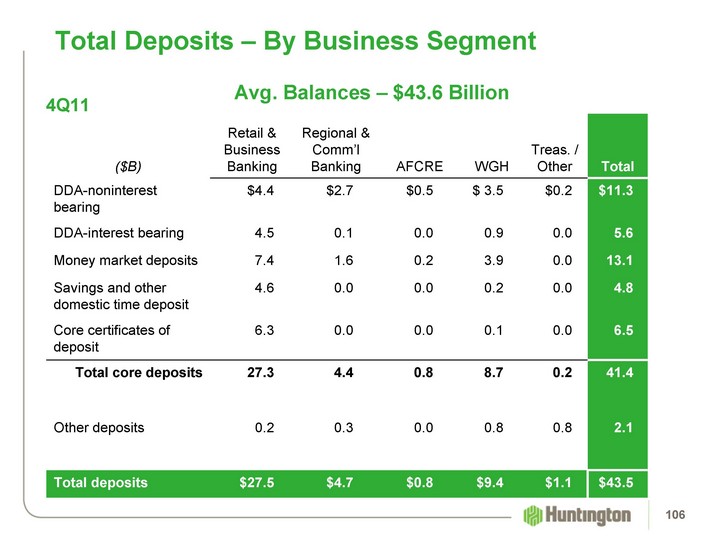
| Total Deposits - By Business Segment ($B) Retail & Business Banking Regional & Comm'l Banking AFCRE WGH Treas. / Other Total DDA-noninterest bearing $4.4 $2.7 $0.5 $ 3.5 $0.2 $11.3 DDA-interest bearing 4.5 0.1 0.0 0.9 0.0 5.6 Money market deposits 7.4 1.6 0.2 3.9 0.0 13.1 Savings and other domestic time deposit 4.6 0.0 0.0 0.2 0.0 4.8 Core certificates of deposit 6.3 0.0 0.0 0.1 0.0 6.5 Total core deposits 27.3 4.4 0.8 8.7 0.2 41.4 Other deposits 0.2 0.3 0.0 0.8 0.8 2.1 Total deposits $27.5 $4.7 $0.8 $9.4 $1.1 $43.5 Avg. Balances - $43.6 Billion 4Q11 106 |
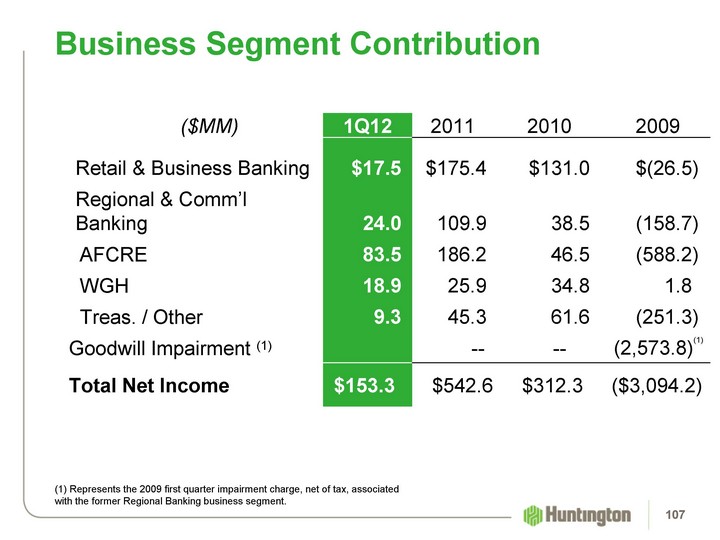
| Business Segment Contribution ($MM) 1Q12 2011 2010 2009 Retail & Business Banking $17.5 $175.4 $131.0 $(26.5) Regional & Comm'l Banking 24.0 109.9 38.5 (158.7) AFCRE 83.5 186.2 46.5 (588.2) WGH 18.9 25.9 34.8 1.8 Treas. / Other 9.3 45.3 61.6 (251.3) Goodwill Impairment (1) -- -- (2,573.8)(1) Total Net Income $153.3 $542.6 $312.3 ($3,094.2) (1) Represents the 2009 first quarter impairment charge, net of tax, associated with the former Regional Banking business segment. 107 |
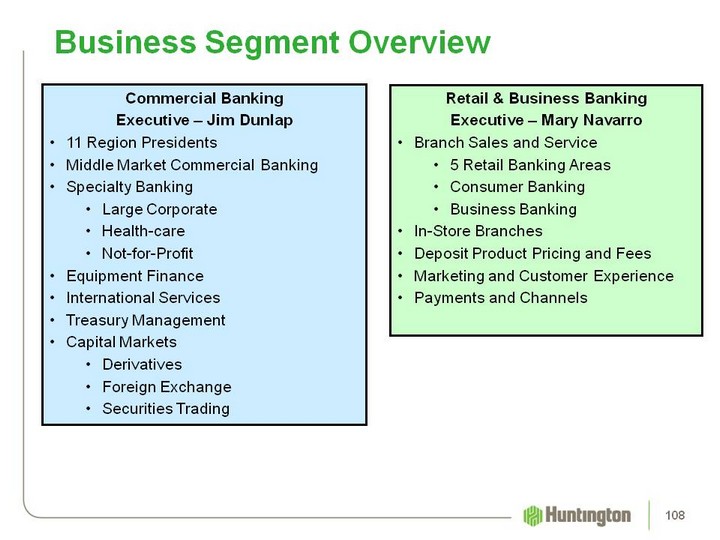
| Business Segment Overview Commercial Banking Executive - Jim Dunlap 11 Region Presidents Middle Market Commercial Banking Specialty Banking Large Corporate Health-care Not-for-Profit Equipment Finance International Services Treasury Management Capital Markets Derivatives Foreign Exchange Securities Trading Retail & Business Banking Executive - Mary Navarro Branch Sales and Service 5 Retail Banking Areas Consumer Banking Business Banking In-Store Branches Deposit Product Pricing and Fees Marketing and Customer Experience Payments and Channels 108 |
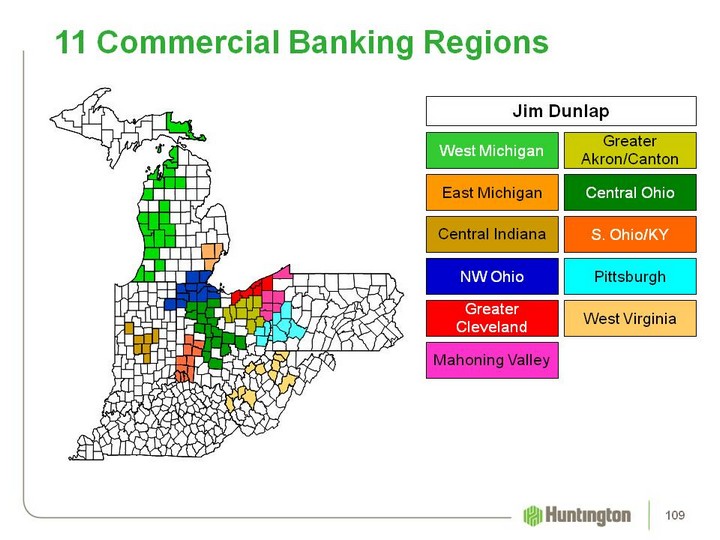
| 11 Commercial Banking Regions Greater Akron/Canton Mahoning Valley Central Ohio NW Ohio S. Ohio/KY Greater Cleveland Central Indiana West Michigan East Michigan West Virginia Pittsburgh Jim Dunlap 109 |
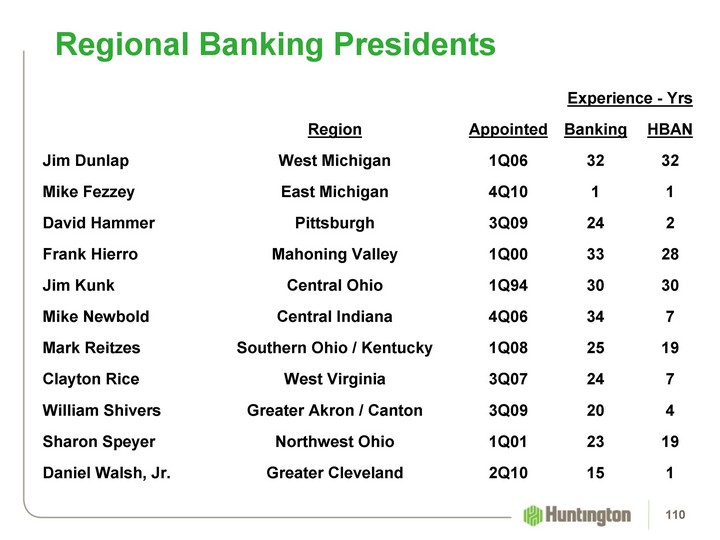
| Experience - Yrs Experience - Yrs Region Appointed Banking HBAN Jim Dunlap West Michigan 1Q06 32 32 Mike Fezzey East Michigan 4Q10 1 1 David Hammer Pittsburgh 3Q09 24 2 Frank Hierro Mahoning Valley 1Q00 33 28 Jim Kunk Central Ohio 1Q94 30 30 Mike Newbold Central Indiana 4Q06 34 7 Mark Reitzes Southern Ohio / Kentucky 1Q08 25 19 Clayton Rice West Virginia 3Q07 24 7 William Shivers Greater Akron / Canton 3Q09 20 4 Sharon Speyer Northwest Ohio 1Q01 23 19 Daniel Walsh, Jr. Greater Cleveland 2Q10 15 1 Regional Banking Presidents 110 |
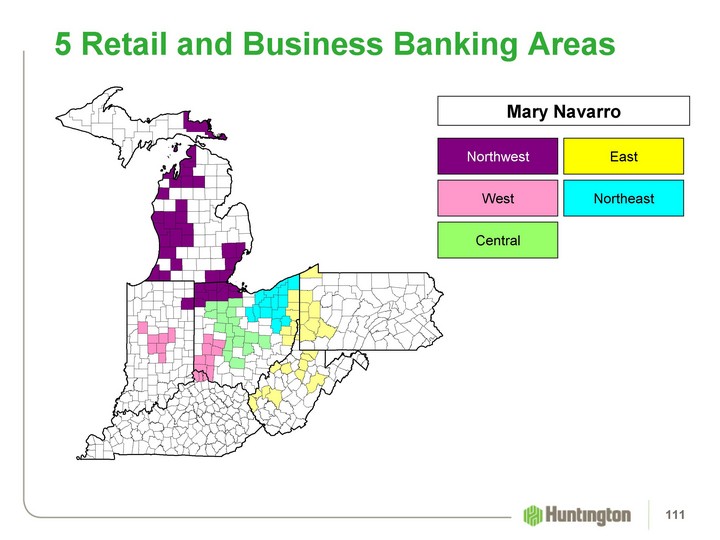
| 5 Retail and Business Banking Areas Central Northwest West Northeast East Mary Navarro 111 |
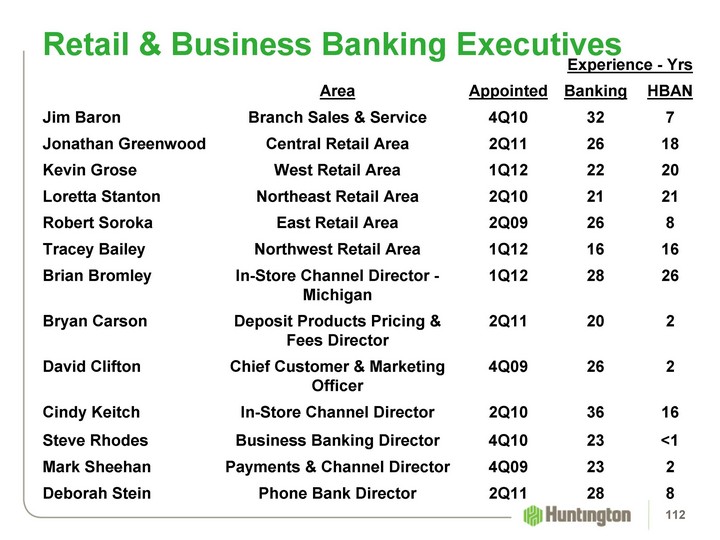
| Experience - Yrs Experience - Yrs Area Appointed Banking HBAN Jim Baron Branch Sales & Service 4Q10 32 7 Jonathan Greenwood Central Retail Area 2Q11 26 18 Kevin Grose West Retail Area 1Q12 22 20 Loretta Stanton Northeast Retail Area 2Q10 21 21 Robert Soroka East Retail Area 2Q09 26 8 Tracey Bailey Northwest Retail Area 1Q12 16 16 Brian Bromley In-Store Channel Director - Michigan 1Q12 28 26 Bryan Carson Deposit Products Pricing & Fees Director 2Q11 20 2 David Clifton Chief Customer & Marketing Officer 4Q09 26 2 Cindy Keitch In-Store Channel Director 2Q10 36 16 Steve Rhodes Business Banking Director 4Q10 23 <1 Mark Sheehan Payments & Channel Director 4Q09 23 2 Deborah Stein Phone Bank Director 2Q11 28 8 Retail & Business Banking Executives 112 |
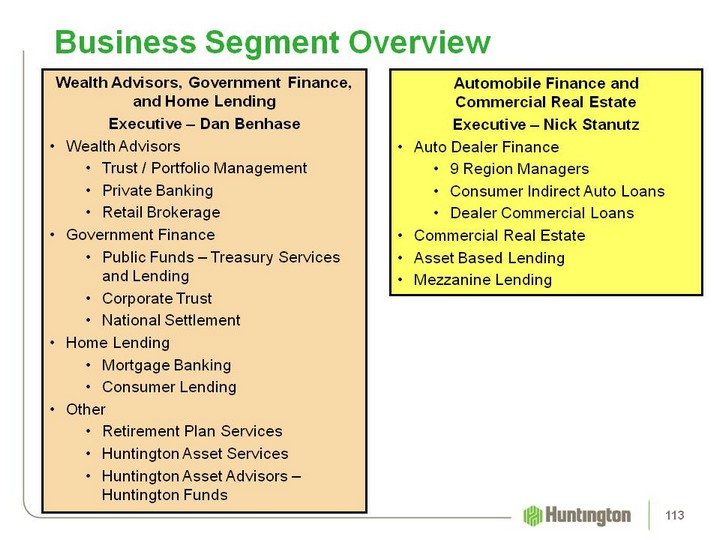
| Business Segment Overview Wealth Advisors, Government Finance, and Home Lending Executive - Dan Benhase Wealth Advisors Trust / Portfolio Management Private Banking Retail Brokerage Government Finance Public Funds - Treasury Services and Lending Corporate Trust National Settlement Home Lending Mortgage Banking Consumer Lending Other Retirement Plan Services Huntington Asset Services Huntington Asset Advisors - Huntington Funds Automobile Finance and Commercial Real Estate Executive - Nick Stanutz Auto Dealer Finance 9 Region Managers Consumer Indirect Auto Loans Dealer Commercial Loans Commercial Real Estate Asset Based Lending Mezzanine Lending 113 |

| Safe Harbor Disclosures 114 |
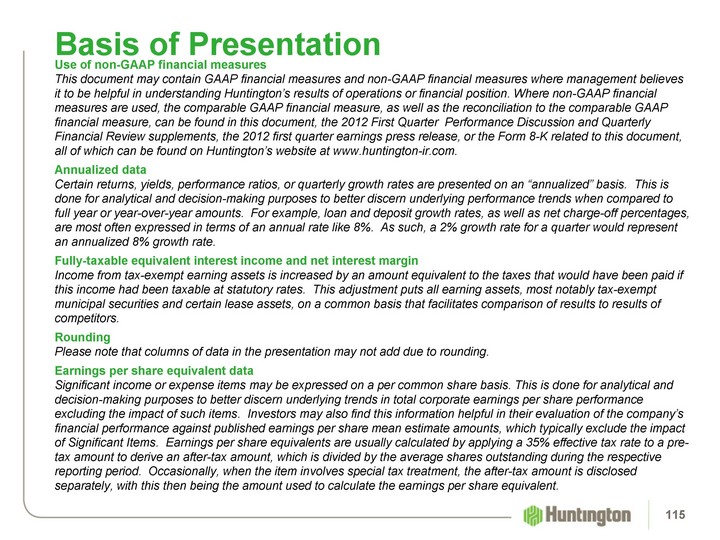
| Use of non-GAAP financial measures This document may contain GAAP financial measures and non-GAAP financial measures where management believes it to be helpful in understanding Huntington's results of operations or financial position. Where non-GAAP financial measures are used, the comparable GAAP financial measure, as well as the reconciliation to the comparable GAAP financial measure, can be found in this document, the 2012 First Quarter Performance Discussion and Quarterly Financial Review supplements, the 2012 first quarter earnings press release, or the Form 8-K related to this document, all of which can be found on Huntington's website at www.huntington-ir.com. Annualized data Certain returns, yields, performance ratios, or quarterly growth rates are presented on an "annualized" basis. This is done for analytical and decision-making purposes to better discern underlying performance trends when compared to full year or year-over-year amounts. For example, loan and deposit growth rates, as well as net charge-off percentages, are most often expressed in terms of an annual rate like 8%. As such, a 2% growth rate for a quarter would represent an annualized 8% growth rate. Fully-taxable equivalent interest income and net interest margin Income from tax-exempt earning assets is increased by an amount equivalent to the taxes that would have been paid if this income had been taxable at statutory rates. This adjustment puts all earning assets, most notably tax-exempt municipal securities and certain lease assets, on a common basis that facilitates comparison of results to results of competitors. Rounding Please note that columns of data in the presentation may not add due to rounding. Earnings per share equivalent data Significant income or expense items may be expressed on a per common share basis. This is done for analytical and decision-making purposes to better discern underlying trends in total corporate earnings per share performance excluding the impact of such items. Investors may also find this information helpful in their evaluation of the company's financial performance against published earnings per share mean estimate amounts, which typically exclude the impact of Significant Items. Earnings per share equivalents are usually calculated by applying a 35% effective tax rate to a pre- tax amount to derive an after-tax amount, which is divided by the average shares outstanding during the respective reporting period. Occasionally, when the item involves special tax treatment, the after-tax amount is disclosed separately, with this then being the amount used to calculate the earnings per share equivalent. Basis of Presentation 115 Do we consolidate this and next slide? |
| Significant Items From time to time, revenue, expenses, or taxes are impacted by items judged by Management to be outside of ordinary banking activities and/or by items that, while they may be associated with ordinary banking activities, are so unusually large that their outsized impact is believed by Management at that time to be infrequent or short term in nature. We refer to such items as "Significant Items". Most often, these Significant Items result from factors originating outside the company - e.g., regulatory actions/assessments, windfall gains, changes in accounting principles, one-time tax assessments/refunds, litigation actions, etc. In other cases they may result from Management decisions associated with significant corporate actions out of the ordinary course of business - e.g., merger/restructuring charges, recapitalization actions, goodwill impairment, etc. Even though certain revenue and expense items are naturally subject to more volatility than others due to changes in market and economic environment conditions, as a general rule volatility alone does not define a Significant Item. For example, changes in the provision for credit losses, gains/losses from investment activities, asset valuation write downs, etc., reflect ordinary banking activities and are, therefore, typically excluded from consideration as a Significant Item. Management believes the disclosure of "Significant Items" in current and prior period results aids analysts/investors in better understanding corporate performance and trends so that they can ascertain which of such items, if any, they may wish to include/exclude from their analysis of the company's performance- i.e., within the context of determining how that performance differed from their expectations, as well as how, if at all, to adjust their estimates of future performance accordingly. To this end, Management has adopted a practice of listing "Significant Items" in its external disclosure documents (e.g., earnings press releases, quarterly performance discussions, investor presentations, Forms 10-Q and 10 K). "Significant Items" for any particular period are not intended to be a complete list of items that may materially impact current or future period performance. A number of items could materially impact these periods, including those described in Huntington's 2011 Annual Report on Form 10-K and other factors described from time to time in Huntington's other filings with the Securities and Exchange Commission. Basis of Presentation 116 |
| This document contains certain forward-looking statements, including certain plans, expectations, goals, projections, and statements, which are subject to numerous assumptions, risks, and uncertainties. Forward-looking statements may be identified by words such as expect, anticipate, believe, intend, estimate, plan, target, goal, or similar expressions, or future or conditional verbs such as will, may, might, should, would, could, or similar variations. While there is no assurance that any list of risks and uncertainties or risk factors is complete, below are certain factors which could cause actual results to differ materially from those contained or implied in the forward-looking statements: (1) worsening of credit quality performance due to a number of factors such as the underlying value of collateral that could prove less valuable than otherwise assumed and assumed cash flows may be worse than expected; (2) changes in economic conditions, including impacts from the continuing economic uncertainty in the US, the European Union, and other areas; (3) movements in interest rates; (4) competitive pressures on product pricing and services; (5) success, impact, and timing of our business strategies, including market acceptance of any new products or services introduced to implement our "Fair Play" banking philosophy; (6) changes in accounting policies and principles and the accuracy of our assumptions and estimates used to prepare our financial statements; (7) extended disruption of vital infrastructure; (8) the final outcome of significant litigation; (9) the nature, extent, timing and results of governmental actions, examinations, reviews, reforms, and regulations including those related to the Dodd-Frank Wall Street Reform and Consumer Protection Act; and (10) the outcome of judicial and regulatory decisions regarding practices in the residential mortgage industry, including among other things the processes followed for foreclosing residential mortgages. Additional factors that could cause results to differ materially from those described above can be found in Huntington's 2011 Annual Report on Form 10-K, and documents subsequently filed by Huntington with the Securities and Exchange Commission. All forward-looking statements included in this document are based on information available at the time of the release. Huntington assumes no obligation to update any forward-looking statement. Forward Looking Statements 117 |