EX-99.2 PRESENTATION OF MATERIALS
Published on May 22, 2003
Exhibit 99.2
| 2003 First Quarter Earnings Review Reflecting $2 Billion Operating Lease Restatement May 20, 2003 |
| Basis of Presentation Operating Lease Reclassification The following presentation reflects the impact of the reclassification of $2.3 billion in auto leases as of December 31, 2002 from direct financing leases to operating leases in the 2003 first quarter. Prior period results have also been restated. Elimination of Operating Results Discussion In order to comply with new SEC rules, Huntington has re-designed its presentation this quarter to essentially eliminate discussion of operating earnings. Prior period presentations had included a discussion of operating earnings, which excluded the impact of certain items primarily related to the strategic restructuring announced in July 2001. The first quarter 2003 and fourth quarter 2002 financial information provided in this press release were not impacted by these non-operating items. Rounding Please note that columns of data in the following slides may not add due to rounding. |
| Agenda Operating lease accounting reclassification First quarter performance highlights First quarter financial review 2003 Outlook |

| Operating Lease Accounting |
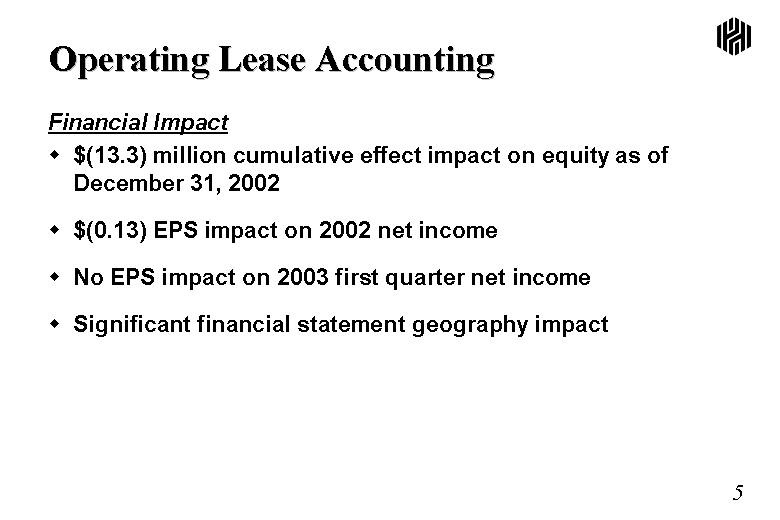
| Operating Lease Accounting Financial Impact $(13.3) million cumulative effect impact on equity as of December 31, 2002 $(0.13) EPS impact on 2002 net income No EPS impact on 2003 first quarter net income Significant financial statement geography impact |
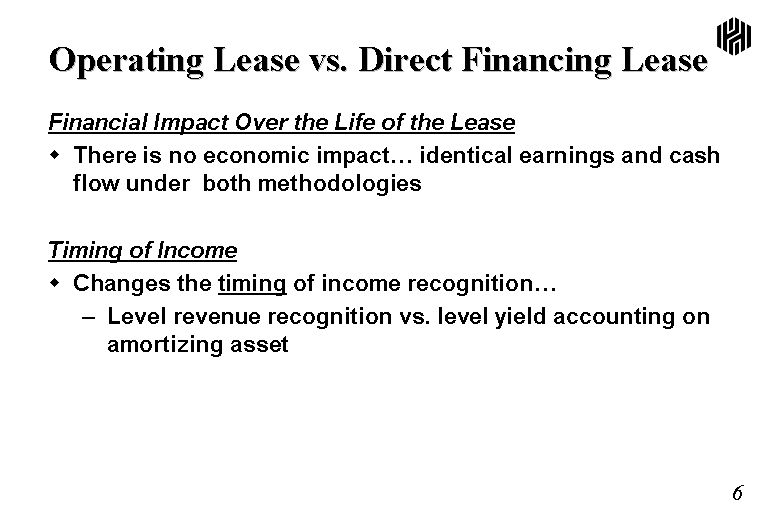
| Operating Lease vs. Direct Financing Lease Financial Impact Over the Life of the Lease There is no economic impact... identical earnings and cash flow under both methodologies Timing of Income Changes the timing of income recognition... Level revenue recognition vs. level yield accounting on amortizing asset |
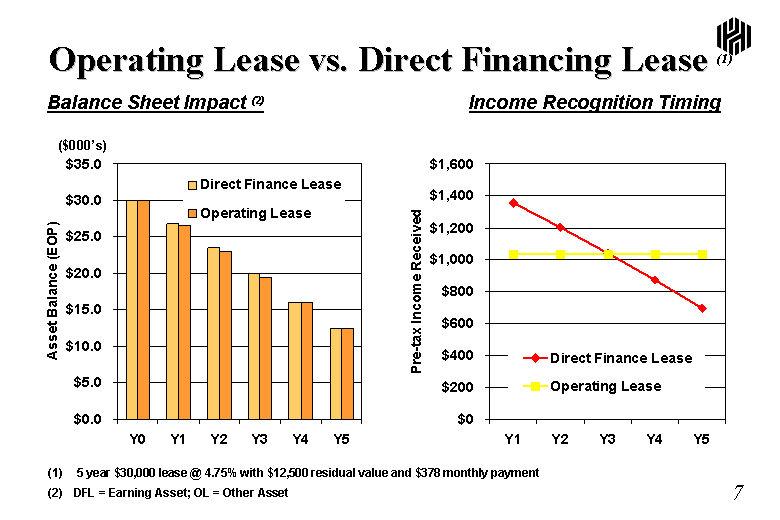
| Operating Lease vs. Direct Financing Lease (1) Direct Finance Lease Operating Lease Y0 30 30 Y1 26.8 26.5 Y2 23.5 23 Y3 20 19.5 Y4 16 16 Y5 12.5 12.5 Direct Finance Lease Operating Lease Y0 Y1 1356 1033 Y2 1202 1033 Y3 1040 1033 Y4 871 1033 Y5 694 1033 Balance Sheet Impact (2) Income Recognition Timing (1) 5 year $30,000 lease @ 4.75% with $12,500 residual value and $378 monthly payment (2) DFL = Earning Asset; OL = Other Asset ($000's) |
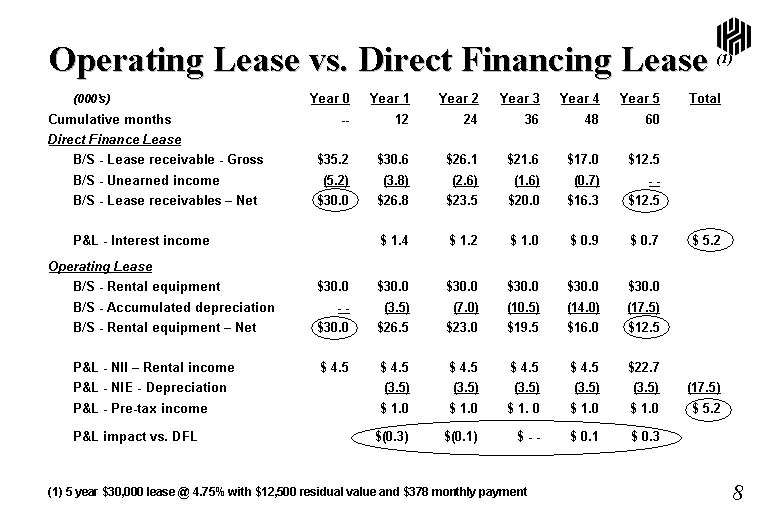
| Operating Lease vs. Direct Financing Lease (1) (000's) Year 0 Year 1 Year 2 Year 3 Year 4 Year 5 Total Cumulative months -- 12 24 36 48 60 Direct Finance Lease B/S - Lease receivable - Gross $35.2 $30.6 $26.1 $21.6 $17.0 $12.5 B/S - Unearned income (5.2) (3.8) (2.6) (1.6) (0.7) - - B/S - Lease receivables - Net $30.0 $26.8 $23.5 $20.0 $16.3 $12.5 P&L - Interest income $ 1.4 $ 1.2 $ 1.0 $ 0.9 $ 0.7 $ 5.2 Operating Lease B/S - Rental equipment $30.0 $30.0 $30.0 $30.0 $30.0 $30.0 B/S - Accumulated depreciation - - (3.5) (7.0) (10.5) (14.0) (17.5) B/S - Rental equipment - Net $30.0 $26.5 $23.0 $19.5 $16.0 $12.5 P&L - NII - Rental income $ 4.5 $ 4.5 $ 4.5 $ 4.5 $ 4.5 $22.7 P&L - NIE - Depreciation (3.5) (3.5) (3.5) (3.5) (3.5) (17.5) P&L - Pre-tax income $ 1.0 $ 1.0 $ 1. 0 $ 1.0 $ 1.0 $ 5.2 P&L impact vs. DFL $(0.3) $(0.1) $ - - $ 0.1 $ 0.3 (1) 5 year $30,000 lease @ 4.75% with $12,500 residual value and $378 monthly payment |
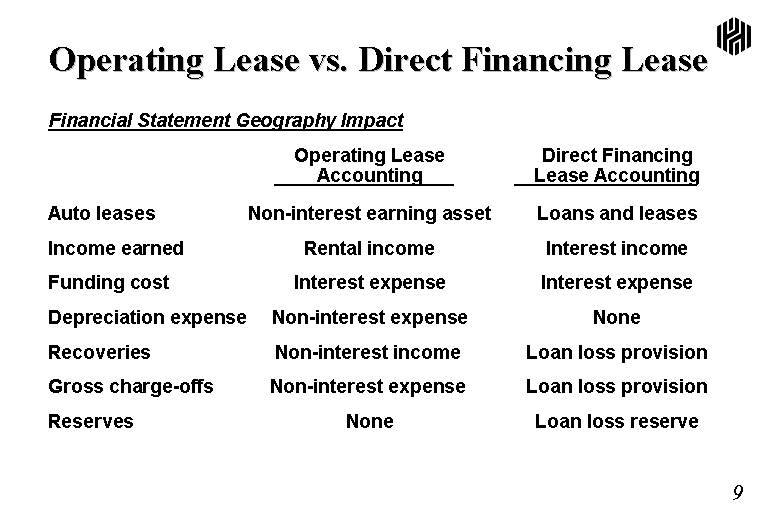
| Operating Lease vs. Direct Financing Lease Financial Statement Geography Impact Operating Lease Direct Financing Accounting Lease Accounting Auto leases Non-interest earning asset Loans and leases Income earned Rental income Interest income Funding cost Interest expense Interest expense Depreciation expense Non-interest expense None Recoveries Non-interest income Loan loss provision Gross charge-offs Non-interest expense Loan loss provision Reserves None Loan loss reserve |

| First Quarter Performance Highlights |
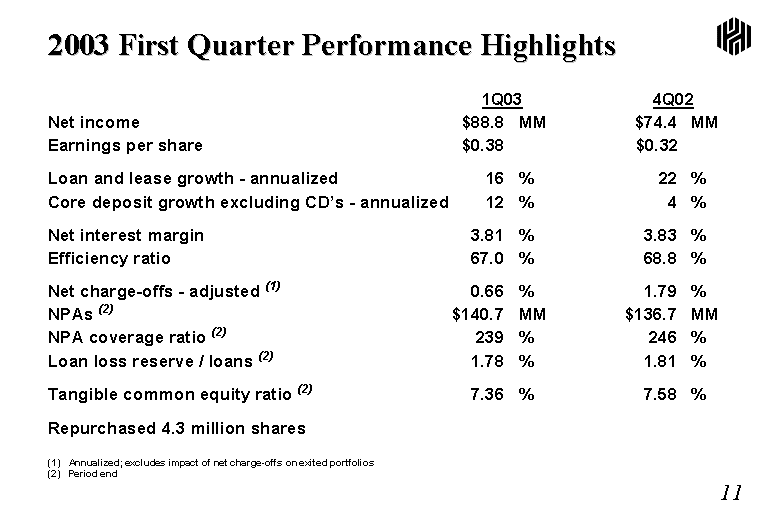
| 2003 First Quarter Performance Highlights 1Q03 4Q02 Net income $88.8 MM $74.4 MM Earnings per share $0.38 $0.32 Loan and lease growth - annualized 16 % 22 % Core deposit growth excluding CD's - annualized 12 % 4 % Net interest margin 3.81 % 3.83 % Efficiency ratio 67.0 % 68.8 % Net charge-offs - adjusted (1) 0.66 % 1.79 % NPAs (2) $140.7 MM $136.7 MM NPA coverage ratio (2) 239 % 246 % Loan loss reserve / loans (2) 1.78 % 1.81 % Tangible common equity ratio (2) 7.36 % 7.58 % Repurchased 4.3 million shares (1) Annualized; excludes impact of net charge-offs on exited portfolios (2) Period end |
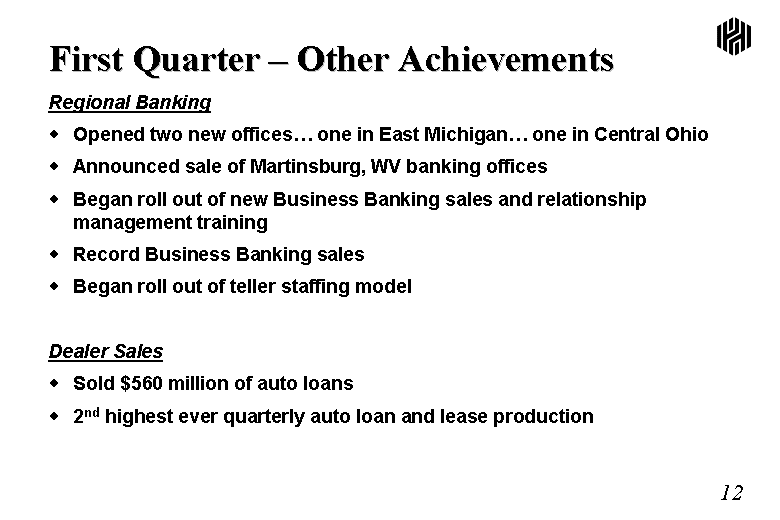
| First Quarter - Other Achievements Regional Banking Opened two new offices... one in East Michigan... one in Central Ohio Announced sale of Martinsburg, WV banking offices Began roll out of new Business Banking sales and relationship management training Record Business Banking sales Began roll out of teller staffing model Dealer Sales Sold $560 million of auto loans 2nd highest ever quarterly auto loan and lease production |
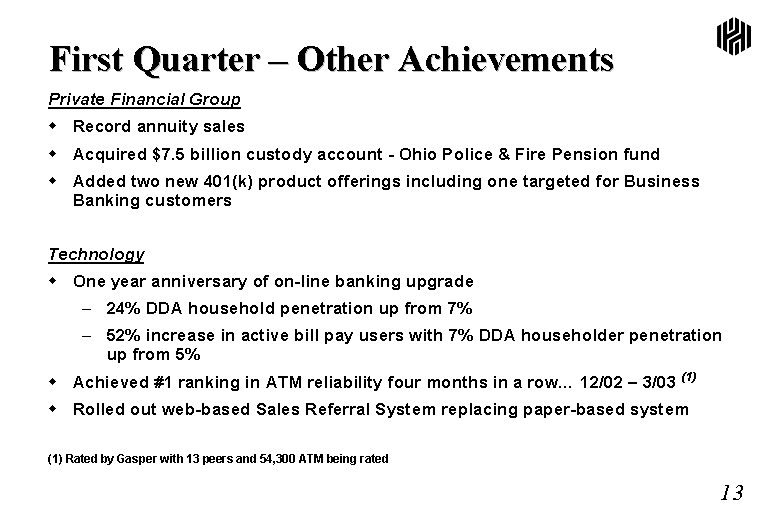
| First Quarter - Other Achievements Private Financial Group Record annuity sales Acquired $7.5 billion custody account - Ohio Police & Fire Pension fund Added two new 401(k) product offerings including one targeted for Business Banking customers Technology One year anniversary of on-line banking upgrade 24% DDA household penetration up from 7% 52% increase in active bill pay users with 7% DDA householder penetration up from 5% Achieved #1 ranking in ATM reliability four months in a row... 12/02 - 3/03 (1) Rolled out web-based Sales Referral System replacing paper-based system (1) Rated by Gasper with 13 peers and 54,300 ATM being rated |

| Financial Review |
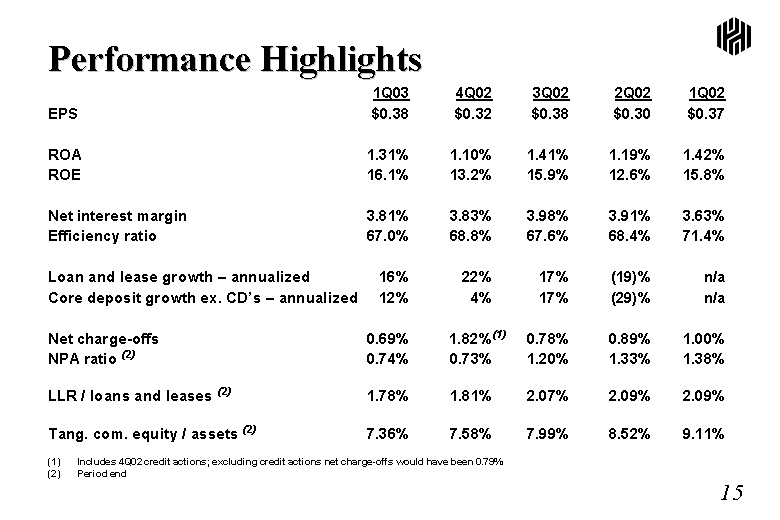
| Performance Highlights 1Q03 4Q02 3Q02 2Q02 1Q02 EPS $0.38 $0.32 $0.38 $0.30 $0.37 ROA 1.31% 1.10% 1.41% 1.19% 1.42% ROE 16.1% 13.2% 15.9% 12.6% 15.8% Net interest margin 3.81% 3.83% 3.98% 3.91% 3.63% Efficiency ratio 67.0% 68.8% 67.6% 68.4% 71.4% Loan and lease growth - annualized 16% 22% 17% (19)% n/a Core deposit growth ex. CD's - annualized 12% 4% 17% (29)% n/a Net charge-offs 0.69% 1.82%(1) 0.78% 0.89% 1.00% NPA ratio (2) 0.74% 0.73% 1.20% 1.33% 1.38% LLR / loans and leases (2) 1.78% 1.81% 2.07% 2.09% 2.09% Tang. com. equity / assets (2) 7.36% 7.58% 7.99% 8.52% 9.11% (1) Includes 4Q02 credit actions; excluding credit actions net charge-offs would have been 0.79% (2) Period end |
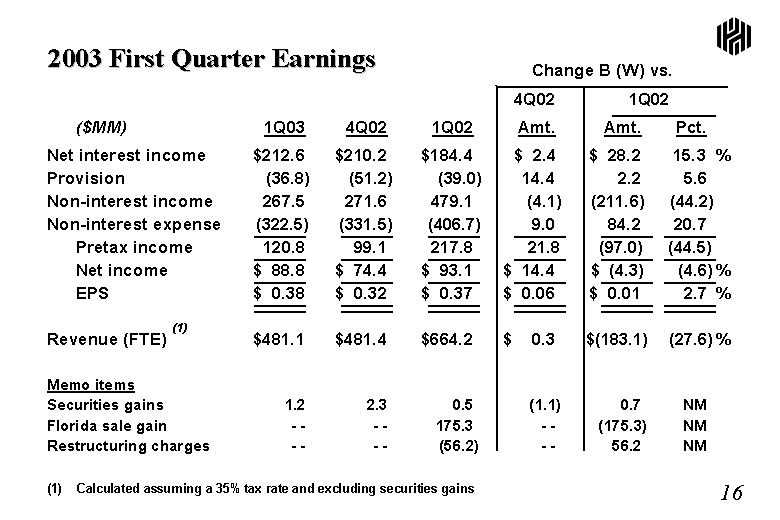
| 2003 First Quarter Earnings Change B (W) vs. 4Q02 1Q02 ($MM) 1Q03 4Q02 1Q02 Amt. Amt. Pct. Net interest income $212.6 $210.2 $184.4 $ 2.4 $ 28.2 15.3 % Provision (36.8) (51.2) (39.0) 14.4 2.2 5.6 Non-interest income 267.5 271.6 479.1 (4.1) (211.6) (44.2) Non-interest expense (322.5) (331.5) (406.7) 9.0 84.2 20.7 Pretax income 120.8 99.1 217.8 21.8 (97.0) (44.5) Net income $ 88.8 $ 74.4 $ 93.1 $ 14.4 $ (4.3) (4.6) % EPS $ 0.38 $ 0.32 $ 0.37 $ 0.06 $ 0.01 2.7 % Revenue (FTE) (1) $481.1 $481.4 $664.2 $ 0.3 $(183.1) (27.6) % Memo items Securities gains 1.2 2.3 0.5 (1.1) 0.7 NM Florida sale gain - - - - 175.3 - - (175.3) NM Restructuring charges - - - - (56.2) - - 56.2 NM (1) Calculated assuming a 35% tax rate and excluding securities gains |
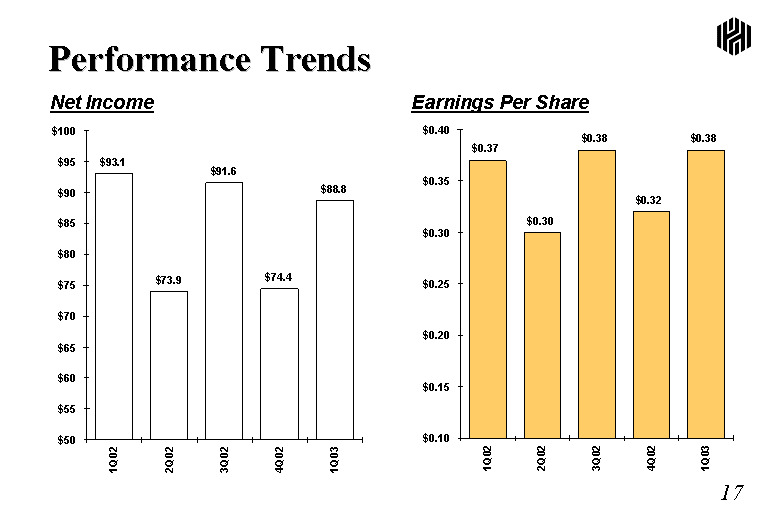
| Performance Trends Net Income Amount 1Q02 0.37 2Q02 0.3 3Q02 0.38 4Q02 0.32 1Q03 0.38 Earnings Per Share Amount 1Q02 93.1 2Q02 73.9 3Q02 91.6 4Q02 74.4 1Q03 88.8 |
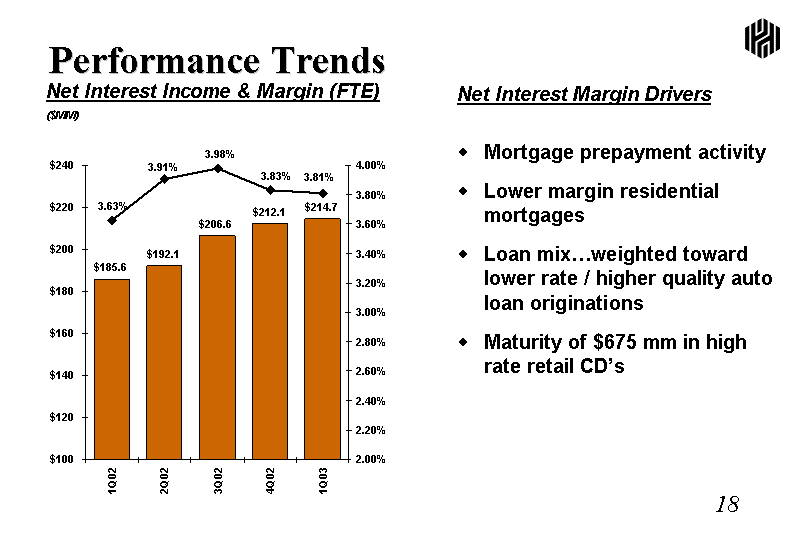
| Performance Trends Net Interest Income & Margin (FTE) Net Interest Margin Drivers Mortgage prepayment activity Lower margin residential mortgages Loan mix...weighted toward lower rate / higher quality auto loan originations Maturity of $675 mm in high rate retail CD's Amount NIM 1Q02 185.6 0.0363 2Q02 192.1 0.0391 3Q02 206.6 0.0398 4Q02 212.1 0.0383 1Q03 214.7 0.0381 ($MM) |
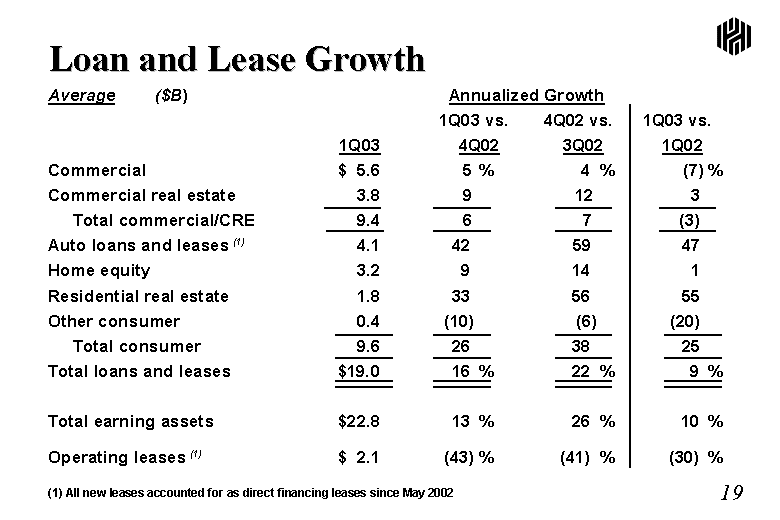
| Loan and Lease Growth Average ($B) Annualized Growth 1Q03 vs. 4Q02 vs. 1Q03 vs. 1Q03 4Q02 3Q02 1Q02 Commercial $ 5.6 5 % 4 % (7) % Commercial real estate 3.8 9 12 3 Total commercial/CRE 9.4 6 7 (3) Auto loans and leases (1) 4.1 42 59 47 Home equity 3.2 9 14 1 Residential real estate 1.8 33 56 55 Other consumer 0.4 (10) (6) (20) Total consumer 9.6 26 38 25 Total loans and leases $19.0 16 % 22 % 9 % Total earning assets $22.8 13 % 26 % 10 % Operating leases (1) $ 2.1 (43) % (41) % (30) % (1) All new leases accounted for as direct financing leases since May 2002 |
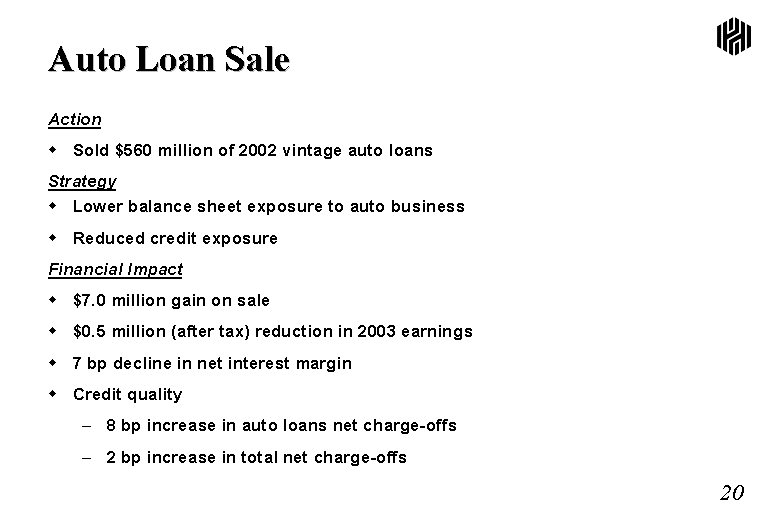
| Auto Loan Sale Action Sold $560 million of 2002 vintage auto loans Strategy Lower balance sheet exposure to auto business Reduced credit exposure Financial Impact $7.0 million gain on sale $0.5 million (after tax) reduction in 2003 earnings 7 bp decline in net interest margin Credit quality 8 bp increase in auto loans net charge-offs 2 bp increase in total net charge-offs |
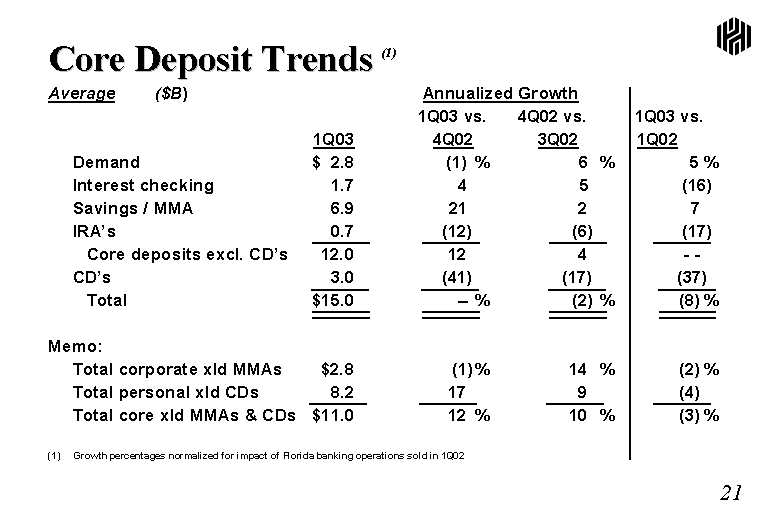
| Core Deposit Trends (1) Average ($B) Annualized Growth 1Q03 vs. 4Q02 vs. 1Q03 vs. 1Q03 4Q02 3Q02 1Q02 Demand $ 2.8 (1) % 6 % 5 % Interest checking 1.7 4 5 (16) Savings / MMA 6.9 21 2 7 IRA's 0.7 (12) (6) (17) Core deposits excl. CD's 12.0 12 4 - - CD's 3.0 (41) (17) (37) Total $15.0 -- % (2) % (8) % Memo: Total corporate xld MMAs $2.8 (1) % 14 % (2) % Total personal xld CDs 8.2 17 9 (4) Total core xld MMAs & CDs $11.0 12 % 10 % (3) % (1) Growth percentages normalized for impact of Florida banking operations sold in 1Q02 |
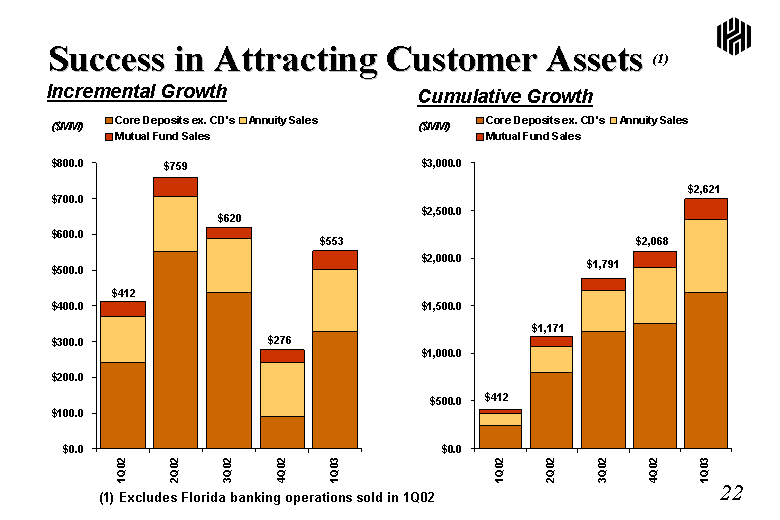
| Success in Attracting Customer Assets (1) Incremental Growth Core Deposits ex. CD's Annuity Sales Mutual Fund Sales 1Q02 241 129.1 41.9 2Q02 552 152.6 54.6 3Q02 436 151.8 32.4 4Q02 90 150.1 36.1 1Q03 327 173.9 52.3 ($MM) ($MM) Core Deposits ex. CD's Annuity Sales Mutual Fund Sales 1Q02 241 129.1 41.9 2Q02 793 281.7 96.5 3Q02 1229 433.5 128.9 4Q02 1319 583.6 165 1Q03 1646 757.5 217.3 Cumulative Growth $412 $759 $276 $620 $553 $412 $1,171 $1,791 $2,068 $2,621 (1) Excludes Florida banking operations sold in 1Q02 |
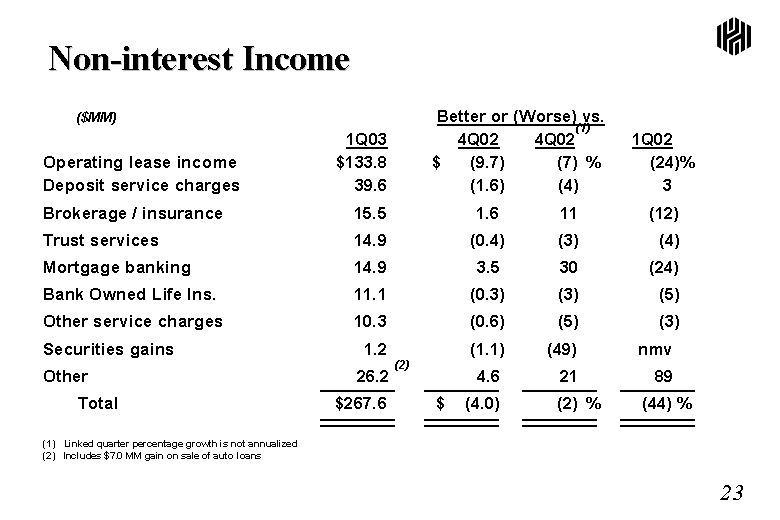
| Non-interest Income ($MM) Better or (Worse) vs. 1Q03 4Q02 4Q02(1) 1Q02 Operating lease income $133.8 $ (9.7) (7) % (24)% Deposit service charges 39.6 (1.6) (4) 3 Brokerage / insurance 15.5 1.6 11 (12) Trust services 14.9 (0.4) (3) (4) Mortgage banking 14.9 3.5 30 (24) Bank Owned Life Ins. 11.1 (0.3) (3) (5) Other service charges 10.3 (0.6) (5) (3) Securities gains 1.2 (1.1) (49) nmv Other 26.2 (2) 4.6 21 89 Total $267.6 $ (4.0) (2) % (44) % (1) Linked quarter percentage growth is not annualized (2) Includes $7.0 MM gain on sale of auto loans |
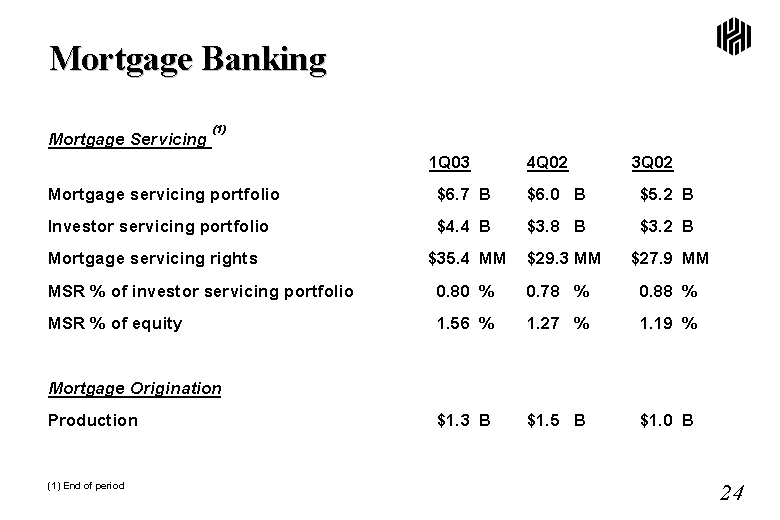
| Mortgage Banking Mortgage Servicing (1) 1Q03 4Q02 3Q02 Mortgage servicing portfolio $6.7 B $6.0 B $5.2 B Investor servicing portfolio $4.4 B $3.8 B $3.2 B Mortgage servicing rights $35.4 MM $29.3 MM $27.9 MM MSR % of investor servicing portfolio 0.80 % 0.78 % 0.88 % MSR % of equity 1.56 % 1.27 % 1.19 % Mortgage Origination Production $1.3 B $1.5 B $1.0 B (1) End of period |
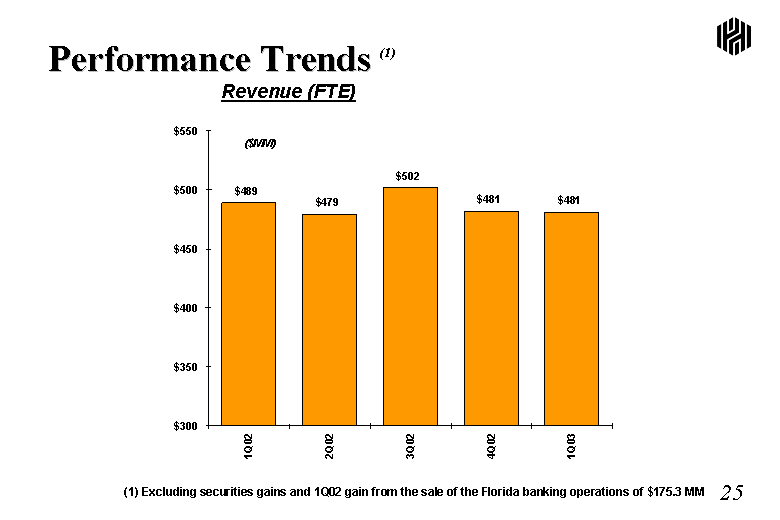
| Performance Trends (1) (1) Excluding securities gains and 1Q02 gain from the sale of the Florida banking operations of $175.3 MM Revenue (FTE) Amount 1Q02 488.9 2Q02 479.1 3Q02 501.5 4Q02 481.4 1Q03 481.1 ($MM) |
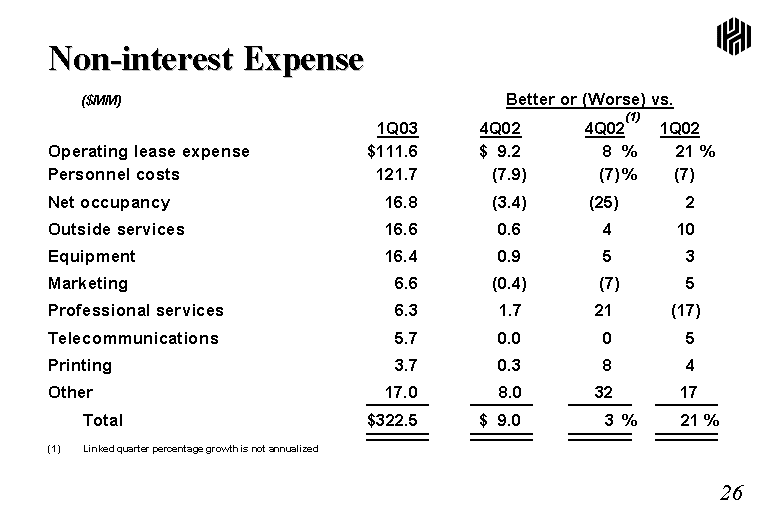
| Non-interest Expense ($MM) Better or (Worse) vs. 1Q03 4Q02 4Q02(1) 1Q02 Operating lease expense $111.6 $ 9.2 8 % 21 % Personnel costs 121.7 (7.9) (7) % (7) Net occupancy 16.8 (3.4) (25) 2 Outside services 16.6 0.6 4 10 Equipment 16.4 0.9 5 3 Marketing 6.6 (0.4) (7) 5 Professional services 6.3 1.7 21 (17) Telecommunications 5.7 0.0 0 5 Printing 3.7 0.3 8 4 Other 17.0 8.0 32 17 Total $322.5 $ 9.0 3 % 21 % (1) Linked quarter percentage growth is not annualized |
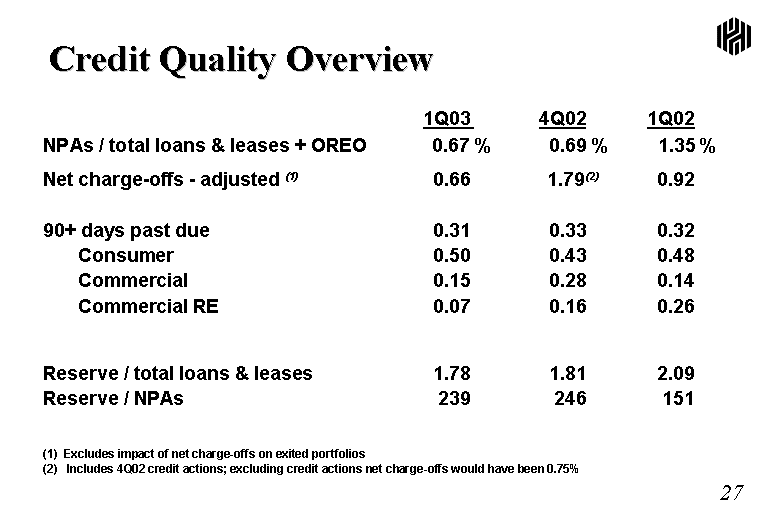
| Credit Quality Overview 1Q03 4Q02 1Q02 NPAs / total loans & leases + OREO 0.67 % 0.69 % 1.35 % Net charge-offs - adjusted (1) 0.66 1.79(2) 0.92 90+ days past due 0.31 0.33 0.32 Consumer 0.50 0.43 0.48 Commercial 0.15 0.28 0.14 Commercial RE 0.07 0.16 0.26 Reserve / total loans & leases 1.78 1.81 2.09 Reserve / NPAs 239 246 151 (1) Excludes impact of net charge-offs on exited portfolios (2) Includes 4Q02 credit actions; excluding credit actions net charge-offs would have been 0.75% |
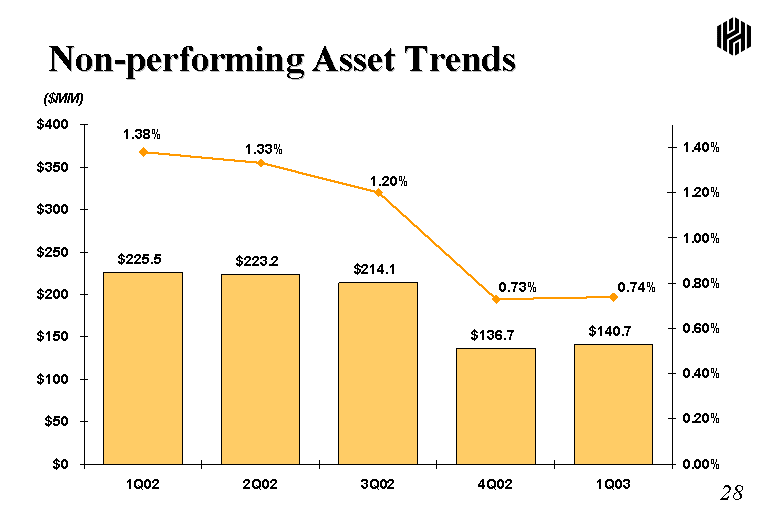
| % Lns + OREO 1Q02 225.53 0.0138 2Q02 223.237 0.0133 3Q02 214.1 0.012 4Q02 136.723 0.0073 1Q03 140.725 0.0074 Non-performing Asset Trends ($MM) |
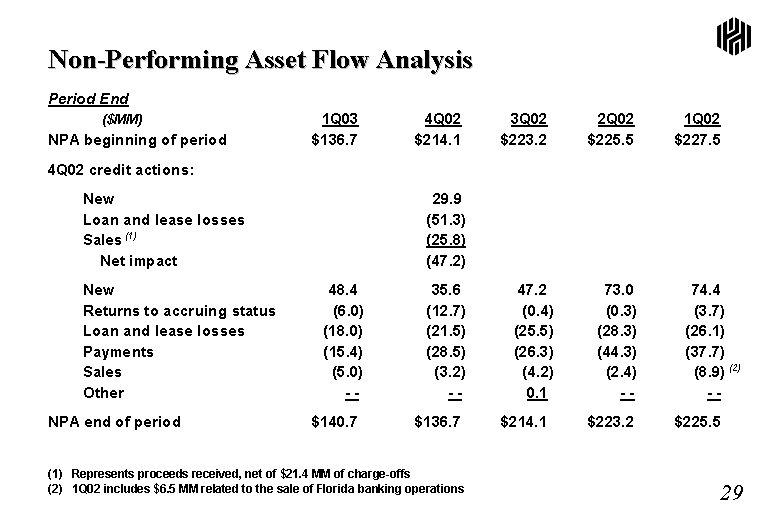
| Non-Performing Asset Flow Analysis Period End ($MM) 1Q03 4Q02 3Q02 2Q02 1Q02 NPA beginning of period $136.7 $214.1 $223.2 $225.5 $227.5 4Q02 credit actions: New 29.9 Loan and lease losses (51.3) Sales (1) (25.8) Net impact (47.2) New 48.4 35.6 47.2 73.0 74.4 Returns to accruing status (6.0) (12.7) (0.4) (0.3) (3.7) Loan and lease losses (18.0) (21.5) (25.5) (28.3) (26.1) Payments (15.4) (28.5) (26.3) (44.3) (37.7) Sales (5.0) (3.2) (4.2) (2.4) (8.9) (2) Other - - - - 0.1 - - - - NPA end of period $140.7 $136.7 $214.1 $223.2 $225.5 (1) Represents proceeds received, net of $21.4 MM of charge-offs (2) 1Q02 includes $6.5 MM related to the sale of Florida banking operations |
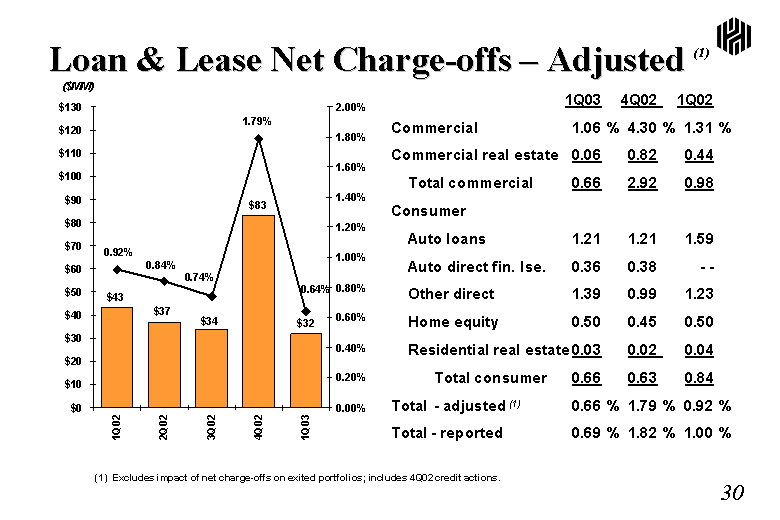
| Amount Percent 1Q02 43 0.0092 2Q02 37 0.0084 3Q02 33.8 0.0074 4Q02 83.2 0.0179 1Q03 31.9 0.0064 ($MM) 1Q03 4Q02 1Q02 Commercial 1.06 % 4.30 % 1.31 % Commercial real estate 0.06 0.82 0.44 Total commercial 0.66 2.92 0.98 Consumer Auto loans 1.21 1.21 1.59 Auto direct fin. lse. 0.36 0.38 - - Other direct 1.39 0.99 1.23 Home equity 0.50 0.45 0.50 Residential real estate 0.03 0.02 0.04 Total consumer 0.66 0.63 0.84 Total - adjusted (1) 0.66 % 1.79 % 0.92 % Total - reported 0.69 % 1.82 % 1.00 % (1) Excludes impact of net charge-offs on exited portfolios; includes 4Q02 credit actions. Loan & Lease Net Charge-offs - Adjusted (1) |
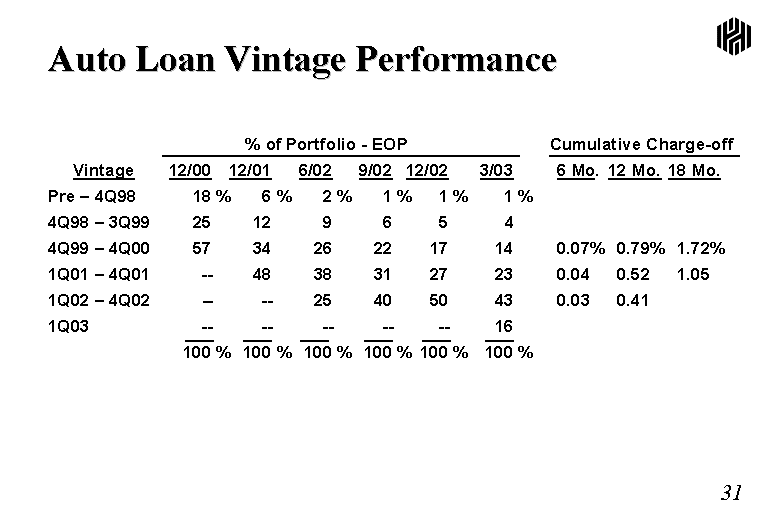
| Auto Loan Vintage Performance % of Portfolio - EOP Cumulative Charge-off Vintage 12/00 12/01 6/02 9/02 12/02 3/03 6 Mo. 12 Mo. 18 Mo. Pre - 4Q98 18 % 6 % 2 % 1 % 1 % 1 % 4Q98 - 3Q99 25 12 9 6 5 4 4Q99 - 4Q00 57 34 26 22 17 14 0.07% 0.79% 1.72% 1Q01 - 4Q01 -- 48 38 31 27 23 0.04 0.52 1.05 1Q02 - 4Q02 -- -- 25 40 50 43 0.03 0.41 1Q03 -- -- -- -- -- 16 100 % 100 % 100 % 100 % 100 % 100 % |
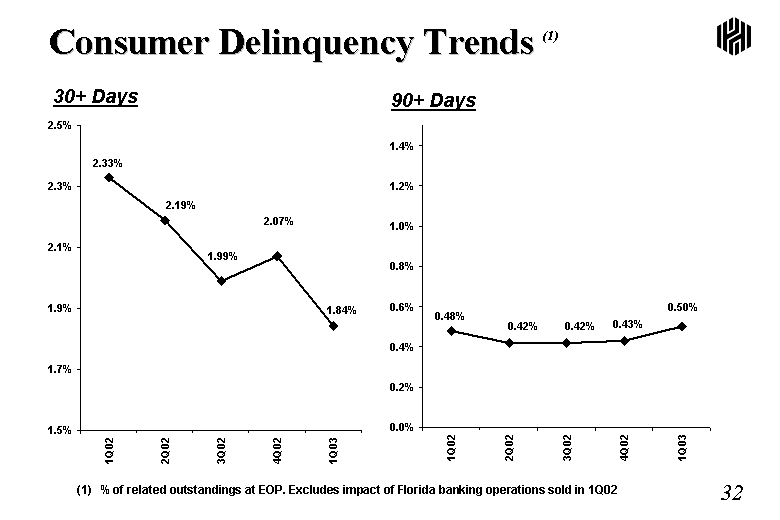
| Consumer Delinquency Trends (1) 30+ Days 1Q02 0.0233 2Q02 0.0219 3Q02 0.0199 4Q02 0.0207 1Q03 0.0184 90+ Days 1Q02 0.0048 2Q02 0.0042 3Q02 0.0042 4Q02 0.0043 1Q03 0.005 (1) % of related outstandings at EOP. Excludes impact of Florida banking operations sold in 1Q02 |
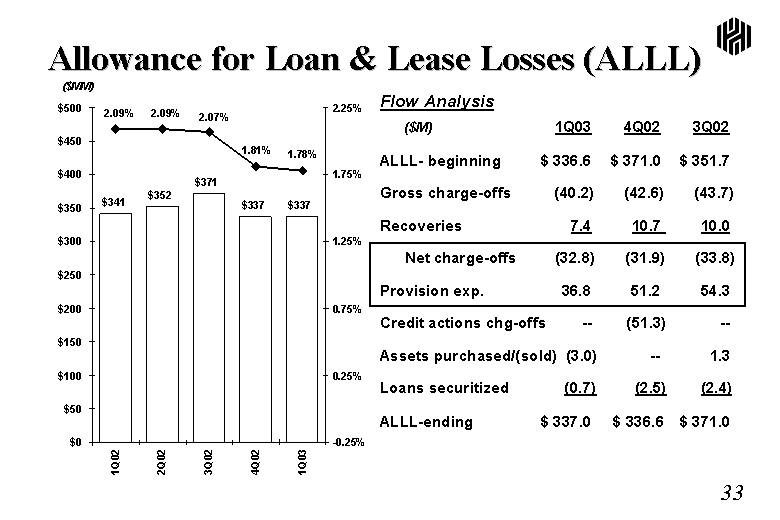
| Amount Percent 1Q02 340.9 0.0209 2Q02 351.7 0.0209 3Q02 371 0.0207 4Q02 336.6 0.0181 1Q03 337 0.0178 ($MM) Allowance for Loan & Lease Losses (ALLL) Flow Analysis ($M) 1Q03 4Q02 3Q02 ALLL- beginning $ 336.6 $ 371.0 $ 351.7 Gross charge-offs (40.2) (42.6) (43.7) Recoveries 7.4 10.7 10.0 Net charge-offs (32.8) (31.9) (33.8) Provision exp. 36.8 51.2 54.3 Credit actions chg-offs -- (51.3) -- Assets purchased/(sold) (3.0) -- 1.3 Loans securitized (0.7) (2.5) (2.4) ALLL-ending $ 337.0 $ 336.6 $ 371.0 |
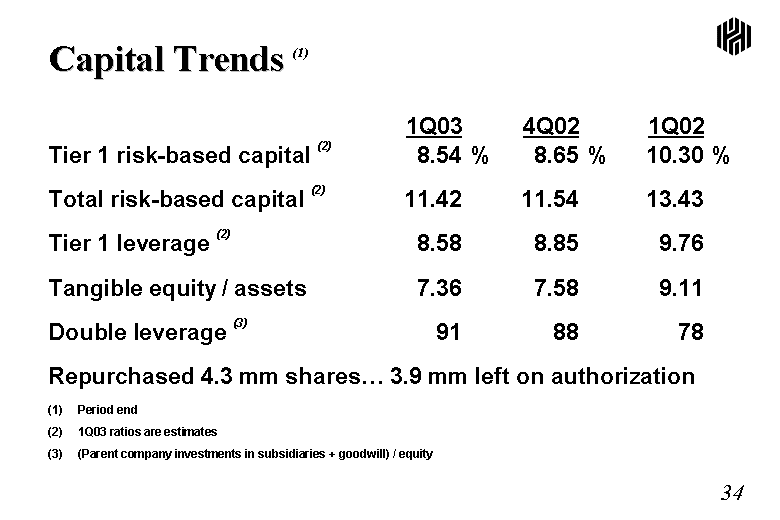
| Capital Trends (1) 1Q03 4Q02 1Q02 Tier 1 risk-based capital (2) 8.54 % 8.65 % 10.30 % Total risk-based capital (2) 11.42 11.54 13.43 Tier 1 leverage (2) 8.58 8.85 9.76 Tangible equity / assets 7.36 7.58 9.11 Double leverage (3) 91 88 78 Repurchased 4.3 mm shares... 3.9 mm left on authorization (1) Period end (2) 1Q03 ratios are estimates (3) (Parent company investments in subsidiaries + goodwill) / equity |

| 2003 Outlook |
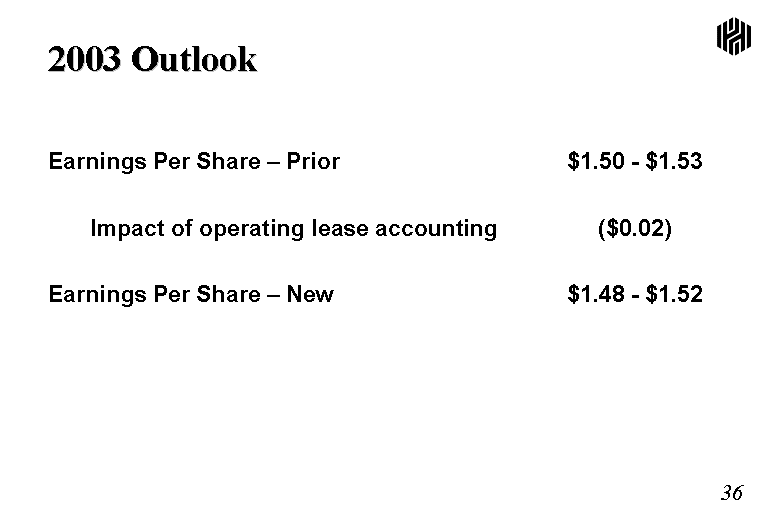
| 2003 Outlook Earnings Per Share - Prior $1.50 - $1.53 Impact of operating lease accounting ($0.02) Earnings Per Share - New $1.48 - $1.52 |

| PRIVATE SECURITIES LITIGATION REFORM ACT OF 1995 FORWARD LOOKING STATEMENT DISCLOSURE This presentation and discussion, including related questions and answers, may contain forward-looking statements, including certain plans, expectations, goals, and projections which are subject to numerous assumptions, risks, and uncertainties. A number of factors, including but not limited to those set forth under the heading "Business Risks" included in Item 1 of Huntington's Annual Report on Form 10-K/A for the year ended December 31, 2002, and other factors described from time to time in Huntington's other filings with the Securities and Exchange Commission, could cause actual conditions, events, or results to differ significantly from those described in the forward-looking statements. All forward-looking statements included in this discussion, including related questions and answers, are based on information available at the time of the discussion. Huntington assumes no obligation to update any forward-looking statement. |

| Appendix |
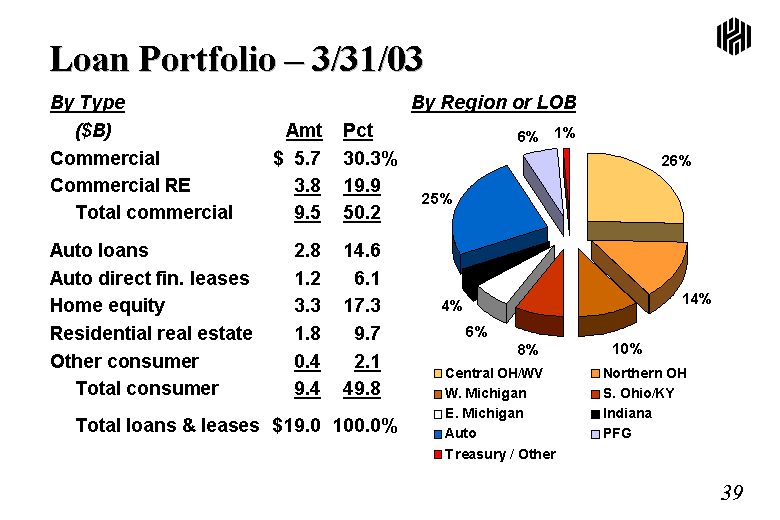
| Loan Portfolio - 3/31/03 By Region or LOB 1Q03 Central OH/WV 0.255 Northern OH 0.143 W. Michigan 0.103 S. Ohio/KY 0.082 E. Michigan 0.064 Indiana 0.037 Auto 0.248 PFG 0.059 Treasury / Other 0.01 By Type ($B) Amt Pct Commercial $ 5.7 30.3% Commercial RE 3.8 19.9 Total commercial 9.5 50.2 Auto loans 2.8 14.6 Auto direct fin. leases 1.2 6.1 Home equity 3.3 17.3 Residential real estate 1.8 9.7 Other consumer 0.4 2.1 Total consumer 9.4 49.8 Total loans & leases $19.0 100.0% |
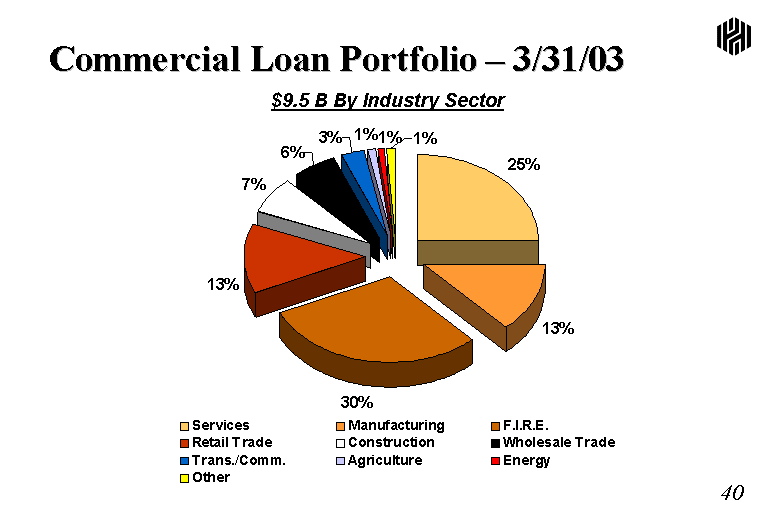
| Commercial Loan Portfolio - 3/31/03 $9.5 B By Industry Sector Services 0.25 Manufacturing 0.13 F.I.R.E. 0.3 Retail Trade 0.13 Construction 0.07 Wholesale Trade 0.06 Trans./Comm. 0.03 Agriculture 0.01 Energy 0.01 Other 0.01 |
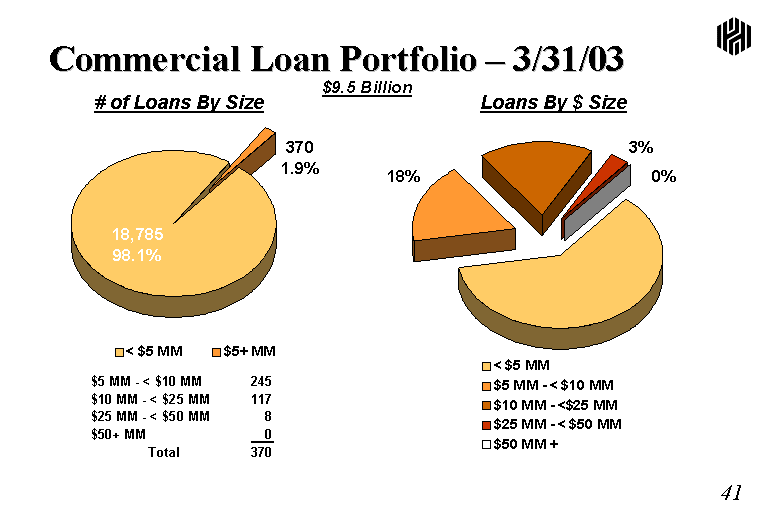
| < $5 MM 18785 $5+ MM 370 $5 MM - < $10 MM 245 $10 MM - < $25 MM 117 $25 MM - < $50 MM 8 $50+ MM 0 Total 370 < $5 MM 0.61 $5 MM - < $10 MM 0.18 $10 MM - <$25 MM 0.18 $25 MM - < $50 MM 0.03 $50 MM + 0 Commercial Loan Portfolio - 3/31/03 # of Loans By Size 18,785 98.1% 370 1.9% Loans By $ Size 61% 3% $9.5 Billion 18% 18% 0% |
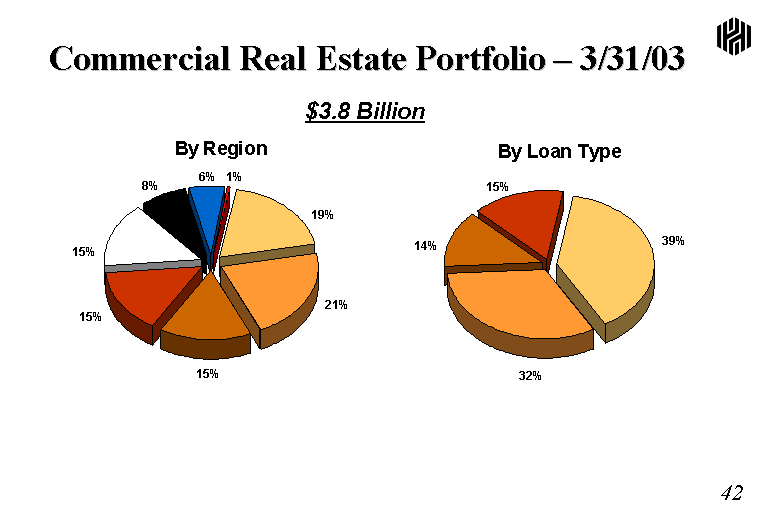
| Columbus Cleveland Cincinnati W. MI E. MI WV ID FL 0.191 0.215 0.154 0.15 0.151 0.078 0.058 0.006 Commercial Real Estate Portfolio - 3/31/03 Construction Owner Occupied Mini-Perm Permanent 0.389 0.324 0.135 0.152 Cincinnati Columbus W. Michigan E. Michigan W. Virginia Indiana Cleveland Permanent Mini-perm Owner Occupied Construction $3.8 Billion Florida |
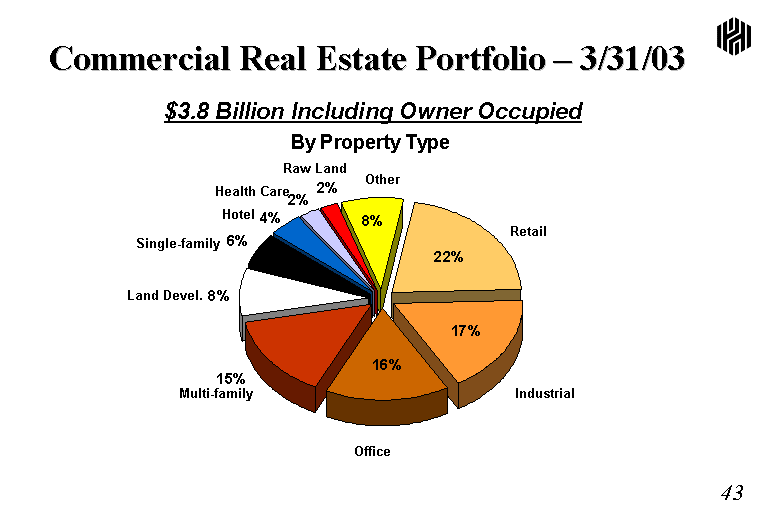
| Commercial Real Estate Portfolio - 3/31/03 Retail Industrial Office Multifamily Land Devel Single-family Hotel Health Care Raw Land Other 0.218 0.171 0.156 0.148 0.083 0.056 0.044 0.023 0.024 0.077 Retail Industrial Office Multi-family Land Devel. Hotel Single-family Health Care Other $3.8 Billion Including Owner Occupied Raw Land |
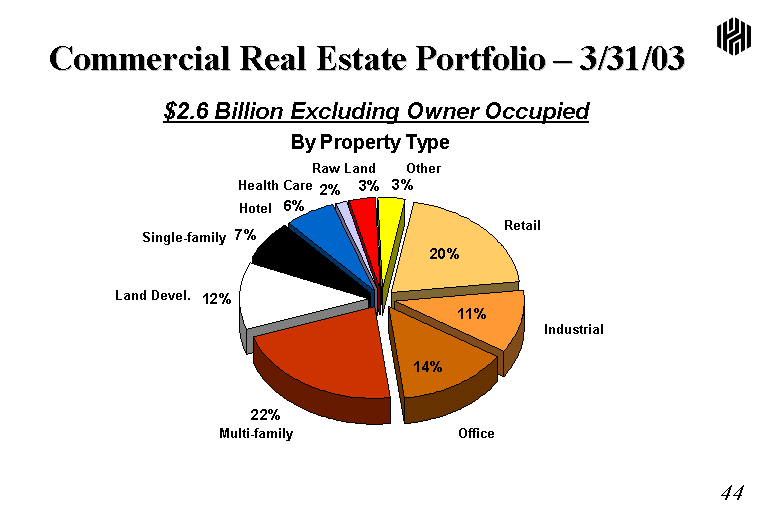
| Commercial Real Estate Portfolio - 3/31/03 Retail Industrial Office Multifamily Land Devel Single-family Hotel Health Care Raw Land Other 0.201 0.112 0.138 0.214 0.118 0.069 0.062 0.016 0.031 0.034 Retail Industrial Office Multi-family Land Devel. Hotel Single-family Health Care Other $2.6 Billion Excluding Owner Occupied Raw Land |
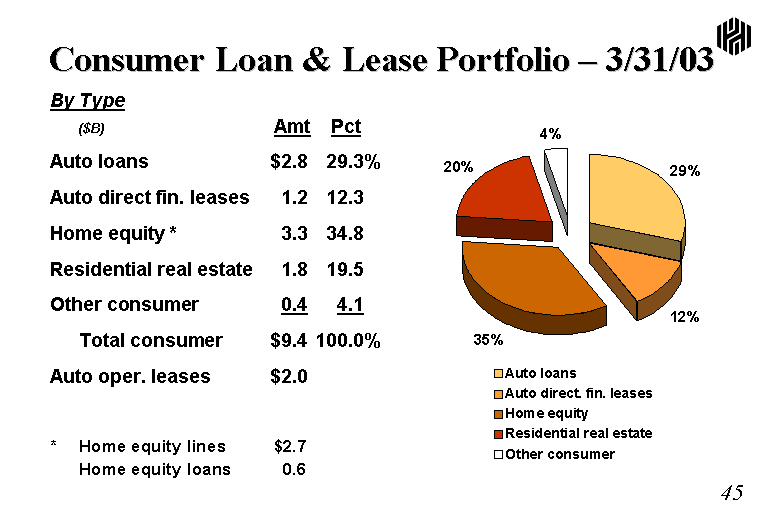
| 1Q03 Auto loans 0.293 Auto direct. fin. leases 0.123 Home equity 0.348 Residential real estate 0.195 Other consumer 0.04 Consumer Loan & Lease Portfolio - 3/31/03 By Type ($B) Amt Pct Auto loans $2.8 29.3% Auto direct fin. leases 1.2 12.3 Home equity * 3.3 34.8 Residential real estate 1.8 19.5 Other consumer 0.4 4.1 Total consumer $9.4 100.0% Auto oper. leases $2.0 * Home equity lines $2.7 Home equity loans 0.6 |
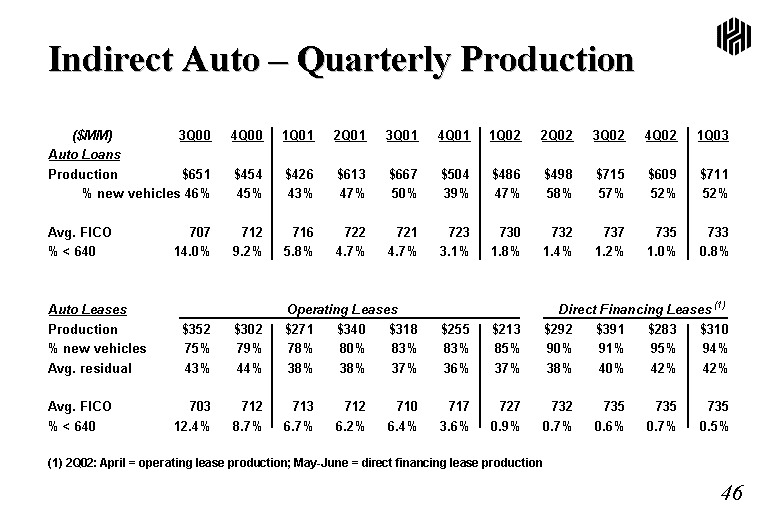
| Indirect Auto - Quarterly Production ($MM) 3Q00 4Q00 1Q01 2Q01 3Q01 4Q01 1Q02 2Q02 3Q02 4Q02 1Q03 Auto Loans Production $651 $454 $426 $613 $667 $504 $486 $498 $715 $609 $711 % new vehicles 46% 45% 43% 47% 50% 39% 47% 58% 57% 52% 52% Avg. FICO 707 712 716 722 721 723 730 732 737 735 733 % < 640 14.0% 9.2% 5.8% 4.7% 4.7% 3.1% 1.8% 1.4% 1.2% 1.0% 0.8% Auto Leases Operating Leases Direct Financing Leases (1) Production $352 $302 $271 $340 $318 $255 $213 $292 $391 $283 $310 % new vehicles 75% 79% 78% 80% 83% 83% 85% 90% 91% 95% 94% Avg. residual 43% 44% 38% 38% 37% 36% 37% 38% 40% 42% 42% Avg. FICO 703 712 713 712 710 717 727 732 735 735 735 % < 640 12.4% 8.7% 6.7% 6.2% 6.4% 3.6% 0.9% 0.7% 0.6% 0.7% 0.5% (1) 2Q02: April = operating lease production; May-June = direct financing lease production |
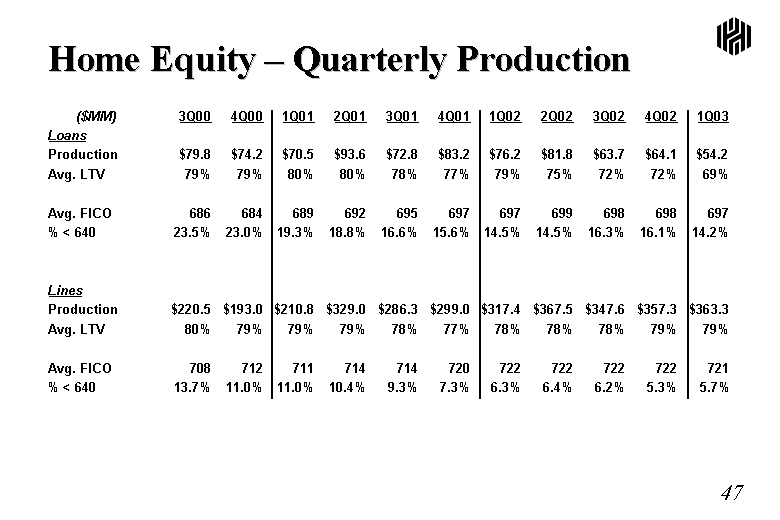
| Home Equity - Quarterly Production ($MM) 3Q00 4Q00 1Q01 2Q01 3Q01 4Q01 1Q02 2Q02 3Q02 4Q02 1Q03 Loans Production $79.8 $74.2 $70.5 $93.6 $72.8 $83.2 $76.2 $81.8 $63.7 $64.1 $54.2 Avg. LTV 79% 79% 80% 80% 78% 77% 79% 75% 72% 72% 69% Avg. FICO 686 684 689 692 695 697 697 699 698 698 697 % < 640 23.5% 23.0% 19.3% 18.8% 16.6% 15.6% 14.5% 14.5% 16.3% 16.1% 14.2% Lines Production $220.5 $193.0 $210.8 $329.0 $286.3 $299.0 $317.4 $367.5 $347.6 $357.3 $363.3 Avg. LTV 80% 79% 79% 79% 78% 77% 78% 78% 78% 79% 79% Avg. FICO 708 712 711 714 714 720 722 722 722 722 721 % < 640 13.7% 11.0% 11.0% 10.4% 9.3% 7.3% 6.3% 6.4% 6.2% 5.3% 5.7% |
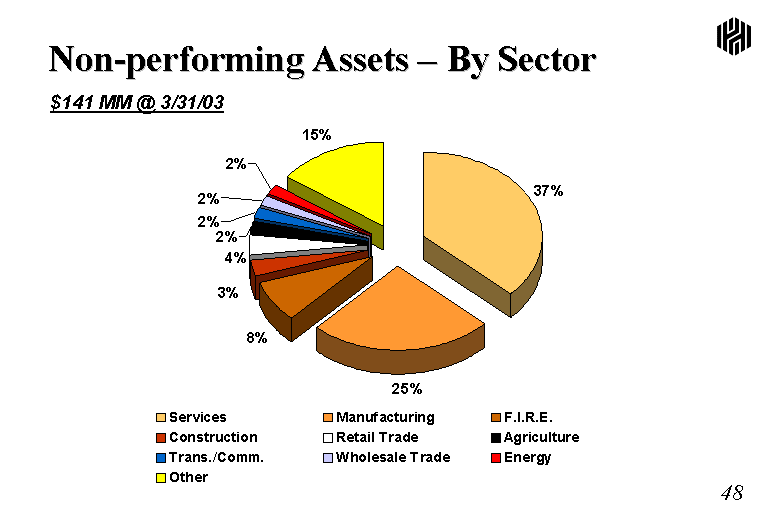
| Non-performing Assets - By Sector Services 0.37 Manufacturing 0.25 F.I.R.E. 0.08 Construction 0.03 Retail Trade 0.04 Agriculture 0.02 Trans./Comm. 0.02 Wholesale Trade 0.02 Energy 0.02 Other 0.15 $141 MM @ 3/31/03 |
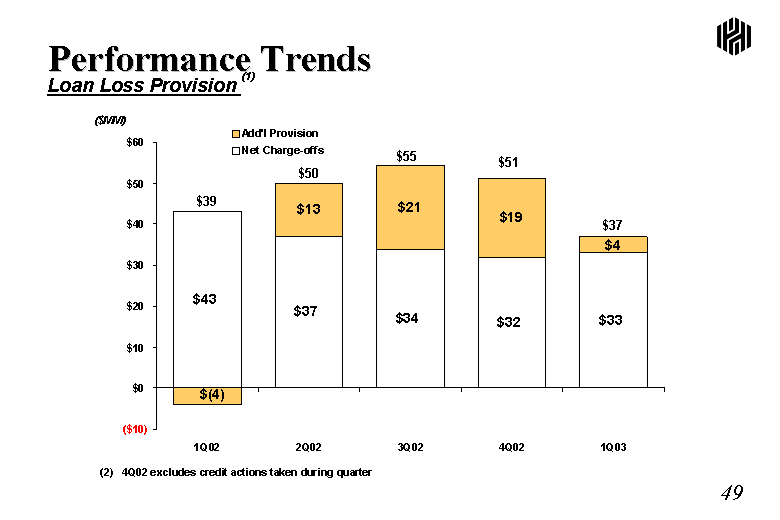
| Performance Trends Loan Loss Provision (1) (2) 4Q02 excludes credit actions taken during quarter Net Charge-offs Add'l Provision 1Q02 43 -4 2Q02 37 12.9 3Q02 33.8 20.5 4Q02 31.9 19.3 1Q03 33 3.9 ($MM) $50 $55 $51 $37 $39 |
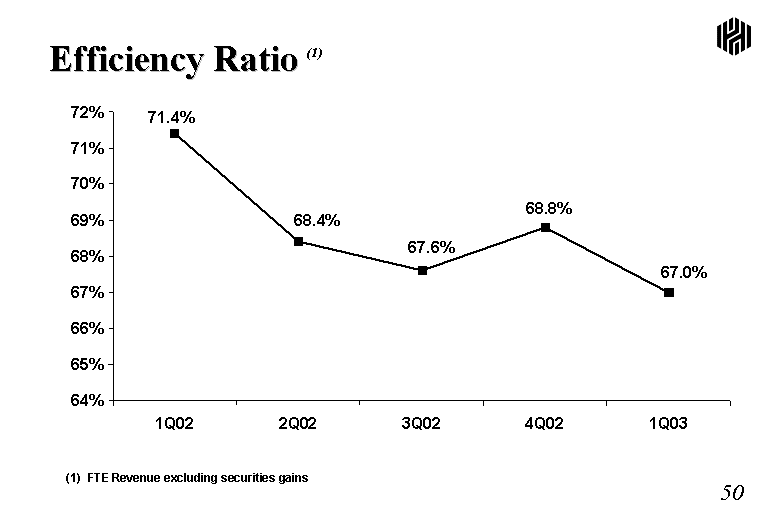
| Amount 1Q02 0.714 2Q02 0.684 3Q02 0.676 4Q02 0.688 1Q03 0.67 Efficiency Ratio (1) (1) FTE Revenue excluding securities gains |
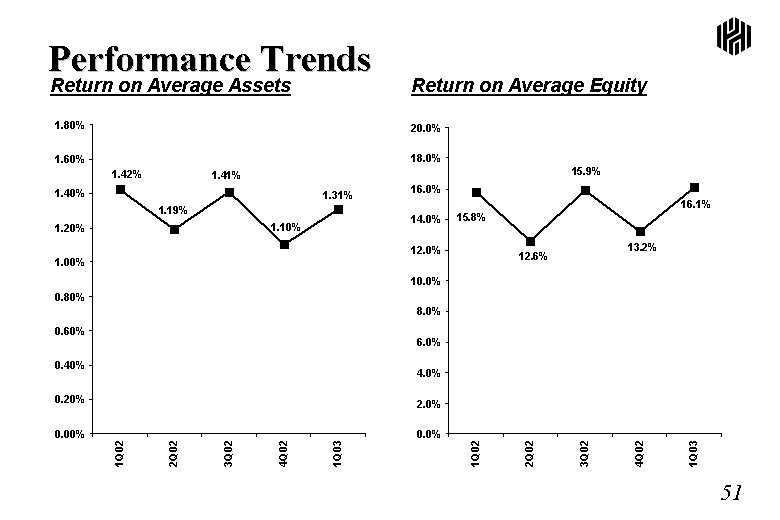
| Performance Trends Return on Average Assets Return on Average Equity Amount 1Q02 0.0142 2Q02 0.0119 3Q02 0.0141 4Q02 0.011 1Q03 0.0131 Return on Common Equity 1Q02 0.158 2Q02 0.126 3Q02 0.159 4Q02 0.132 1Q03 0.161 |
