EX-99.1
Published on August 11, 2011
Exhibit 99.1

| 2011 Third Quarter Investor Handout August 11, 2011 1 |
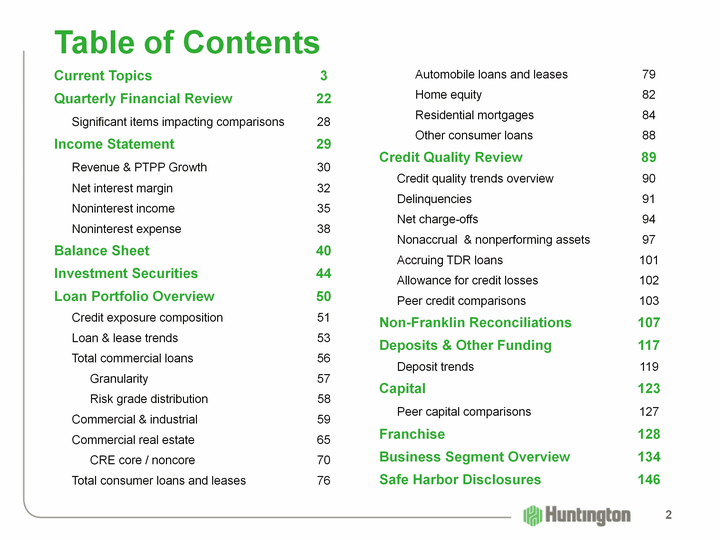
| Table of Contents Current Topics 3 Quarterly Financial Review 22 Significant items impacting comparisons 28 Income Statement 29 Revenue & PTPP Growth 30 Net interest margin 32 Noninterest income 35 Noninterest expense 38 Balance Sheet 40 Investment Securities 44 Loan Portfolio Overview 50 Credit exposure composition 51 Loan & lease trends 53 Total commercial loans 56 Granularity 57 Risk grade distribution 58 Commercial & industrial 59 Commercial real estate 65 CRE core / noncore 70 Total consumer loans and leases 76 Automobile loans and leases 79 Home equity 82 Residential mortgages 84 Other consumer loans 88 Credit Quality Review 89 Credit quality trends overview 90 Delinquencies 91 Net charge-offs 94 Nonaccrual & nonperforming assets 97 Accruing TDR loans 101 Allowance for credit losses 102 Peer credit comparisons 103 Non-Franklin Reconciliations 107 Deposits & Other Funding 117 Deposit trends 119 Capital 123 Peer capital comparisons 127 Franchise 128 Business Segment Overview 134 Safe Harbor Disclosures 146 2 |

| Current Topics 3 |

| Current Topics Strategic Plan Review OCR / "Fair Play" Progress Report Automobile Lending Review 4 |
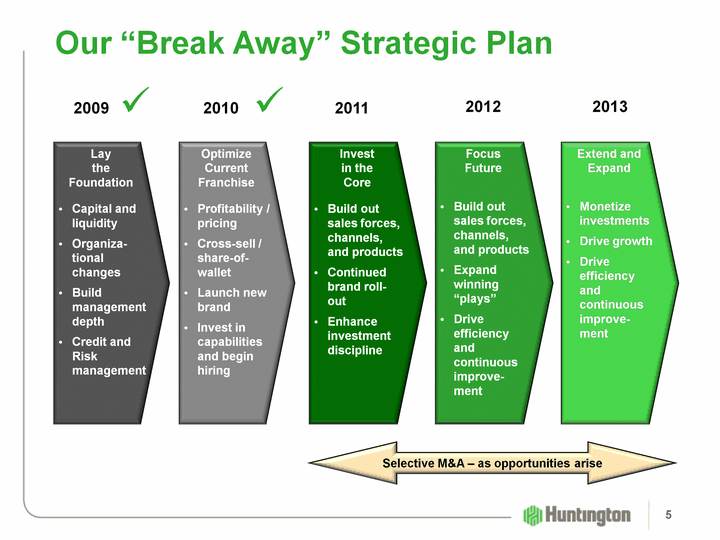
| Optimize Current Franchise Profitability / pricing Cross-sell / share-of- wallet Launch new brand Invest in capabilities and begin hiring Our "Break Away" Strategic Plan Lay the Foundation Capital and liquidity Organiza- tional changes Build management depth Credit and Risk management Invest in the Core Build out sales forces, channels, and products Continued brand roll- out Enhance investment discipline Selective M&A - as opportunities arise 2009 Focus Future Build out sales forces, channels, and products Expand winning "plays" Drive efficiency and continuous improve- ment Extend and Expand Monetize investments Drive growth Drive efficiency and continuous improve- ment 2010 2011 2012 2013 5 |
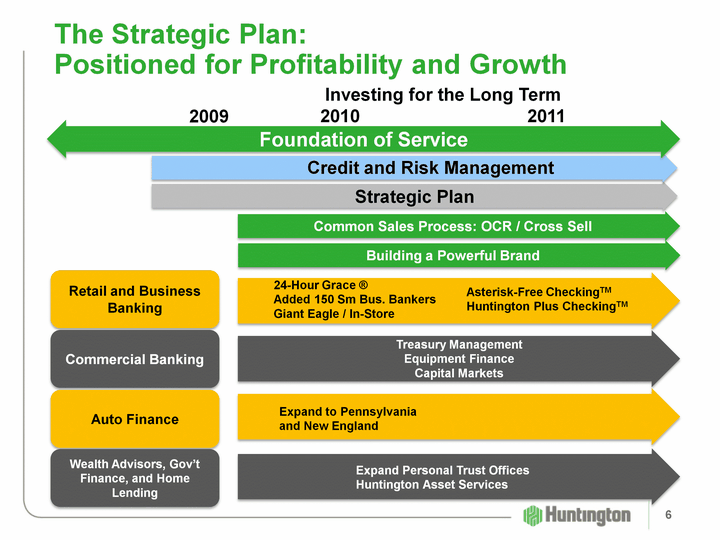
| The Strategic Plan: Positioned for Profitability and Growth Retail and Business Banking Commercial Banking Auto Finance Wealth Advisors, Gov't Finance, and Home Lending Investing for the Long Term 2010 2011 2009 Credit and Risk Management Strategic Plan 24-Hour Grace (r) Added 150 Sm Bus. Bankers Giant Eagle / In-Store Asterisk-Free CheckingTM Huntington Plus CheckingTM Treasury Management Equipment Finance Capital Markets Expand to Pennsylvania and New England Expand Personal Trust Offices Huntington Asset Services Foundation of Service Common Sales Process: OCR / Cross Sell Building a Powerful Brand 6 |
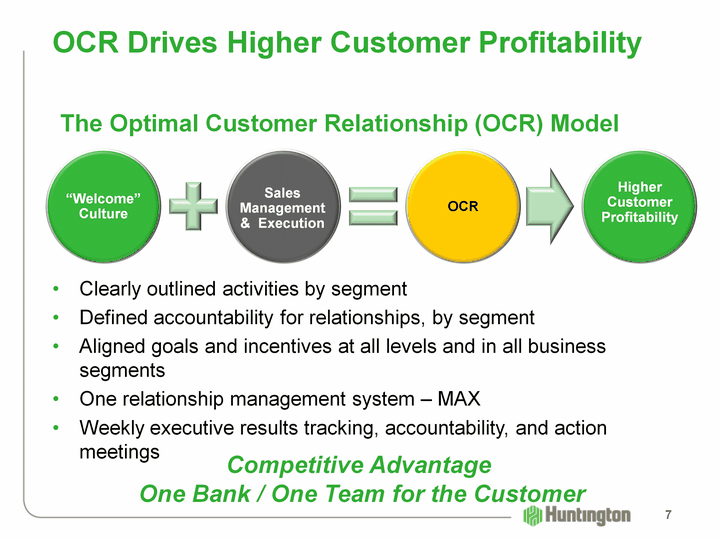
| OCR Drives Higher Customer Profitability Clearly outlined activities by segment Defined accountability for relationships, by segment Aligned goals and incentives at all levels and in all business segments One relationship management system - MAX Weekly executive results tracking, accountability, and action meetings Competitive Advantage One Bank / One Team for the Customer The Optimal Customer Relationship (OCR) Model "Welcome" Culture Sales Management & Execution OCR Higher Customer Profitability 7 |
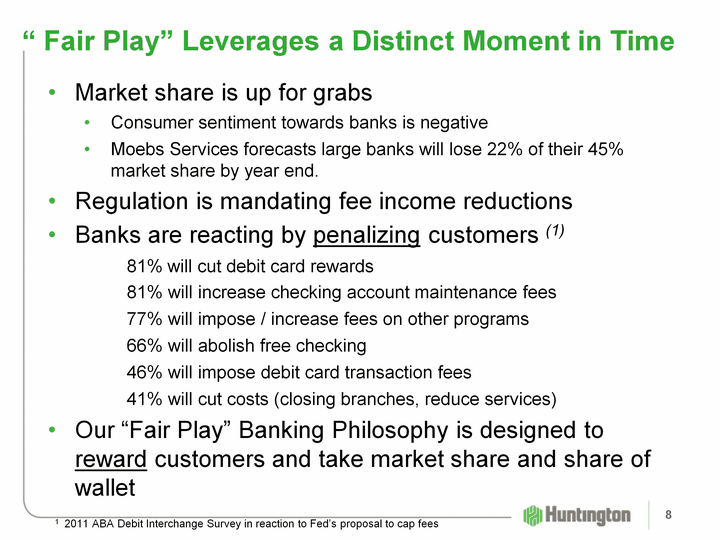
| " Fair Play" Leverages a Distinct Moment in Time Market share is up for grabs Consumer sentiment towards banks is negative Moebs Services forecasts large banks will lose 22% of their 45% market share by year end. Regulation is mandating fee income reductions Banks are reacting by penalizing customers (1) Our "Fair Play" Banking Philosophy is designed to reward customers and take market share and share of wallet 8 1 2011 ABA Debit Interchange Survey in reaction to Fed's proposal to cap fees 81% will cut debit card rewards 81% will increase checking account maintenance fees 77% will impose / increase fees on other programs 66% will abolish free checking 46% will impose debit card transaction fees 41% will cut costs (closing branches, reduce services) 8 |
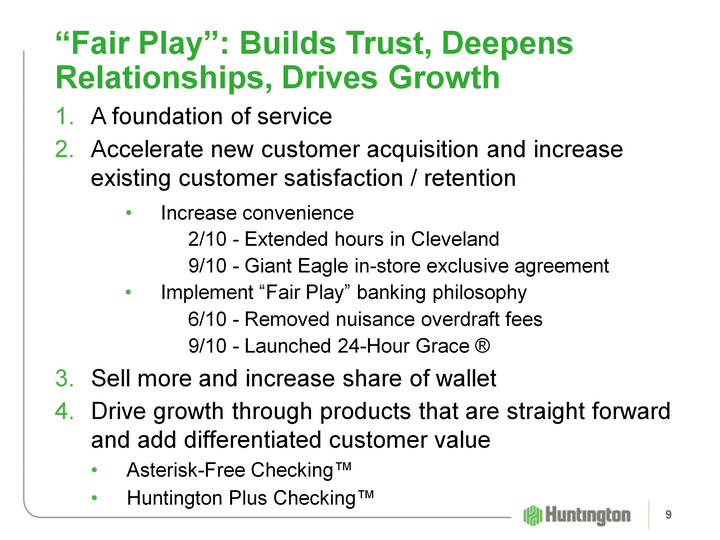
| "Fair Play": Builds Trust, Deepens Relationships, Drives Growth A foundation of service Accelerate new customer acquisition and increase existing customer satisfaction / retention Sell more and increase share of wallet Drive growth through products that are straight forward and add differentiated customer value Asterisk-Free Checking(tm) Huntington Plus Checking(tm) 9 Increase convenience Increase convenience 2/10 - Extended hours in Cleveland 9/10 - Giant Eagle in-store exclusive agreement Implement "Fair Play" banking philosophy Implement "Fair Play" banking philosophy 6/10 - Removed nuisance overdraft fees 9/10 - Launched 24-Hour Grace (r) 9 |
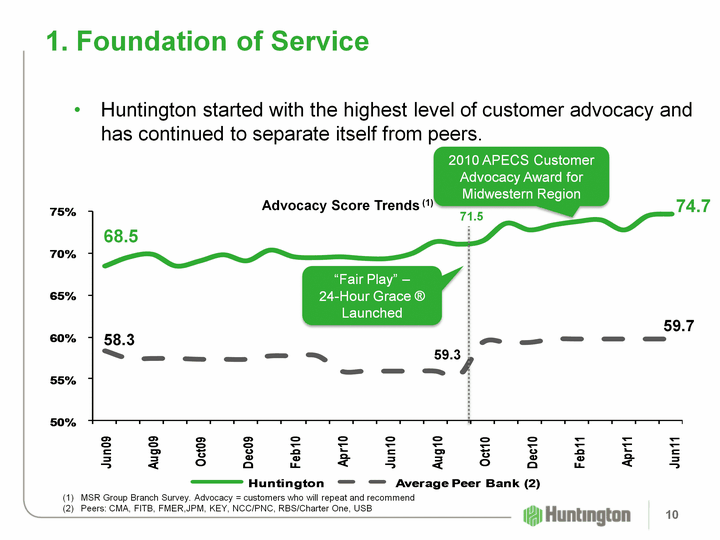
| 1. Foundation of Service Huntington started with the highest level of customer advocacy and has continued to separate itself from peers. MSR Group Branch Survey. Advocacy = customers who will repeat and recommend Peers: CMA, FITB, FMER,JPM, KEY, NCC/PNC, RBS/Charter One, USB Advocacy Score Trends (1) 68.5 74.7 59.7 58.3 71.5 59.3 2010 APECS Customer Advocacy Award for Midwestern Region "Fair Play" - 24-Hour Grace (r) Launched 10 |
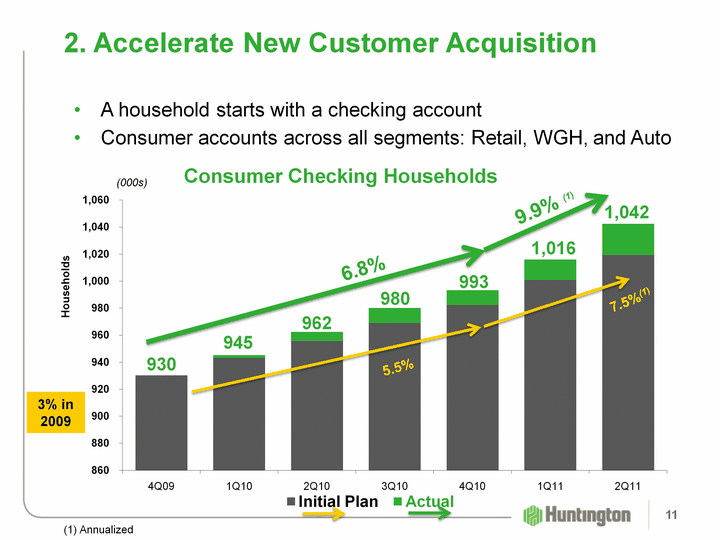
| (CHART) 2. Accelerate New Customer Acquisition Consumer Checking Households 6.8% 9.9% (1) (1) Annualized A household starts with a checking account Consumer accounts across all segments: Retail, WGH, and Auto 3% in 2009 1,042 993 980 962 945 930 5.5% 7.5%(1) (000s) 11 |
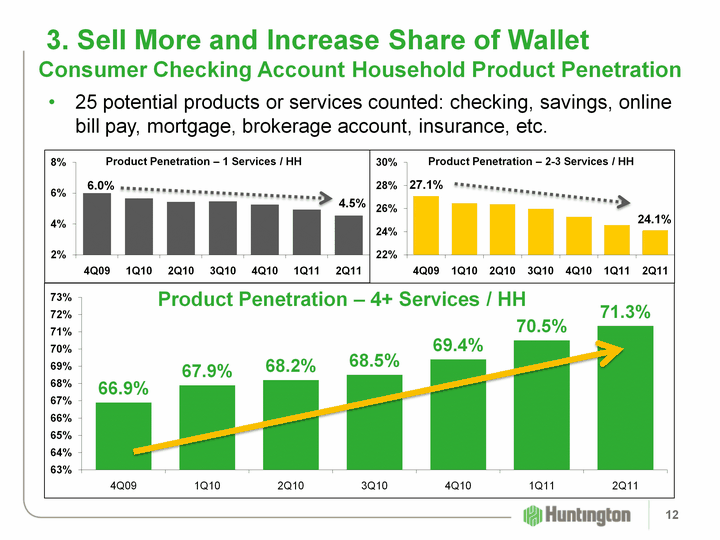
| (CHART) 3. Sell More and Increase Share of Wallet Consumer Checking Account Household Product Penetration Product Penetration - 4+ Services / HH 25 potential products or services counted: checking, savings, online bill pay, mortgage, brokerage account, insurance, etc. (CHART) (CHART) Product Penetration - 1 Services / HH Product Penetration - 2-3 Services / HH 12 |
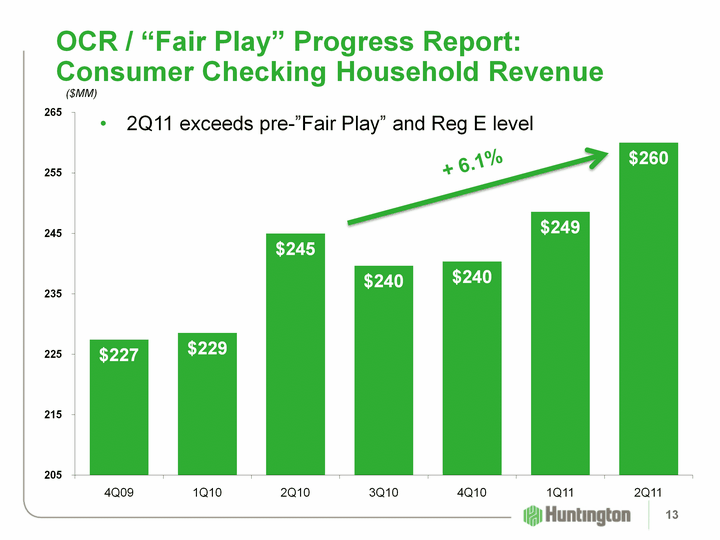
| (CHART) OCR / "Fair Play" Progress Report: Consumer Checking Household Revenue + 6.1% ($MM) 2Q11 exceeds pre-"Fair Play" and Reg E level 13 |
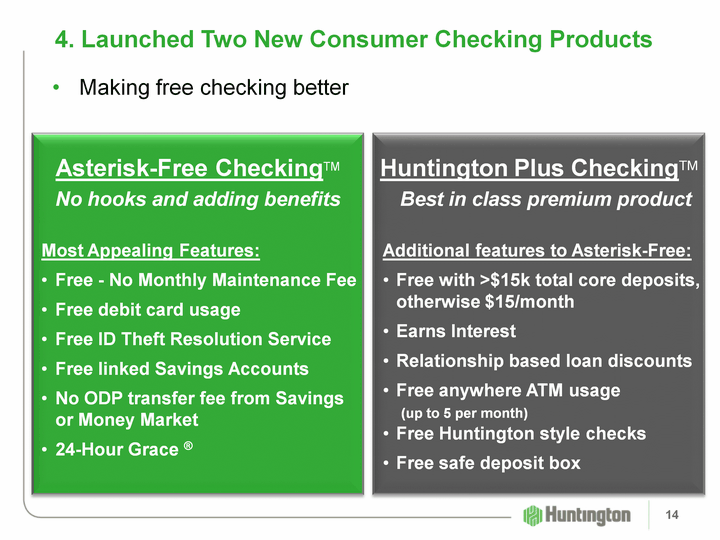
| Making free checking better 4. Launched Two New Consumer Checking Products Asterisk-Free CheckingTM No hooks and adding benefits Most Appealing Features: Free - No Monthly Maintenance Fee Free debit card usage Free ID Theft Resolution Service Free linked Savings Accounts No ODP transfer fee from Savings or Money Market 24-Hour Grace (r) Huntington Plus CheckingTM Best in class premium product Additional features to Asterisk-Free: Free with >$15k total core deposits, otherwise $15/month Earns Interest Relationship based loan discounts Free anywhere ATM usage (up to 5 per month) Free Huntington style checks Free safe deposit box 14 |
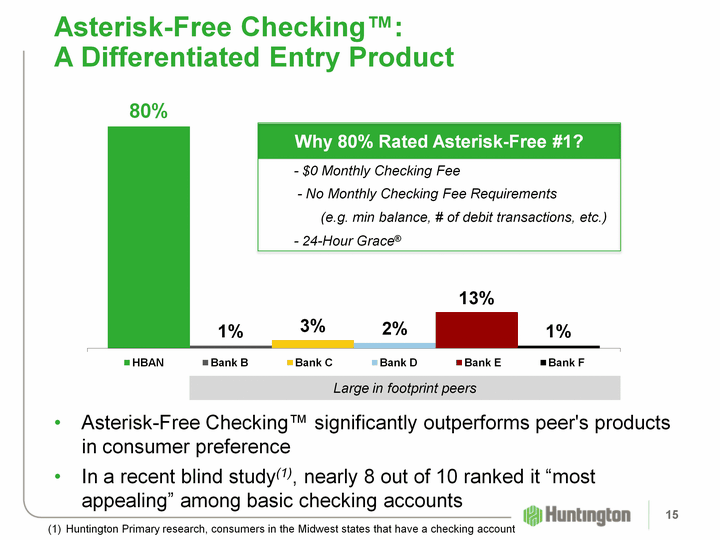
| Why 80% Rated Asterisk-Free #1? - $0 Monthly Checking Fee - No Monthly Checking Fee Requirements (e.g. min balance, # of debit transactions, etc.) - 24-Hour Grace(r) (CHART) Asterisk-Free Checking(tm): A Differentiated Entry Product Asterisk-Free Checking(tm) significantly outperforms peer's products in consumer preference In a recent blind study(1), nearly 8 out of 10 ranked it "most appealing" among basic checking accounts Large in footprint peers Huntington Primary research, consumers in the Midwest states that have a checking account 15 |
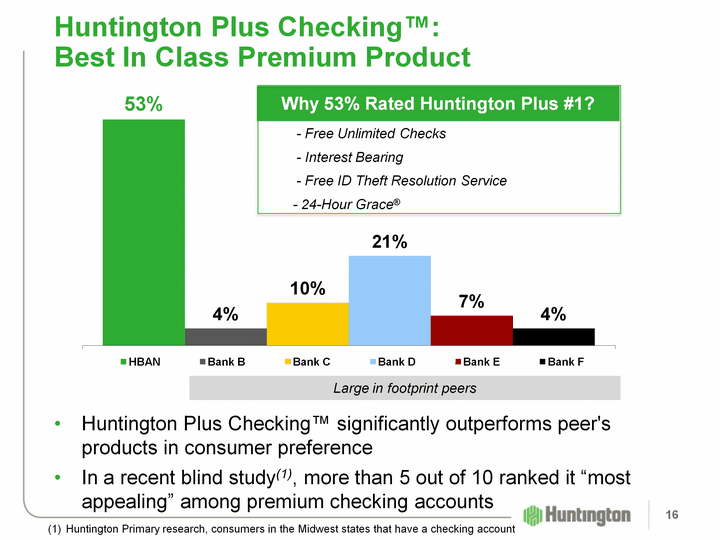
| (CHART) Why 53% Rated Huntington Plus #1? - Free Unlimited Checks - Interest Bearing - Free ID Theft Resolution Service - 24-Hour Grace(r) Huntington Plus Checking(tm): Best In Class Premium Product Huntington Plus Checking(tm) significantly outperforms peer's products in consumer preference In a recent blind study(1), more than 5 out of 10 ranked it "most appealing" among premium checking accounts Huntington Primary research, consumers in the Midwest states that have a checking account Large in footprint peers 16 |
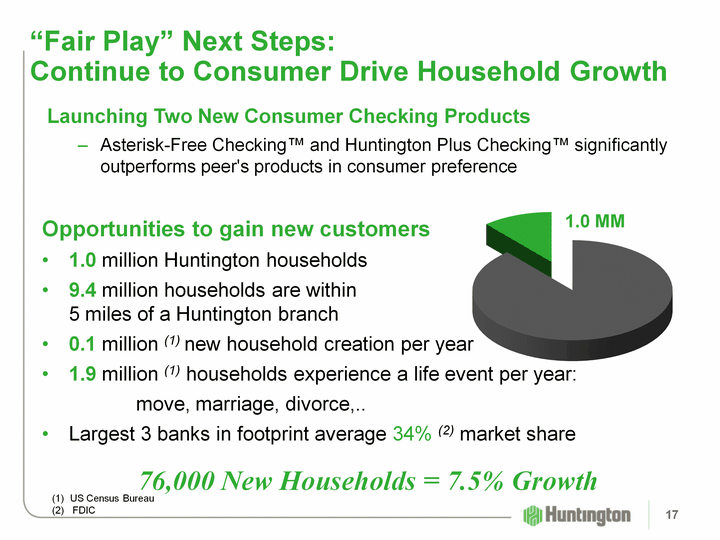
| "Fair Play" Next Steps: Continue to Consumer Drive Household Growth US Census Bureau FDIC Launching Two New Consumer Checking Products Asterisk-Free Checking(tm) and Huntington Plus Checking(tm) significantly outperforms peer's products in consumer preference Opportunities to gain new customers 1.0 million Huntington households 9.4 million households are within 5 miles of a Huntington branch 0.1 million (1) new household creation per year 1.9 million (1) households experience a life event per year: move, marriage, divorce,.. Largest 3 banks in footprint average 34% (2) market share 76,000 New Households = 7.5% Growth (CHART) 1.0 MM 17 |
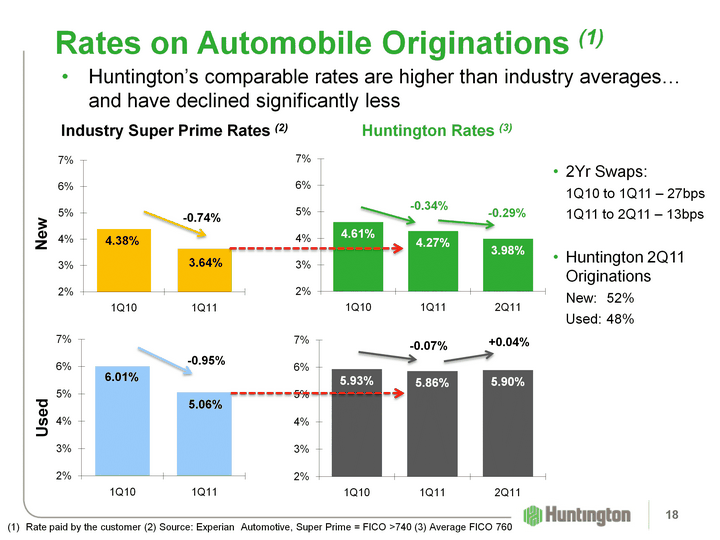
| (CHART) Rates on Automobile Originations (1) Industry Super Prime Rates (2) (CHART) Rate paid by the customer (2) Source: Experian Automotive, Super Prime = FICO >740 (3) Average FICO 760 -0.74% -0.95% New Huntington's comparable rates are higher than industry averages... and have declined significantly less (CHART) (CHART) -0.34% -0.07% -0.29% +0.04% Used Huntington Rates (3) 2Yr Swaps: 1Q10 to 1Q11 - 27bps 1Q11 to 2Q11 - 13bps Huntington 2Q11 Originations New: 52% Used: 48% 18 |
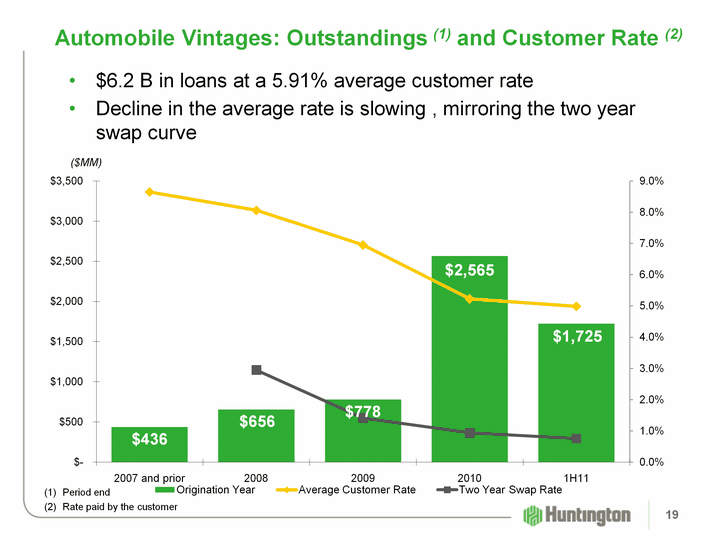
| (CHART) Automobile Vintages: Outstandings (1) and Customer Rate (2) ($MM) Period end Rate paid by the customer $6.2 B in loans at a 5.91% average customer rate Decline in the average rate is slowing , mirroring the two year swap curve 19 |
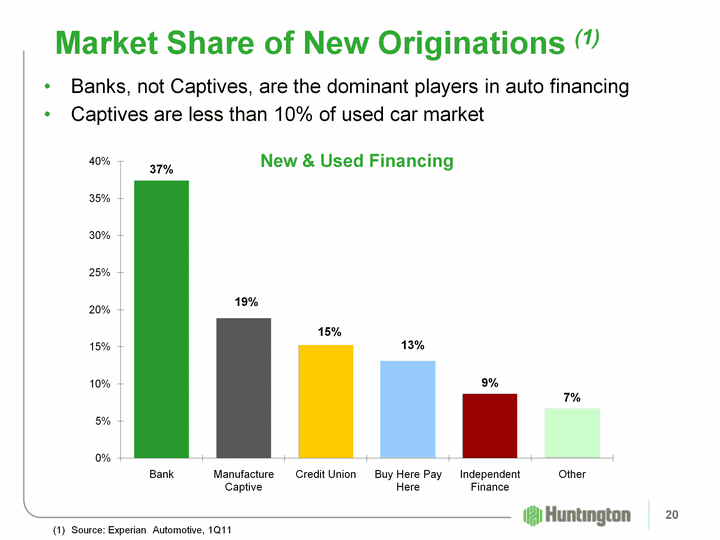
| (CHART) Market Share of New Originations (1) Source: Experian Automotive, 1Q11 New & Used Financing Banks, not Captives, are the dominant players in auto financing Captives are less than 10% of used car market 20 |
| Important Messages Executing the 2009 strategic plan This is a new Huntington Stronger management and increased accountability Improved credit, risk and financial discipline Improving performance Our strategic initiatives continue to gain traction OCR / "Fair Play" banking is working Auto lending is a competitive advantage Making Progress on Our Break Away Strategy 21 |

| Quarterly Financial Review 22 |
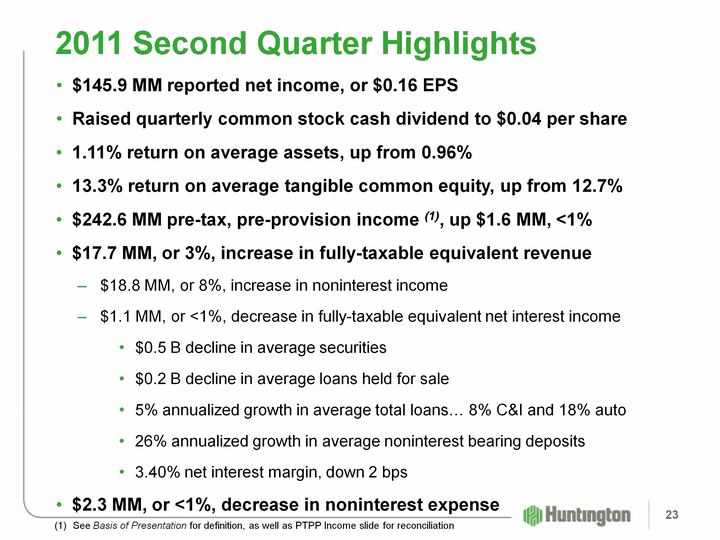
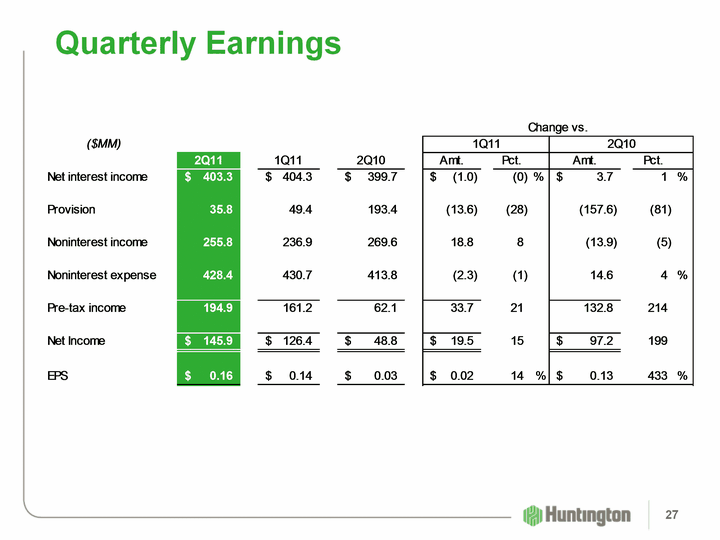
| $145.9 MM reported net income, or $0.16 EPS Raised quarterly common stock cash dividend to $0.04 per share 1.11% return on average assets, up from 0.96% 13.3% return on average tangible common equity, up from 12.7% $242.6 MM pre-tax, pre-provision income (1), up $1.6 MM, <1% $17.7 MM, or 3%, increase in fully-taxable equivalent revenue $18.8 MM, or 8%, increase in noninterest income $1.1 MM, or <1%, decrease in fully-taxable equivalent net interest income $0.5 B decline in average securities $0.2 B decline in average loans held for sale 5% annualized growth in average total loans... 8% C&I and 18% auto 26% annualized growth in average noninterest bearing deposits 3.40% net interest margin, down 2 bps $2.3 MM, or <1%, decrease in noninterest expense 2011 Second Quarter Highlights See Basis of Presentation for definition, as well as PTPP Income slide for reconciliation 23 |
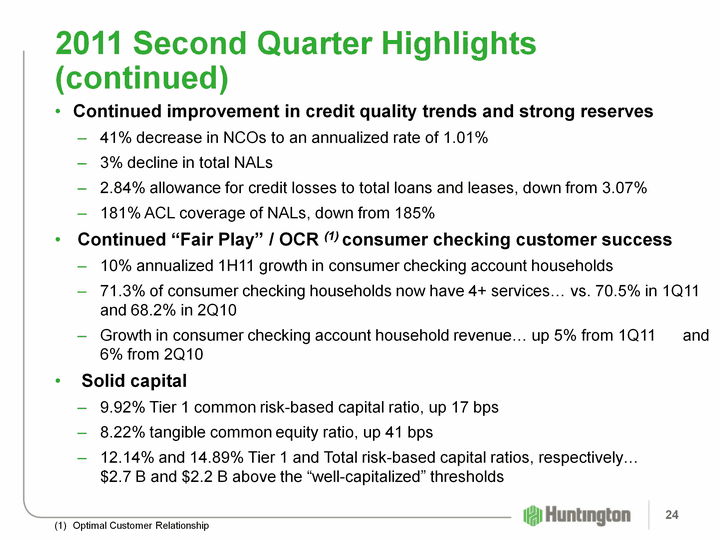
| Continued improvement in credit quality trends and strong reserves 41% decrease in NCOs to an annualized rate of 1.01% 3% decline in total NALs 2.84% allowance for credit losses to total loans and leases, down from 3.07% 181% ACL coverage of NALs, down from 185% Continued "Fair Play" / OCR (1) consumer checking customer success 10% annualized 1H11 growth in consumer checking account households 71.3% of consumer checking households now have 4+ services... vs. 70.5% in 1Q11 and 68.2% in 2Q10 Growth in consumer checking account household revenue... up 5% from 1Q11 and 6% from 2Q10 Solid capital 9.92% Tier 1 common risk-based capital ratio, up 17 bps 8.22% tangible common equity ratio, up 41 bps 12.14% and 14.89% Tier 1 and Total risk-based capital ratios, respectively... $2.7 B and $2.2 B above the "well-capitalized" thresholds 2011 Second Quarter Highlights (continued) Optimal Customer Relationship 24 |
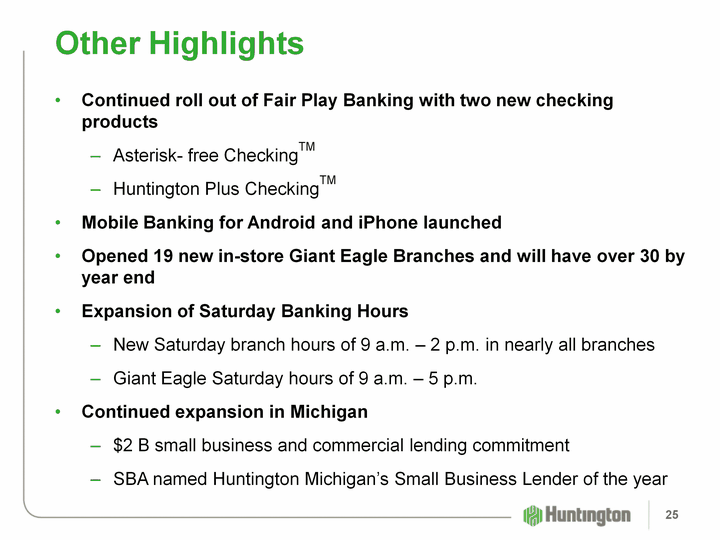
| Continued roll out of Fair Play Banking with two new checking products Asterisk- free CheckingTM Huntington Plus CheckingTM Mobile Banking for Android and iPhone launched Opened 19 new in-store Giant Eagle Branches and will have over 30 by year end Expansion of Saturday Banking Hours New Saturday branch hours of 9 a.m. - 2 p.m. in nearly all branches Giant Eagle Saturday hours of 9 a.m. - 5 p.m. Continued expansion in Michigan $2 B small business and commercial lending commitment SBA named Huntington Michigan's Small Business Lender of the year Other Highlights 25 |
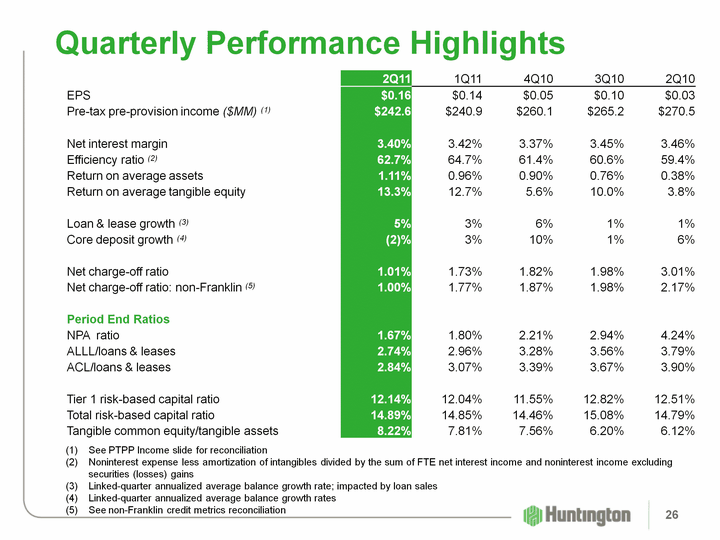
| Quarterly Performance Highlights 2Q11 1Q11 4Q10 3Q10 2Q10 EPS $0.16 $0.14 $0.05 $0.10 $0.03 Pre-tax pre-provision income ($MM) (1) $242.6 $240.9 $260.1 $265.2 $270.5 Net interest margin 3.40% 3.42% 3.37% 3.45% 3.46% Efficiency ratio (2) 62.7% 64.7% 61.4% 60.6% 59.4% Return on average assets 1.11% 0.96% 0.90% 0.76% 0.38% Return on average tangible equity 13.3% 12.7% 5.6% 10.0% 3.8% Loan & lease growth (3) 5% 3% 6% 1% 1% Core deposit growth (4) (2)% 3% 10% 1% 6% Net charge-off ratio 1.01% 1.73% 1.82% 1.98% 3.01% Net charge-off ratio: non-Franklin (5) 1.00% 1.77% 1.87% 1.98% 2.17% Period End Ratios NPA ratio 1.67% 1.80% 2.21% 2.94% 4.24% ALLL/loans & leases 2.74% 2.96% 3.28% 3.56% 3.79% ACL/loans & leases 2.84% 3.07% 3.39% 3.67% 3.90% Tier 1 risk-based capital ratio 12.14% 12.04% 11.55% 12.82% 12.51% Total risk-based capital ratio 14.89% 14.85% 14.46% 15.08% 14.79% Tangible common equity/tangible assets 8.22% 7.81% 7.56% 6.20% 6.12% (1) See PTPP Income slide for reconciliation (2) Noninterest expense less amortization of intangibles divided by the sum of FTE net interest income and noninterest income excluding securities (losses) gains (3) Linked-quarter annualized average balance growth rate; impacted by loan sales (4) Linked-quarter annualized average balance growth rates (5) See non-Franklin credit metrics reconciliation 26 |
| Quarterly Earnings 27 |
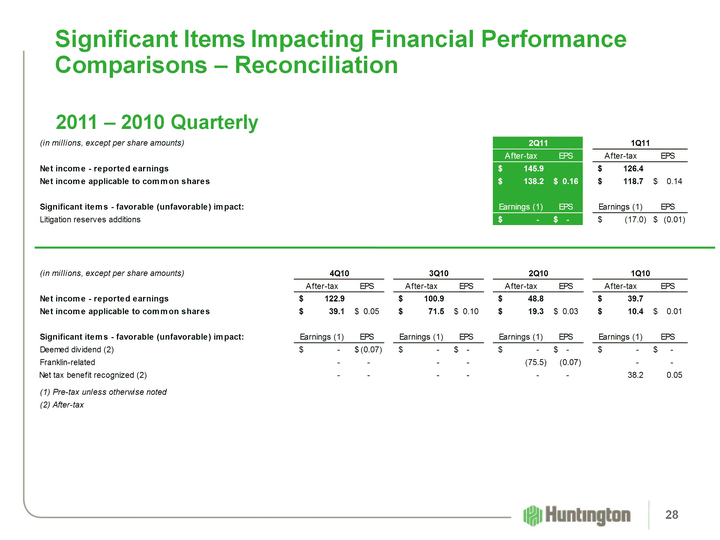
| Significant Items Impacting Financial Performance Comparisons - Reconciliation 2011 - 2010 Quarterly 28 |

| Income Statement 29 |
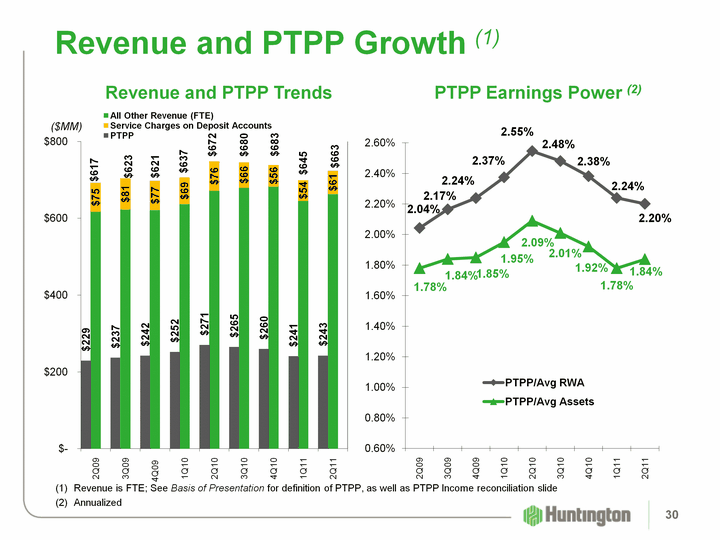
| (CHART) Revenue and PTPP Growth (1) ($MM) (CHART) (1) Revenue is FTE; See Basis of Presentation for definition of PTPP, as well as PTPP Income reconciliation slide (2) Annualized PTPP Earnings Power (2) Revenue and PTPP Trends 30 |
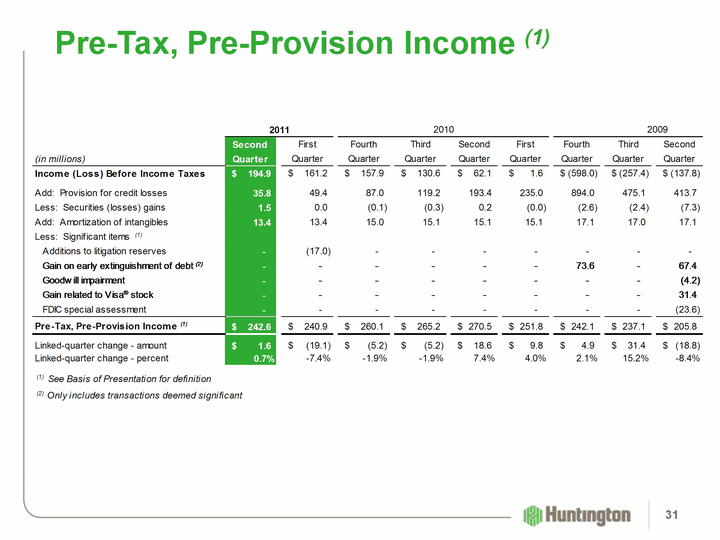
| Pre-Tax, Pre-Provision Income (1) 31 |
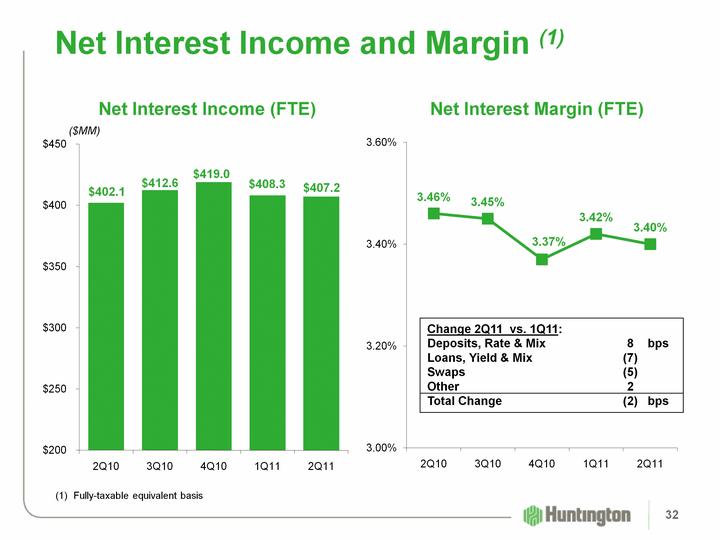
| (CHART) (CHART) Change 2Q11 vs. 1Q11: Deposits, Rate & Mix 8 bps Loans, Yield & Mix (7) Swaps (5) Other 2 Total Change (2) bps Net Interest Income and Margin (1) ($MM) (1) Fully-taxable equivalent basis Net Interest Margin (FTE) Net Interest Income (FTE) 32 |
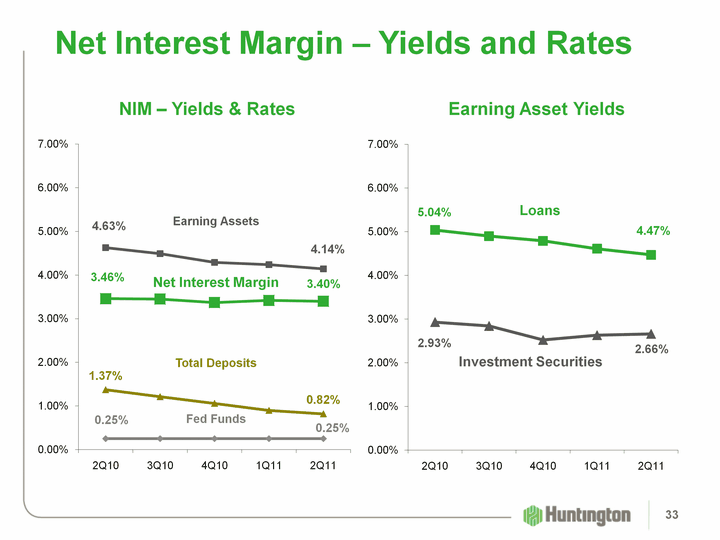
| Net Interest Margin - Yields and Rates (CHART) (CHART) Earning Assets Total Deposits Fed Funds Net Interest Margin Loans Investment Securities Earning Asset Yields NIM - Yields & Rates 33 |
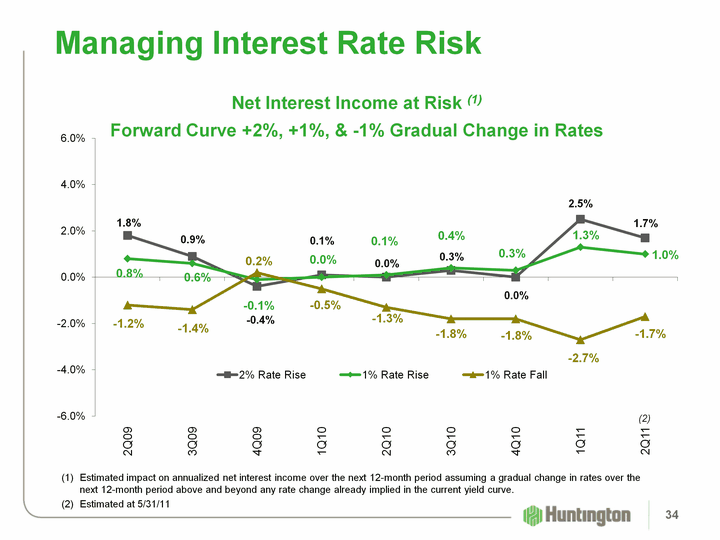
| Net Interest Income at Risk (1) Forward Curve +2%, +1%, & -1% Gradual Change in Rates (CHART) Managing Interest Rate Risk Estimated impact on annualized net interest income over the next 12-month period assuming a gradual change in rates over the next 12-month period above and beyond any rate change already implied in the current yield curve. Estimated at 5/31/11 (2) 34 |
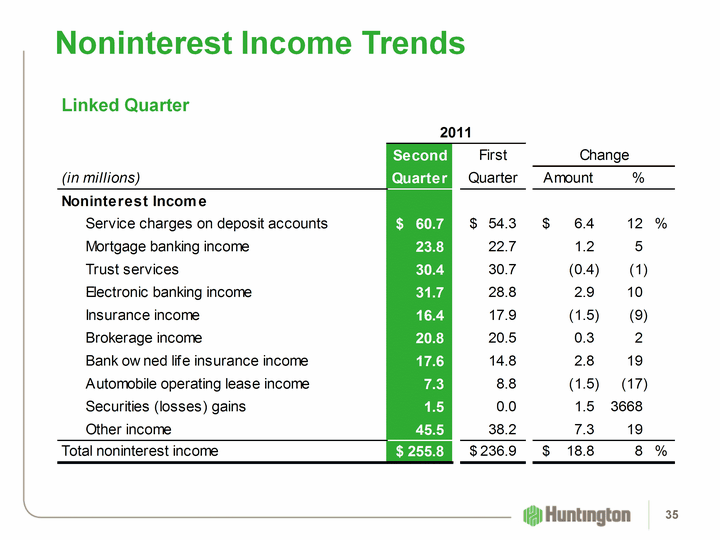
| Noninterest Income Trends Linked Quarter 35 |
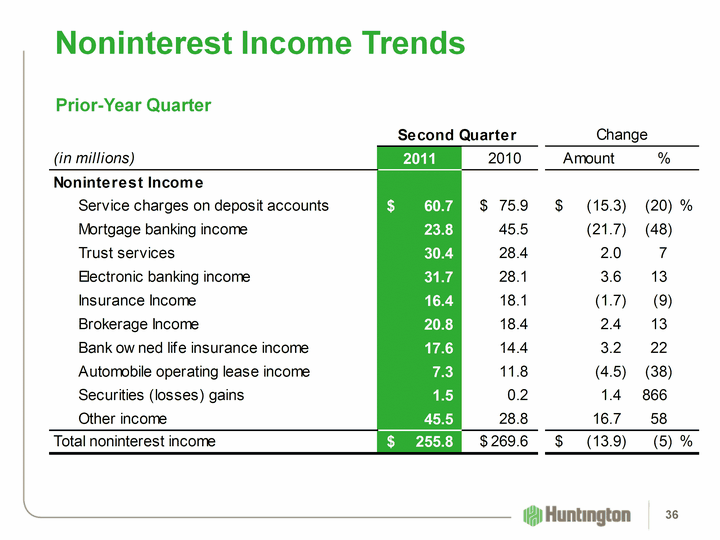
| Noninterest Income Trends Prior-Year Quarter 36 |
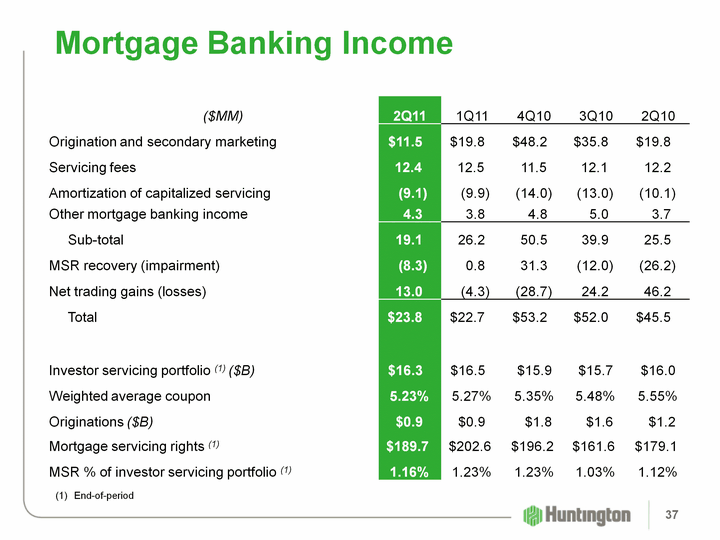
| Mortgage Banking Income ($MM) 2Q11 1Q11 4Q10 3Q10 2Q10 Origination and secondary marketing $11.5 $19.8 $48.2 $35.8 $19.8 Servicing fees 12.4 12.5 11.5 12.1 12.2 Amortization of capitalized servicing (9.1) (9.9) (14.0) (13.0) (10.1) Other mortgage banking income 4.3 3.8 4.8 5.0 3.7 Sub-total 19.1 26.2 50.5 39.9 25.5 MSR recovery (impairment) (8.3) 0.8 31.3 (12.0) (26.2) Net trading gains (losses) 13.0 (4.3) (28.7) 24.2 46.2 Total $23.8 $22.7 $53.2 $52.0 $45.5 Investor servicing portfolio (1) ($B) $16.3 $16.5 $15.9 $15.7 $16.0 Weighted average coupon 5.23% 5.27% 5.35% 5.48% 5.55% Originations ($B) $0.9 $0.9 $1.8 $1.6 $1.2 Mortgage servicing rights (1) $189.7 $202.6 $196.2 $161.6 $179.1 MSR % of investor servicing portfolio (1) 1.16% 1.23% 1.23% 1.03% 1.12% (1) End-of-period 37 |
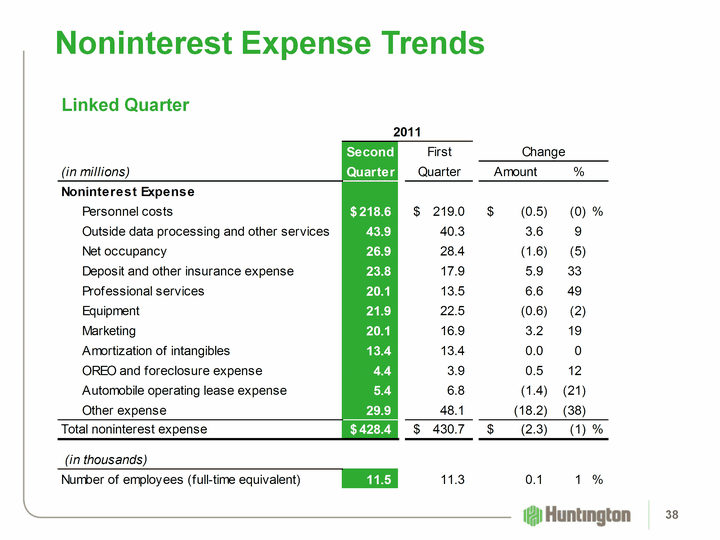
| Noninterest Expense Trends Linked Quarter 38 |
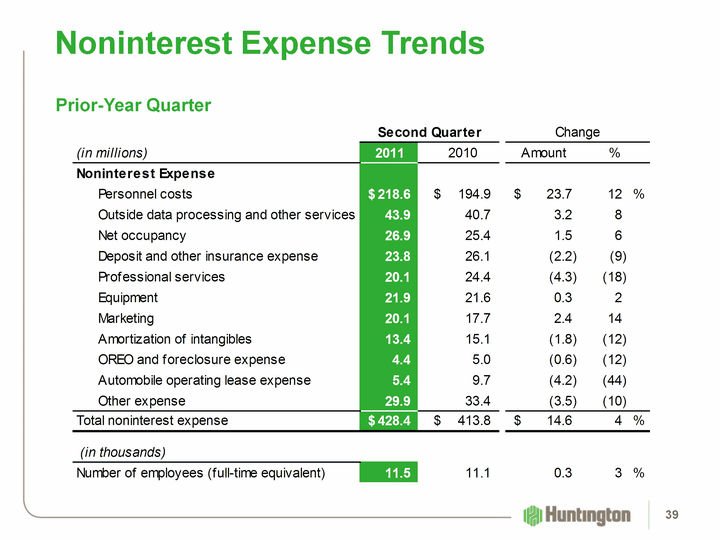
| Noninterest Expense Trends Prior-Year Quarter 39 |

| Balance Sheet 40 |
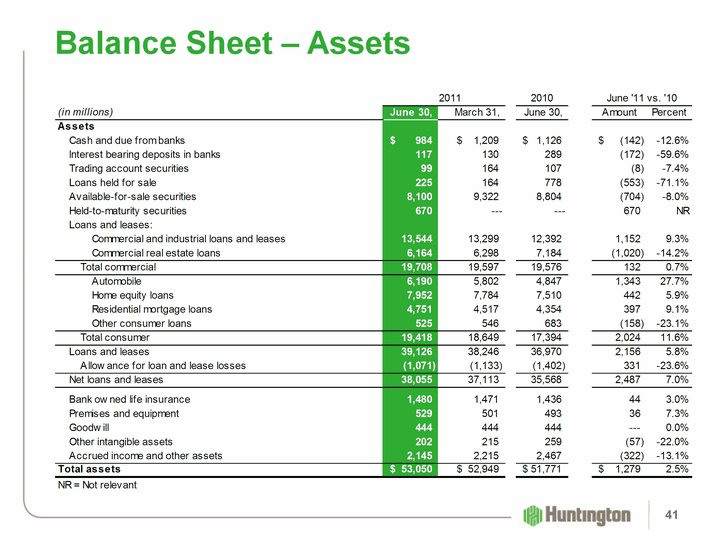
| Balance Sheet - Assets 41 |
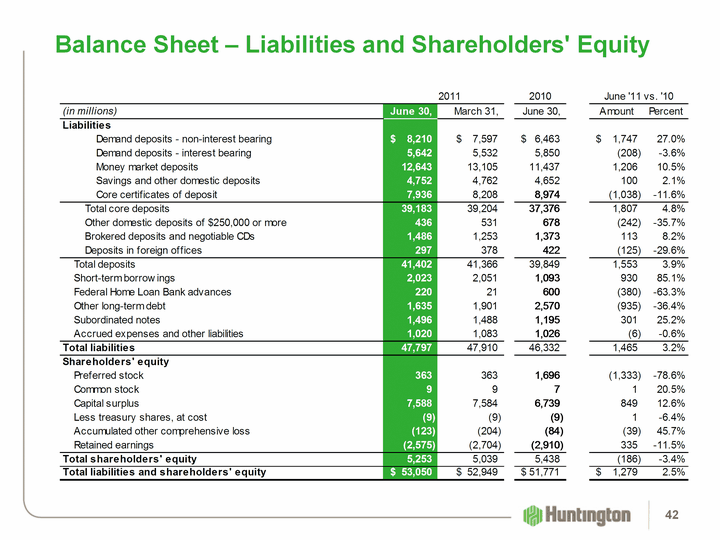
| Balance Sheet - Liabilities and Shareholders' Equity 42 |
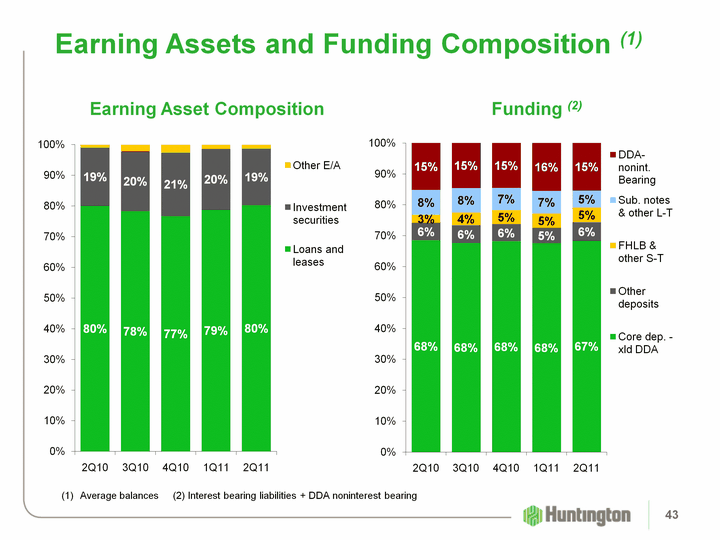
| Earning Assets and Funding Composition (1) (CHART) (1) Average balances (2) Interest bearing liabilities + DDA noninterest bearing (CHART) Funding (2) Earning Asset Composition 43 |

| Investment Securities 44 |
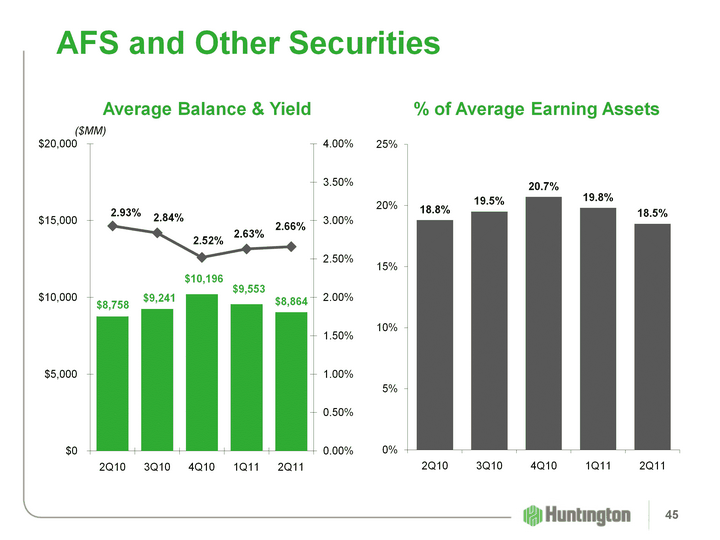
| (CHART) (CHART) AFS and Other Securities ($MM) % of Average Earning Assets Average Balance & Yield 45 |
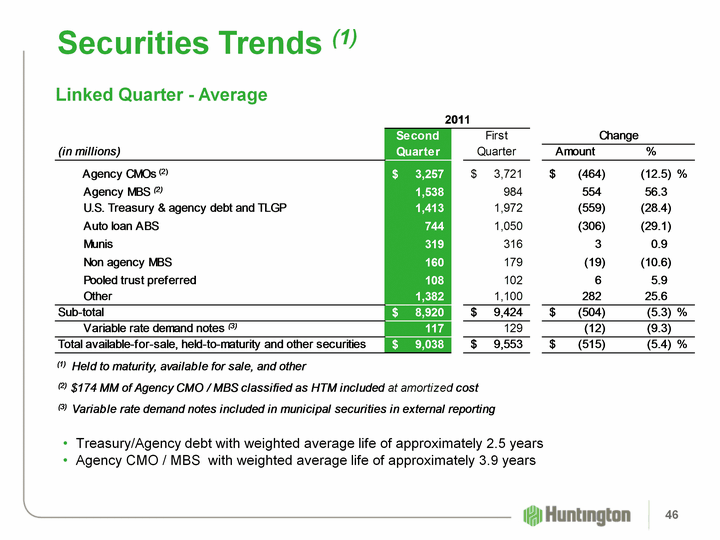
| Securities Trends (1) Linked Quarter - Average Treasury/Agency debt with weighted average life of approximately 2.5 years Agency CMO / MBS with weighted average life of approximately 3.9 years 46 |
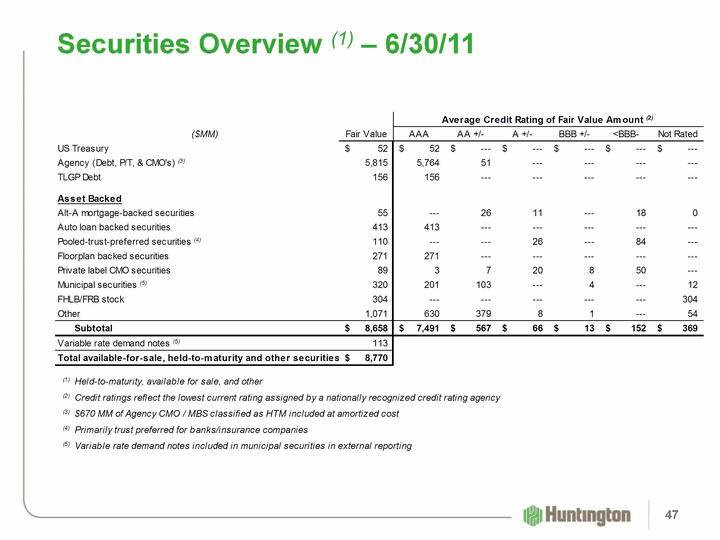
| Securities Overview (1) - 6/30/11 47 |
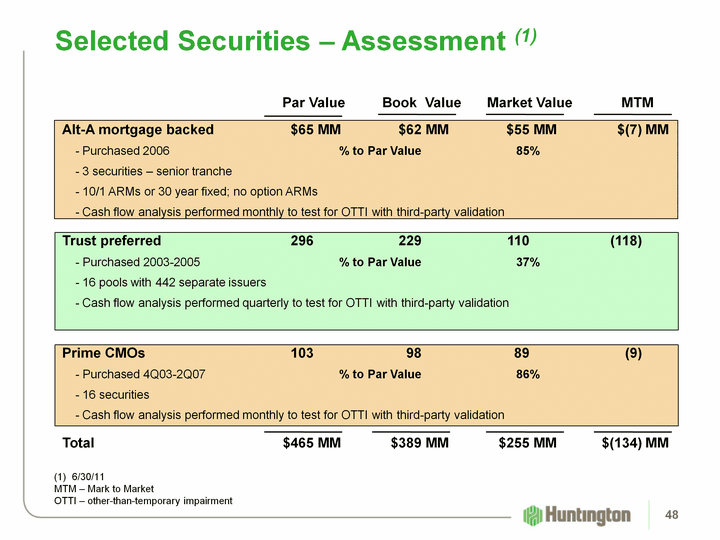
| Selected Securities - Assessment (1) Par Value Book Value Market Value MTM Alt-A mortgage backed $65 MM $62 MM $55 MM $(7) MM - Purchased 2006 % to Par Value 85% - 3 securities - senior tranche - 10/1 ARMs or 30 year fixed; no option ARMs - Cash flow analysis performed monthly to test for OTTI with third-party validation Trust preferred 296 229 110 (118) - Purchased 2003-2005 % to Par Value 37% - 16 pools with 442 separate issuers - Cash flow analysis performed quarterly to test for OTTI with third-party validation Prime CMOs 103 98 89 (9) - Purchased 4Q03-2Q07 % to Par Value 86% - 16 securities - Cash flow analysis performed monthly to test for OTTI with third-party validation Total $465 MM $389 MM $255 MM $(134) MM 6/30/11 MTM - Mark to Market OTTI - other-than-temporary impairment 48 |
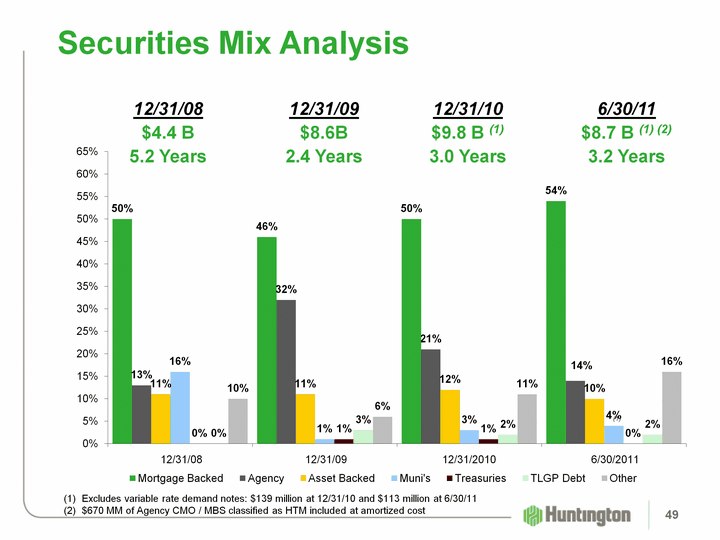
| (CHART) Securities Mix Analysis 12/31/10 $9.8 B (1) 3.0 Years 12/31/08 $4.4 B 5.2 Years 12/31/09 $8.6B 2.4 Years Excludes variable rate demand notes: $139 million at 12/31/10 and $113 million at 6/30/11 $670 MM of Agency CMO / MBS classified as HTM included at amortized cost (1) 6/30/11 $8.7 B (1) (2) 3.2 Years 49 |

| Loan Portfolio Overview 50 |
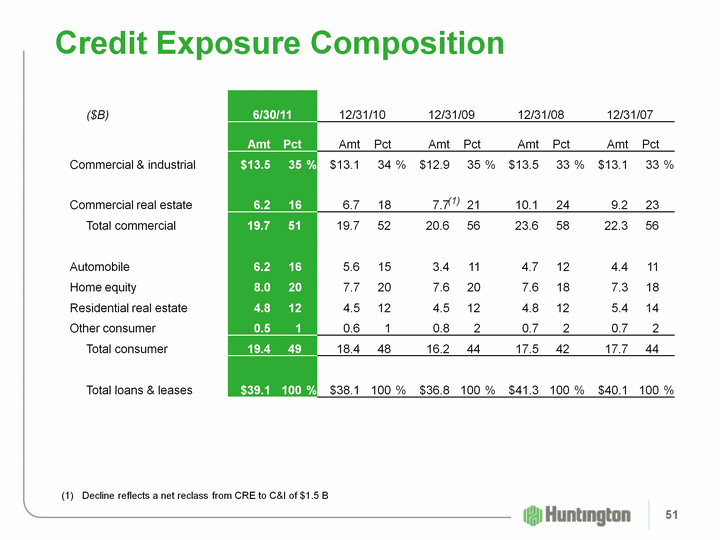
| ($B) 6/30/11 6/30/11 6/30/11 12/31/10 12/31/10 12/31/10 12/31/09 12/31/09 12/31/09 12/31/08 12/31/08 12/31/08 12/31/07 12/31/07 12/31/07 Amt Pct Amt Pct Amt Pct Amt Pct Amt Pct Commercial & industrial $13.5 35 % $13.1 34 % $12.9 35 % $13.5 33 % $13.1 33 % Commercial real estate 6.2 16 6.7 18 7.7 21 10.1 24 9.2 23 Total commercial 19.7 51 19.7 52 20.6 56 23.6 58 22.3 56 Automobile 6.2 16 5.6 15 3.4 11 4.7 12 4.4 11 Home equity 8.0 20 7.7 20 7.6 20 7.6 18 7.3 18 Residential real estate 4.8 12 4.5 12 4.5 12 4.8 12 5.4 14 Other consumer 0.5 1 0.6 1 0.8 2 0.7 2 0.7 2 Total consumer 19.4 49 18.4 48 16.2 44 17.5 42 17.7 44 Total loans & leases $39.1 100 % $38.1 100 % $36.8 100 % $41.3 100 % $40.1 100 % Credit Exposure Composition (1) Decline reflects a net reclass from CRE to C&I of $1.5 B (1) 51 |
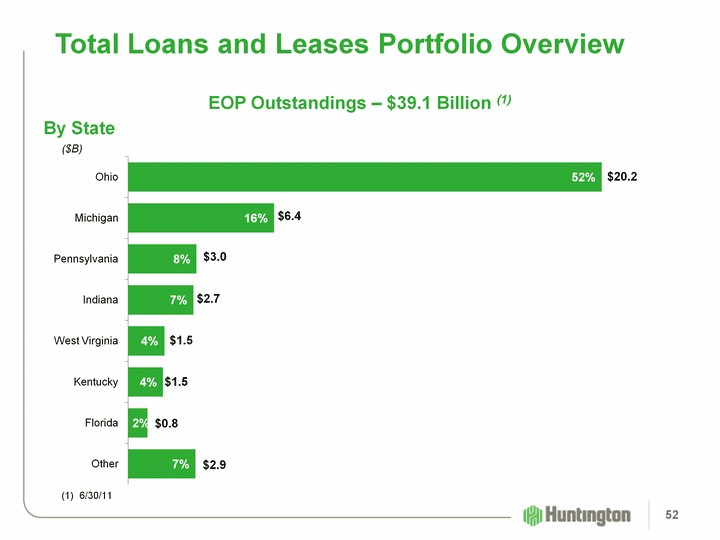
| (CHART) Total Loans and Leases Portfolio Overview ($B) $20.2 $6.4 $3.0 $1.5 $2.7 $1.5 $0.8 $2.9 EOP Outstandings - $39.1 Billion (1) (1) 6/30/11 By State 52 |
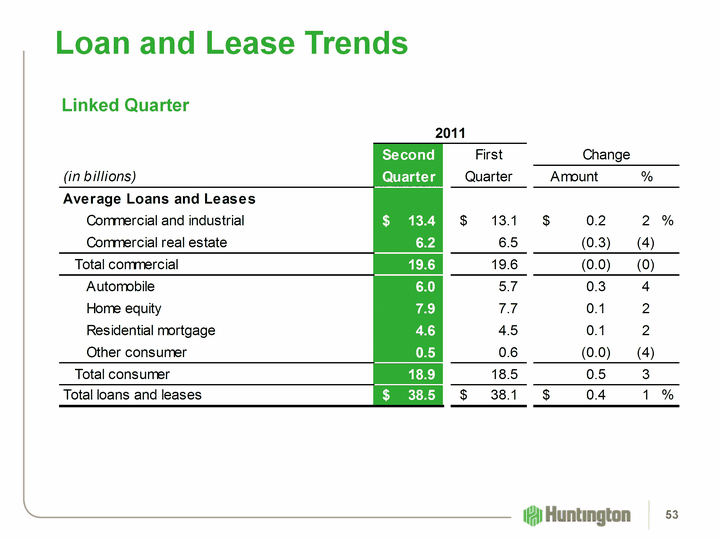
| Loan and Lease Trends Linked Quarter 53 |
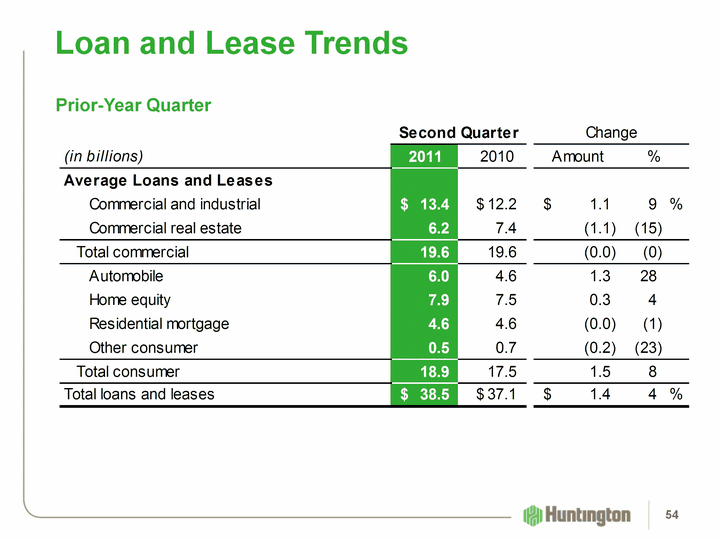
| Loan and Lease Trends Prior-Year Quarter 54 |
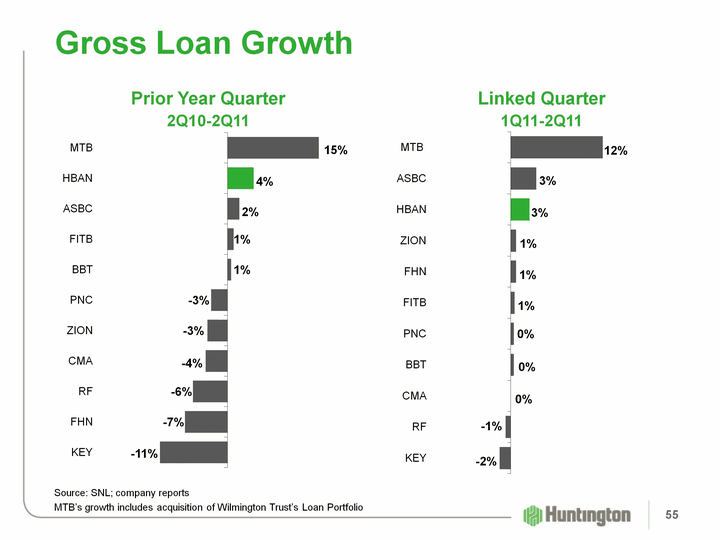
| Gross Loan Growth (CHART) (CHART) Source: SNL; company reports MTB's growth includes acquisition of Wilmington Trust's Loan Portfolio Prior Year Quarter 2Q10-2Q11 Linked Quarter 1Q11-2Q11 55 |

| Total Commercial Loans 56 |
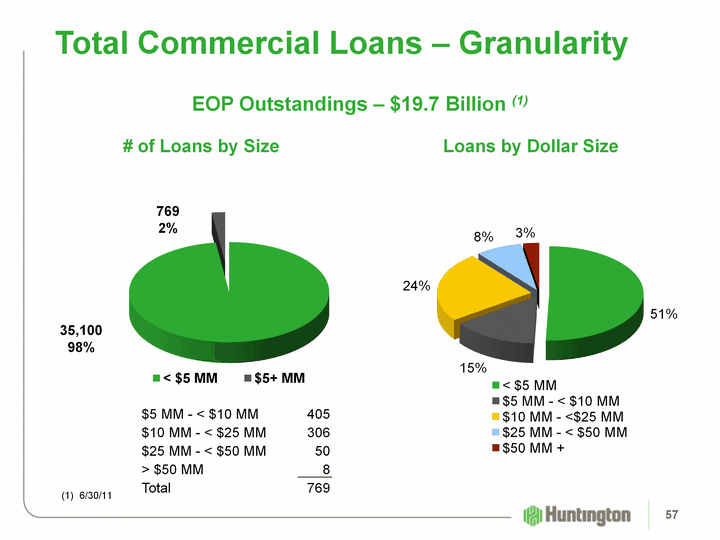
| (CHART) Total Commercial Loans - Granularity EOP Outstandings - $19.7 Billion (1) (CHART) 769 2% 35,100 98% (1) 6/30/11 Loans by Dollar Size # of Loans by Size $5 MM - < $10 MM 405 $10 MM - < $25 MM 306 $25 MM - < $50 MM 50 > $50 MM 8 Total 769 57 |
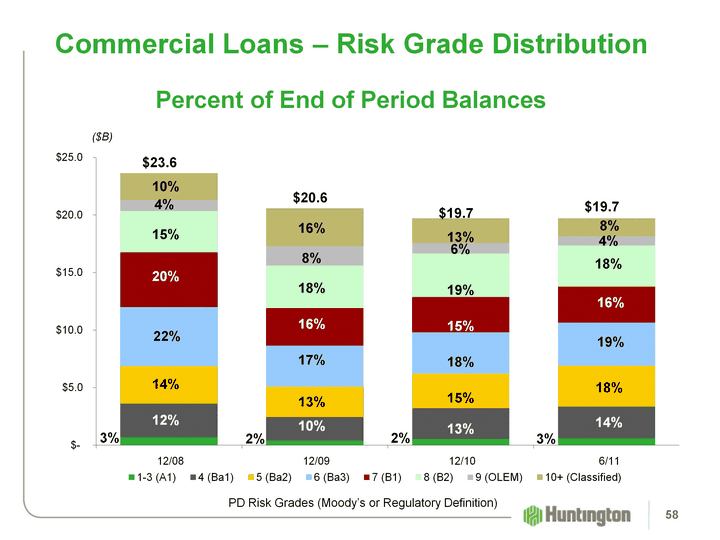
| (CHART) Commercial Loans - Risk Grade Distribution PD Risk Grades (Moody's or Regulatory Definition) Percent of End of Period Balances ($B) $23.6 $20.6 10% 16% 4% 8% 15% 18% 16% 20% 17% 22% 13% 14% 10% 12% 2% 3% 13% 6% 19% 15% 18% 15% 13% 2% $19.7 15% 8% 4% 18% 16% 19% 18% 14% 3% $19.7 58 |

| Commercial and Industrial Loans (C&I) 59 |
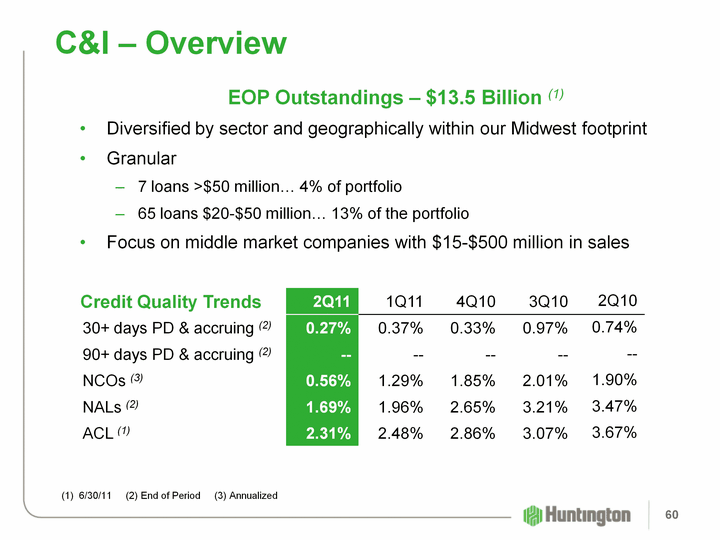
| C&I - Overview EOP Outstandings - $13.5 Billion (1) Diversified by sector and geographically within our Midwest footprint Granular 7 loans >$50 million... 4% of portfolio 65 loans $20-$50 million... 13% of the portfolio Focus on middle market companies with $15-$500 million in sales Credit Quality Trends (1) 6/30/11 (2) End of Period (3) Annualized 2Q11 1Q11 4Q10 3Q10 2Q10 30+ days PD & accruing (2) 0.27% 0.37% 0.33% 0.97% 0.74% 90+ days PD & accruing (2) -- -- -- -- -- NCOs (3) 0.56% 1.29% 1.85% 2.01% 1.90% NALs (2) 1.69% 1.96% 2.65% 3.21% 3.47% ACL (1) 2.31% 2.48% 2.86% 3.07% 3.67% 60 |

| C&I - Credit Risk Management Strategies What We Do Lend to defined relationship oriented clients Follow disciplined credit policies and processes Understand our client's market / industry and their durable competitive advantage Underwrite to historical cash flows with collateral as a secondary repayment source Emphasize risk / return structure and pricing Stress testing for lower earnings / higher interest rates Monthly review of criticized and classified loans 61 |
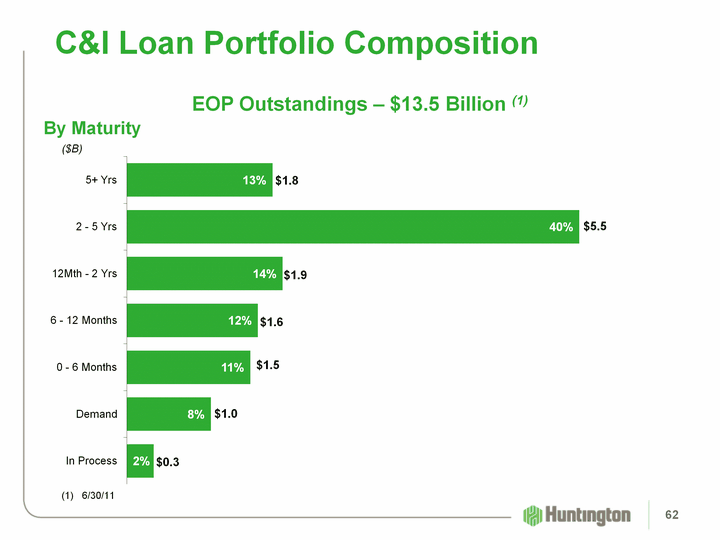
| (CHART) C&I Loan Portfolio Composition ($B) EOP Outstandings - $13.5 Billion (1) (1) 6/30/11 By Maturity $1.8 $5.5 $1.9 $1.6 $1.5 $1.0 $0.3 62 |
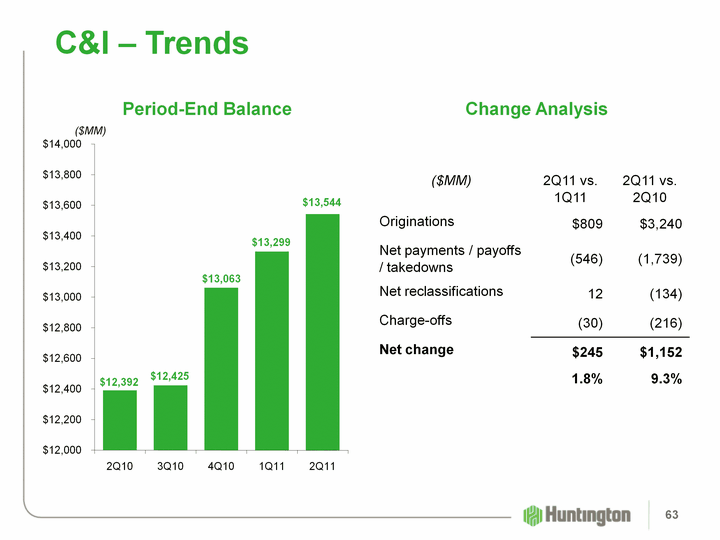
| (CHART) C&I - Trends ($MM) Change Analysis Period-End Balance ($MM) 2Q11 vs. 1Q11 2Q11 vs. 2Q10 Originations $809 $3,240 Net payments / payoffs / takedowns (546) (1,739) Net reclassifications 12 (134) Charge-offs (30) (216) Net change $245 $1,152 1.8% 9.3% 63 |
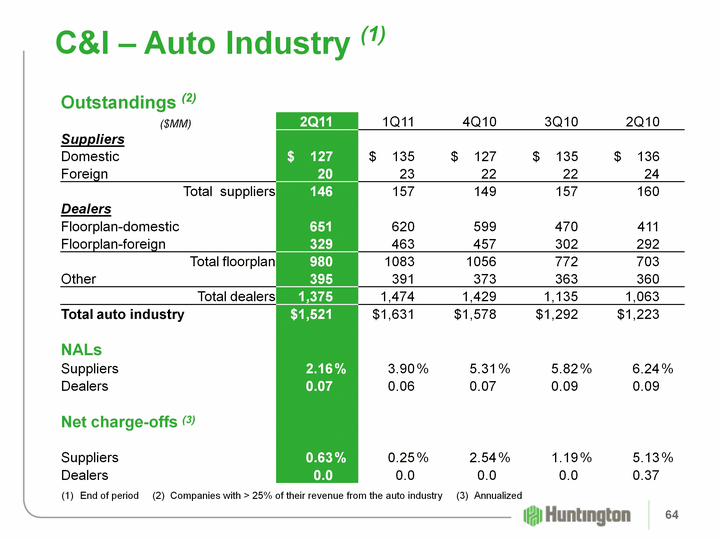
| C&I - Auto Industry (1) Outstandings (2) ($MM) 2Q11 1Q11 4Q10 3Q10 2Q10 Suppliers Domestic $ 127 $ 135 $ 127 $ 135 $ 136 Foreign 20 23 22 22 24 Total suppliers 146 157 149 157 160 Dealers Floorplan-domestic 651 620 599 470 411 Floorplan-foreign 329 463 457 302 292 Total floorplan 980 1083 1056 772 703 Other 395 391 373 363 360 Total dealers 1,375 1,474 1,429 1,135 1,063 Total auto industry $1,521 $1,631 $1,578 $1,292 $1,223 NALs Suppliers 2.16 % 3.90 % 5.31 % 5.82 % 6.24 % Dealers 0.07 0.06 0.07 0.09 0.09 Net charge-offs (3) Suppliers 0.63 % 0.25 %% 2.54 % 1.19 % 5.13 % Dealers 0.0 0.0 0.0 0.0 0.37 (1) End of period (2) Companies with > 25% of their revenue from the auto industry (3) Annualized 64 |

| Commercial Real Estate Loans (CRE) 65 |

| CRE - Overview EOP Outstandings - $6.2 Billion (1) Granular portfolio with geographic and project diversification throughout our footprint Construction lending targeted to major metro markets CRE - Construction ($0.6 Billion) 47% reduction in balances since 6/30/10 72% of current balances to "Core" CRE relationships Centralized construction portfolio management within CRE segment Credit Quality Trends 2Q11 1Q11 4Q10 3Q10 2Q10 30+ days PD & accruing (2) 0.45% 1.49 1.45% 1.26% 1.30% 90+ days PD & accruing (2) -- -- -- -- -- NCOs - construction (3) 2.99% 18.6% 6.19% 7.25% 14.25% NCOs - nonconstruction (3) 1.65% 2.66% 2.22% 3.01% 2.38% NALs (2) 4.73% 4.86% 5.47% 6.93% 9.23% ACL (2) 7.63% 8.25% 8.94% 9.58% 9.81% 66 (1) 6/30/11 (2) End of Period (3) Annualized |
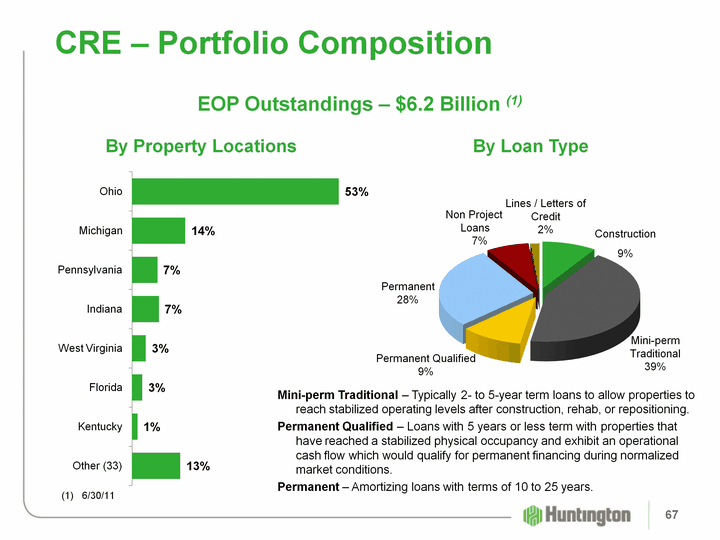
| (CHART) CRE - Portfolio Composition Permanent 28% Mini-perm Traditional 39% Construction 9% Non Project Loans 7% (CHART) Lines / Letters of Credit 2% (1) 6/30/11 Permanent Qualified 9% Mini-perm Traditional - Typically 2- to 5-year term loans to allow properties to reach stabilized operating levels after construction, rehab, or repositioning. Permanent Qualified - Loans with 5 years or less term with properties that have reached a stabilized physical occupancy and exhibit an operational cash flow which would qualify for permanent financing during normalized market conditions. Permanent - Amortizing loans with terms of 10 to 25 years. EOP Outstandings - $6.2 Billion (1) By Loan Type By Property Locations 67 |
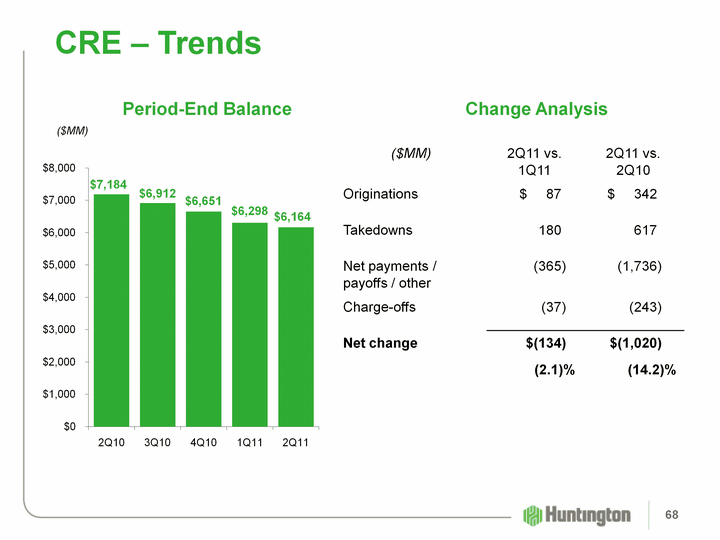
| (CHART) CRE - Trends ($MM) Change Analysis Period-End Balance ($MM) 2Q11 vs. 1Q11 2Q11 vs. 2Q10 Originations $ 87 $ 342 Takedowns 180 617 Net payments / payoffs / other (365) (1,736) Charge-offs (37) (243) Net change $(134) $(1,020) (2.1)% (14.2)% 68 |
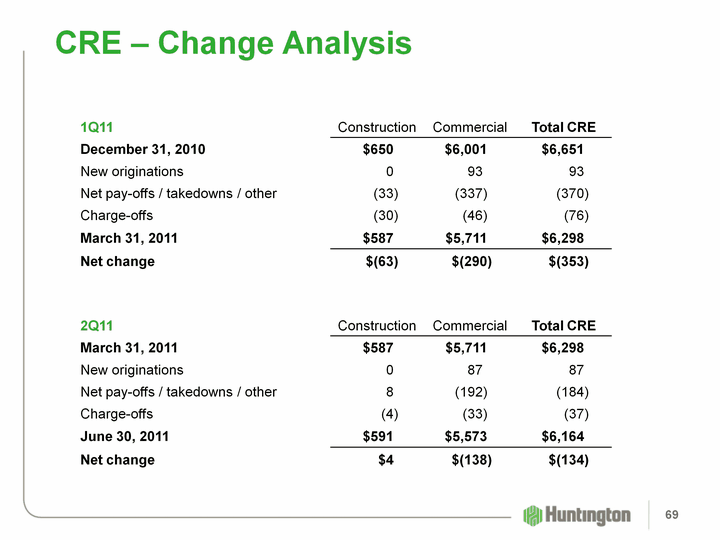
| CRE - Change Analysis 1Q11 Construction Commercial Total CRE December 31, 2010 $650 $6,001 $6,651 New originations 0 93 93 Net pay-offs / takedowns / other (33) (337) (370) Charge-offs (30) (46) (76) March 31, 2011 $587 $5,711 $6,298 Net change $(63) $(290) $(353) 2Q11 Construction Commercial Total CRE March 31, 2011 $587 $5,711 $6,298 New originations 0 87 87 Net pay-offs / takedowns / other 8 (192) (184) Charge-offs (4) (33) (37) June 30, 2011 $591 $5,573 $6,164 Net change $4 $(138) $(134) 69 |
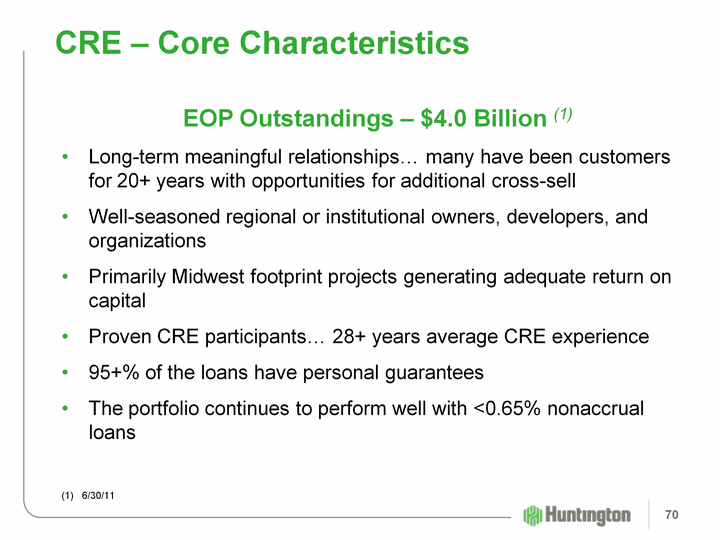
| CRE - Core Characteristics EOP Outstandings - $4.0 Billion (1) Long-term meaningful relationships... many have been customers for 20+ years with opportunities for additional cross-sell Well-seasoned regional or institutional owners, developers, and organizations Primarily Midwest footprint projects generating adequate return on capital Proven CRE participants... 28+ years average CRE experience 95+% of the loans have personal guarantees The portfolio continues to perform well with <0.65% nonaccrual loans (1) 6/30/11 70 |
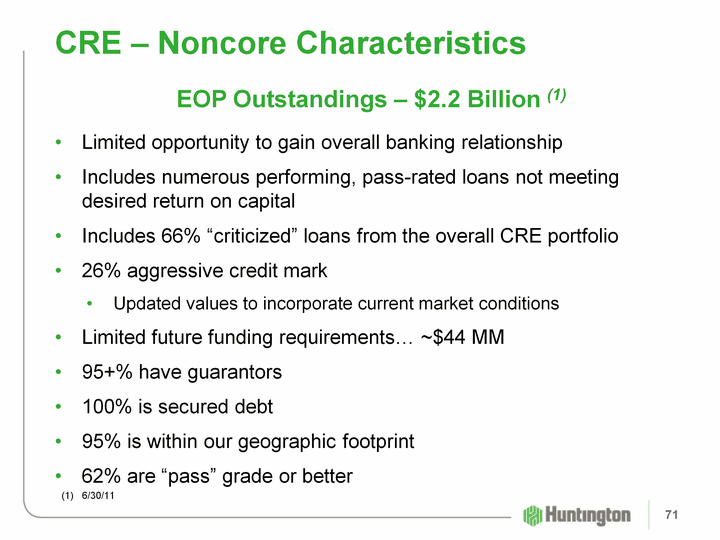
| CRE - Noncore Characteristics EOP Outstandings - $2.2 Billion (1) Limited opportunity to gain overall banking relationship Includes numerous performing, pass-rated loans not meeting desired return on capital Includes 66% "criticized" loans from the overall CRE portfolio 26% aggressive credit mark Updated values to incorporate current market conditions Limited future funding requirements... ~$44 MM 95+% have guarantors 100% is secured debt 95% is within our geographic footprint 62% are "pass" grade or better (1) 6/30/11 71 |
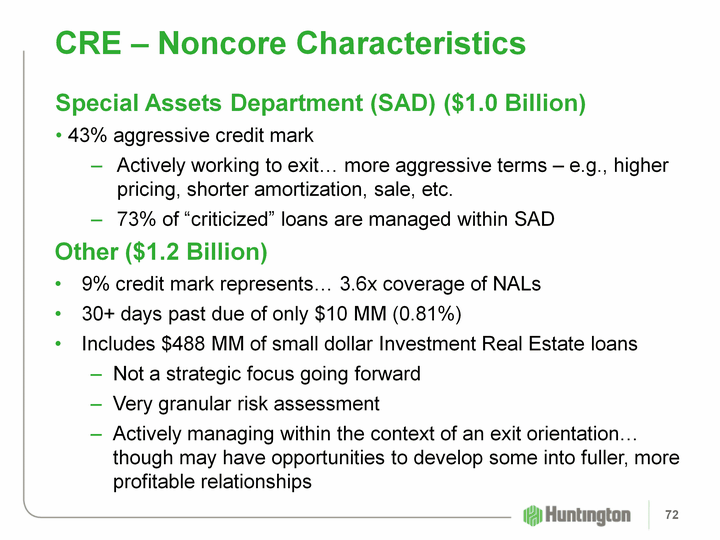
| Special Assets Department (SAD) ($1.0 Billion) 43% aggressive credit mark Actively working to exit... more aggressive terms - e.g., higher pricing, shorter amortization, sale, etc. 73% of "criticized" loans are managed within SAD Other ($1.2 Billion) 9% credit mark represents... 3.6x coverage of NALs 30+ days past due of only $10 MM (0.81%) Includes $488 MM of small dollar Investment Real Estate loans Not a strategic focus going forward Very granular risk assessment Actively managing within the context of an exit orientation... though may have opportunities to develop some into fuller, more profitable relationships CRE - Noncore Characteristics 72 |
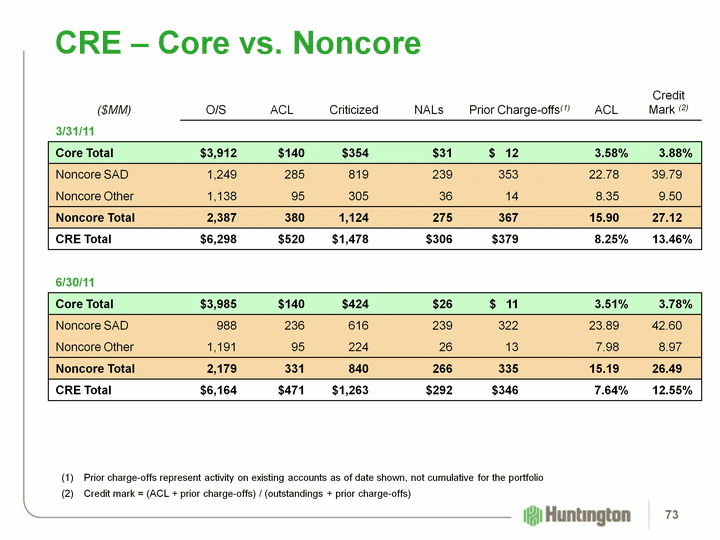
| CRE - Core vs. Noncore ($MM) O/S ACL Criticized NALs Prior Charge-offs(1) ACL Credit Mark (2) 3/31/11 Core Total $3,912 $140 $354 $31 $ 12 3.58% 3.88% Noncore SAD 1,249 285 819 239 353 22.78 39.79 Noncore Other 1,138 95 305 36 14 8.35 9.50 Noncore Total 2,387 380 1,124 275 367 15.90 27.12 CRE Total $6,298 $520 $1,478 $306 $379 8.25% 13.46% 6/30/11 Core Total $3,985 $140 $424 $26 $ 11 3.51% 3.78% Noncore SAD 988 236 616 239 322 23.89 42.60 Noncore Other 1,191 95 224 26 13 7.98 8.97 Noncore Total 2,179 331 840 266 335 15.19 26.49 CRE Total $6,164 $471 $1,263 $292 $346 7.64% 12.55% (1) Prior charge-offs represent activity on existing accounts as of date shown, not cumulative for the portfolio (2) Credit mark = (ACL + prior charge-offs) / (outstandings + prior charge-offs) 73 |
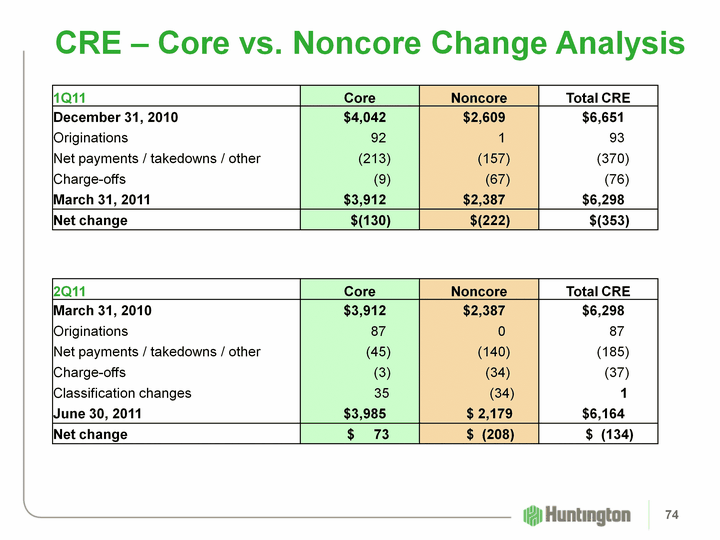
| CRE - Core vs. Noncore Change Analysis 1Q11 Core Noncore Total CRE December 31, 2010 $4,042 $2,609 $6,651 Originations 92 1 93 Net payments / takedowns / other (213) (157) (370) Charge-offs (9) (67) (76) March 31, 2011 $3,912 $2,387 $6,298 Net change $(130) $(222) $(353) 2Q11 Core Noncore Total CRE March 31, 2010 $3,912 $2,387 $6,298 Originations 87 0 87 Net payments / takedowns / other (45) (140) (185) Charge-offs (3) (34) (37) Classification changes 35 (34) 1 June 30, 2011 $3,985 $ 2,179 $6,164 Net change $ 73 $ (208) $ (134) 74 |
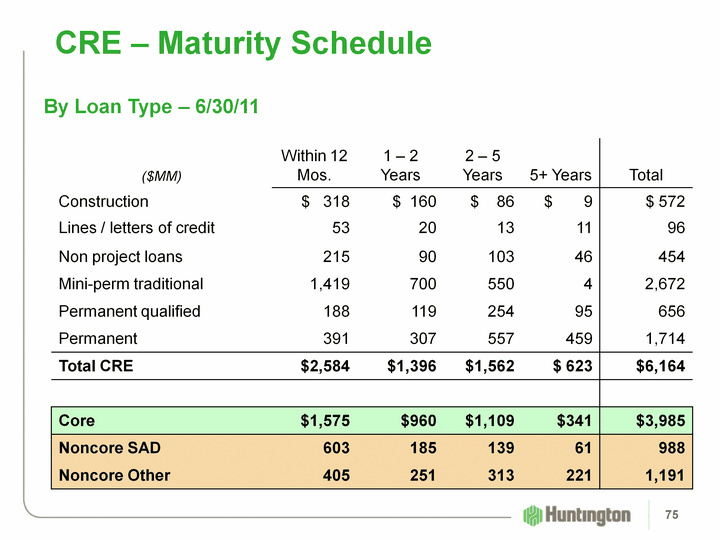
| CRE - Maturity Schedule By Loan Type - 6/30/11 ($MM) Within 12 Mos. 1 - 2 Years 2 - 5 Years 5+ Years Total Construction $ 318 $ 160 $ 86 $ 9 $ 572 Lines / letters of credit 53 20 13 11 96 Non project loans 215 90 103 46 454 Mini-perm traditional 1,419 700 550 4 2,672 Permanent qualified 188 119 254 95 656 Permanent 391 307 557 459 1,714 Total CRE $2,584 $1,396 $1,562 $ 623 $6,164 Core $1,575 $960 $1,109 $341 $3,985 Noncore SAD 603 185 139 61 988 Noncore Other 405 251 313 221 1,191 75 |

| Total Consumer Loans and Leases 76 |
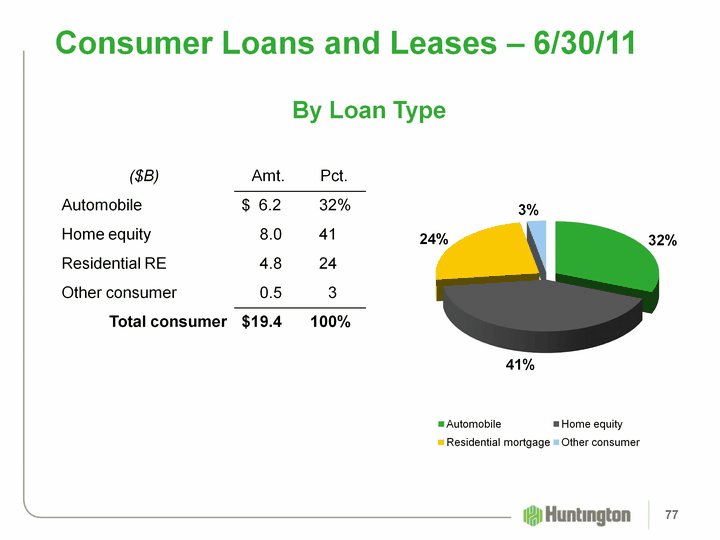
| Consumer Loans and Leases - 6/30/11 ($B) Amt. Pct. Automobile $ 6.2 32% Home equity 8.0 41 Residential RE 4.8 24 Other consumer 0.5 3 Total consumer $19.4 100% (CHART) By Loan Type 77 |
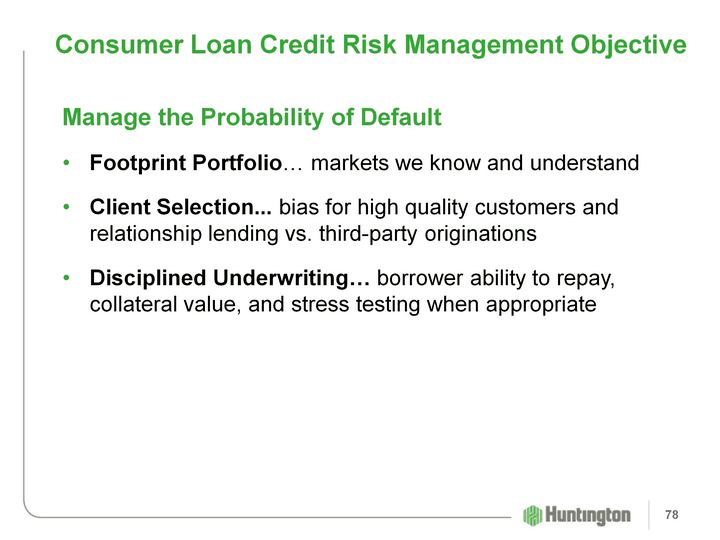
| Consumer Loan Credit Risk Management Objective Manage the Probability of Default Footprint Portfolio... markets we know and understand Client Selection... bias for high quality customers and relationship lending vs. third-party originations Disciplined Underwriting... borrower ability to repay, collateral value, and stress testing when appropriate 78 |
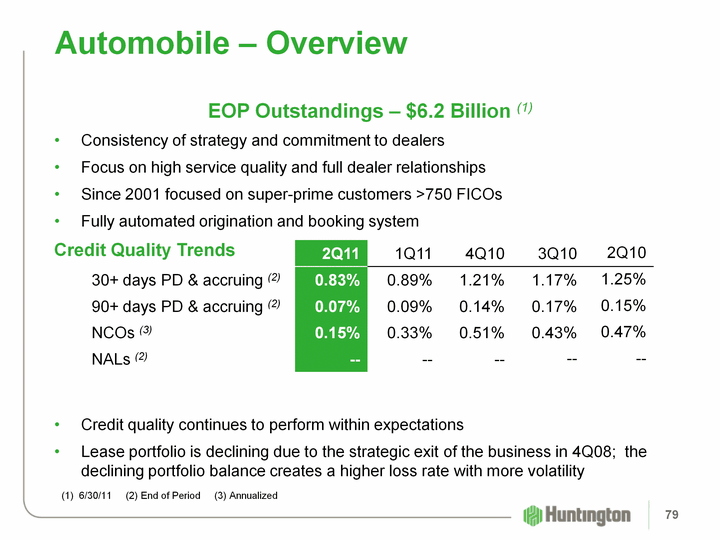
| Automobile - Overview EOP Outstandings - $6.2 Billion (1) Consistency of strategy and commitment to dealers Focus on high service quality and full dealer relationships Since 2001 focused on super-prime customers >750 FICOs Fully automated origination and booking system Credit Quality Trends Credit quality continues to perform within expectations Lease portfolio is declining due to the strategic exit of the business in 4Q08; the declining portfolio balance creates a higher loss rate with more volatility 2Q11 1Q11 4Q10 3Q10 2Q10 30+ days PD & accruing (2) 0.83% 0.89% 1.21% 1.17% 1.25% 90+ days PD & accruing (2) 0.07% 0.09% 0.14% 0.17% 0.15% NCOs (3) 0.15% 0.33% 0.51% 0.43% 0.47% NALs (2) -- -- -- -- -- 79 (1) 6/30/11 (2) End of Period (3) Annualized |
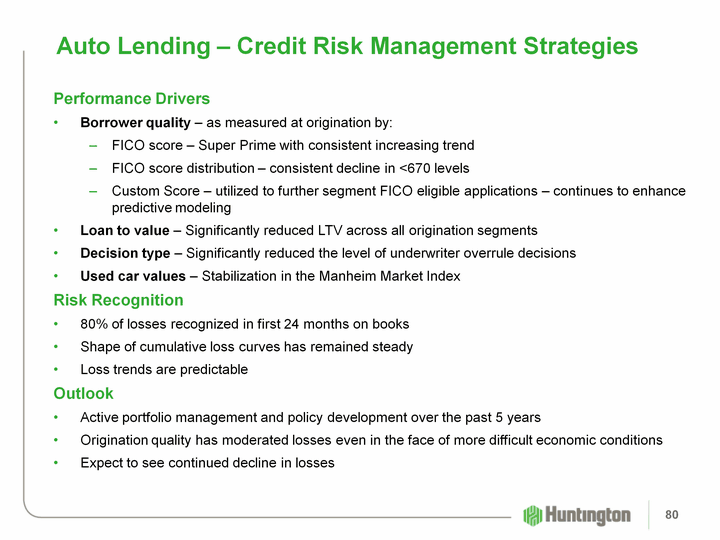
| Auto Lending - Credit Risk Management Strategies Performance Drivers Borrower quality - as measured at origination by: FICO score - Super Prime with consistent increasing trend FICO score distribution - consistent decline in <670 levels Custom Score - utilized to further segment FICO eligible applications - continues to enhance predictive modeling Loan to value - Significantly reduced LTV across all origination segments Decision type - Significantly reduced the level of underwriter overrule decisions Used car values - Stabilization in the Manheim Market Index Risk Recognition 80% of losses recognized in first 24 months on books Shape of cumulative loss curves has remained steady Loss trends are predictable Outlook Active portfolio management and policy development over the past 5 years Origination quality has moderated losses even in the face of more difficult economic conditions Expect to see continued decline in losses 80 |
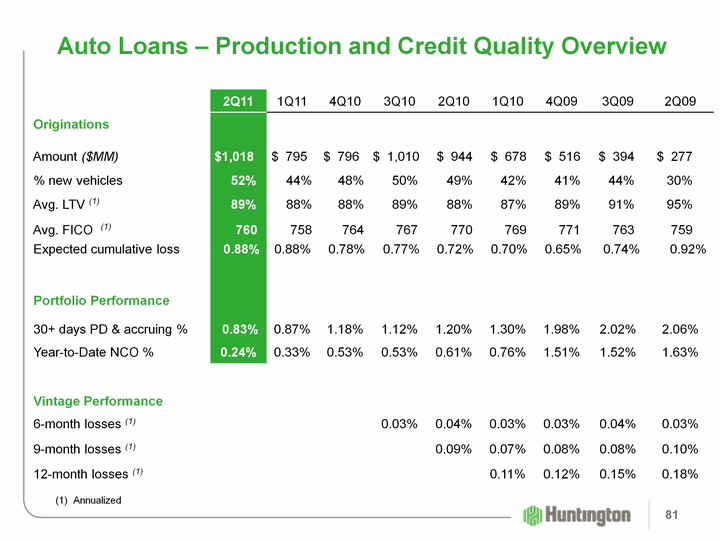
| Auto Loans - Production and Credit Quality Overview Auto Loans - Production and Credit Quality Overview (1) Annualized 81 |
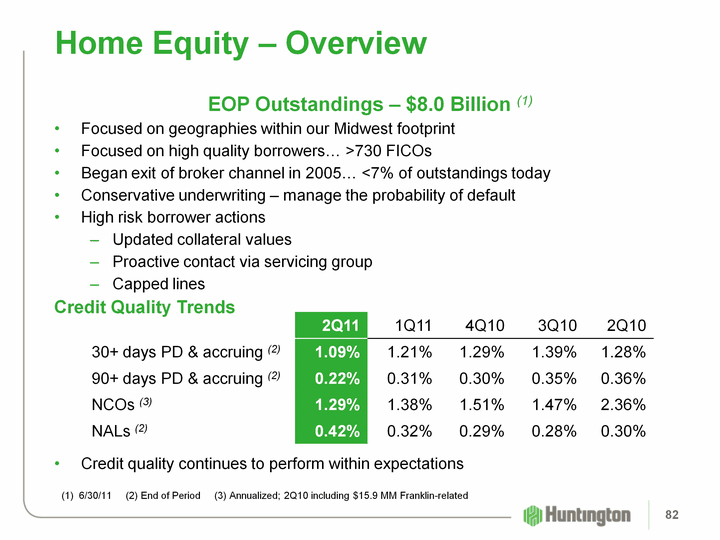
| Home Equity - Overview EOP Outstandings - $8.0 Billion (1) Focused on geographies within our Midwest footprint Focused on high quality borrowers... >730 FICOs Began exit of broker channel in 2005... <7% of outstandings today Conservative underwriting - manage the probability of default High risk borrower actions Updated collateral values Proactive contact via servicing group Capped lines Credit Quality Trends Credit quality continues to perform within expectations 2Q11 1Q11 4Q10 3Q10 2Q10 30+ days PD & accruing (2) 1.09% 1.21% 1.29% 1.39% 1.28% 90+ days PD & accruing (2) 0.22% 0.31% 0.30% 0.35% 0.36% NCOs (3) 1.29% 1.38% 1.51% 1.47% 2.36% NALs (2) 0.42% 0.32% 0.29% 0.28% 0.30% 82 (1) 6/30/11 (2) End of Period (3) Annualized; 2Q10 including $15.9 MM Franklin-related |
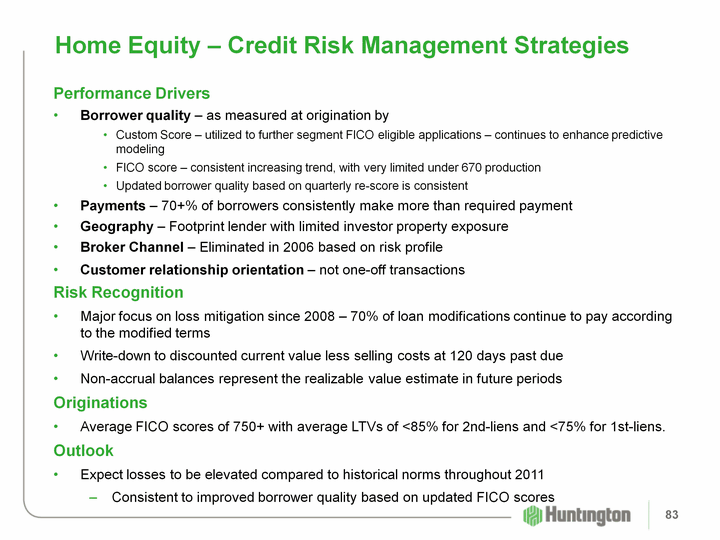
| Home Equity - Credit Risk Management Strategies Performance Drivers Borrower quality - as measured at origination by Custom Score - utilized to further segment FICO eligible applications - continues to enhance predictive modeling FICO score - consistent increasing trend, with very limited under 670 production Updated borrower quality based on quarterly re-score is consistent Payments - 70+% of borrowers consistently make more than required payment Geography - Footprint lender with limited investor property exposure Broker Channel - Eliminated in 2006 based on risk profile Customer relationship orientation - not one-off transactions Risk Recognition Major focus on loss mitigation since 2008 - 70% of loan modifications continue to pay according to the modified terms Write-down to discounted current value less selling costs at 120 days past due Non-accrual balances represent the realizable value estimate in future periods Originations Average FICO scores of 750+ with average LTVs of <85% for 2nd-liens and <75% for 1st-liens. Outlook Expect losses to be elevated compared to historical norms throughout 2011 Consistent to improved borrower quality based on updated FICO scores 83 |
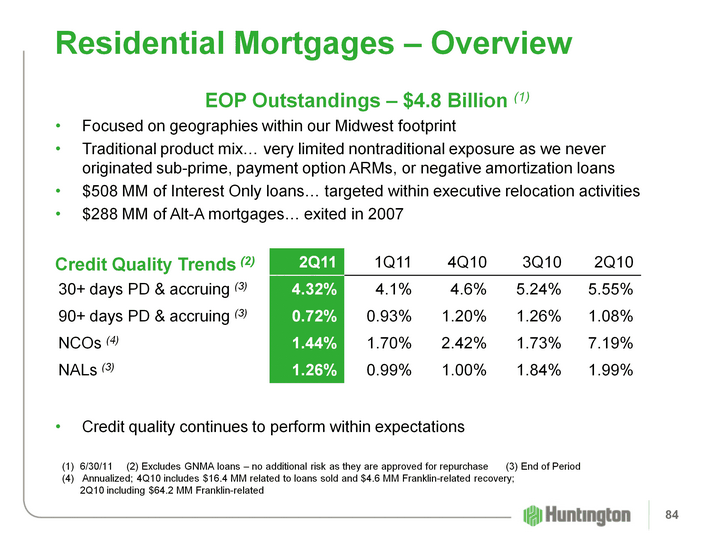
| EOP Outstandings - $4.8 Billion (1) Focused on geographies within our Midwest footprint Traditional product mix... very limited nontraditional exposure as we never originated sub-prime, payment option ARMs, or negative amortization loans $508 MM of Interest Only loans... targeted within executive relocation activities $288 MM of Alt-A mortgages... exited in 2007 Credit Quality Trends (2) Credit quality continues to perform within expectations 2Q11 1Q11 4Q10 3Q10 2Q10 30+ days PD & accruing (3) 4.32% 4.1% 4.6% 5.24% 5.55% 90+ days PD & accruing (3) 0.72% 0.93% 1.20% 1.26% 1.08% NCOs (4) 1.44% 1.70% 2.42% 1.73% 7.19% NALs (3) 1.26% 0.99% 1.00% 1.84% 1.99% Residential Mortgages - Overview 84 6/30/11 (2) Excludes GNMA loans - no additional risk as they are approved for repurchase (3) End of Period (4) Annualized; 4Q10 includes $16.4 MM related to loans sold and $4.6 MM Franklin-related recovery; 2Q10 including $64.2 MM Franklin-related |
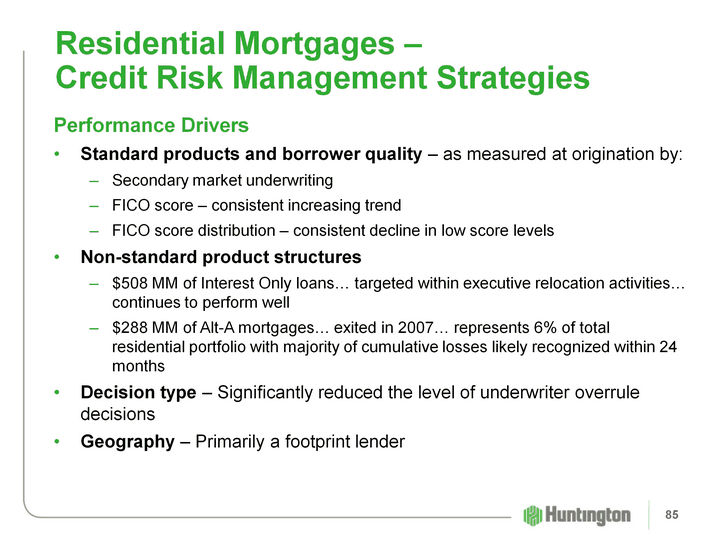
| Residential Mortgages - Credit Risk Management Strategies Performance Drivers Standard products and borrower quality - as measured at origination by: Secondary market underwriting FICO score - consistent increasing trend FICO score distribution - consistent decline in low score levels Non-standard product structures $508 MM of Interest Only loans... targeted within executive relocation activities... continues to perform well $288 MM of Alt-A mortgages... exited in 2007... represents 6% of total residential portfolio with majority of cumulative losses likely recognized within 24 months Decision type - Significantly reduced the level of underwriter overrule decisions Geography - Primarily a footprint lender 85 |
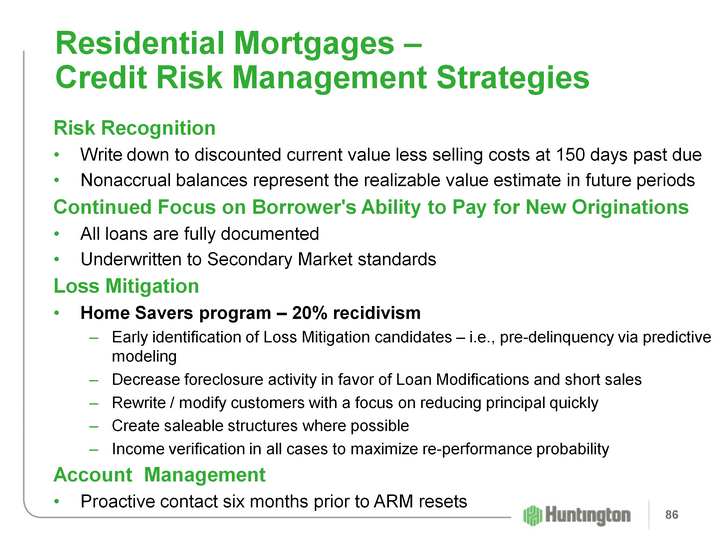
| Residential Mortgages - Credit Risk Management Strategies Risk Recognition Write down to discounted current value less selling costs at 150 days past due Nonaccrual balances represent the realizable value estimate in future periods Continued Focus on Borrower's Ability to Pay for New Originations All loans are fully documented Underwritten to Secondary Market standards Loss Mitigation Home Savers program - 20% recidivism Early identification of Loss Mitigation candidates - i.e., pre-delinquency via predictive modeling Decrease foreclosure activity in favor of Loan Modifications and short sales Rewrite / modify customers with a focus on reducing principal quickly Create saleable structures where possible Income verification in all cases to maximize re-performance probability Account Management Proactive contact six months prior to ARM resets 86 |
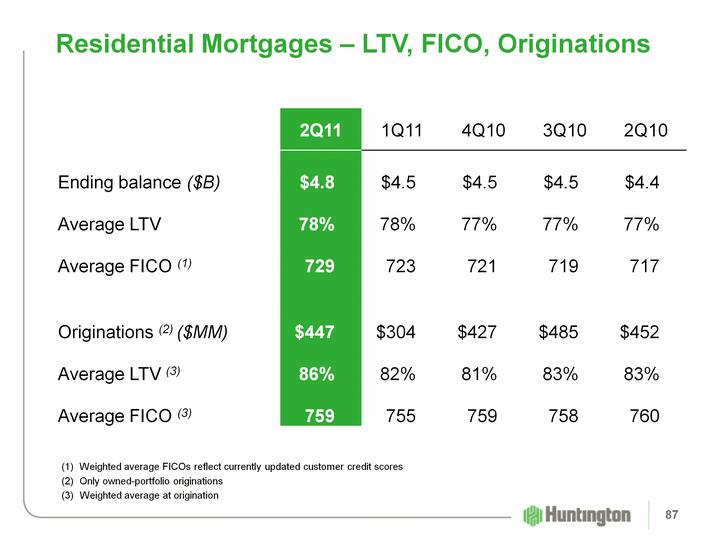
| Residential Mortgages - LTV, FICO, Originations (1) Weighted average FICOs reflect currently updated customer credit scores (2) Only owned-portfolio originations Weighted average at origination 2Q11 1Q11 4Q10 3Q10 2Q10 Ending balance ($B) $4.8 $4.5 $4.5 $4.5 $4.4 Average LTV 78% 78% 77% 77% 77% Average FICO (1) 729 723 721 719 717 Originations (2) ($MM) $447 $304 $427 $485 $452 Average LTV (3) 86% 82% 81% 83% 83% Average FICO (3) 759 755 759 758 760 87 |
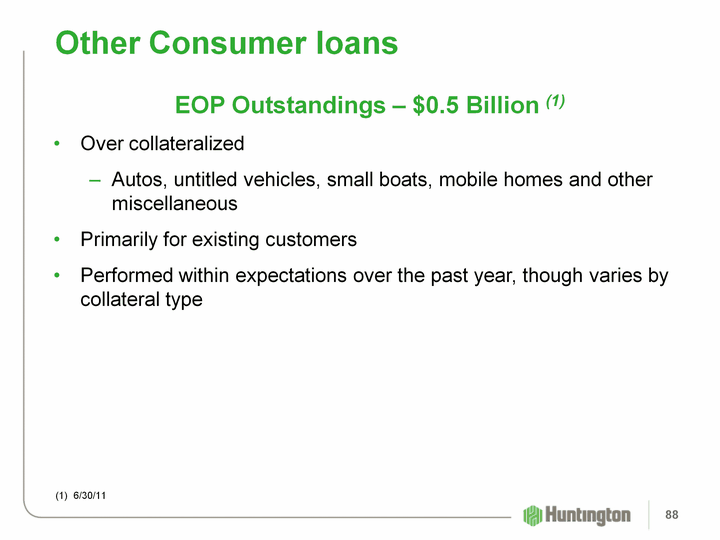
| Other Consumer loans EOP Outstandings - $0.5 Billion (1) Over collateralized Autos, untitled vehicles, small boats, mobile homes and other miscellaneous Primarily for existing customers Performed within expectations over the past year, though varies by collateral type (1) 6/30/11 88 |

| Credit Quality Review 89 |
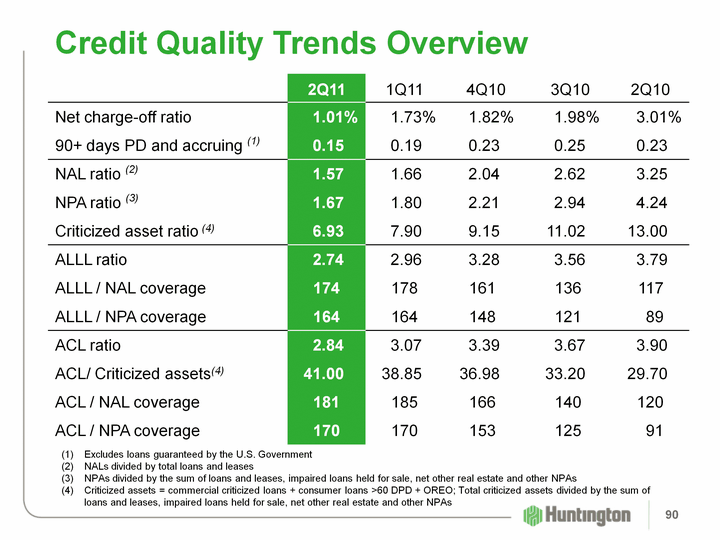
| Credit Quality Trends Overview Credit Quality Trends Overview Excludes loans guaranteed by the U.S. Government NALs divided by total loans and leases (3) NPAs divided by the sum of loans and leases, impaired loans held for sale, net other real estate and other NPAs (4) Criticized assets = commercial criticized loans + consumer loans >60 DPD + OREO; Total criticized assets divided by the sum of loans and leases, impaired loans held for sale, net other real estate and other NPAs 90 |
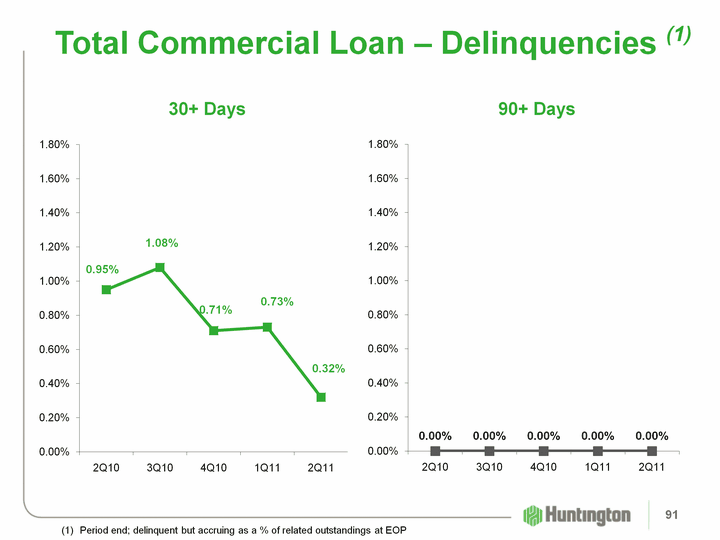
| Total Commercial Loan - Delinquencies (1) (CHART) (CHART) (1) Period end; delinquent but accruing as a % of related outstandings at EOP 90+ Days 30+ Days 91 |
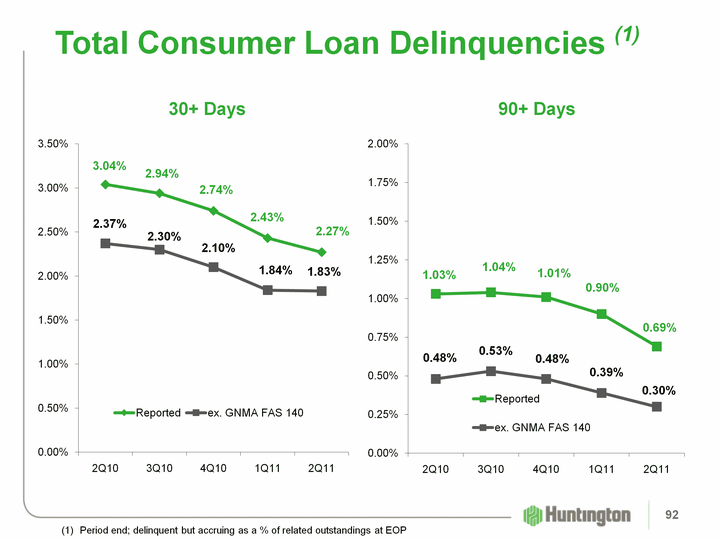
| (CHART) Total Consumer Loan Delinquencies (1) (CHART) 90+ Days 30+ Days (1) Period end; delinquent but accruing as a % of related outstandings at EOP 92 |
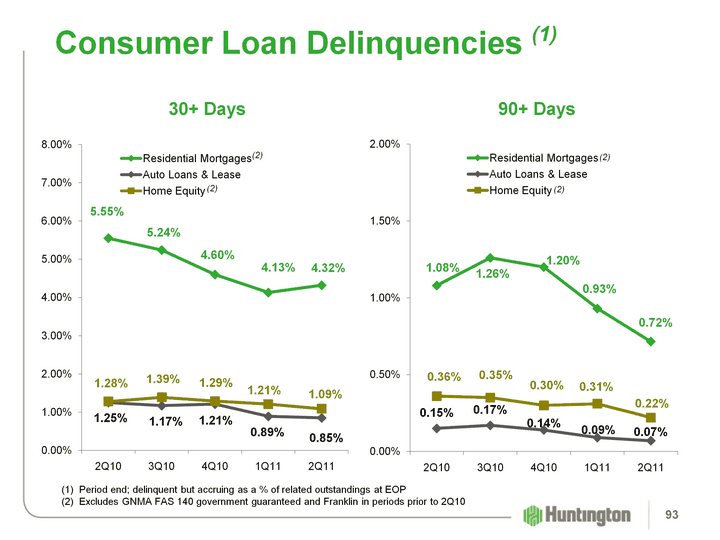
| Consumer Loan Delinquencies (1) (CHART) (1) Period end; delinquent but accruing as a % of related outstandings at EOP (2) Excludes GNMA FAS 140 government guaranteed and Franklin in periods prior to 2Q10 (CHART) (2) (2) (2) (2) 90+ Days 30+ Days 93 |
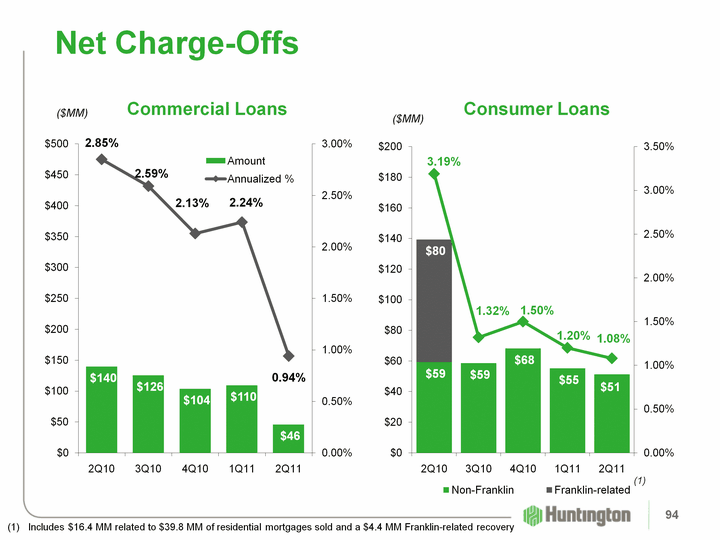
| (CHART) Net Charge-Offs ($MM) ($MM) Consumer Loans Commercial Loans (2) (CHART) (1) Includes $16.4 MM related to $39.8 MM of residential mortgages sold and a $4.4 MM Franklin-related recovery (1) 94 |
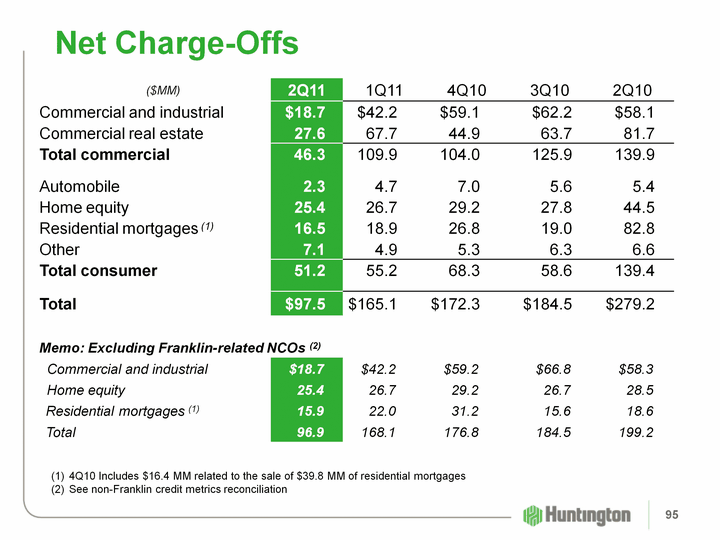
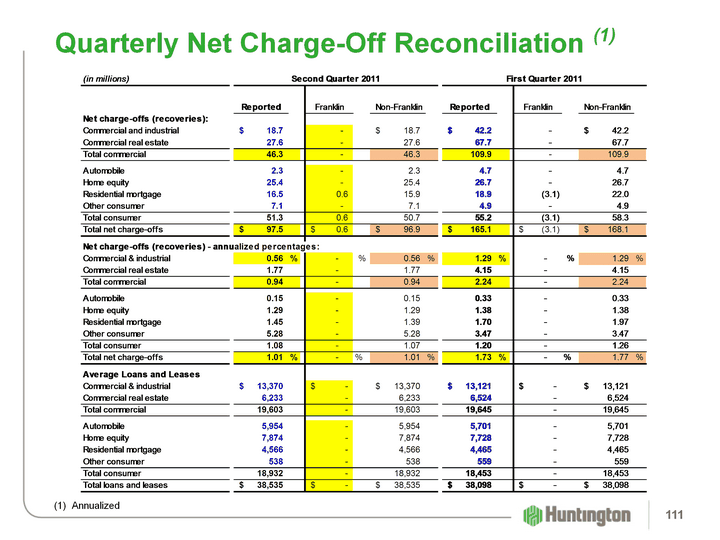
| Net Charge-Offs ($MM) 2Q11 1Q11 4Q10 3Q10 2Q10 Commercial and industrial $18.7 $42.2 $59.1 $62.2 $58.1 Commercial real estate 27.6 67.7 44.9 63.7 81.7 Total commercial 46.3 109.9 104.0 125.9 139.9 Automobile 2.3 4.7 7.0 5.6 5.4 Home equity 25.4 26.7 29.2 27.8 44.5 Residential mortgages (1) 16.5 18.9 26.8 19.0 82.8 Other 7.1 4.9 5.3 6.3 6.6 Total consumer 51.2 55.2 68.3 58.6 139.4 Total $97.5 $165.1 $172.3 $184.5 $279.2 Memo: Excluding Franklin-related NCOs (2) Memo: Excluding Franklin-related NCOs (2) Memo: Excluding Franklin-related NCOs (2) Commercial and industrial $18.7 $42.2 $59.2 $66.8 $58.3 Home equity 25.4 26.7 29.2 26.7 28.5 Residential mortgages (1) 15.9 22.0 31.2 15.6 18.6 Total 96.9 168.1 176.8 184.5 199.2 4Q10 Includes $16.4 MM related to the sale of $39.8 MM of residential mortgages See non-Franklin credit metrics reconciliation 95 |
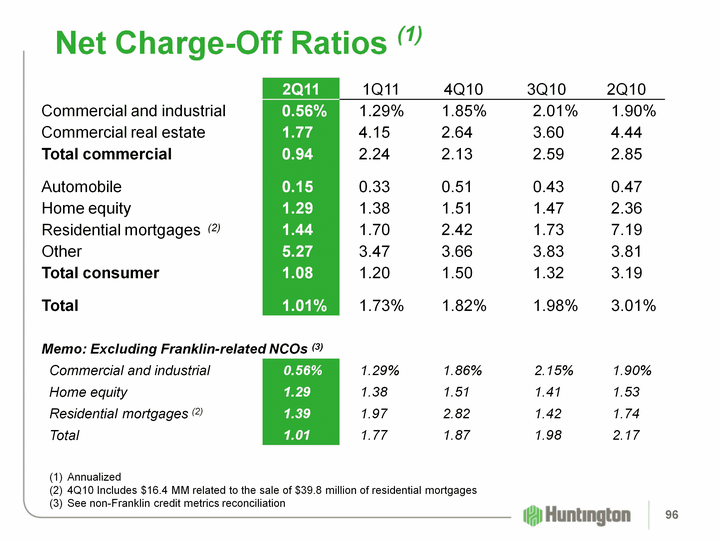
| Net Charge-Off Ratios (1) 2Q11 1Q11 4Q10 3Q10 2Q10 Commercial and industrial 0.56% 1.29% 1.85% 2.01% 1.90% Commercial real estate 1.77 4.15 2.64 3.60 4.44 Total commercial 0.94 2.24 2.13 2.59 2.85 Automobile 0.15 0.33 0.51 0.43 0.47 Home equity 1.29 1.38 1.51 1.47 2.36 Residential mortgages (2) 1.44 1.70 2.42 1.73 7.19 Other 5.27 3.47 3.66 3.83 3.81 Total consumer 1.08 1.20 1.50 1.32 3.19 Total 1.01% 1.73% 1.82% 1.98% 3.01% Memo: Excluding Franklin-related NCOs (3) Memo: Excluding Franklin-related NCOs (3) Memo: Excluding Franklin-related NCOs (3) Commercial and industrial 0.56% 1.29% 1.86% 2.15% 1.90% Home equity 1.29 1.38 1.51 1.41 1.53 Residential mortgages (2) 1.39 1.97 2.82 1.42 1.74 Total 1.01 1.77 1.87 1.98 2.17 Annualized 4Q10 Includes $16.4 MM related to the sale of $39.8 million of residential mortgages See non-Franklin credit metrics reconciliation 96 |
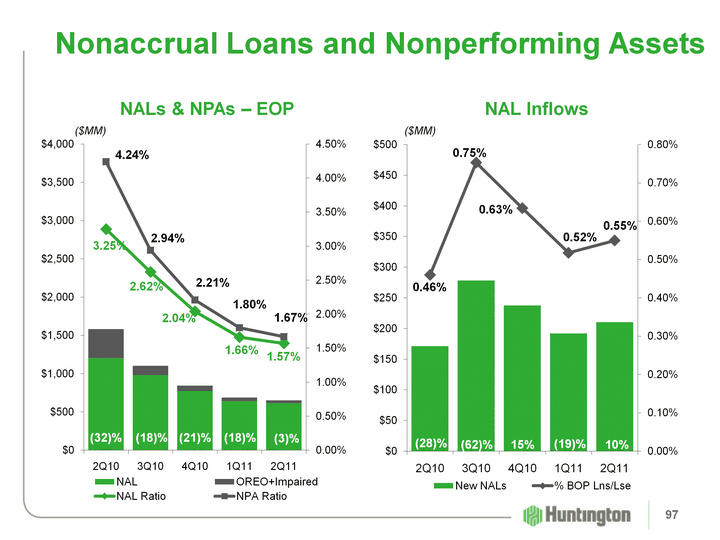
| (CHART) Nonaccrual Loans and Nonperforming Assets ($MM) (CHART) ($MM) (62)% (21)% (32)% (18)% (28)% NAL Inflows NALs & NPAs - EOP (18)% 15% (3)% 10% (19)% 97 |
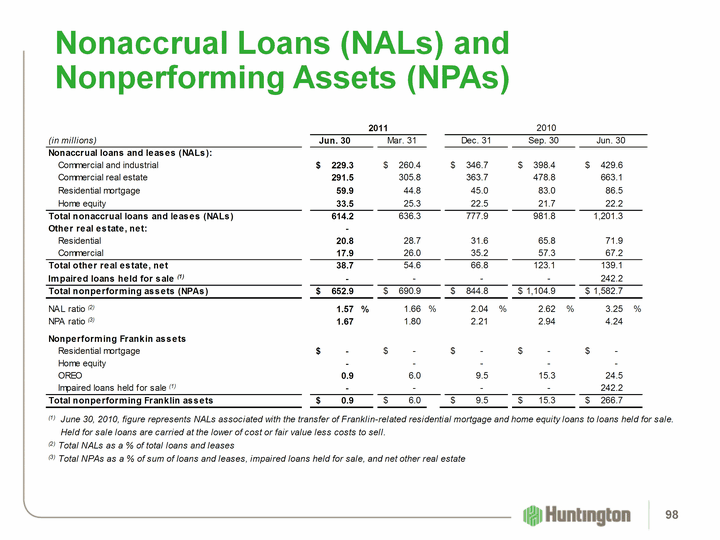
| Nonaccrual Loans (NALs) and Nonperforming Assets (NPAs) 98 |
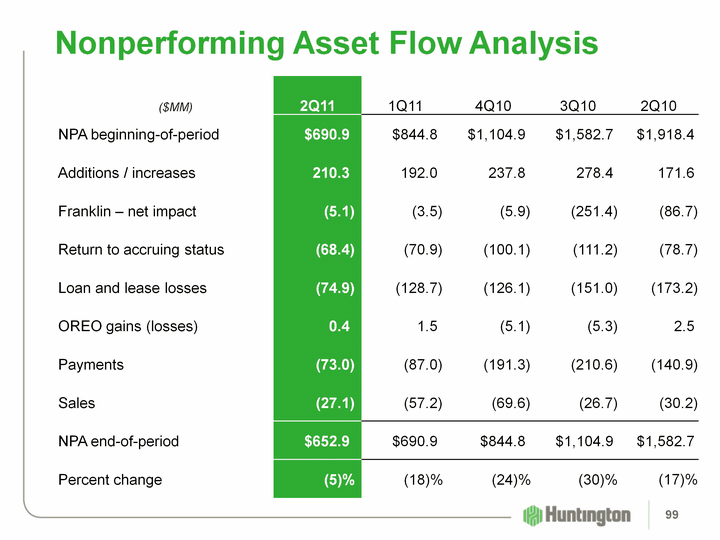
| ($MM) 2Q11 1Q11 4Q10 3Q10 2Q10 NPA beginning-of-period $690.9 $844.8 $1,104.9 $1,582.7 $1,918.4 Additions / increases 210.3 192.0 237.8 278.4 171.6 Franklin - net impact (5.1) (3.5) (5.9) (251.4) (86.7) Return to accruing status (68.4) (70.9) (100.1) (111.2) (78.7) Loan and lease losses (74.9) (128.7) (126.1) (151.0) (173.2) OREO gains (losses) 0.4 1.5 (5.1) (5.3) 2.5 Payments (73.0) (87.0) (191.3) (210.6) (140.9) Sales (27.1) (57.2) (69.6) (26.7) (30.2) NPA end-of-period $652.9 $690.9 $844.8 $1,104.9 $1,582.7 Percent change (5)% (18)% (24)% (30)% (17)% Nonperforming Asset Flow Analysis 99 |
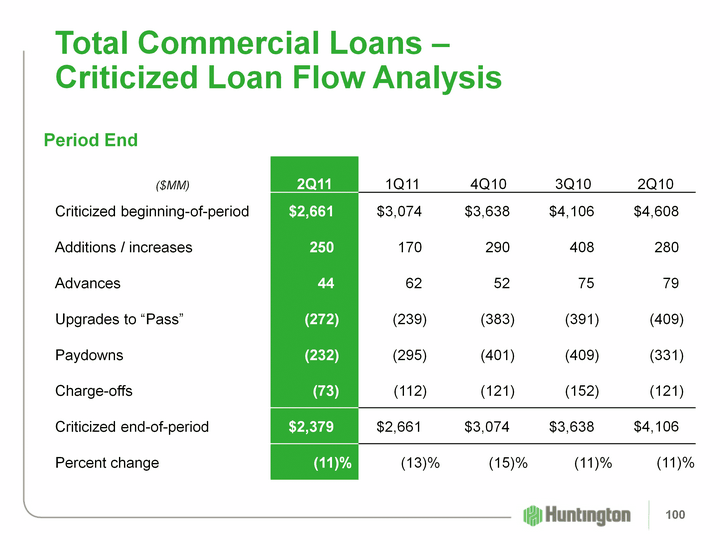
| ($MM) 2Q11 1Q11 4Q10 3Q10 2Q10 Criticized beginning-of-period $2,661 $3,074 $3,638 $4,106 $4,608 Additions / increases 250 170 290 408 280 Advances 44 62 52 75 79 Upgrades to "Pass" (272) (239) (383) (391) (409) Paydowns (232) (295) (401) (409) (331) Charge-offs (73) (112) (121) (152) (121) Criticized end-of-period $2,379 $2,661 $3,074 $3,638 $4,106 Percent change (11)% (13)% (15)% (11)% (11)% Total Commercial Loans - Criticized Loan Flow Analysis Period End 100 |
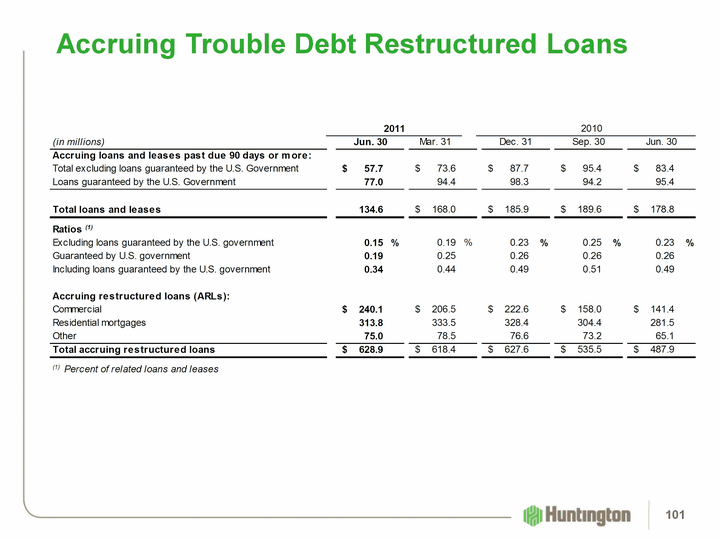
| Accruing Trouble Debt Restructured Loans 101 |
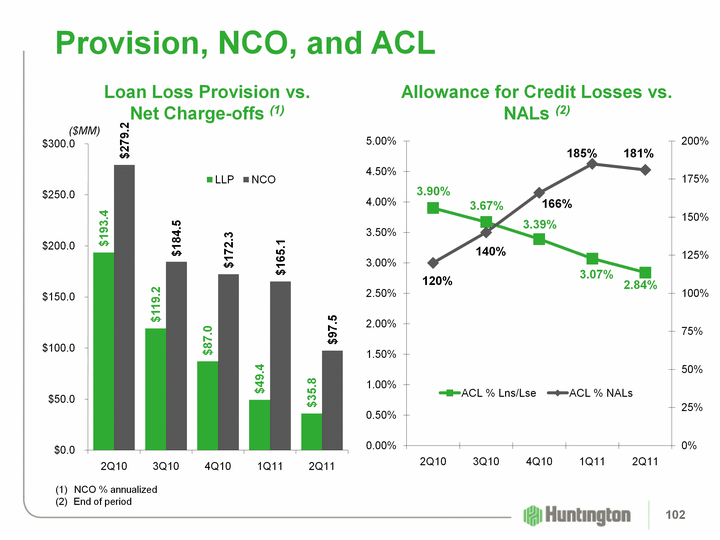
| (CHART) Provision, NCO, and ACL ($MM) (1) NCO % annualized End of period (CHART) Allowance for Credit Losses vs. NALs (2) Loan Loss Provision vs. Net Charge-offs (1) 102 |
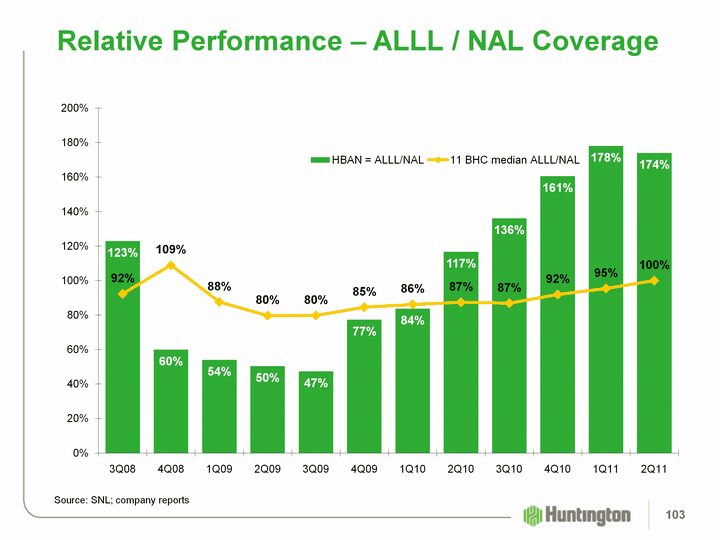
| (CHART) Relative Performance - ALLL / NAL Coverage Source: SNL; company reports 103 |
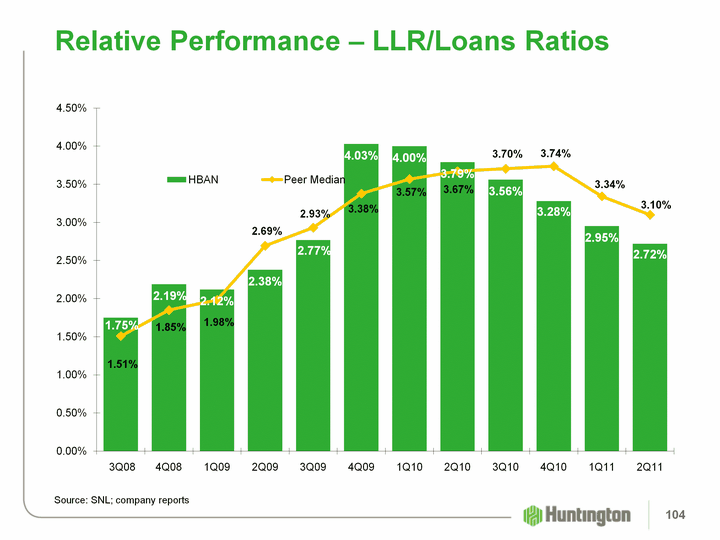
| (CHART) Relative Performance - LLR/Loans Ratios Source: SNL; company reports 104 |
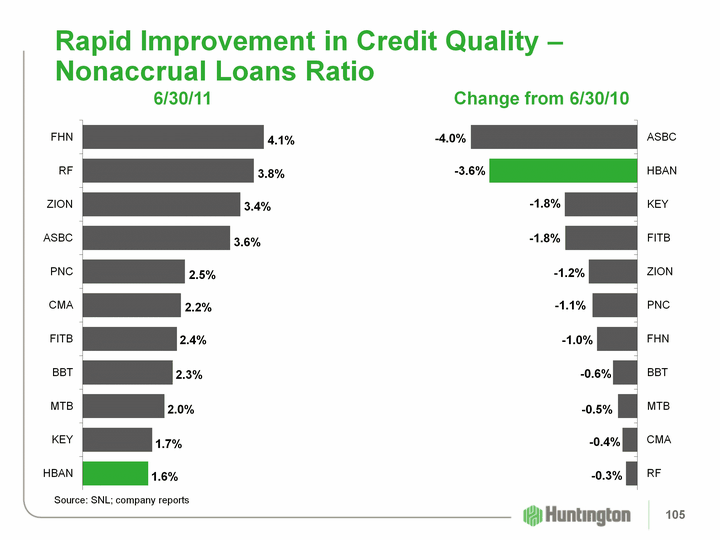
| Rapid Improvement in Credit Quality - Nonaccrual Loans Ratio 6/30/11 Change from 6/30/10 (CHART) Source: SNL; company reports (CHART) 105 |
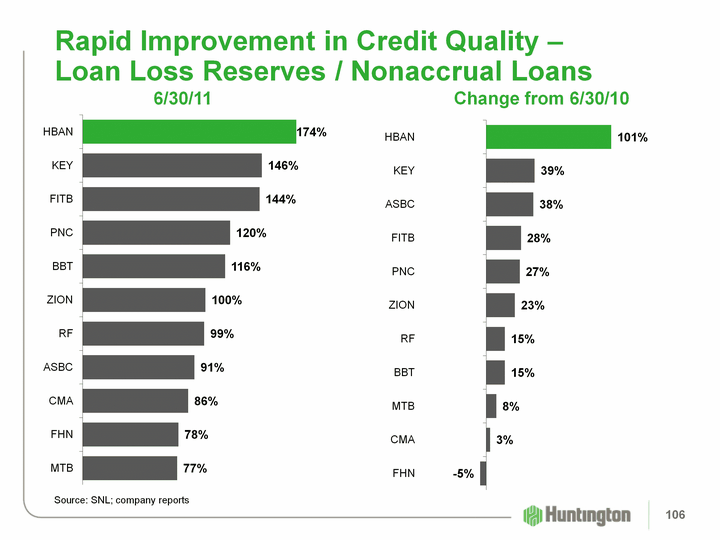
| Rapid Improvement in Credit Quality - Loan Loss Reserves / Nonaccrual Loans (CHART) (CHART) Source: SNL; company reports 6/30/11 Change from 6/30/10 106 |
| Non-Franklin Credit Metrics Reconciliations 107 |
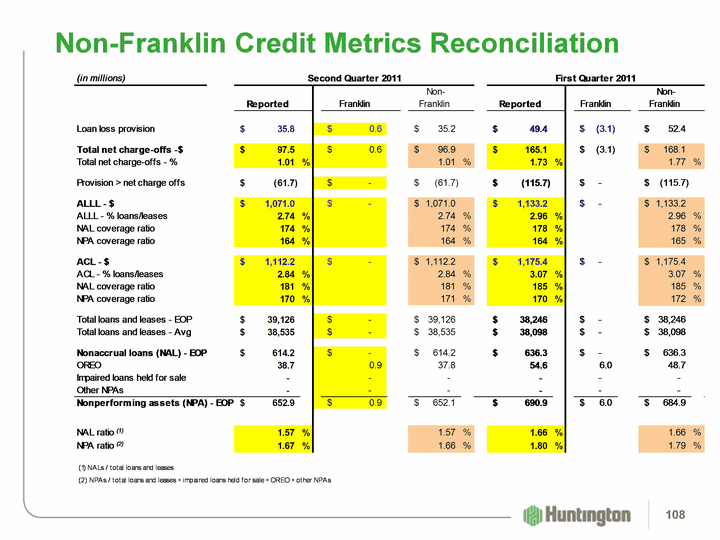
| Non-Franklin Credit Metrics Reconciliation 108 |
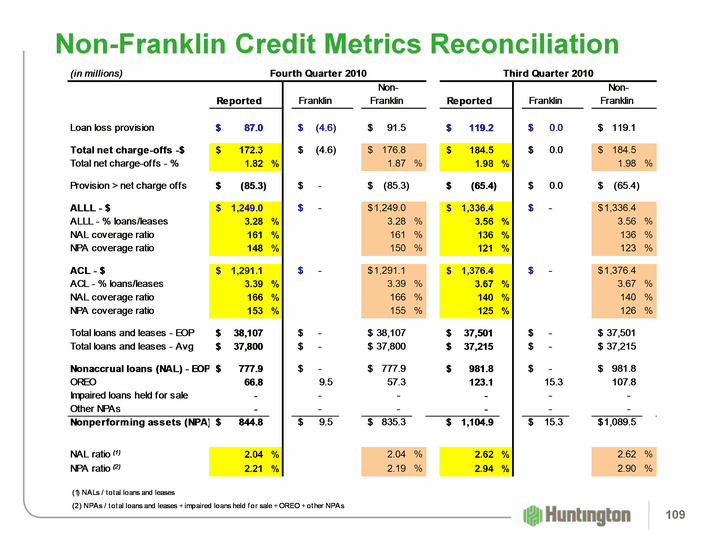
| Non-Franklin Credit Metrics Reconciliation 109 |
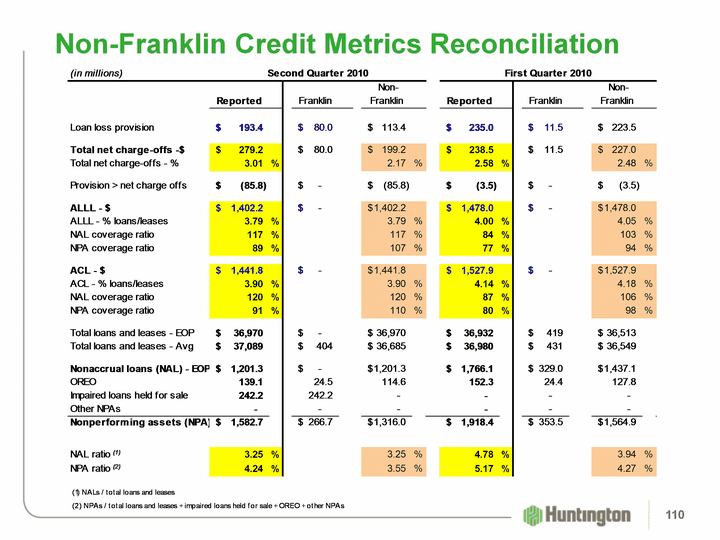
| Non-Franklin Credit Metrics Reconciliation 110 |
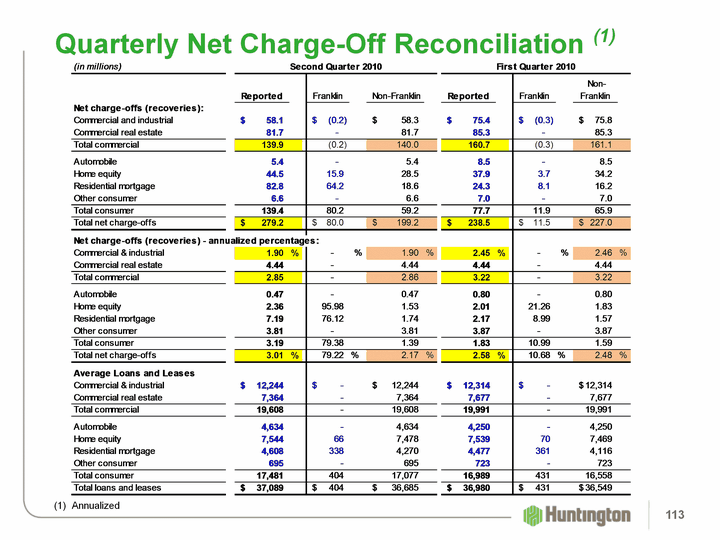
| Quarterly Net Charge-Off Reconciliation (1) (1) Annualized 111 |
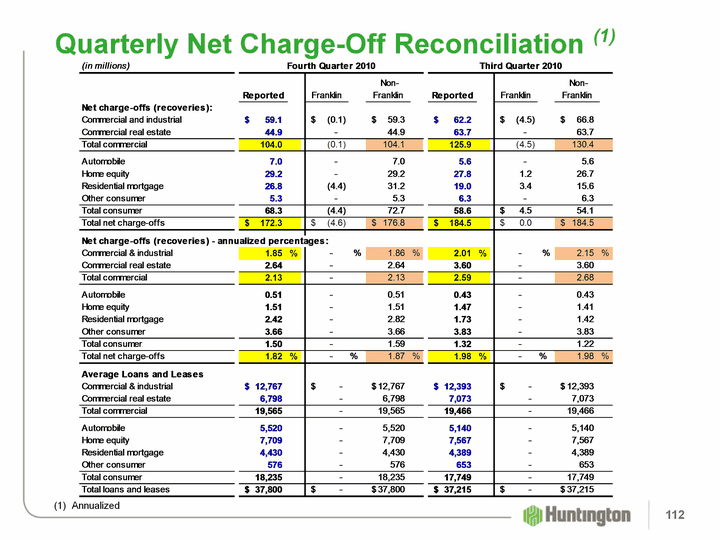
| Quarterly Net Charge-Off Reconciliation (1) (1) Annualized 112 |
| Quarterly Net Charge-Off Reconciliation (1) (1) Annualized 113 |
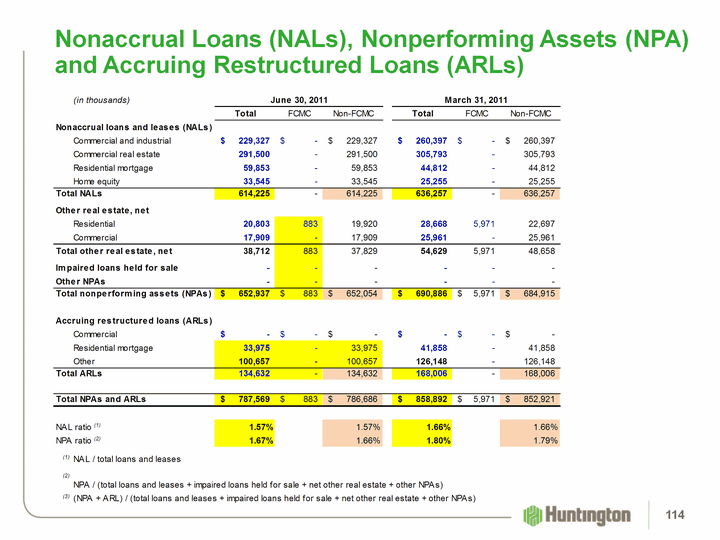
| Nonaccrual Loans (NALs), Nonperforming Assets (NPA) and Accruing Restructured Loans (ARLs) 114 |
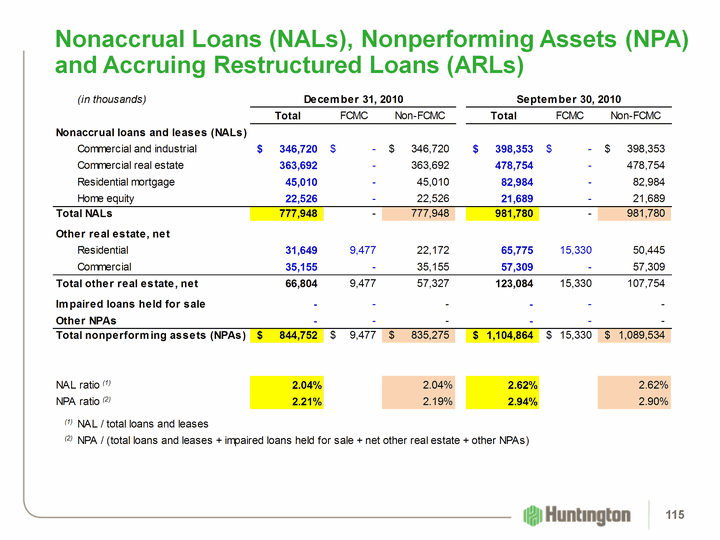
| Nonaccrual Loans (NALs), Nonperforming Assets (NPA) and Accruing Restructured Loans (ARLs) 115 |
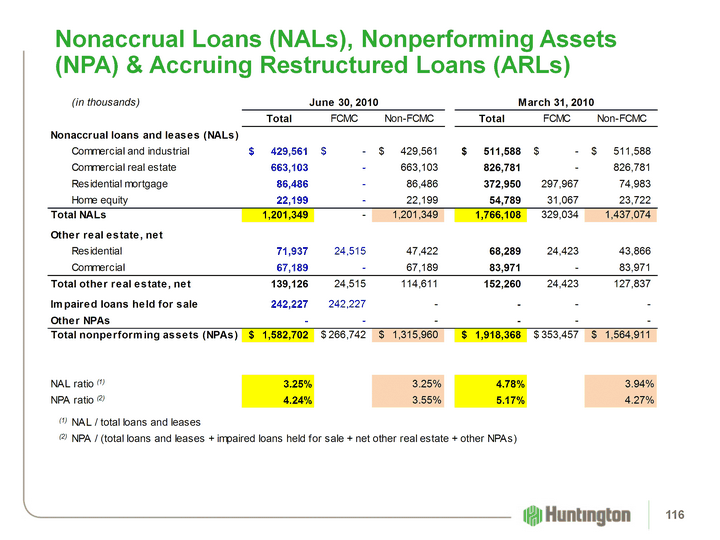
| Nonaccrual Loans (NALs), Nonperforming Assets (NPA) & Accruing Restructured Loans (ARLs) 116 |

| Deposits and Other Funding 117 |
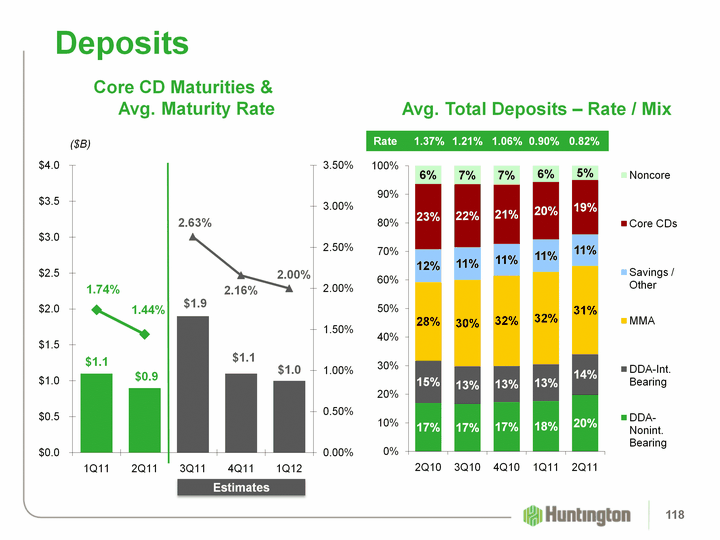
| (CHART) (CHART) Deposits ($B) Avg. Total Deposits - Rate / Mix Core CD Maturities & Avg. Maturity Rate Rate 1.37% 1.21% 1.06% 0.90% 0.82% Estimates 118 |
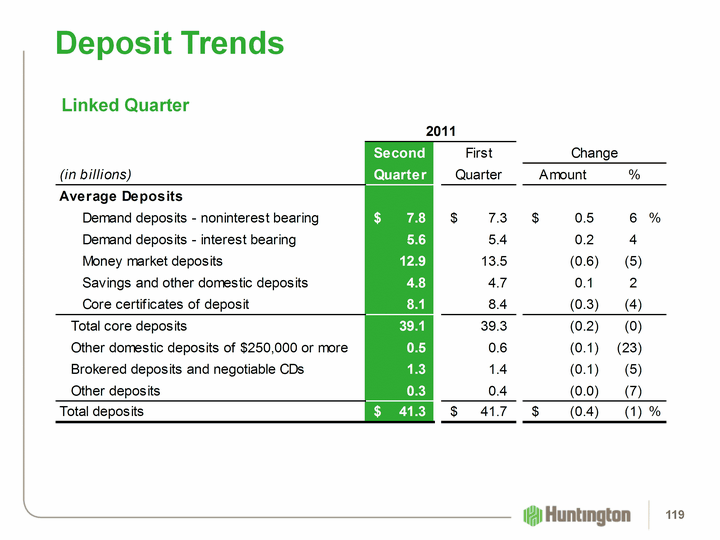
| Deposit Trends Linked Quarter 119 |
| Deposit Trends Prior-Year Quarter 120 |
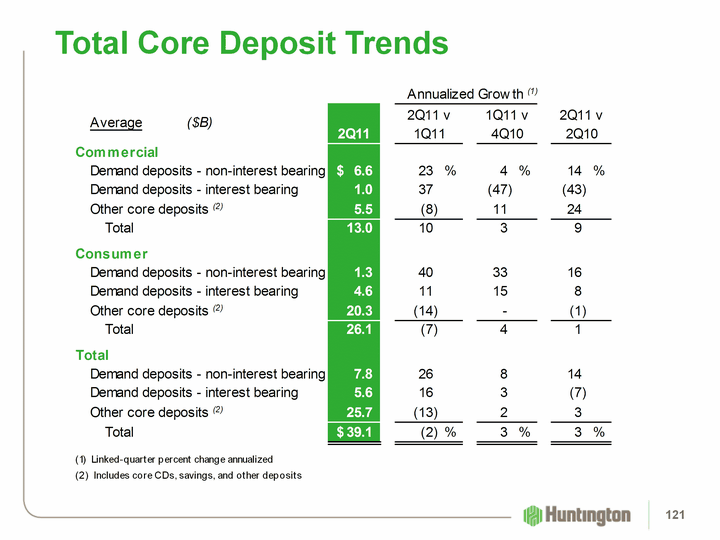
| Total Core Deposit Trends 121 |
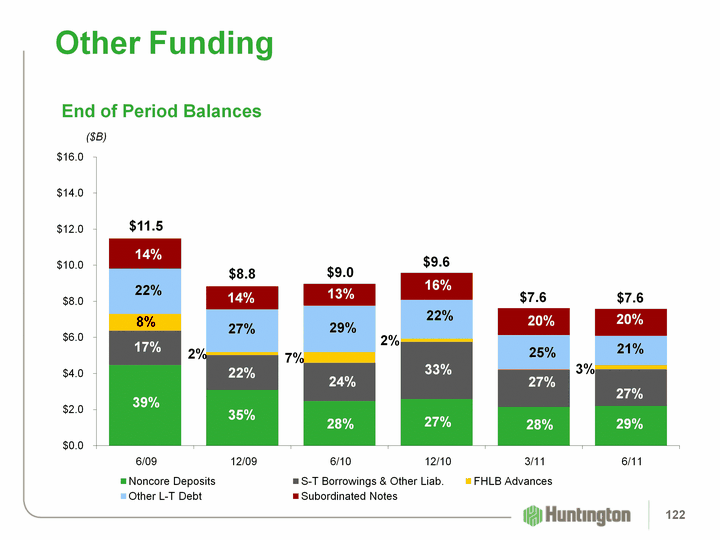
| (CHART) Other Funding End of Period Balances ($B) $11.5 14% 22% 29% 16% 8% 7% 39% 33% 17% 13% $8.8 14% 27% 2% 35% 22% $7.6 20% 3% 25% 29% 27% $9.0 20% 24% 2% 28% 27% 122 |

| Capital 123 |
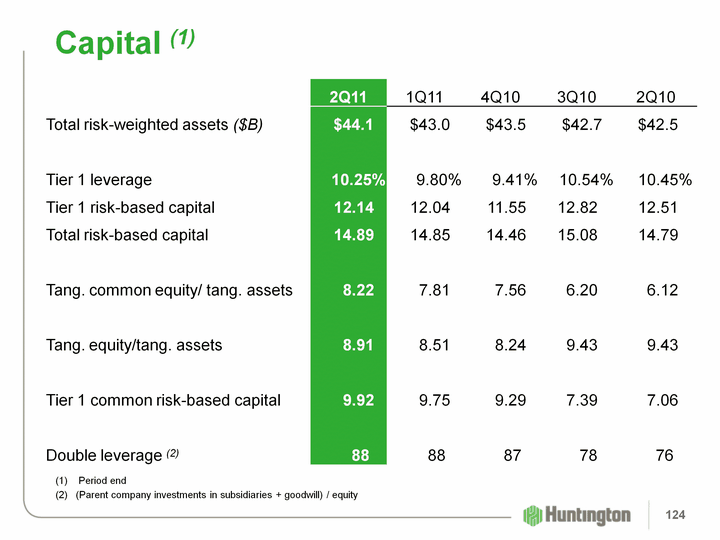
| Capital (1) 2Q11 1Q11 4Q10 3Q10 2Q10 Total risk-weighted assets ($B) $44.1 $43.0 $43.5 $42.7 $42.5 Tier 1 leverage 10.25% 9.80% 9.41% 10.54% 10.45% Tier 1 risk-based capital 12.14 12.04 11.55 12.82 12.51 Total risk-based capital 14.89 14.85 14.46 15.08 14.79 Tang. common equity/ tang. assets 8.22 7.81 7.56 6.20 6.12 Tang. equity/tang. assets 8.91 8.51 8.24 9.43 9.43 Tier 1 common risk-based capital 9.92 9.75 9.29 7.39 7.06 Double leverage (2) 88 88 87 78 76 (1) Period end (2) (Parent company investments in subsidiaries + goodwill) / equity 124 |
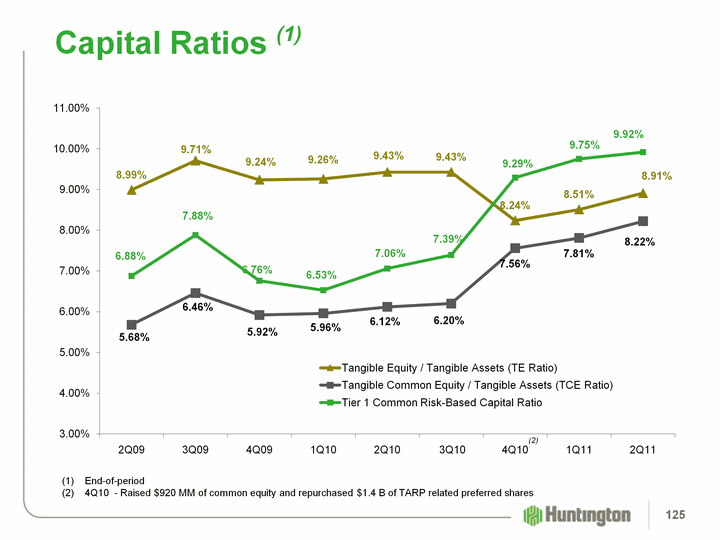
| (CHART) Capital Ratios (1) End-of-period 4Q10 - Raised $920 MM of common equity and repurchased $1.4 B of TARP related preferred shares (2) 125 |
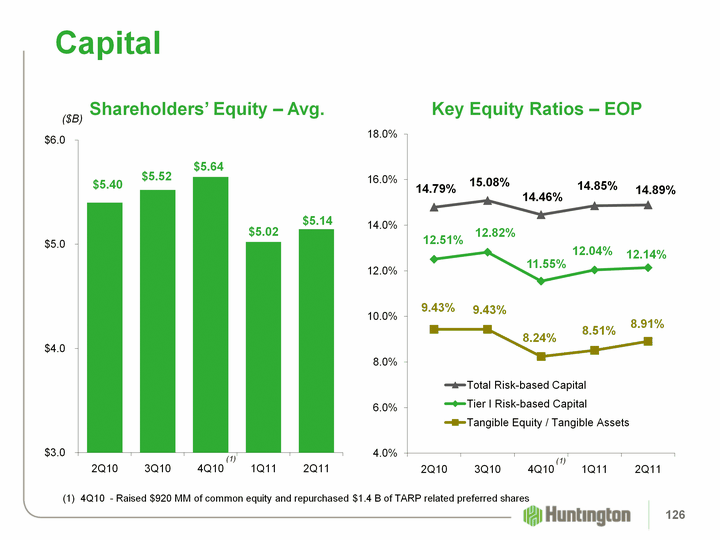
| (CHART) Shareholders' Equity - Avg. (CHART) Capital Key Equity Ratios - EOP ($B) 126 4Q10 - Raised $920 MM of common equity and repurchased $1.4 B of TARP related preferred shares |
| (CHART) Capital Analysis - 6/30/11 (CHART) Source: SNL, Company reports. Tier 1 Common Risk-Based Tangible Common Equity TARP- fully repaid 127 |

| Franchise and Leadership 128 |
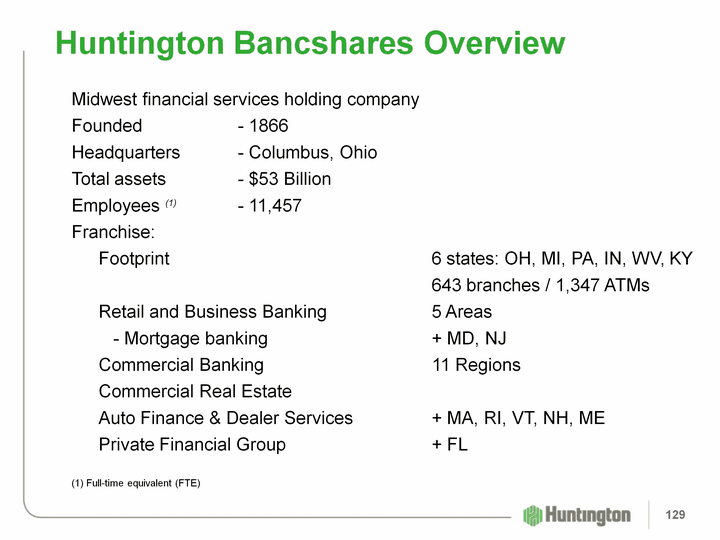
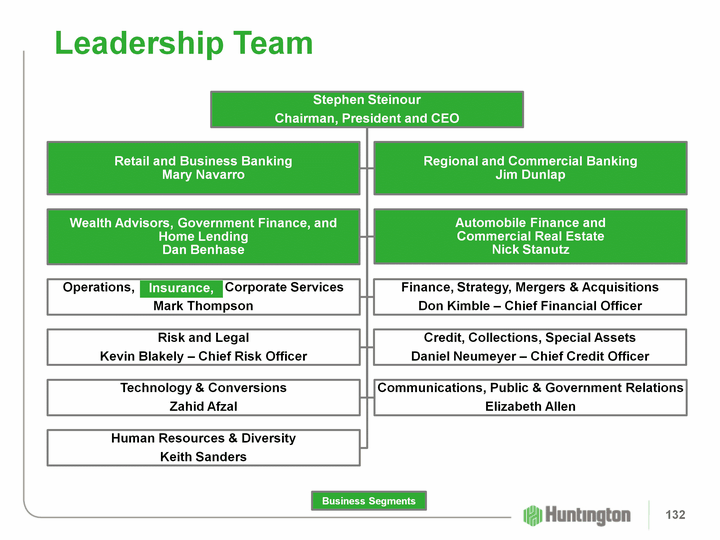
| Huntington Bancshares Overview Midwest financial services holding company Founded - 1866 Headquarters - Columbus, Ohio Total assets - $53 Billion Employees (1) - 11,457 Franchise: Footprint 6 states: OH, MI, PA, IN, WV, KY 643 branches / 1,347 ATMs Retail and Business Banking 5 Areas - Mortgage banking + MD, NJ Commercial Banking 11 Regions Commercial Real Estate Auto Finance & Dealer Services + MA, RI, VT, NH, ME Private Financial Group + FL (1) Full-time equivalent (FTE) 129 |
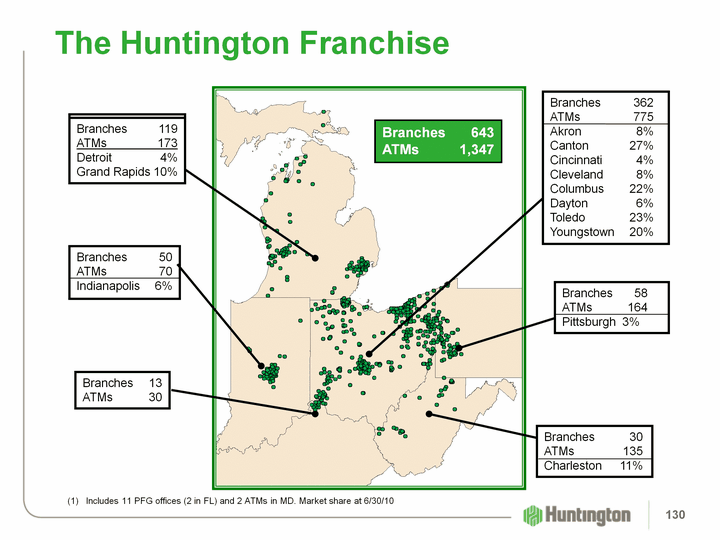
| The Huntington Franchise Branches 119 ATMs 240 Detroit 4% Grand Rapids 10% Branches 362 ATMs 775 Akron 8% Canton 27% Cincinnati 4% Cleveland 8% Columbus 22% Dayton 6% Toledo 23% Youngstown 20% Branches 50 ATMs 70 Indianapolis 6% Branches 13 ATMs 30 Branches 30 ATMs 135 Charleston 11% Includes 11 PFG offices (2 in FL) and 2 ATMs in MD. Market share at 6/30/10 Branches 643 ATMs 1,347 Branches 58 ATMs 164 Pittsburgh 3% Branches 119 ATMs 173 Detroit 4% Grand Rapids 10% 130 |
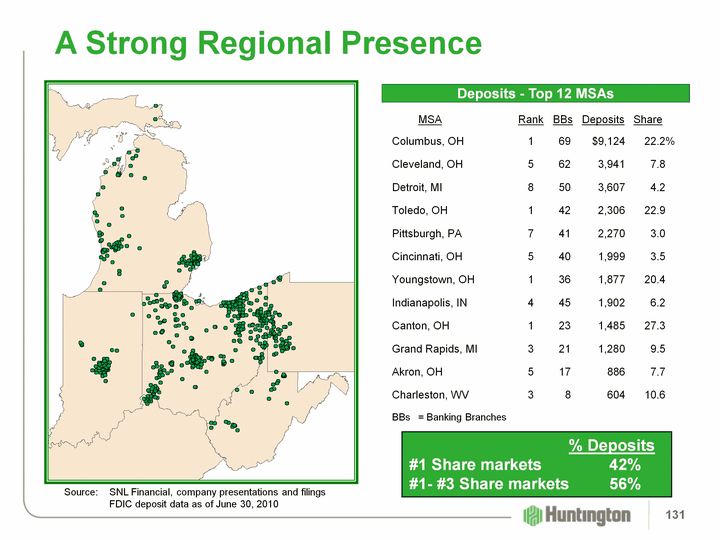
| A Strong Regional Presence Source: SNL Financial, company presentations and filings FDIC deposit data as of June 30, 2010 Deposits - Top 12 MSAs MSA Rank BBs Deposits Share Columbus, OH 1 69 $9,124 22.2% Cleveland, OH 5 62 3,941 7.8 Detroit, MI 8 50 3,607 4.2 Toledo, OH 1 42 2,306 22.9 Pittsburgh, PA 7 41 2,270 3.0 Cincinnati, OH 5 40 1,999 3.5 Youngstown, OH 1 36 1,877 20.4 Indianapolis, IN 4 45 1,902 6.2 Canton, OH 1 23 1,485 27.3 Grand Rapids, MI 3 21 1,280 9.5 Akron, OH 5 17 886 7.7 Charleston, WV 3 8 604 10.6 BBs = Banking Branches % Deposits #1 Share markets 42% #1- #3 Share markets 56% 131 |
| Leadership Team Leadership Team Business Segments Insurance, 132 |
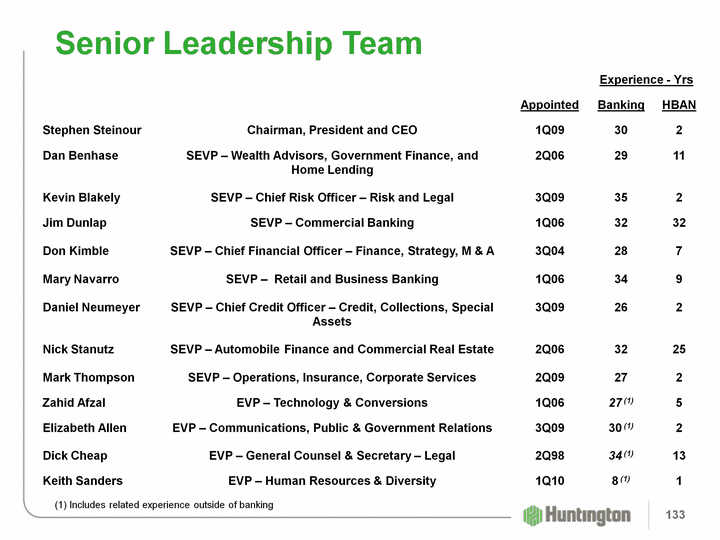
| Senior Leadership Team (1) Includes related experience outside of banking 133 |

| Business Segment Overview 134 |
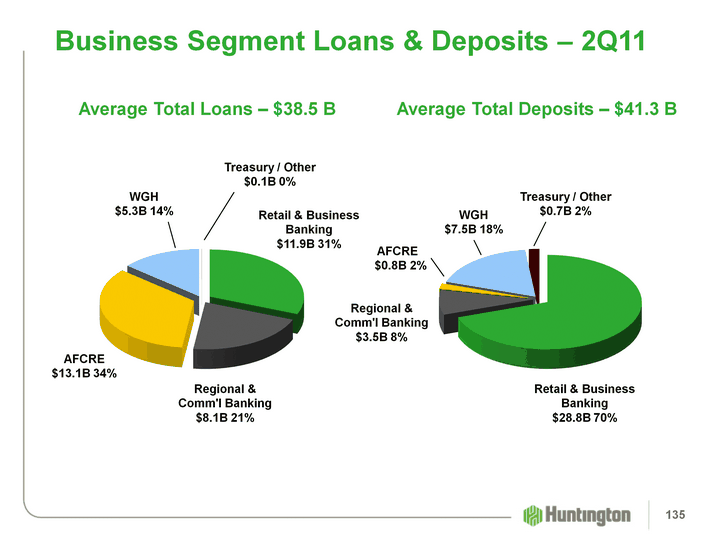
| Business Segment Loans & Deposits - 2Q11 Average Total Deposits - $41.3 B Average Total Loans - $38.5 B (CHART) (CHART) AFCRE $13.1B 34% Retail & Business Banking $11.9B 31% Treasury / Other $0.1B 0% Regional & Comm'l Banking $8.1B 21% WGH $5.3B 14% AFCRE $0.8B 2% Treasury / Other $0.7B 2% Retail & Business Banking $28.8B 70% Regional & Comm'l Banking $3.5B 8% WGH $7.5B 18% 135 |
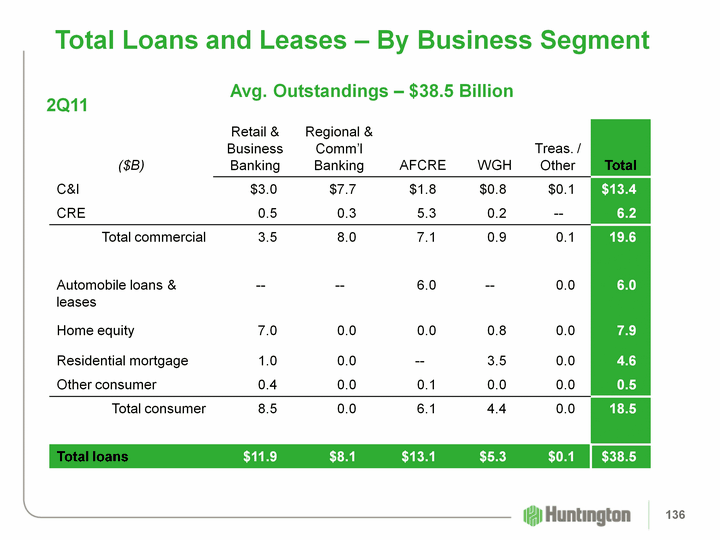
| Total Loans and Leases - By Business Segment Total Loans and Leases - By Business Segment Avg. Outstandings - $38.5 Billion 2Q11 136 |
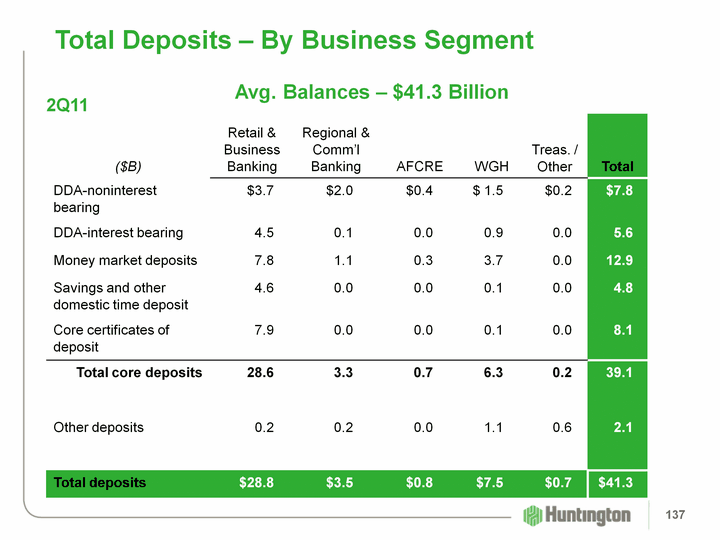
| Total Deposits - By Business Segment Total Deposits - By Business Segment Avg. Balances - $41.3 Billion 2Q11 137 |
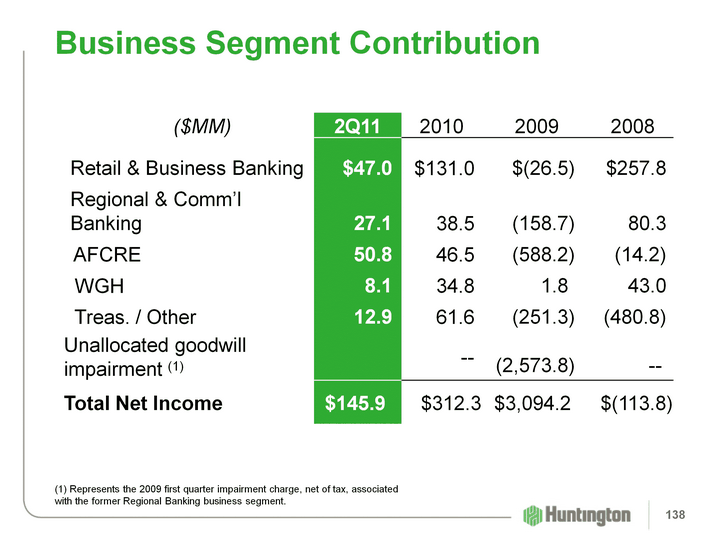
| Business Segment Contribution ($MM) 2Q11 2010 2009 2008 Retail & Business Banking $47.0 $131.0 $(26.5) $257.8 Regional & Comm'l Banking 27.1 38.5 (158.7) 80.3 AFCRE 50.8 46.5 (588.2) (14.2) WGH 8.1 34.8 1.8 43.0 Treas. / Other 12.9 61.6 (251.3) (480.8) Unallocated goodwill impairment (1) -- (2,573.8) -- Total Net Income $145.9 $312.3 $3,094.2 $(113.8) (1) Represents the 2009 first quarter impairment charge, net of tax, associated with the former Regional Banking business segment. 138 |
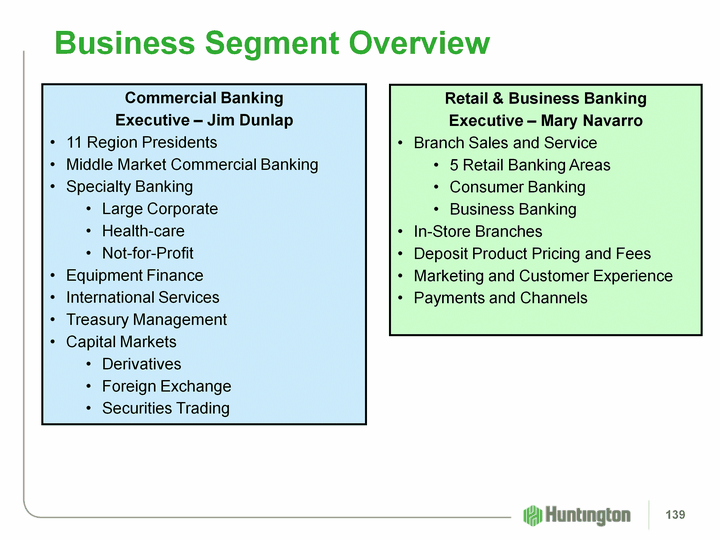
| Business Segment Overview Commercial Banking Executive - Jim Dunlap 11 Region Presidents Middle Market Commercial Banking Specialty Banking Large Corporate Health-care Not-for-Profit Equipment Finance International Services Treasury Management Capital Markets Derivatives Foreign Exchange Securities Trading Retail & Business Banking Executive - Mary Navarro Branch Sales and Service 5 Retail Banking Areas Consumer Banking Business Banking In-Store Branches Deposit Product Pricing and Fees Marketing and Customer Experience Payments and Channels 139 |
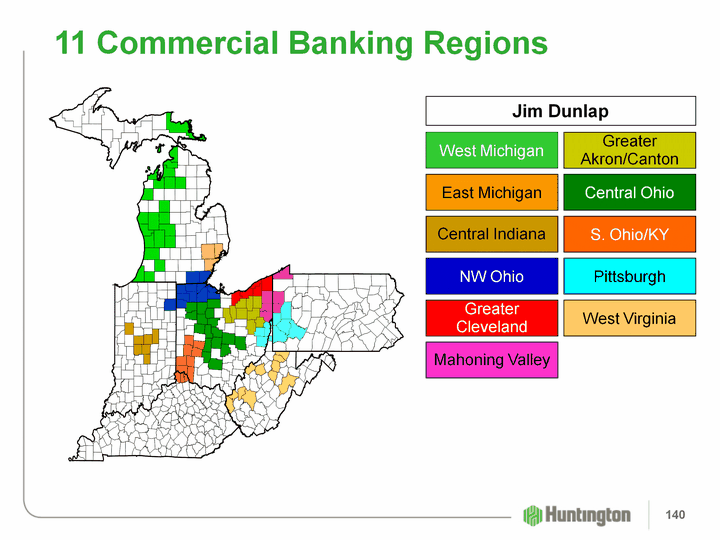
| 11 Commercial Banking Regions Greater Akron/Canton Mahoning Valley Central Ohio NW Ohio S. Ohio/KY Greater Cleveland Central Indiana West Michigan East Michigan West Virginia Pittsburgh Jim Dunlap 140 |
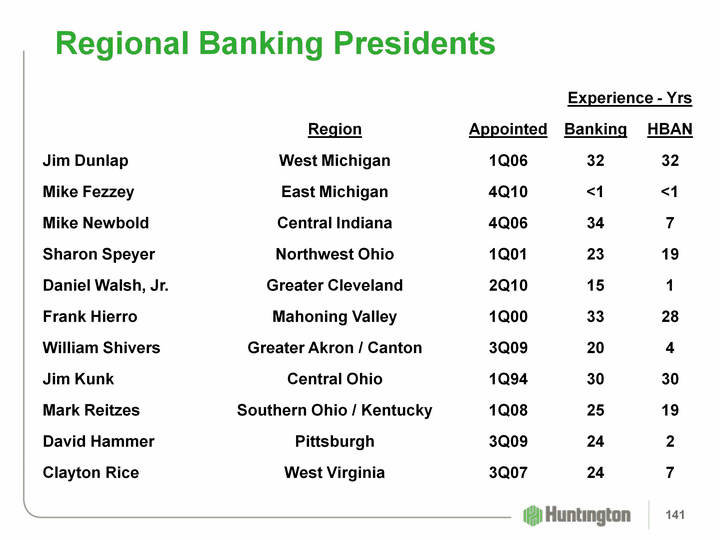
| Regional Banking Presidents 141 |
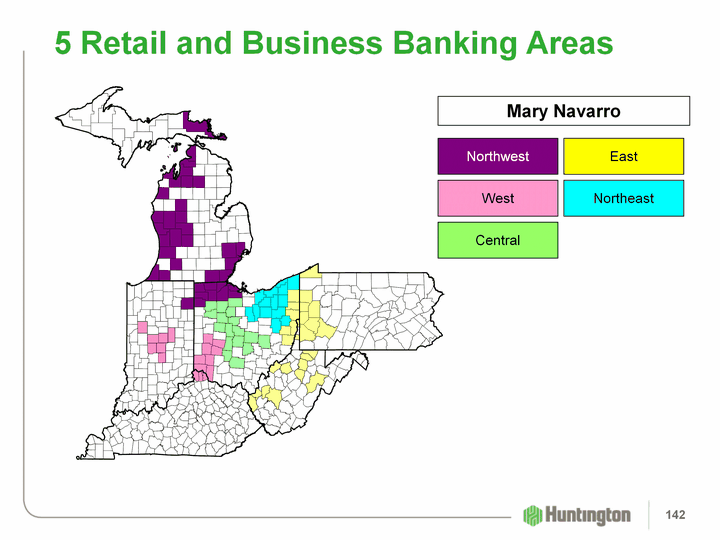
| 5 Retail and Business Banking Areas Central Northwest West Northeast East Mary Navarro 142 |
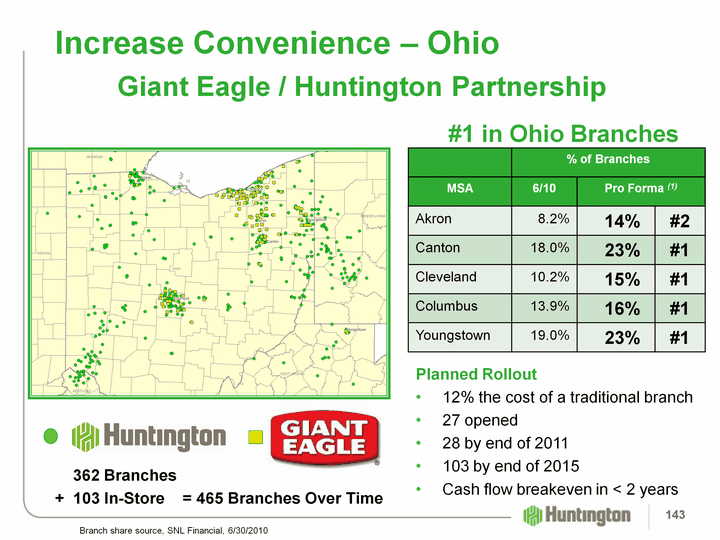
| #1 in Ohio Branches Planned Rollout 12% the cost of a traditional branch 27 opened 28 by end of 2011 103 by end of 2015 Cash flow breakeven in < 2 years Increase Convenience - Ohio Branch share source, SNL Financial, 6/30/2010 % of Branches % of Branches % of Branches MSA 6/10 Pro Forma (1) Pro Forma (1) Akron 8.2% 14% #2 Canton 18.0% 23% #1 Cleveland 10.2% 15% #1 Columbus 13.9% 16% #1 Youngstown 19.0% 23% #1 362 Branches + 103 In-Store = 465 Branches Over Time Giant Eagle / Huntington Partnership 143 143 |
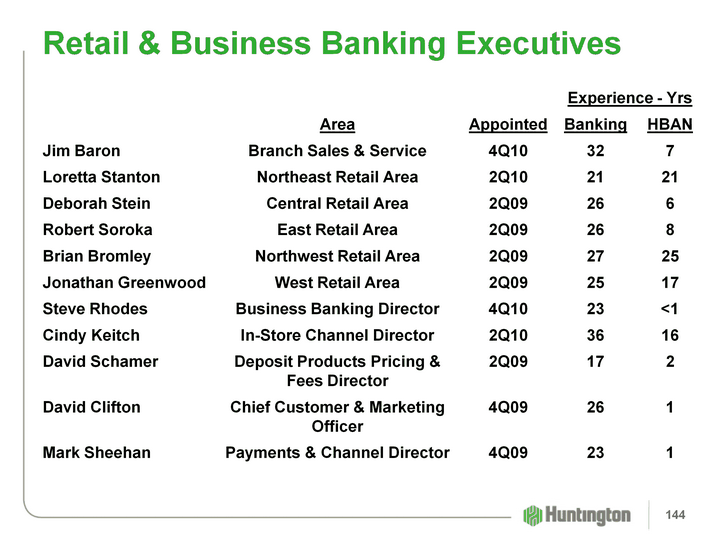
| Retail & Business Banking Executives 144 |
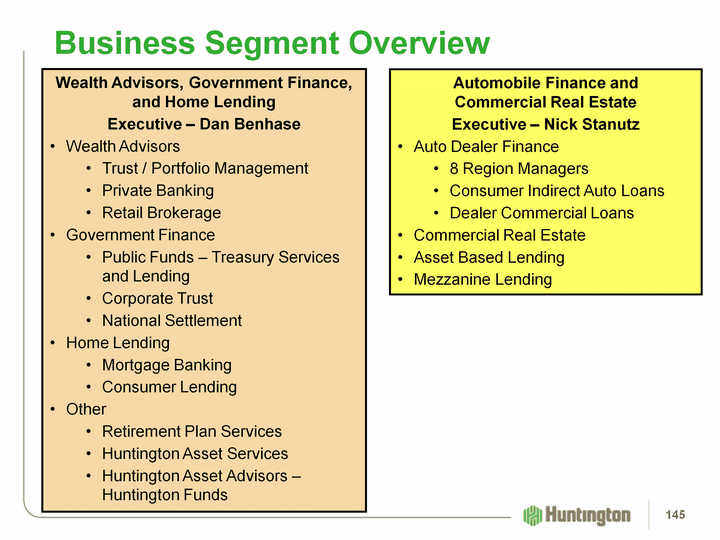
| Business Segment Overview Wealth Advisors, Government Finance, and Home Lending Executive - Dan Benhase Wealth Advisors Trust / Portfolio Management Private Banking Retail Brokerage Government Finance Public Funds - Treasury Services and Lending Corporate Trust National Settlement Home Lending Mortgage Banking Consumer Lending Other Retirement Plan Services Huntington Asset Services Huntington Asset Advisors - Huntington Funds Automobile Finance and Commercial Real Estate Executive - Nick Stanutz Auto Dealer Finance 8 Region Managers Consumer Indirect Auto Loans Dealer Commercial Loans Commercial Real Estate Asset Based Lending Mezzanine Lending 145 |

| Safe Harbor Disclosures 146 |
| Use of non-GAAP financial measures This document may contain GAAP financial measures and non-GAAP financial measures where management believes it to be helpful in understanding Huntington's results of operations or financial position. Where non-GAAP financial measures are used, the comparable GAAP financial measure, as well as the reconciliation to the comparable GAAP financial measure, can be found in this document, the 2011 second quarter Quarterly Performance Discussion and Quarterly Financial Review supplements, the 2011 second quarter earnings press release, or the Form 8 K related to this document, all of which can be found on Huntington's website at www.huntington-ir.com. Pre-Tax, Pre-Provision Income One non-GAAP performance metric that Management believes is useful in analyzing underlying performance trends is pre-tax, pre-provision income. This is the level of earnings adjusted to exclude the impact of: provision expense, which is excluded because its absolute level is elevated and volatile in times of economic stress; available-for-sale and other securities gains/losses, which are excluded because in times of economic stress securities market valuations may also become particularly volatile; amortization of intangibles expense, which is excluded because return on tangible common equity is a key metric used by Management to gauge performance trends; and certain items identified by Management to be outside of ordinary banking activities, and/or by items that, while they may be associated with ordinary banking activities, are so unusually large that their outsized impact is believed by Management at the time to be infrequent or short-term in nature, which Management believes may distort the company's underlying performance trends. Annualized data Certain returns, yields, performance ratios, or quarterly growth rates are presented on an "annualized" basis. This is done for analytical and decision-making purposes to better discern underlying performance trends when compared to full year or year-over-year amounts. For example, loan and deposit growth rates, as well as net charge-off percentages, are most often expressed in terms of an annual rate like 8%. As such, a 2% growth rate for a quarter would represent an annualized 8% growth rate. Basis of Presentation 147 |
| Significant Items From time to time, revenue, expenses, or taxes are impacted by items judged by Management to be outside of ordinary banking activities and/or by items that, while they may be associated with ordinary banking activities, are so unusually large that their outsized impact is believed by Management at that time to be infrequent or short-term in nature. We refer to such items as "Significant Items". Most often, these Significant Items result from factors originating outside the company - e.g., regulatory actions/assessments, windfall gains, changes in accounting principles, one-time tax assessments/refunds, litigation actions, etc. In other cases they may result from Management decisions associated with significant corporate actions out of the ordinary course of business - e.g., merger/restructuring charges, recapitalization actions, goodwill impairment, etc. Even though certain revenue and expense items are naturally subject to more volatility than others due to changes in market and economic environment conditions, as a general rule volatility alone does not define a Significant Item. For example, changes in the provision for credit losses, gains/losses from investment activities, asset valuation writedowns, etc., reflect ordinary banking activities and are, therefore, typically excluded from consideration as a Significant Item. Management believes the disclosure of "Significant Items" in current and prior period results aids analysts/investors in better understanding corporate performance and trends so that they can ascertain which of such items, if any, they may wish to include/exclude from their analysis of the company's performance; i.e., within the context of determining how that performance differed from their expectations, as well as how, if at all, to adjust their estimates of future performance accordingly. To this end, Management has adopted a practice of listing "Significant Items" in its external disclosure documents (e.g., earnings press releases, quarterly performance discussions, investor presentations, Forms 10-Q and 10 K). "Significant Items" for any particular period are not intended to be a complete list of items that may materially impact current or future period performance. A number of items could materially impact these periods, including those described in Huntington's 2010 Annual Report on Form 10-K and other factors described from time to time in Huntington's other filings with the Securities and Exchange Commission. Basis of Presentation 148 |
| Fully-taxable equivalent interest income and net interest margin Income from tax-exempt earning assets is increased by an amount equivalent to the taxes that would have been paid if this income had been taxable at statutory rates. This adjustment puts all earning assets, most notably tax-exempt municipal securities and certain lease assets, on a common basis that facilitates comparison of results to results of competitors. Rounding Please note that columns of data in the presentation may not add due to rounding. Earnings per share equivalent data Significant income or expense items may be expressed on a per common share basis. This is done for analytical and decision-making purposes to better discern underlying trends in total corporate earnings per share performance excluding the impact of such items. Investors may also find this information helpful in their evaluation of the company's financial performance against published earnings per share mean estimate amounts, which typically exclude the impact of Significant Items. Earnings per share equivalents are usually calculated by applying a 35% effective tax rate to a pre- tax amount to derive an after-tax amount, which is divided by the average shares outstanding during the respective reporting period. Occasionally, when the item involves special tax treatment, the after-tax amount is disclosed separately, with this then being the amount used to calculate the earnings per share equivalent. Basis of Presentation 149 |
| This document contains certain forward-looking statements, including certain plans, expectations, goals, projections, and statements, which are subject to numerous assumptions, risks, and uncertainties. Forward-looking statements may be identified by words such as expect, anticipate, believe, intend, estimate, plan, target, goal, or similar expressions, or future or conditional verbs such as will, may, might, should, would, could, or similar variations. While there is no assurance that any list of risks and uncertainties or risk factors is complete, below are certain factors which could cause actual results to differ materially from those contained or implied in the forward-looking statements: (1) worsening of credit quality performance due to a number of factors such as the underlying value of the collateral could prove less valuable than otherwise assumed and assumed cash flows may be worse than expected; (2) changes in economic conditions; (3) movements in interest rates; (4) competitive pressures on product pricing and services; (5) success, impact, and timing of our business strategies, including market acceptance of any new products or services introduced to implement our "Fair Play" banking philosophy; (6) changes in accounting policies and principles and the accuracy of our assumptions and estimates used to prepare our financial statements; (7) extended disruption of vital infrastructure; (8) the final outcome of significant litigation; (9) the nature, extent, and timing of governmental actions and reforms, including the Dodd-Frank Wall Street Reform and Consumer Protection Act, as well as future regulations which will be adopted by the relevant regulatory agencies, including the Consumer Financial Protection Bureau (CFPB), to implement the Act's provisions; and (10) the outcome of judicial and regulatory decisions regarding practices in the residential mortgage industry, including among other things the processes followed for foreclosing residential mortgages. Additional factors that could cause results to differ materially from those described above can be found in Huntington's 2010 Annual Report on Form 10-K, and documents subsequently filed by Huntington with the Securities and Exchange Commission. All forward-looking statements included in this document are based on information available at the time of the release. Huntington assumes no obligation to update any forward-looking statement. Forward Looking Statements 150 |