EXHIBIT 99.1
Published on August 13, 2009
Exhibit 99.1

| August 10, 2009 2009 Third Quarter Investor Handout 1 |
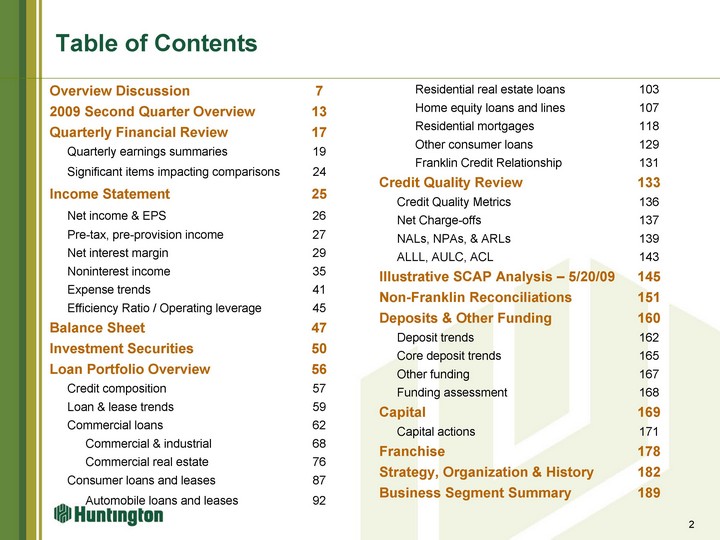
| Table of Contents Overview Discussion 7 2009 Second Quarter Overview 13 Quarterly Financial Review 17 Quarterly earnings summaries 19 Significant items impacting comparisons 24 Income Statement 25 Net income & EPS 26 Pre-tax, pre-provision income 27 Net interest margin 29 Noninterest income 35 Expense trends 41 Efficiency Ratio / Operating leverage 45 Balance Sheet 47 Investment Securities 50 Loan Portfolio Overview 56 Credit composition 57 Loan & lease trends 59 Commercial loans 62 Commercial & industrial 68 Commercial real estate 76 Consumer loans and leases 87 Automobile loans and leases 92 Residential real estate loans 103 Home equity loans and lines 107 Residential mortgages 118 Other consumer loans 129 Franklin Credit Relationship 131 Credit Quality Review 133 Credit Quality Metrics 136 Net Charge-offs 137 NALs, NPAs, & ARLs 139 ALLL, AULC, ACL 143 Illustrative SCAP Analysis - 5/20/09 145 Non-Franklin Reconciliations 151 Deposits & Other Funding 160 Deposit trends 162 Core deposit trends 165 Other funding 167 Funding assessment 168 Capital 169 Capital actions 171 Franchise 178 Strategy, Organization & History 182 Business Segment Summary 189 2 |
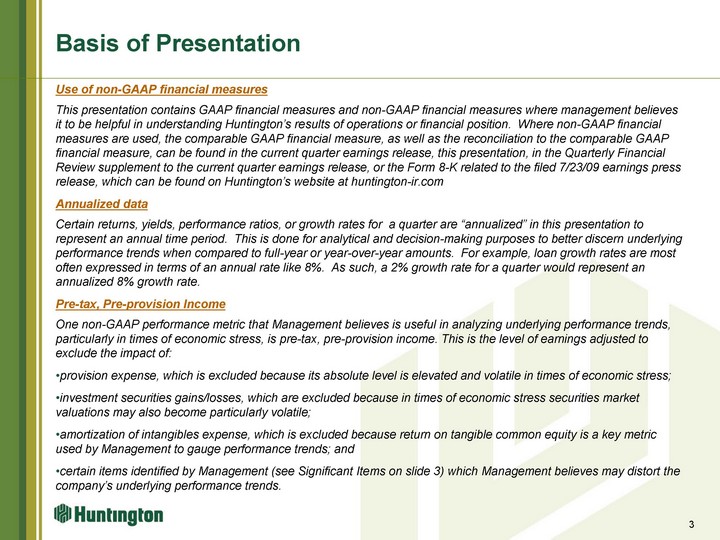
| Basis of Presentation Use of non-GAAP financial measures This presentation contains GAAP financial measures and non-GAAP financial measures where management believes it to be helpful in understanding Huntington's results of operations or financial position. Where non-GAAP financial measures are used, the comparable GAAP financial measure, as well as the reconciliation to the comparable GAAP financial measure, can be found in the current quarter earnings release, this presentation, in the Quarterly Financial Review supplement to the current quarter earnings release, or the Form 8-K related to the filed 7/23/09 earnings press release, which can be found on Huntington's website at huntington-ir.com Annualized data Certain returns, yields, performance ratios, or growth rates for a quarter are "annualized" in this presentation to represent an annual time period. This is done for analytical and decision-making purposes to better discern underlying performance trends when compared to full-year or year-over-year amounts. For example, loan growth rates are most often expressed in terms of an annual rate like 8%. As such, a 2% growth rate for a quarter would represent an annualized 8% growth rate. Pre-tax, Pre-provision Income One non-GAAP performance metric that Management believes is useful in analyzing underlying performance trends, particularly in times of economic stress, is pre-tax, pre-provision income. This is the level of earnings adjusted to exclude the impact of: provision expense, which is excluded because its absolute level is elevated and volatile in times of economic stress; investment securities gains/losses, which are excluded because in times of economic stress securities market valuations may also become particularly volatile; amortization of intangibles expense, which is excluded because return on tangible common equity is a key metric used by Management to gauge performance trends; and certain items identified by Management (see Significant Items on slide 3) which Management believes may distort the company's underlying performance trends. 3 |
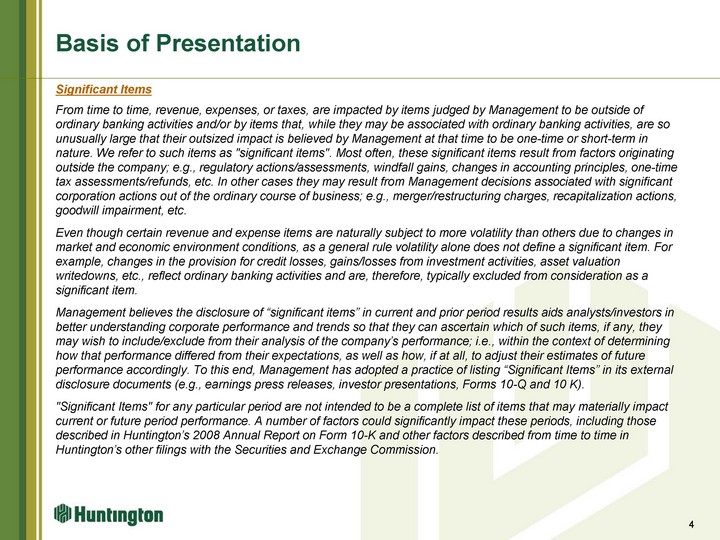
| Basis of Presentation Significant Items From time to time, revenue, expenses, or taxes, are impacted by items judged by Management to be outside of ordinary banking activities and/or by items that, while they may be associated with ordinary banking activities, are so unusually large that their outsized impact is believed by Management at that time to be one-time or short-term in nature. We refer to such items as "significant items". Most often, these significant items result from factors originating outside the company; e.g., regulatory actions/assessments, windfall gains, changes in accounting principles, one-time tax assessments/refunds, etc. In other cases they may result from Management decisions associated with significant corporation actions out of the ordinary course of business; e.g., merger/restructuring charges, recapitalization actions, goodwill impairment, etc. Even though certain revenue and expense items are naturally subject to more volatility than others due to changes in market and economic environment conditions, as a general rule volatility alone does not define a significant item. For example, changes in the provision for credit losses, gains/losses from investment activities, asset valuation writedowns, etc., reflect ordinary banking activities and are, therefore, typically excluded from consideration as a significant item. Management believes the disclosure of "significant items" in current and prior period results aids analysts/investors in better understanding corporate performance and trends so that they can ascertain which of such items, if any, they may wish to include/exclude from their analysis of the company's performance; i.e., within the context of determining how that performance differed from their expectations, as well as how, if at all, to adjust their estimates of future performance accordingly. To this end, Management has adopted a practice of listing "Significant Items" in its external disclosure documents (e.g., earnings press releases, investor presentations, Forms 10-Q and 10 K). "Significant Items" for any particular period are not intended to be a complete list of items that may materially impact current or future period performance. A number of factors could significantly impact these periods, including those described in Huntington's 2008 Annual Report on Form 10-K and other factors described from time to time in Huntington's other filings with the Securities and Exchange Commission. 4 |
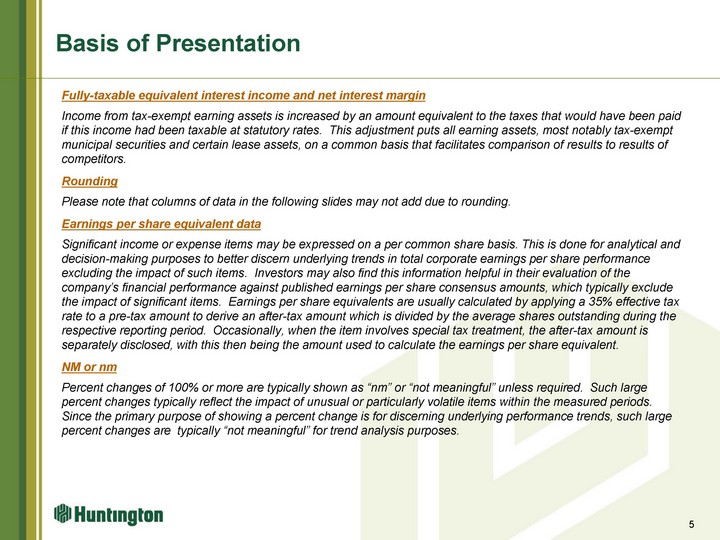
| Basis of Presentation Fully-taxable equivalent interest income and net interest margin Income from tax-exempt earning assets is increased by an amount equivalent to the taxes that would have been paid if this income had been taxable at statutory rates. This adjustment puts all earning assets, most notably tax-exempt municipal securities and certain lease assets, on a common basis that facilitates comparison of results to results of competitors. Rounding Please note that columns of data in the following slides may not add due to rounding. Earnings per share equivalent data Significant income or expense items may be expressed on a per common share basis. This is done for analytical and decision-making purposes to better discern underlying trends in total corporate earnings per share performance excluding the impact of such items. Investors may also find this information helpful in their evaluation of the company's financial performance against published earnings per share consensus amounts, which typically exclude the impact of significant items. Earnings per share equivalents are usually calculated by applying a 35% effective tax rate to a pre-tax amount to derive an after-tax amount which is divided by the average shares outstanding during the respective reporting period. Occasionally, when the item involves special tax treatment, the after-tax amount is separately disclosed, with this then being the amount used to calculate the earnings per share equivalent. NM or nm Percent changes of 100% or more are typically shown as "nm" or "not meaningful" unless required. Such large percent changes typically reflect the impact of unusual or particularly volatile items within the measured periods. Since the primary purpose of showing a percent change is for discerning underlying performance trends, such large percent changes are typically "not meaningful" for trend analysis purposes. 5 |
| Forward Looking Statements This presentation contains certain forward-looking statements, including certain plans, expectations, goals, projections, and statements, which are subject to numerous assumptions, risks, and uncertainties. Actual results could differ materially from those contained or implied by such statements for a variety of factors including: (1) deterioration in the loan portfolio could be worse than expected due to a number of factors such as the underlying value of the collateral could prove less valuable than otherwise assumed and assumed cash flows may be worse than expected; (2) changes in economic conditions; (3) movements in interest rates; (4) competitive pressures on product pricing and services; (5) success and timing of other business strategies; (6) the nature, extent, and timing of governmental actions and reforms, including existing and potential future restrictions and limitations imposed in connection with the Troubled Asset Relief Program's voluntary Capital Purchase Plan or otherwise under the Emergency Economic Stabilization Act of 2008; and (7) extended disruption of vital infrastructure. Additional factors that could cause results to differ materially from those described above can be found in Huntington's 2008 Annual Report on Form 10-K, and documents subsequently filed by Huntington with the Securities and Exchange Commission. All forward-looking statements included in this presentation are based on information available at the time of the release. Huntington assumes no obligation to update any forward-looking statement. 6 |

| Overview Discussion 7 |
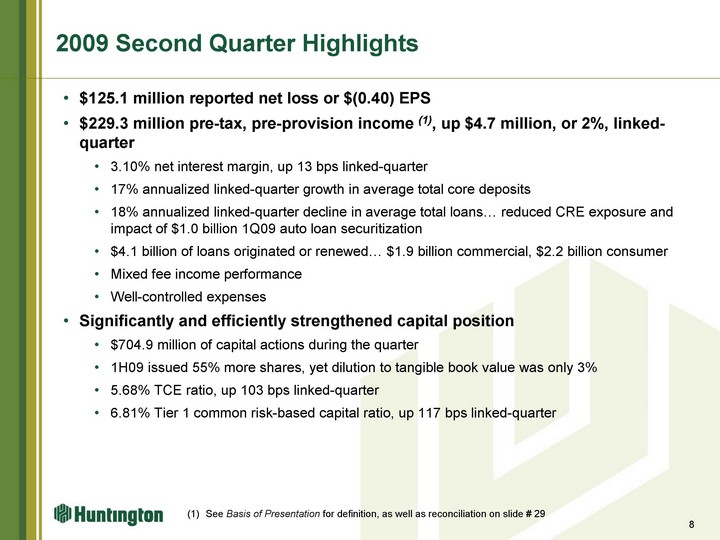
| 2009 Second Quarter Highlights $125.1 million reported net loss or $(0.40) EPS $229.3 million pre-tax, pre-provision income (1), up $4.7 million, or 2%, linked- quarter 3.10% net interest margin, up 13 bps linked-quarter 17% annualized linked-quarter growth in average total core deposits 18% annualized linked-quarter decline in average total loans... reduced CRE exposure and impact of $1.0 billion 1Q09 auto loan securitization $4.1 billion of loans originated or renewed... $1.9 billion commercial, $2.2 billion consumer Mixed fee income performance Well-controlled expenses Significantly and efficiently strengthened capital position $704.9 million of capital actions during the quarter 1H09 issued 55% more shares, yet dilution to tangible book value was only 3% 5.68% TCE ratio, up 103 bps linked-quarter 6.81% Tier 1 common risk-based capital ratio, up 117 bps linked-quarter 8 See Basis of Presentation for definition, as well as reconciliation on slide # 29 |
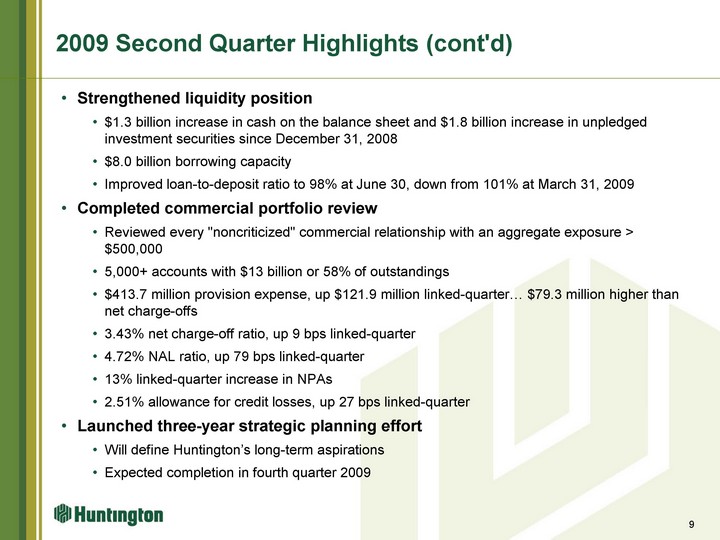
| 2009 Second Quarter Highlights (cont'd) Strengthened liquidity position $1.3 billion increase in cash on the balance sheet and $1.8 billion increase in unpledged investment securities since December 31, 2008 $8.0 billion borrowing capacity Improved loan-to-deposit ratio to 98% at June 30, down from 101% at March 31, 2009 Completed commercial portfolio review Reviewed every "noncriticized" commercial relationship with an aggregate exposure > $500,000 5,000+ accounts with $13 billion or 58% of outstandings $413.7 million provision expense, up $121.9 million linked-quarter... $79.3 million higher than net charge-offs 3.43% net charge-off ratio, up 9 bps linked-quarter 4.72% NAL ratio, up 79 bps linked-quarter 13% linked-quarter increase in NPAs 2.51% allowance for credit losses, up 27 bps linked-quarter Launched three-year strategic planning effort Will define Huntington's long-term aspirations Expected completion in fourth quarter 2009 9 |
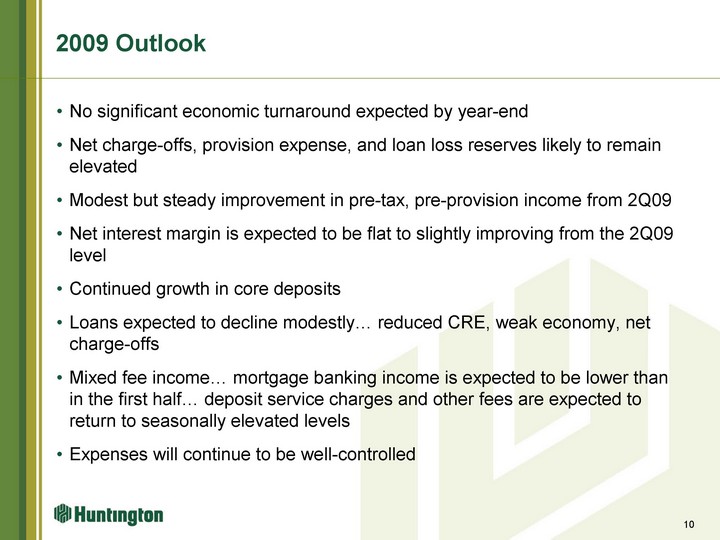
| 2009 Outlook No significant economic turnaround expected by year-end Net charge-offs, provision expense, and loan loss reserves likely to remain elevated Modest but steady improvement in pre-tax, pre-provision income from 2Q09 Net interest margin is expected to be flat to slightly improving from the 2Q09 level Continued growth in core deposits Loans expected to decline modestly... reduced CRE, weak economy, net charge-offs Mixed fee income... mortgage banking income is expected to be lower than in the first half... deposit service charges and other fees are expected to return to seasonally elevated levels Expenses will continue to be well-controlled 10 |
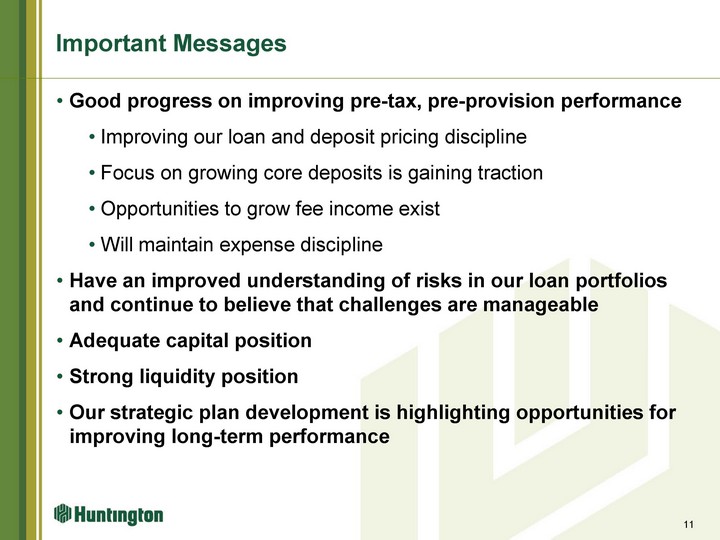
| Important Messages Good progress on improving pre-tax, pre-provision performance Improving our loan and deposit pricing discipline Focus on growing core deposits is gaining traction Opportunities to grow fee income exist Will maintain expense discipline Have an improved understanding of risks in our loan portfolios and continue to believe that challenges are manageable Adequate capital position Strong liquidity position Our strategic plan development is highlighting opportunities for improving long-term performance 11 |
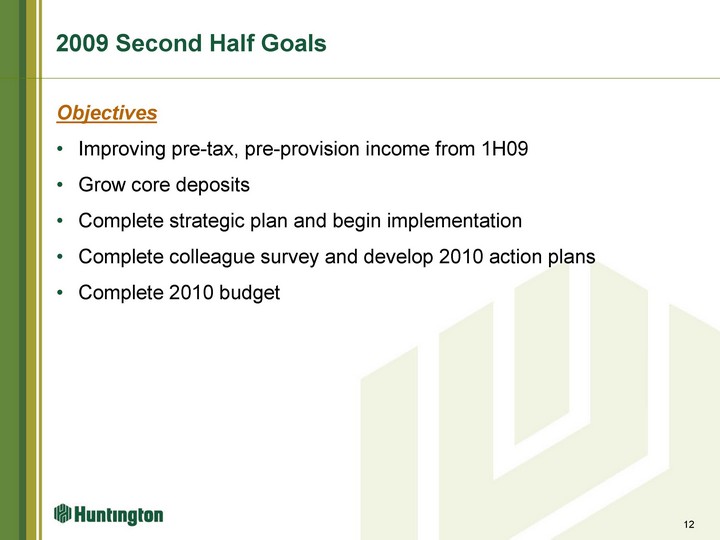
| 2009 Second Half Goals Objectives Improving pre-tax, pre-provision income from 1H09 Grow core deposits Complete strategic plan and begin implementation Complete colleague survey and develop 2010 action plans Complete 2010 budget 12 |

| 2009 Second Quarter Overview 13 |
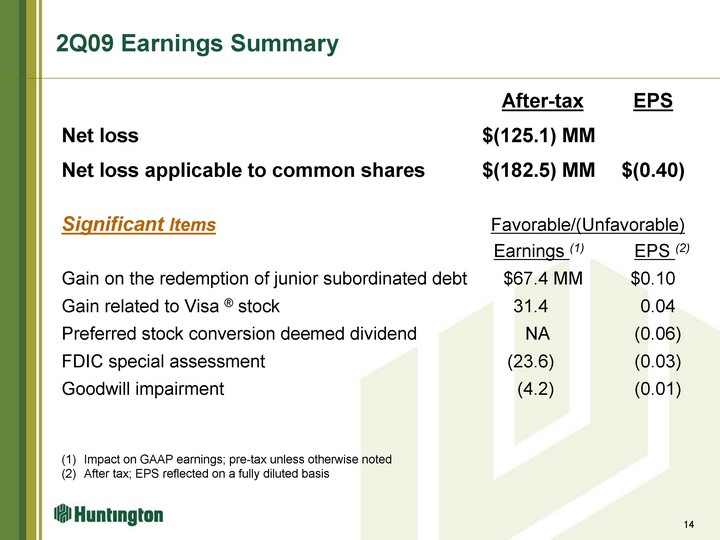
| 2Q09 Earnings Summary After-tax EPS Net loss $(125.1) MM Net loss applicable to common shares $(182.5) MM $(0.40) Significant Items Favorable/(Unfavorable) Earnings (1) EPS (2) Gain on the redemption of junior subordinated debt $67.4 MM $0.10 Gain related to Visa (r) stock 31.4 0.04 Preferred stock conversion deemed dividend NA (0.06) FDIC special assessment (23.6) (0.03) Goodwill impairment (4.2) (0.01) (1) Impact on GAAP earnings; pre-tax unless otherwise noted (2) After tax; EPS reflected on a fully diluted basis 14 |
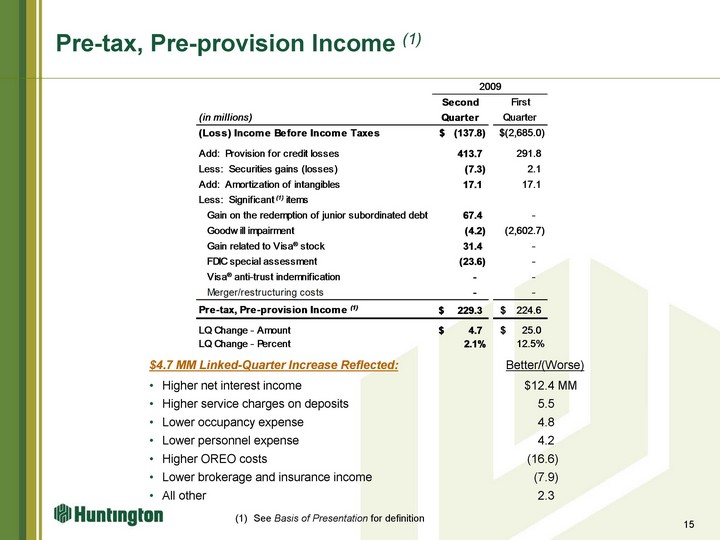
| Pre-tax, Pre-provision Income (1) $4.7 MM Linked-Quarter Increase Reflected: Better/(Worse) Higher net interest income $12.4 MM Higher service charges on deposits 5.5 Lower occupancy expense 4.8 Lower personnel expense 4.2 Higher OREO costs (16.6) Lower brokerage and insurance income (7.9) All other 2.3 15 See Basis of Presentation for definition |
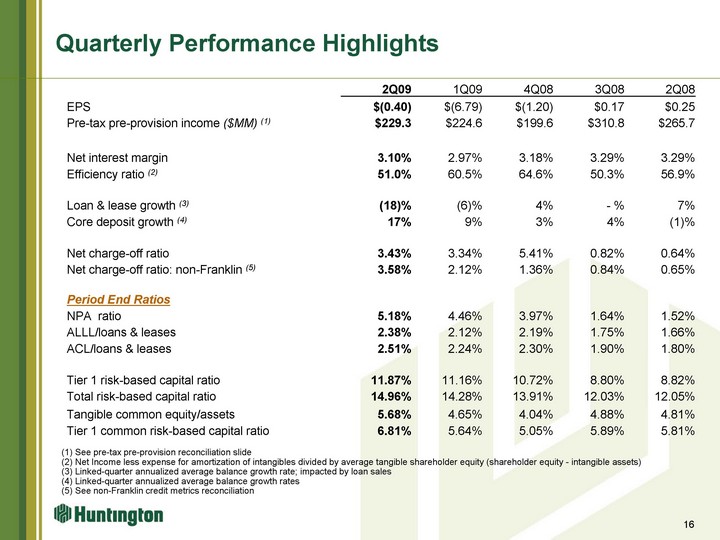
| Quarterly Performance Highlights 2Q09 1Q09 4Q08 3Q08 2Q08 EPS $(0.40) $(6.79) $(1.20) $0.17 $0.25 Pre-tax pre-provision income ($MM) (1) $229.3 $224.6 $199.6 $310.8 $265.7 Net interest margin 3.10% 2.97% 3.18% 3.29% 3.29% Efficiency ratio (2) 51.0% 60.5% 64.6% 50.3% 56.9% Loan & lease growth (3) (18)% (6)% 4% - % 7% Core deposit growth (4) 17% 9% 3% 4% (1)% Net charge-off ratio 3.43% 3.34% 5.41% 0.82% 0.64% Net charge-off ratio: non-Franklin (5) 3.58% 2.12% 1.36% 0.84% 0.65% Period End Ratios NPA ratio 5.18% 4.46% 3.97% 1.64% 1.52% ALLL/loans & leases 2.38% 2.12% 2.19% 1.75% 1.66% ACL/loans & leases 2.51% 2.24% 2.30% 1.90% 1.80% Tier 1 risk-based capital ratio 11.87% 11.16% 10.72% 8.80% 8.82% Total risk-based capital ratio 14.96% 14.28% 13.91% 12.03% 12.05% Tangible common equity/assets 5.68% 4.65% 4.04% 4.88% 4.81% Tier 1 common risk-based capital ratio 6.81% 5.64% 5.05% 5.89% 5.81% 16 (1) See pre-tax pre-provision reconciliation slide (2) Net Income less expense for amortization of intangibles divided by average tangible shareholder equity (shareholder equity - intangible assets) (3) Linked-quarter annualized average balance growth rate; impacted by loan sales (4) Linked-quarter annualized average balance growth rates (5) See non-Franklin credit metrics reconciliation |

| 2009 - 2008 Quarterly Financial Review 17 |
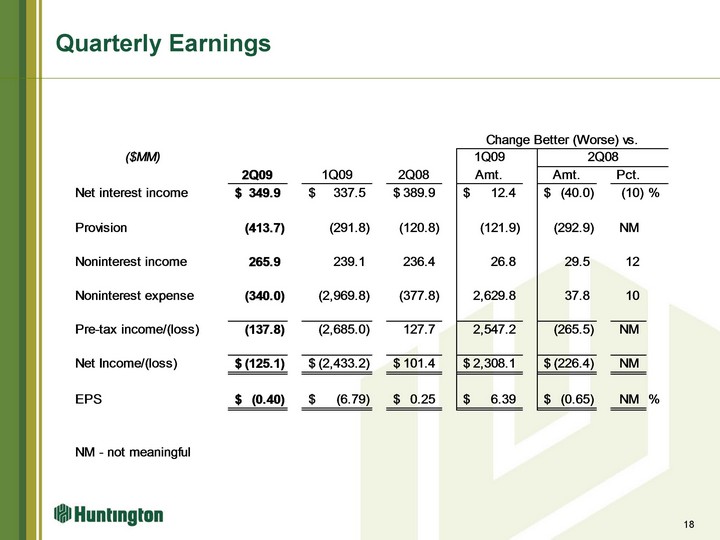
| Quarterly Earnings 18 |
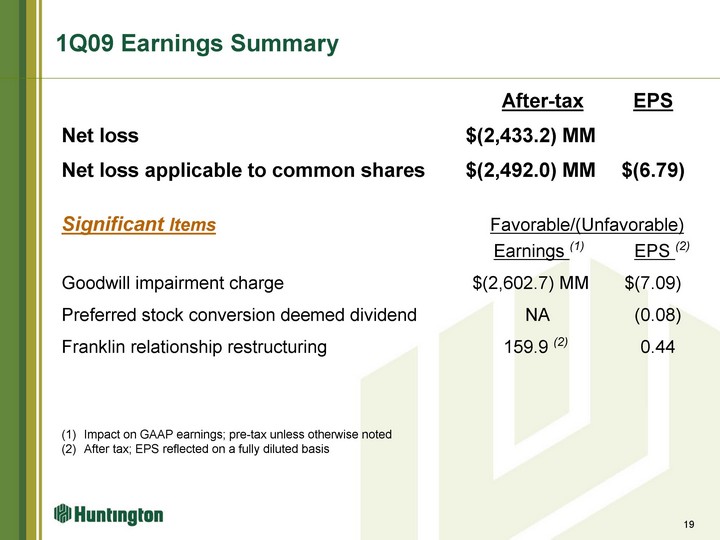
| 1Q09 Earnings Summary After-tax EPS Net loss $(2,433.2) MM Net loss applicable to common shares $(2,492.0) MM $(6.79) Significant Items Favorable/(Unfavorable) Earnings (1) EPS (2) Goodwill impairment charge $(2,602.7) MM $(7.09) Preferred stock conversion deemed dividend NA (0.08) Franklin relationship restructuring 159.9 (2) 0.44 (1) Impact on GAAP earnings; pre-tax unless otherwise noted (2) After tax; EPS reflected on a fully diluted basis 19 |
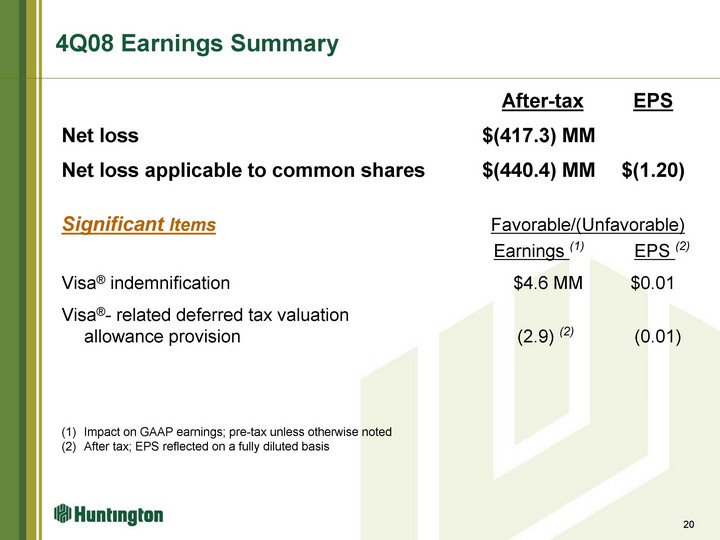
| 4Q08 Earnings Summary After-tax EPS Net loss $(417.3) MM Net loss applicable to common shares $(440.4) MM $(1.20) Significant Items Favorable/(Unfavorable) Earnings (1) EPS (2) Visa(r) indemnification $4.6 MM $0.01 Visa(r)- related deferred tax valuation allowance provision (2.9) (2) (0.01) (1) Impact on GAAP earnings; pre-tax unless otherwise noted After tax; EPS reflected on a fully diluted basis 20 |
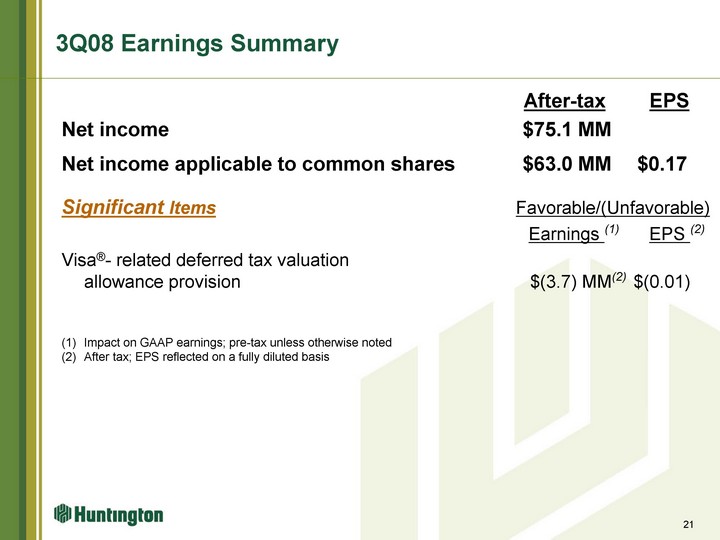
| 3Q08 Earnings Summary After-tax EPS Net income $75.1 MM Net income applicable to common shares $63.0 MM $0.17 Significant Items Favorable/(Unfavorable) Earnings (1) EPS (2) Visa(r)- related deferred tax valuation allowance provision $(3.7) MM(2) $(0.01) (1) Impact on GAAP earnings; pre-tax unless otherwise noted (2) After tax; EPS reflected on a fully diluted basis 21 |
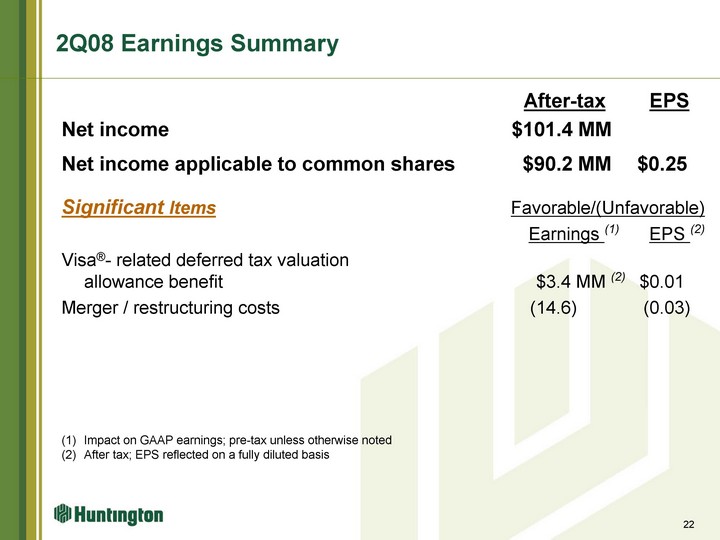
| 2Q08 Earnings Summary After-tax EPS Net income $101.4 MM Net income applicable to common shares $90.2 MM $0.25 Significant Items Favorable/(Unfavorable) Earnings (1) EPS (2) Visa(r)- related deferred tax valuation allowance benefit $3.4 MM (2) $0.01 Merger / restructuring costs (14.6) (0.03) (1) Impact on GAAP earnings; pre-tax unless otherwise noted (2) After tax; EPS reflected on a fully diluted basis 22 |
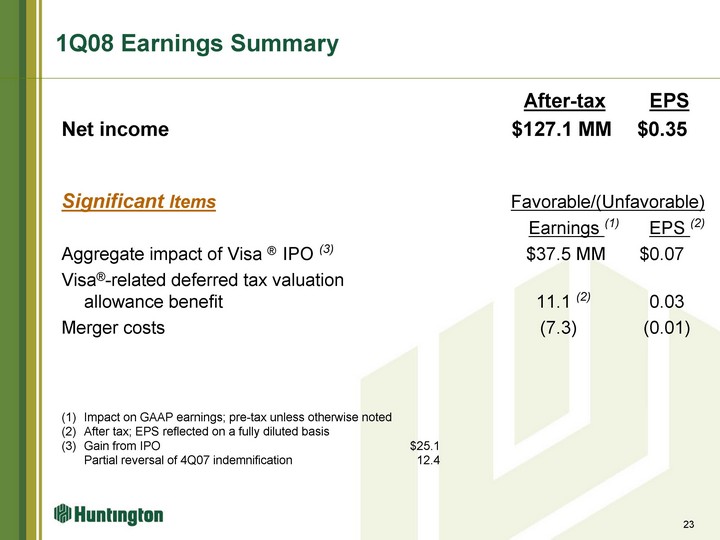
| 1Q08 Earnings Summary After-tax EPS Net income $127.1 MM $0.35 Significant Items Favorable/(Unfavorable) Earnings (1) EPS (2) Aggregate impact of Visa (r) IPO (3) $37.5 MM $0.07 Visa(r)-related deferred tax valuation allowance benefit 11.1 (2) 0.03 Merger costs (7.3) (0.01) (1) Impact on GAAP earnings; pre-tax unless otherwise noted (2) After tax; EPS reflected on a fully diluted basis (3) Gain from IPO $25.1 Partial reversal of 4Q07 indemnification 12.4 23 |
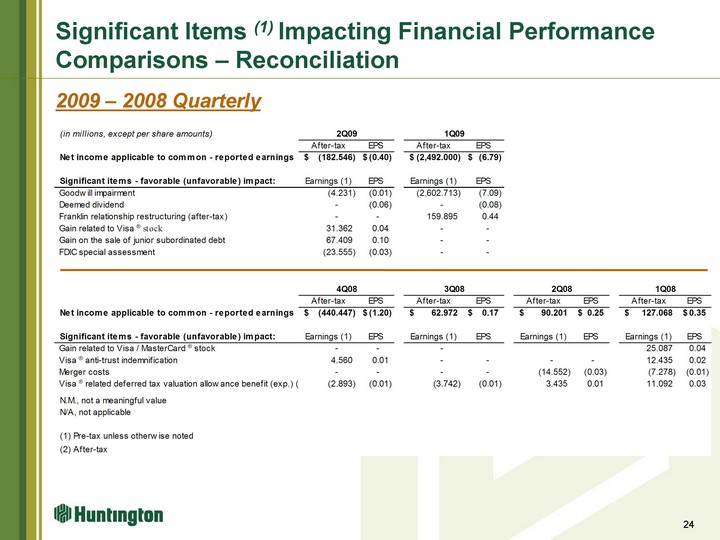
| 2009 - 2008 Quarterly 24 Significant Items (1) Impacting Financial Performance Comparisons - Reconciliation |

| Income Statement 25 |
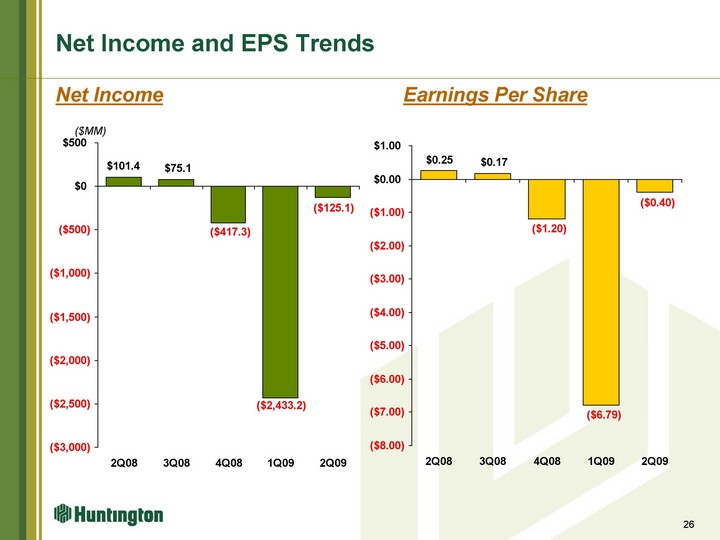
| Amount 3Q02 0.36 4Q02 0.29 1Q03 0.39 2Q03 0.42 3Q03 0.39 0.06 4Q03 0.4 1Q04 0.45 2Q04 0.47 3Q04 0.4 4Q04 0.39 1Q05 0.41 2Q05 0.45 3Q05 0.47 4Q05 0.44 1Q06 0.45 2Q06 0.46 3Q06 0.46 0.19 4Q06 0.375 1Q07 0.4 2Q07 0.34 3Q07 0.38 4Q07 -0.65 1Q08 0.35 2Q08 0.25 3Q08 0.17 4Q08 -1.2 1Q09 -6.79 2Q09 -0.4 Amount 3Q02 88.015 4Q02 69.263 1Q03 91.73 2Q03 96.49 3Q03 90.912 13.3 4Q03 93.261 1Q04 104.173 2Q04 110.127 3Q04 93.506 4Q04 91.139 1Q05 96.519 2Q05 106.425 3Q05 108.574 4Q05 100.6 1Q06 104.456 2Q06 111.604 3Q06 110.3 47.1 4Q06 87.7 1Q07 95.7 2Q07 80.5 3Q07 138.2 4Q07 -239.3 1Q08 127.1 2Q08 101.4 3Q08 75.1 4Q08 -417.3 1Q09 -2433.207 2Q09 -125.094 Net Income and EPS Trends Net Income Earnings Per Share ($MM) 26 |
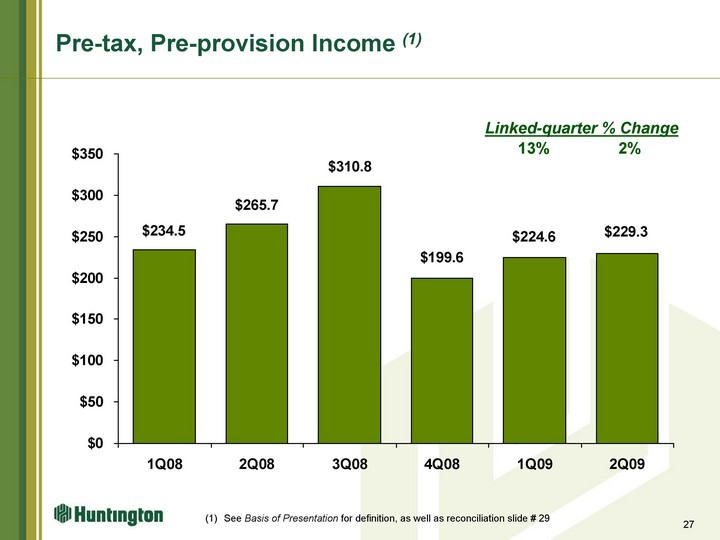
| Pre-tax, Pre-provision Income (1) 27 1Q08 234.5 2Q08 265.7 3Q08 310.8 4Q08 199.6 1Q09 224.6 2Q09 229.3 (1) See Basis of Presentation for definition, as well as reconciliation slide # 29 Linked-quarter % Change 2% 13% |
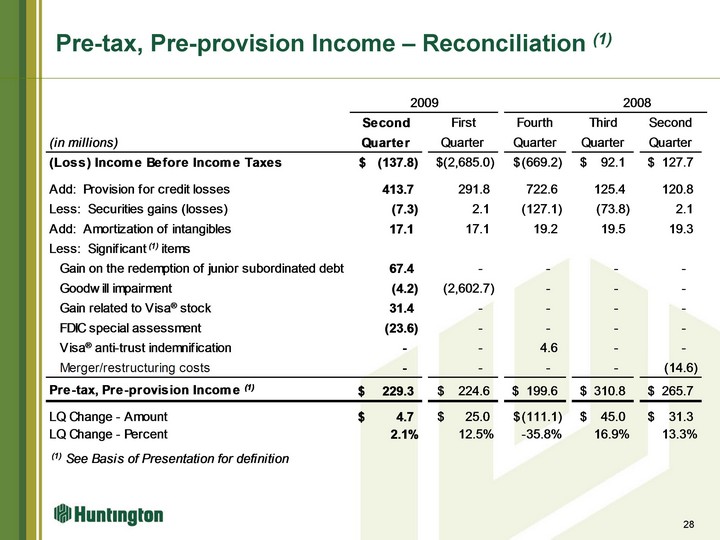
| Pre-tax, Pre-provision Income - Reconciliation (1) 28 |
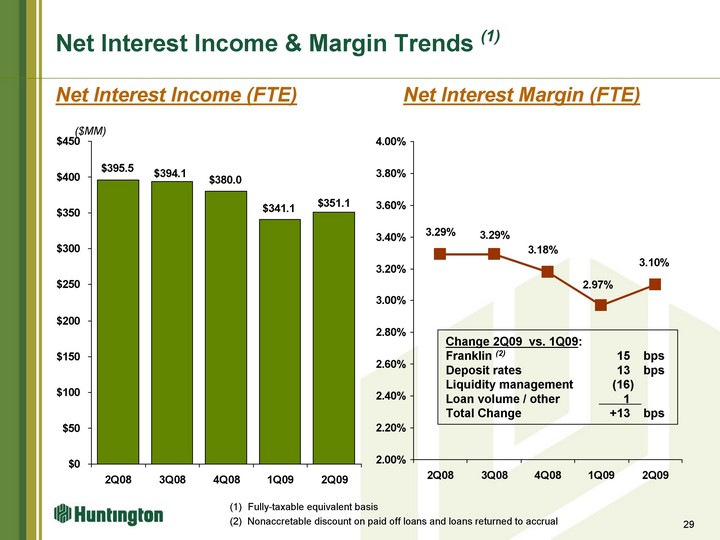
| Amount 1Q04 0.0336 2Q04 0.0329 3Q04 0.033 4Q04 0.0338 0.0332 1Q05 0.0331 2Q05 0.0336 3Q05 0.0331 4Q05 0.0334 1Q06 0.0332 2Q06 0.0334 3Q06 0.0322 4Q06 0.0328 1Q07 0.0336 2Q07 0.0326 3Q07 0.0352 4Q07 0.0326 1Q08 0.0323 2Q08 0.0329 3Q08 0.0329 4Q08 0.0318 1Q09 0.0297 2Q09 0.031 Amount 1Q04 225.708 2Q04 225.482 3Q04 229.922 4Q04 238.215 3.7 1Q05 238.059 2Q05 244.861 3Q05 245.371 4Q05 247.513 1Q06 247.516 2Q06 266.179 3Q06 259.403 4Q06 262.104 1Q07 259.602 2Q07 257.518 3Q07 263.753 151.592 4Q07 388.296 1Q08 382.324 2Q08 395.49 3Q08 394.087 4Q08 380.006 1Q09 341.087 2Q09 351.115 Change 2Q09 vs. 1Q09: Franklin (2) 15 bps Deposit rates 13 bps Liquidity management (16) Loan volume / other 1 Total Change +13 bps Net Interest Income & Margin Trends (1) Net Interest Income (FTE) Net Interest Margin (FTE) ($MM) 29 (1) Fully-taxable equivalent basis (2) Nonaccretable discount on paid off loans and loans returned to accrual |
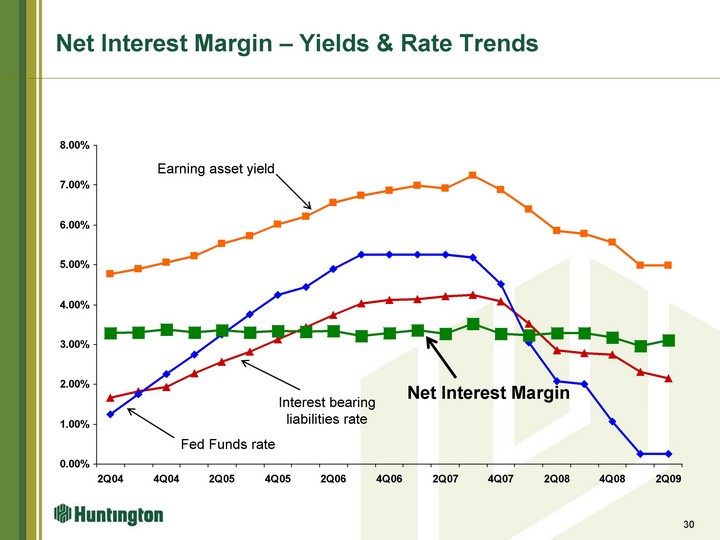
| Net Interest Margin - Yields & Rate Trends 30 1Q03 2Q03 3Q03 4Q03 1Q04 2Q04 3Q04 4Q04 1Q05 2Q05 3Q05 4Q05 1Q06 2Q06 3Q06 4Q06 1Q07 2Q07 3Q07 4Q07 1Q08 2Q08 3Q08 4Q08 1Q09 2Q09 E/A Yield 0.0572 0.0542 0.0523 0.0511 0.0489 0.0476 0.0489 0.0505 0.0521 0.0552 0.0572 0.0601 0.0621 0.0655 0.0673 0.0686 0.0698 0.0692 0.0725 0.0688 0.064 0.0585 0.0577 0.0557 0.0499 0.0499 Int Brg Liab Rate 0.0226 0.0211 0.0193 0.0185 0.0171 0.0166 0.0182 0.0194 0.0227 0.0256 0.0282 0.0312 0.0343 0.0374 0.0402 0.0412 0.0414 0.042 0.0424 0.0409 0.0353 0.0285 0.0279 0.0274 0.0231 0.0214 Fed Funds 0.0125 0.01 0.01 0.01 0.01 0.0125 0.0175 0.0225 0.0275 0.0325 0.0375 0.0425 0.0445 0.049 0.0525 0.0525 0.0525 0.0525 0.0518 0.0452 0.0306 0.0208 0.02 0.0106 0.0025 0.0025 Net Int Margin 0.0363 0.0347 0.0346 0.0342 0.0336 0.0329 0.033 0.0338 0.0331 0.0336 0.0331 0.0334 0.0332 0.0334 0.0322 0.0328 0.0336 0.0326 0.0352 0.0326 0.0323 0.0329 0.0329 0.0318 0.0297 0.031 Earning asset yield Interest bearing liabilities rate Fed Funds rate Net Interest Margin |
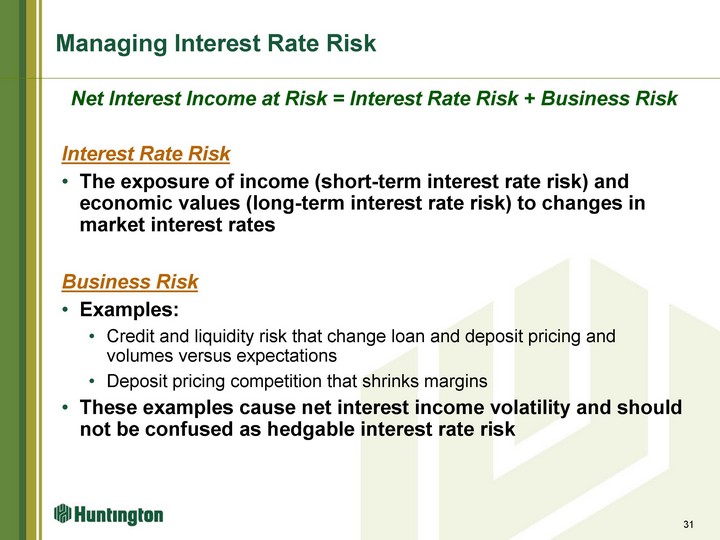
| Managing Interest Rate Risk Net Interest Income at Risk = Interest Rate Risk + Business Risk Interest Rate Risk The exposure of income (short-term interest rate risk) and economic values (long-term interest rate risk) to changes in market interest rates Business Risk Examples: Credit and liquidity risk that change loan and deposit pricing and volumes versus expectations Deposit pricing competition that shrinks margins These examples cause net interest income volatility and should not be confused as hedgable interest rate risk 31 |
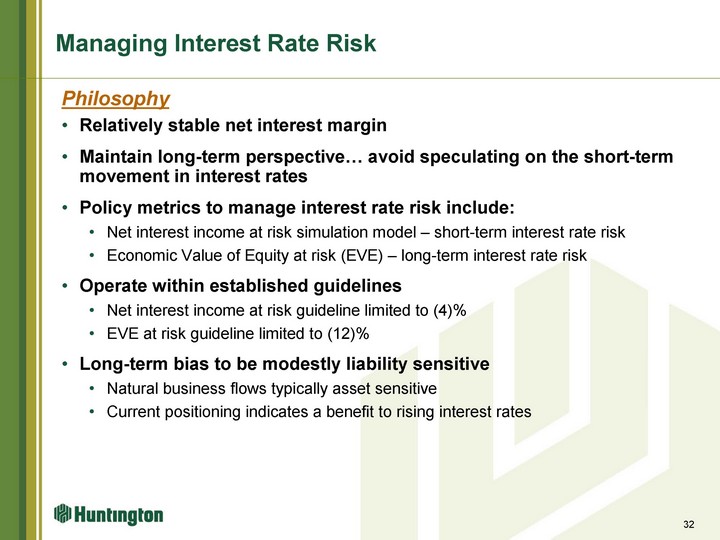
| Managing Interest Rate Risk Philosophy Relatively stable net interest margin Maintain long-term perspective... avoid speculating on the short-term movement in interest rates Policy metrics to manage interest rate risk include: Net interest income at risk simulation model - short-term interest rate risk Economic Value of Equity at risk (EVE) - long-term interest rate risk Operate within established guidelines Net interest income at risk guideline limited to (4)% EVE at risk guideline limited to (12)% Long-term bias to be modestly liability sensitive Natural business flows typically asset sensitive Current positioning indicates a benefit to rising interest rates 32 |
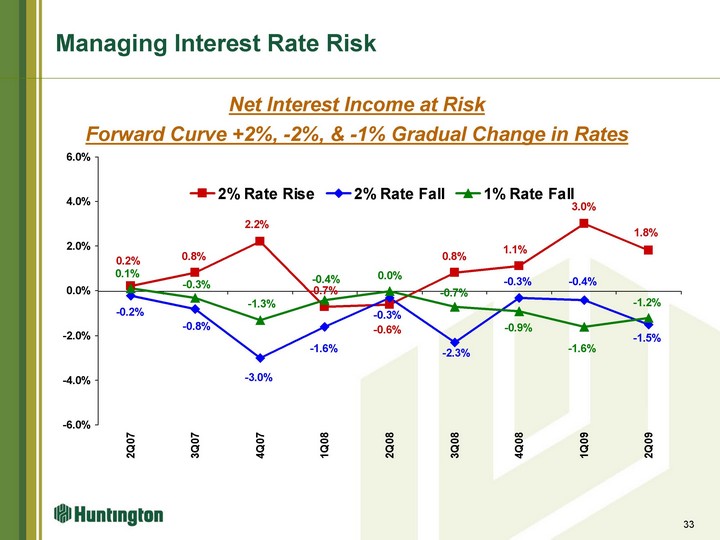
| Net Interest Income at Risk Forward Curve +2%, -2%, & -1% Gradual Change in Rates Managing Interest Rate Risk 2% Rate Rise 2% Rate Fall 1% Rate Fall 2Q01 -0.021 3Q01 -0.017 4Q01 -0.012 1Q02 -0.016 2Q02 -0.013 3Q02 -0.005 4Q02 -0.007 -0.002 1Q03 -0.006 -0.001 2Q03 -0.008 -0.001 3Q03 -0.01 -0.003 4Q03 -0.005 -0.003 1Q04 -0.003 -0.005 2Q04 -0.001 -0.003 3Q04 0.005 -0.005 4Q04 0.002 -0.005 1Q05 0.01 -0.018 -0.008 2Q05 0.007 -0.024 -0.008 3Q05 0.007 -0.017 -0.006 4Q05 0.003 -0.013 -0.005 1Q06 0.003 -0.015 -0.005 2Q06 -0.008 0.021 0.02 3Q06 -0.009 0.003 0.001 4Q06 -0.004 0 0 1Q07 0.004 -0.001 0.002 2Q07 0.002 -0.002 0.001 3Q07 0.008 -0.008 -0.003 4Q07 0.022 -0.03 -0.013 1Q08 -0.007 -0.016 -0.004 2Q08 -0.006 -0.003 0 3Q08 0.008 -0.023 -0.007 4Q08 0.011 -0.003 -0.009 1Q09 0.03 -0.004 -0.016 2Q09 0.018 -0.015 -0.012 33 |
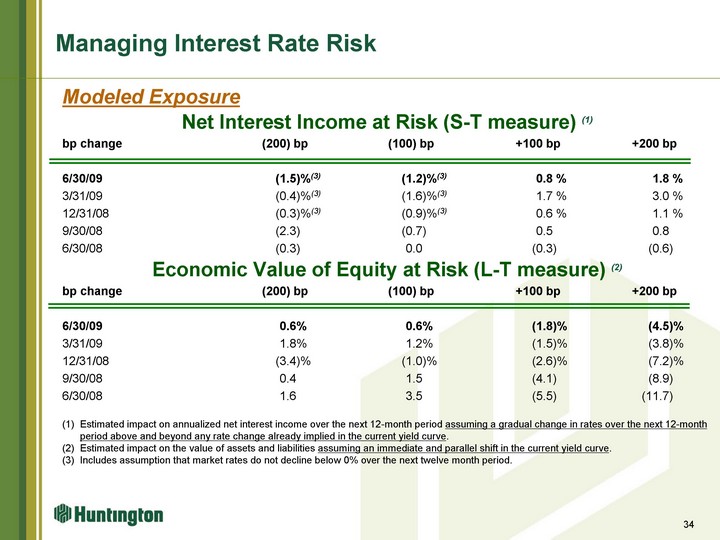
| Managing Interest Rate Risk Modeled Exposure Net Interest Income at Risk (S-T measure) (1) bp change (200) bp (100) bp +100 bp +200 bp 6/30/09 (1.5)%(3) (1.2)%(3) 0.8 % 1.8 % 3/31/09 (0.4)%(3) (1.6)%(3) 1.7 % 3.0 % 12/31/08 (0.3)%(3) (0.9)%(3) 0.6 % 1.1 % 9/30/08 (2.3) (0.7) 0.5 0.8 6/30/08 (0.3) 0.0 (0.3) (0.6) Economic Value of Equity at Risk (L-T measure) (2) bp change (200) bp (100) bp +100 bp +200 bp 6/30/09 0.6% 0.6% (1.8)% (4.5)% 3/31/09 1.8% 1.2% (1.5)% (3.8)% 12/31/08 (3.4)% (1.0)% (2.6)% (7.2)% 9/30/08 0.4 1.5 (4.1) (8.9) 6/30/08 1.6 3.5 (5.5) (11.7) (1) Estimated impact on annualized net interest income over the next 12-month period assuming a gradual change in rates over the next 12-month period above and beyond any rate change already implied in the current yield curve. (2) Estimated impact on the value of assets and liabilities assuming an immediate and parallel shift in the current yield curve. (3) Includes assumption that market rates do not decline below 0% over the next twelve month period. 34 |
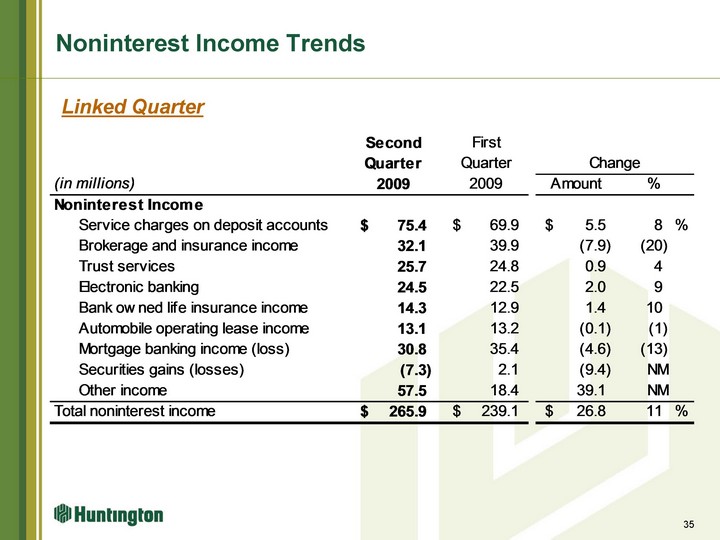
| Noninterest Income Trends 35 Linked Quarter |
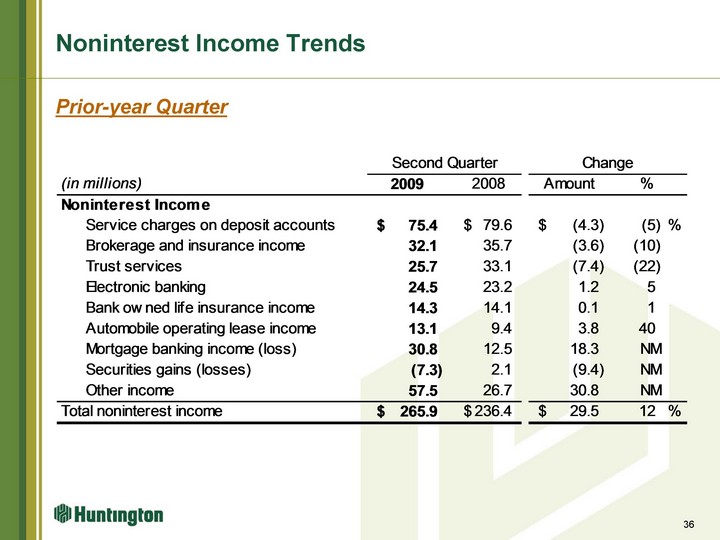
| Noninterest Income Trends 36 Prior-year Quarter |
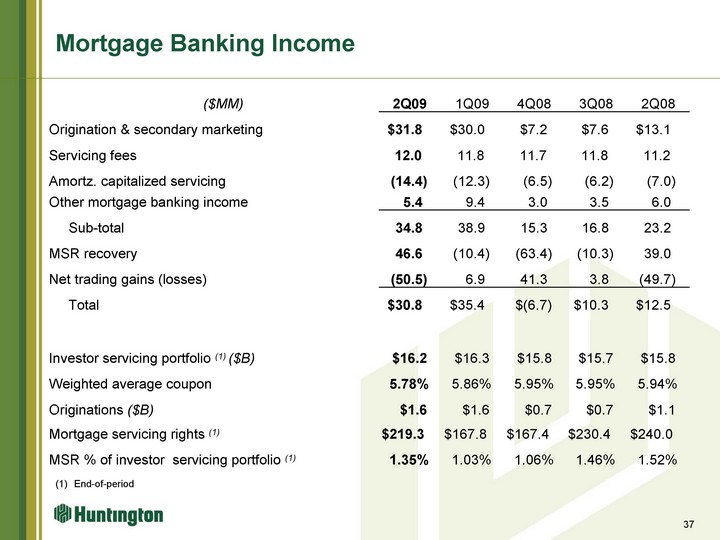
| Mortgage Banking Income ($MM) 2Q09 1Q09 4Q08 3Q08 2Q08 Origination & secondary marketing $31.8 $30.0 $7.2 $7.6 $13.1 Servicing fees 12.0 11.8 11.7 11.8 11.2 Amortz. capitalized servicing (14.4) (12.3) (6.5) (6.2) (7.0) Other mortgage banking income 5.4 9.4 3.0 3.5 6.0 Sub-total 34.8 38.9 15.3 16.8 23.2 MSR recovery 46.6 (10.4) (63.4) (10.3) 39.0 Net trading gains (losses) (50.5) 6.9 41.3 3.8 (49.7) Total $30.8 $35.4 $(6.7) $10.3 $12.5 Investor servicing portfolio (1) ($B) $16.2 $16.3 $15.8 $15.7 $15.8 Weighted average coupon 5.78% 5.86% 5.95% 5.95% 5.94% Originations ($B) $1.6 $1.6 $0.7 $0.7 $1.1 Mortgage servicing rights (1) $219.3 $167.8 $167.4 $230.4 $240.0 MSR % of investor servicing portfolio (1) 1.35% 1.03% 1.06% 1.46% 1.52% (1) End-of-period 37 |
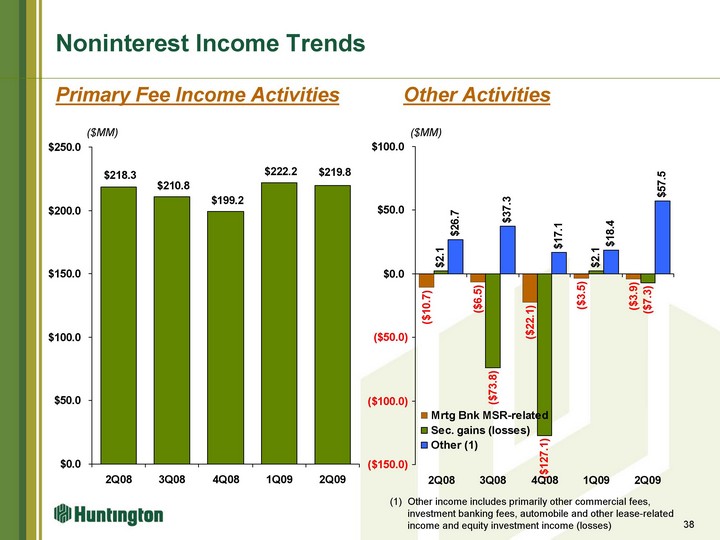
| Noninterest Income Trends 4Q07 200.032 1Q08 201.322 2Q08 218.342 3Q08 210.795 4Q08 199.213 1Q09 222.182 2Q09 219.751 Mrtg Bnk MSR-related Sec. gains (losses) Other (1) 4Q07 -11.766 -11.551 -6.158 1Q08 -24.706 1.429 57.707 2Q08 -10.697 2.073 26.712 3Q08 -6.468 -73.79 37.32 4Q08 -22.084 -127.082 17.052 1Q09 -3.506 2.067 18.359 2Q09 -3.936 -7.34 57.47 Primary Fee Income Activities Other Activities ($MM) ($MM) 38 (1) Other income includes primarily other commercial fees, investment banking fees, automobile and other lease-related income and equity investment income (losses) |
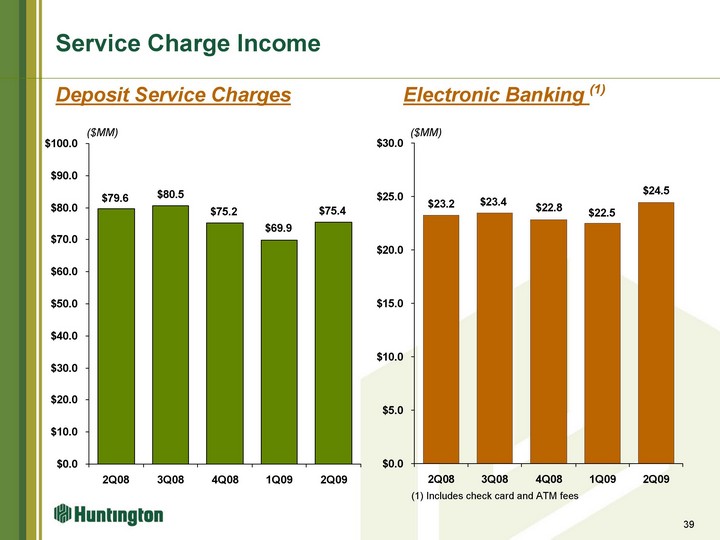
| Service Charge Income 3Q04 43.9 4Q04 41.7 1Q05 39.4 2Q05 41.5 3Q05 44.8 4Q05 42.1 1Q06 41.2 2Q06 47.2 3Q06 48.7 4Q06 48.5 1Q07 44.8 2Q07 50 3Q07 54 24.1 4Q07 81.3 1Q08 72.67 2Q08 79.63 3Q08 80.508 4Q08 75.247 1Q09 69.878 2Q09 75.353 Electronic Bnkg 4Q05 11.5 1Q06 11.5 2Q06 13 3Q06 13 4Q06 13.8 1Q07 13.2 2Q07 14.9 3Q07 15.2 4Q07 21.9 1Q08 20.7 2Q08 23.242 3Q08 23.446 4Q08 22.838 1Q09 22.482 2Q09 24.479 Deposit Service Charges Electronic Banking (1) ($MM) ($MM) 39 (1) Includes check card and ATM fees |
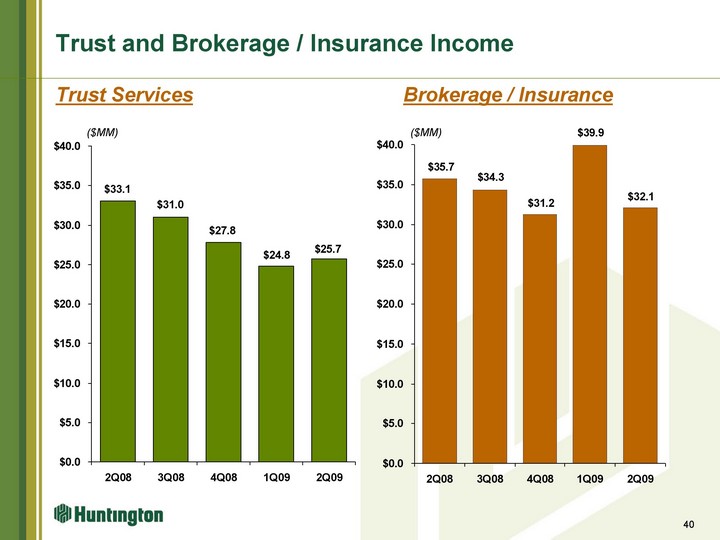
| 3Q04 13.2 4Q04 12.9 1Q05 13 2Q05 13.5 3Q05 13.9 4Q05 13.1 1Q06 15.2 2Q06 14.3 3Q06 14.7 4Q06 14.6 1Q07 16.1 2Q07 17.2 3Q07 28.8 4Q07 30.3 1Q08 36.6 2Q08 35.694 3Q08 34.309 4Q08 31.233 1Q09 39.948 2Q09 32.052 Trust and Brokerage / Insurance Income 3Q04 17.1 4Q04 17.3 1Q05 18.2 2Q05 19.1 3Q05 19.7 4Q05 20.4 1Q06 21.3 2Q06 22.7 3Q06 22.5 4Q06 23.5 1Q07 25.9 2Q07 26.8 3Q07 26.6 7 4Q07 35.2 1Q08 34.1 2Q08 33.089 3Q08 30.952 4Q08 27.811 1Q09 24.81 2Q09 25.722 Trust Services Brokerage / Insurance ($MM) ($MM) 40 |
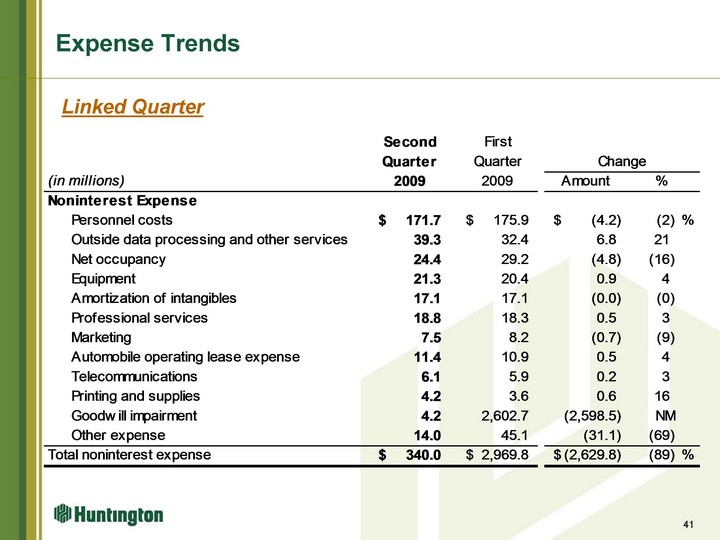
| Expense Trends Linked Quarter 41 |
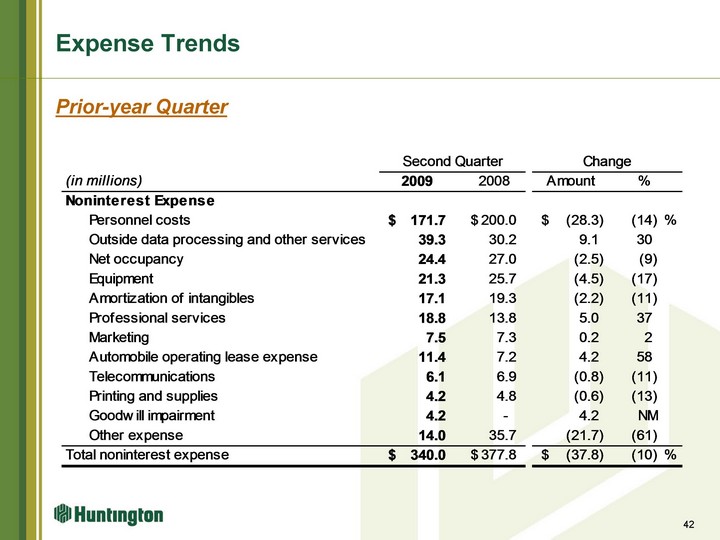
| Expense Trends 42 Prior-year Quarter |
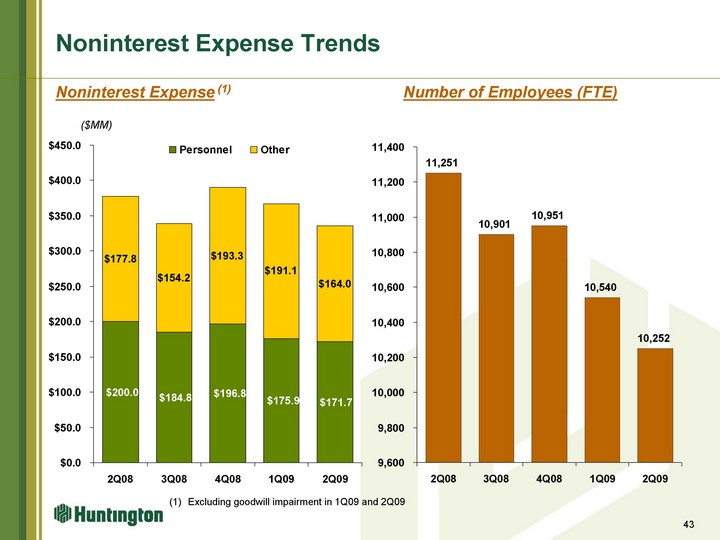
| Noninterest Expense Trends Personnel Other 1Q08 201.943 149.621 2Q08 199.991 177.812 3Q08 184.827 154.169 4Q08 196.785 193.309 1Q09 175.932 191.124 2Q09 171.735 164.016 4Q07 11925 1Q08 11787 2Q08 11251 3Q08 10901 4Q08 10951 1Q09 10540 2Q09 10252 Noninterest Expense (1) Number of Employees (FTE) ($MM) 43 (1) Excluding goodwill impairment in 1Q09 and 2Q09 |
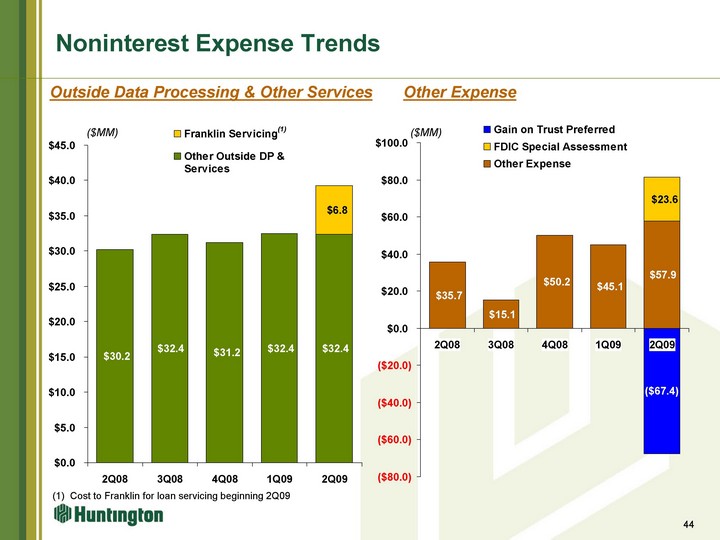
| Noninterest Expense Trends Outside Data Processing & Other Services Other Expense ($MM) ($MM) 44 (1) Cost to Franklin for loan servicing beginning 2Q09 (1) |
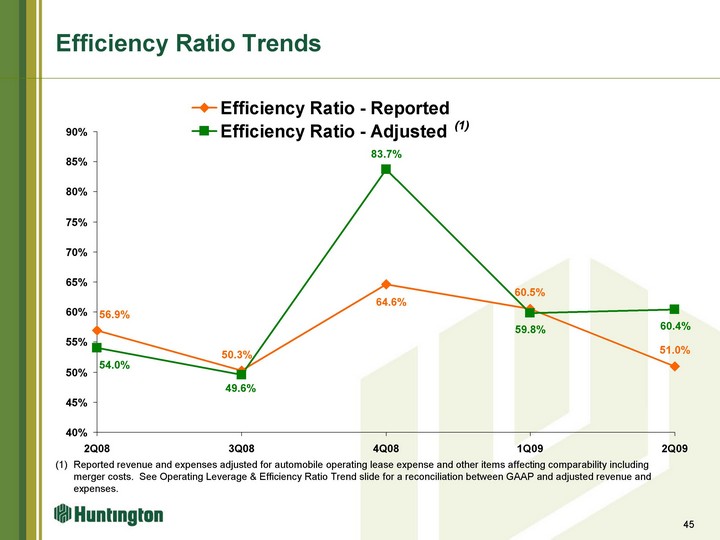
| 2Q08 3Q08 4Q08 1Q09 2Q09 Efficiency Ratio - Reported 0.569 0.503 0.646 0.605 0.51 Efficiency Ratio - Adjusted 0.54 0.496 0.837 0.598 0.604 Efficiency Ratio Trends (1) Reported revenue and expenses adjusted for automobile operating lease expense and other items affecting comparability including merger costs. See Operating Leverage & Efficiency Ratio Trend slide for a reconciliation between GAAP and adjusted revenue and expenses. (1) 45 |
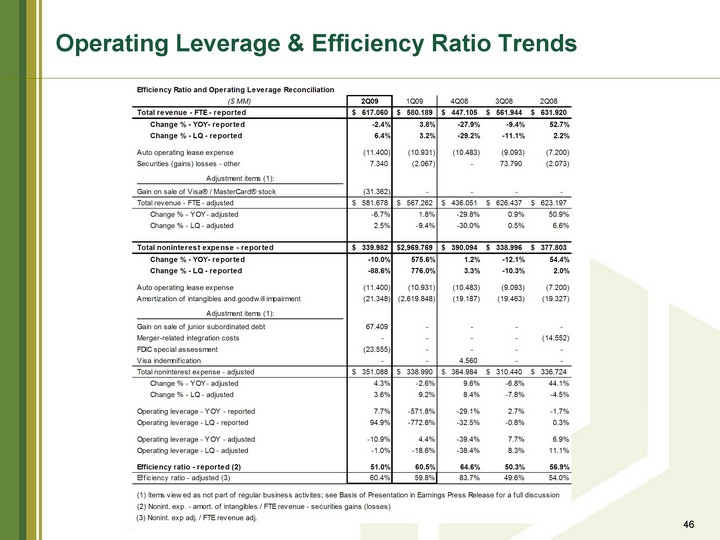
| Operating Leverage & Efficiency Ratio Trends 46 |

| Balance Sheet 47 |
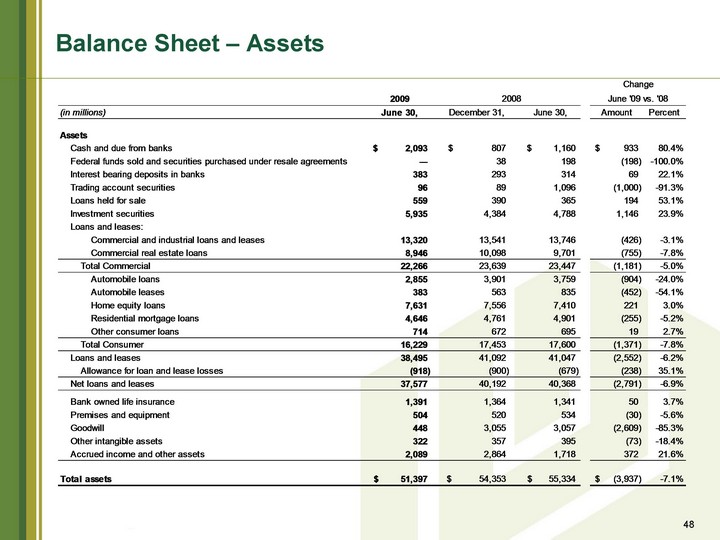
| Balance Sheet - Assets 48 |
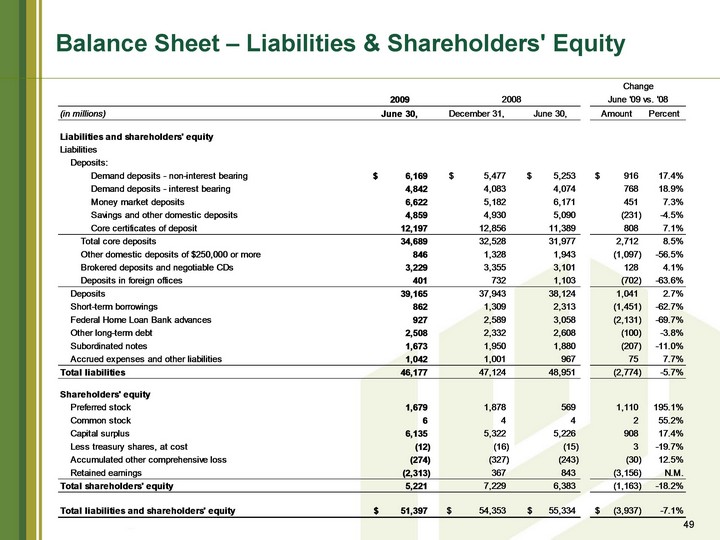
| Balance Sheet - Liabilities & Shareholders' Equity 49 |

| Investment Securities 50 |

| Investment Securities Average Balances % of Average Earning Assets ($MM) Investment Securities 4Q05 4290 0.0496 1Q06 4686 0.0523 2Q06 5050 0.0551 3Q06 4945 0.0564 4Q06 4386 0.0613 1Q07 4186 0.0621 2Q07 3882 0.062 3Q07 4626 0.0619 4Q07 4496 0.061 1Q08 4477 0.0588 2Q08 4688 0.0569 3Q08 4687 0.0573 4Q08 4478 0.0594 1Q09 4426 0.0571 2Q09 5307 0.0469 51 Yield |
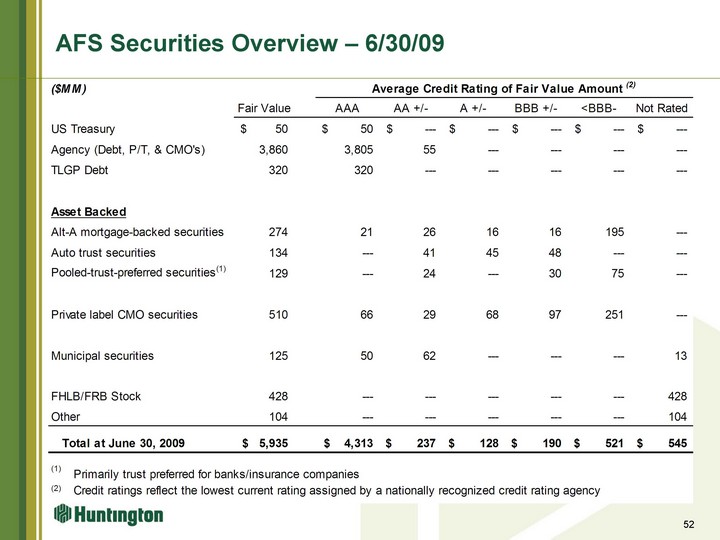
| AFS Securities Overview - 6/30/09 52 |
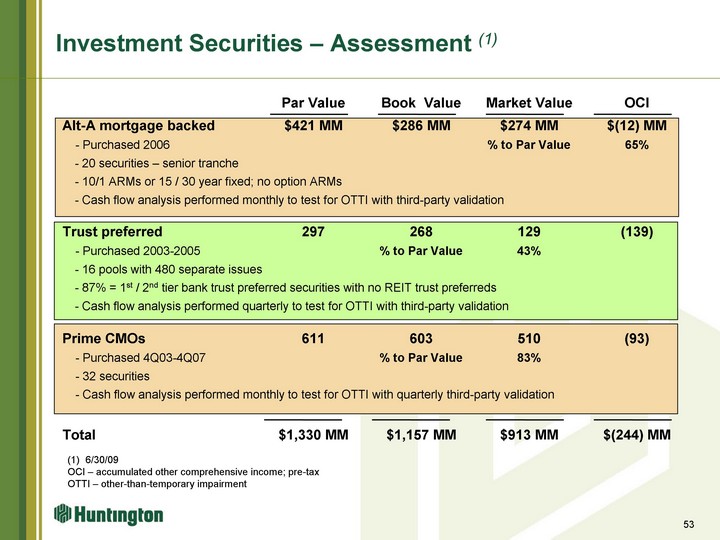
| Investment Securities - Assessment (1) 53 Par Value Book Value Market Value OCI Alt-A mortgage backed $421 MM $286 MM $274 MM $(12) MM - Purchased 2006 % to Par Value 65% - 20 securities - senior tranche - 10/1 ARMs or 15 / 30 year fixed; no option ARMs - Cash flow analysis performed monthly to test for OTTI with third-party validation Trust preferred 297 268 129 (139) - Purchased 2003-2005 % to Par Value 43% - 16 pools with 480 separate issues - 87% = 1st / 2nd tier bank trust preferred securities with no REIT trust preferreds - Cash flow analysis performed quarterly to test for OTTI with third-party validation Prime CMOs 611 603 510 (93) - Purchased 4Q03-4Q07 % to Par Value 83% - 32 securities - Cash flow analysis performed monthly to test for OTTI with quarterly third-party validation Total $1,330 MM $1,157 MM $913 MM $(244) MM 6/30/09 OCI - accumulated other comprehensive income; pre-tax OTTI - other-than-temporary impairment |
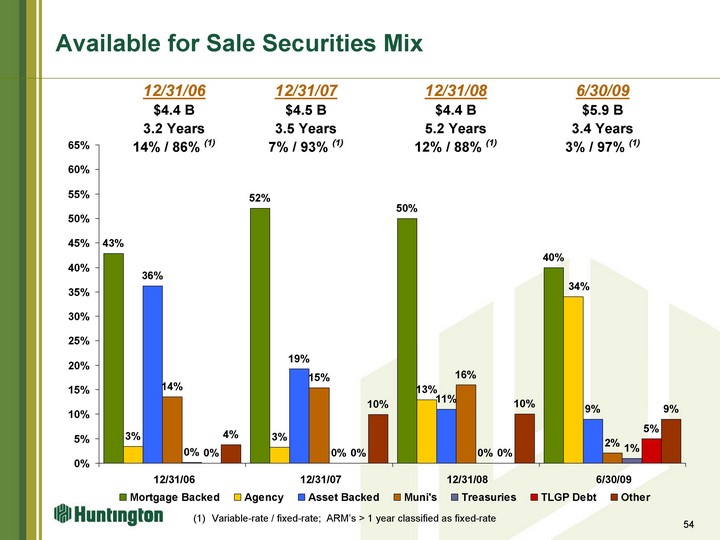
| Mortgage Backed Agency Asset Backed Muni's Treasuries TLGP Debt Other 12/31/03 0.448 0.234 0.13 0.088 0.061 0 0.039 12/31/04 0.337 0.228 0.283 0.098 0.005 0 0.049 12/30/05 0.3695 0.0732 0.3952 0.1204 0.0043 0 0.0374 12/31/06 0.429 0.034 0.362 0.136 0.001 0 0.038 12/31/07 0.521 0.033 0.193 0.154 0 0 0.099 12/31/08 0.5 0.13 0.11 0.16 0 0 0.1 6/30/09 0.4 0.34 0.09 0.02 0.01 0.05 0.09 Available for Sale Securities Mix 6/30/09 $5.9 B 3.4 Years 3% / 97% (1) 12/31/06 $4.4 B 3.2 Years 14% / 86% (1) 12/31/07 $4.5 B 3.5 Years 7% / 93% (1) 12/31/08 $4.4 B 5.2 Years 12% / 88% (1) 54 (1) Variable-rate / fixed-rate; ARM's > 1 year classified as fixed-rate |
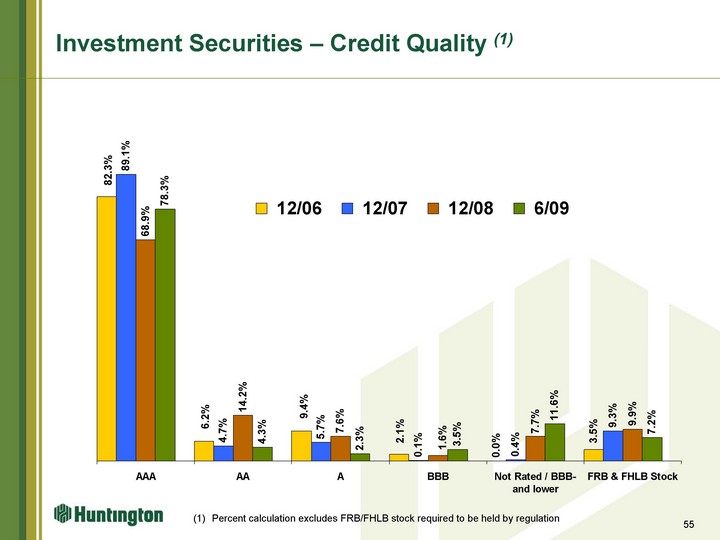
| AAA AA A BBB Not Rated / BBB- and lower FRB & FHLB Stock 12/03 0.798 0.088 0.057 0.022 0.018 0.017 12/04 0.6 0.09 0.25 0.05 0.01 0.02 12/05 0.581 0.145 0.235 0.038 0 0.02 12/06 0.8233 0.062 0.094 0.021 0 0.035 12/07 0.891 0.047 0.057 0.001 0.004 0.093 12/08 0.689 0.142 0.076 0.016 0.077 0.099 6/09 0.783 0.043 0.023 0.035 0.116 0.072 Investment Securities - Credit Quality (1) 55 (1) Percent calculation excludes FRB/FHLB stock required to be held by regulation |

| Loan Portfolio Overview 56 |
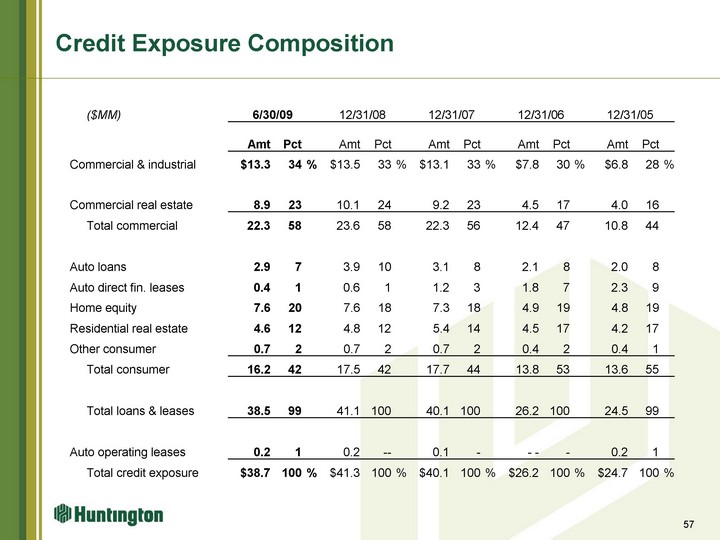
| Credit Exposure Composition ($MM) 6/30/09 6/30/09 6/30/09 12/31/08 12/31/08 12/31/08 12/31/07 12/31/07 12/31/07 12/31/06 12/31/06 12/31/06 12/31/05 12/31/05 12/31/05 Amt Pct Amt Pct Amt Pct Amt Pct Amt Pct Commercial & industrial $13.3 34 % $13.5 33 % $13.1 33 % $7.8 30 % $6.8 28 % Commercial real estate 8.9 23 10.1 24 9.2 23 4.5 17 4.0 16 Total commercial 22.3 58 23.6 58 22.3 56 12.4 47 10.8 44 Auto loans 2.9 7 3.9 10 3.1 8 2.1 8 2.0 8 Auto direct fin. leases 0.4 1 0.6 1 1.2 3 1.8 7 2.3 9 Home equity 7.6 20 7.6 18 7.3 18 4.9 19 4.8 19 Residential real estate 4.6 12 4.8 12 5.4 14 4.5 17 4.2 17 Other consumer 0.7 2 0.7 2 0.7 2 0.4 2 0.4 1 Total consumer 16.2 42 17.5 42 17.7 44 13.8 53 13.6 55 Total loans & leases 38.5 99 41.1 100 40.1 100 26.2 100 24.5 99 Auto operating leases 0.2 1 0.2 -- 0.1 - - - - 0.2 1 Total credit exposure $38.7 100 % $41.3 100 % $40.1 100 % $26.2 100 % $24.7 100 % 57 |
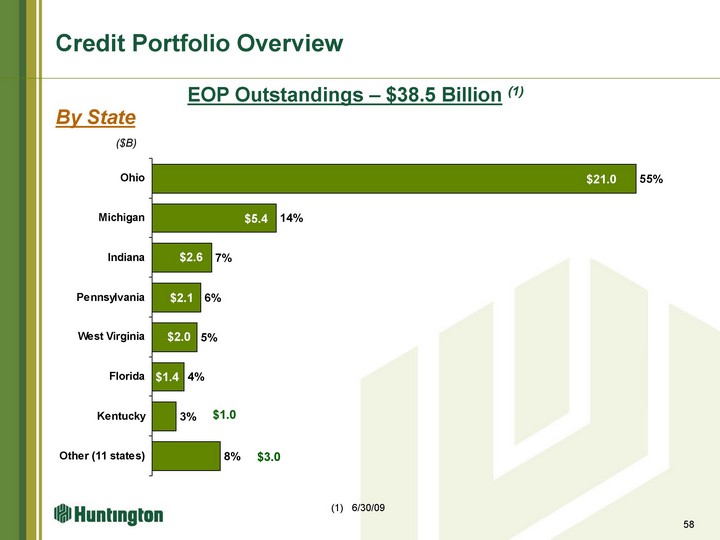
| Other (11 states) 0.077 Kentucky 0.027 Florida 0.036 West Virginia 0.051 Pennsylvania 0.055 Indiana 0.067 Michigan 0.14 Ohio 0.547 Credit Portfolio Overview EOP Outstandings - $38.5 Billion (1) ($B) 58 By State $21.0 $5.4 $2.6 $1.4 $2.1 $2.0 $1.0 $3.0 (1) 6/30/09 |
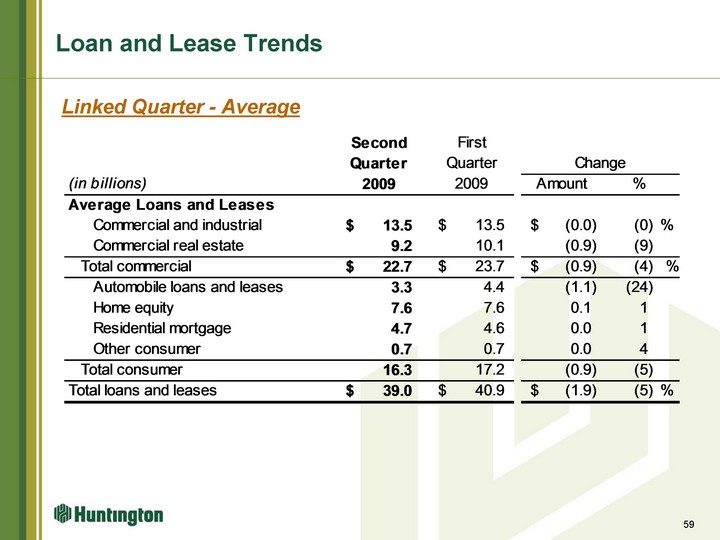
| Loan and Lease Trends 59 Linked Quarter - Average |
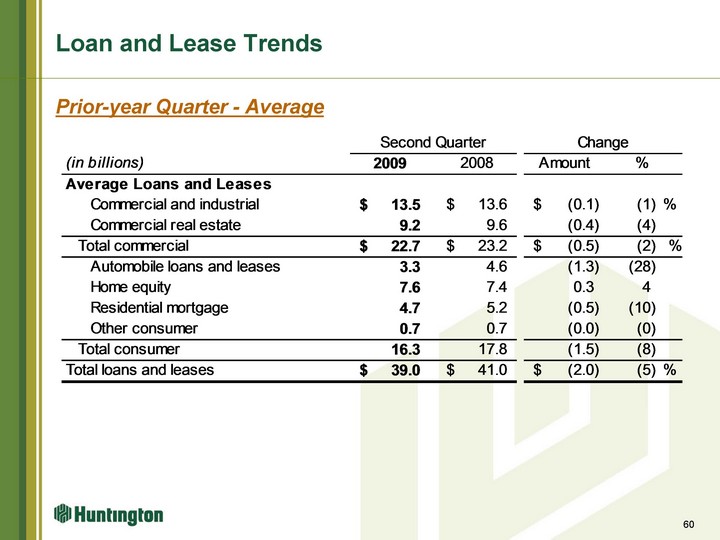
| Loan and Lease Trends 60 Prior-year Quarter - Average |
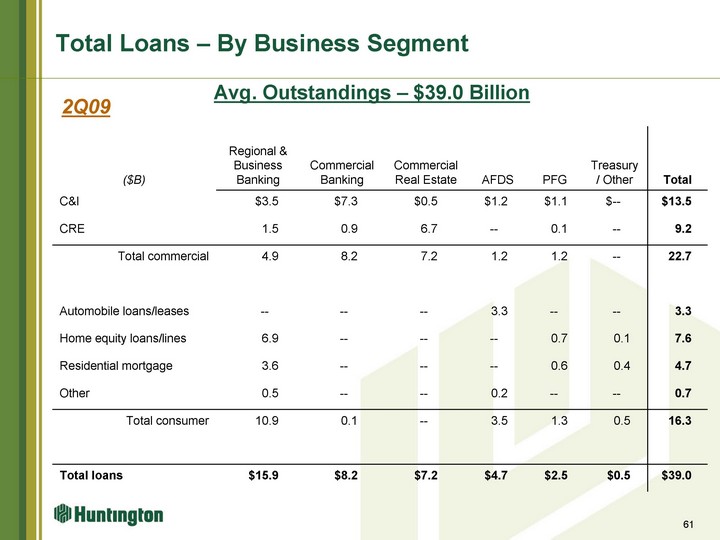
| Total Loans - By Business Segment ($B) Regional & Business Banking Commercial Banking Commercial Real Estate AFDS PFG Treasury / Other Total C&I $3.5 $7.3 $0.5 $1.2 $1.1 $-- $13.5 CRE 1.5 0.9 6.7 -- 0.1 -- 9.2 Total commercial 4.9 8.2 7.2 1.2 1.2 -- 22.7 Automobile loans/leases -- -- -- 3.3 -- -- 3.3 Home equity loans/lines 6.9 -- -- -- 0.7 0.1 7.6 Residential mortgage 3.6 -- -- -- 0.6 0.4 4.7 Other 0.5 -- -- 0.2 -- -- 0.7 Total consumer 10.9 0.1 -- 3.5 1.3 0.5 16.3 Total loans $15.9 $8.2 $7.2 $4.7 $2.5 $0.5 $39.0 61 Avg. Outstandings - $39.0 Billion 2Q09 |

| Total Commercial Loans 62 |
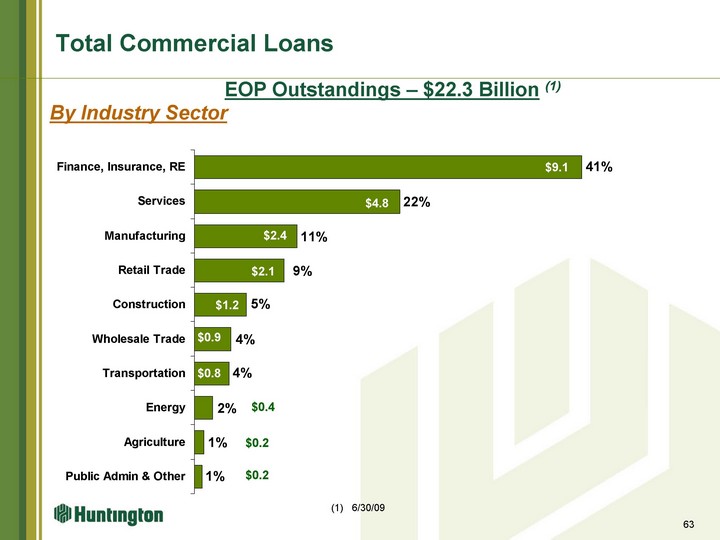
| Public Admin & Other 0.0083 Agriculture 0.0098 Energy 0.0196 Transportation 0.0367 Wholesale Trade 0.0387 Construction 0.0548 Retail Trade 0.0949 Manufacturing 0.109 Services 0.2178 Finance, Insurance, RE 0.41 Total Commercial Loans By Industry Sector EOP Outstandings - $22.3 Billion (1) 63 $9.1 $4.8 $2.4 $2.1 $1.2 $0.9 $0.8 $0.4 $0.2 $0.2 (1) 6/30/09 |
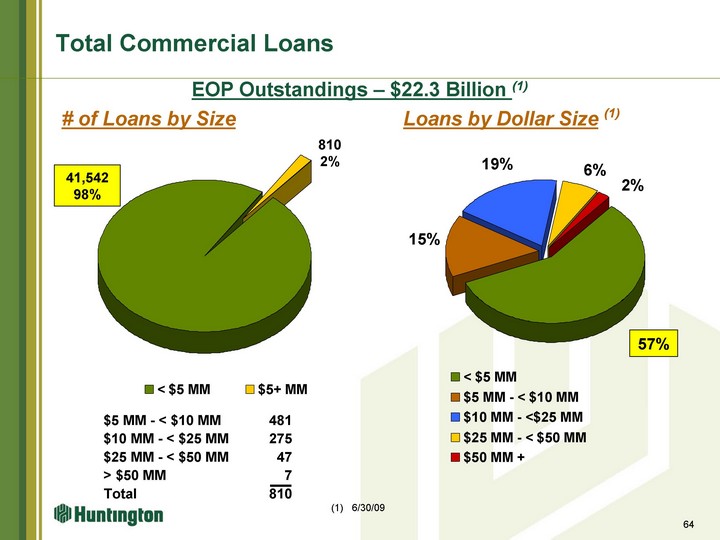
| < $5 MM 41542 $5+ MM 810 Total Commercial Loans # of Loans by Size Loans by Dollar Size (1) $5 MM - < $10 MM 481 $10 MM - < $25 MM 275 $25 MM - < $50 MM 47 > $50 MM 7 Total 810 EOP Outstandings - $22.3 Billion (1) < $5 MM 0.574 $5 MM - < $10 MM 0.1529 $10 MM - <$25 MM 0.1866 $25 MM - < $50 MM 0.0643 $50 MM + 0.0222 57% 15% 19% 6% 2% 810 2% 41,542 98% 64 (1) 6/30/09 |
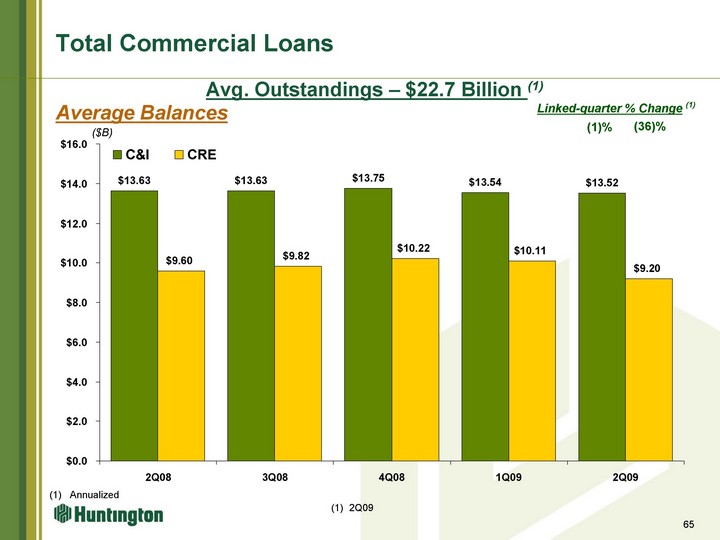
| Total Commercial Loans Average Balances ($B) C&I CRE Small Business C&I/CRE 1Q04 4.44 3.149 1.974 2Q04 4.555 3.191 2.018 3Q04 4.298 3.427 2.081 4Q04 4.503 3.429 2.136 1Q05 4.71 3.525 2.183 2Q05 4.901 3.583 2.23 3Q05 4.708 3.642 2.251 4Q05 4.95 3.6 2.23 1Q06 6.773 4.357 2.035 2Q06 7.287 4.669 2.351 3Q06 7.478 4.561 2.413 4Q06 7.736 4.576 2.421 1Q07 7.987 4.472 2.449 2Q07 8.167 4.651 2.473 3Q07 13.036 8.98 4.267 4Q07 13.27 9.053 4.207 1Q08 13.343 9.287 4.213 2Q08 13.631 9.601 3Q08 13.629 9.816 4Q08 13.746 10.218 1Q09 13.541 10.112 2Q09 13.523 9.199 (1)% (36)% Linked-quarter % Change (1) (1) Annualized 65 Avg. Outstandings - $22.7 Billion (1) (1) 2Q09 |
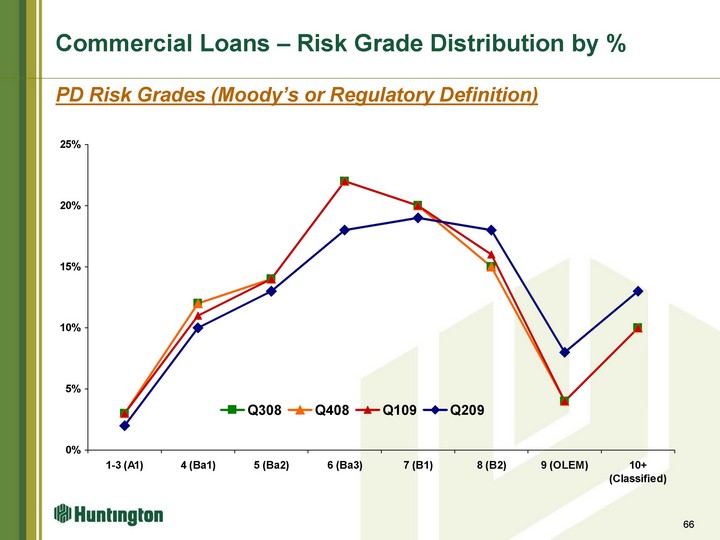
| Commercial Loans - Risk Grade Distribution by % 66 Risk Grade 1-3 (A1) 4 (Ba1) 5 (Ba2) 6 (Ba3) 7 (B1) 8 (B2) 9 (OLEM) 10+ (Classified) Q308 0.03 0.12 0.14 0.22 0.2 0.15 0.04 0.1 Q408 0.03 0.12 0.14 0.22 0.2 0.15 0.04 0.1 Q109 0.03 0.11 0.14 0.22 0.2 0.16 0.04 0.1 Q209 0.02 0.1 0.13 0.18 0.19 0.18 0.08 0.13 PD Risk Grades (Moody's or Regulatory Definition) |
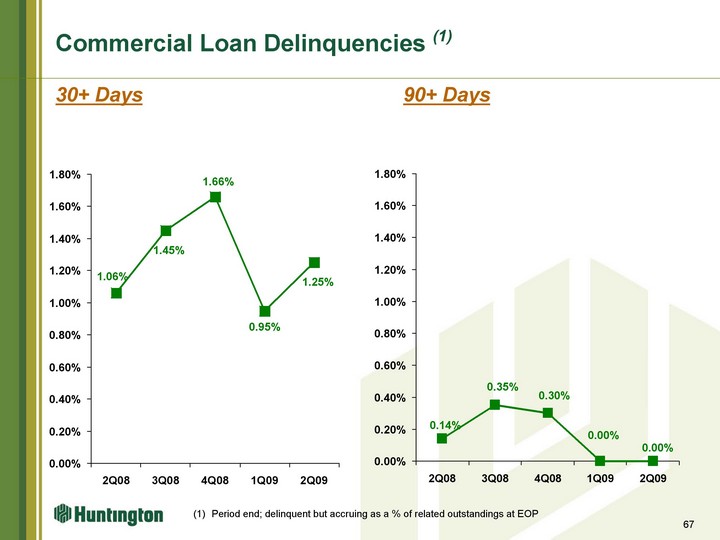
| Commercial Loan Delinquencies (1) 30+ Days 90+ Days With 1Q08 0.0018 2Q08 0.0014 3Q08 0.0035 4Q08 0.003 1Q09 0 2Q09 0 With 1Q08 0.016 2Q08 0.0106 3Q08 0.0145 4Q08 0.0166 1Q09 0.0095 2Q09 0.0125 (1) Period end; delinquent but accruing as a % of related outstandings at EOP 67 |

| Commercial and Industrial Loans (C&I) 68 |
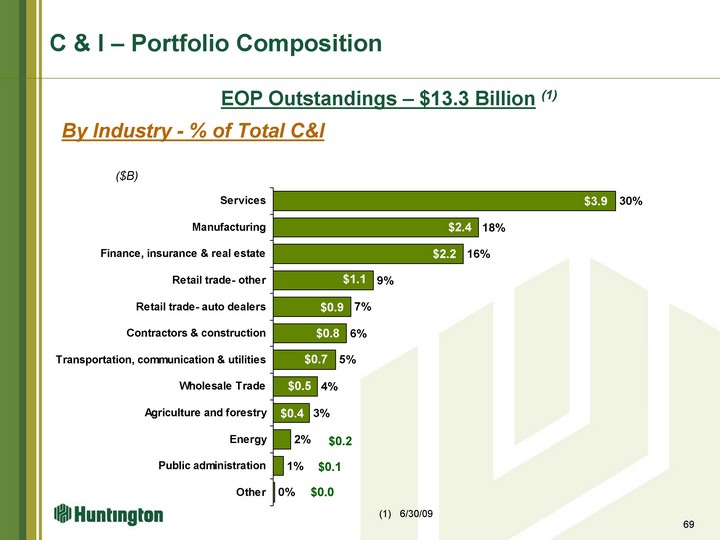
| 69 Other 0.001 Public administration 0.009 Energy 0.015 Agriculture and forestry 0.031 Wholesale Trade 0.038 Transportation, communication & utilities 0.054 Contractors & construction 0.063 Retail trade- auto dealers 0.067 Retail trade- other 0.086 Finance, insurance & real estate 0.164 Manufacturing 0.177 Services 0.295 C & I - Portfolio Composition By Industry - % of Total C&I 69 EOP Outstandings - $13.3 Billion (1) $3.9 $2.4 $2.2 $1.1 $0.9 $0.8 $0.7 $0.5 $0.4 $0.2 $0.1 $0.0 ($B) (1) 6/30/09 |
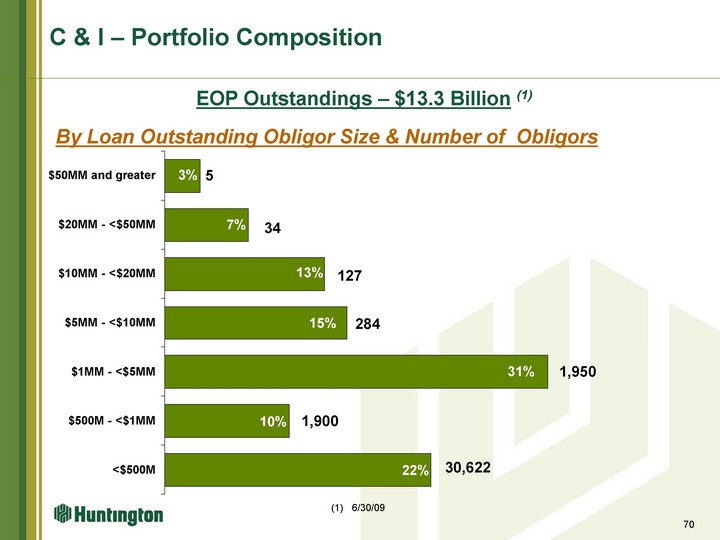
| 70 <$500M 0.2157 $500M - <$1MM 0.1006 $1MM - <$5MM 0.3103 $5MM - <$10MM 0.1476 $10MM - <$20MM 0.1293 $20MM - <$50MM 0.068 $50MM and greater 0.0285 C & I - Portfolio Composition By Loan Outstanding Obligor Size & Number of Obligors 70 5 34 127 284 1,950 1,900 30,622 EOP Outstandings - $13.3 Billion (1) (1) 6/30/09 |
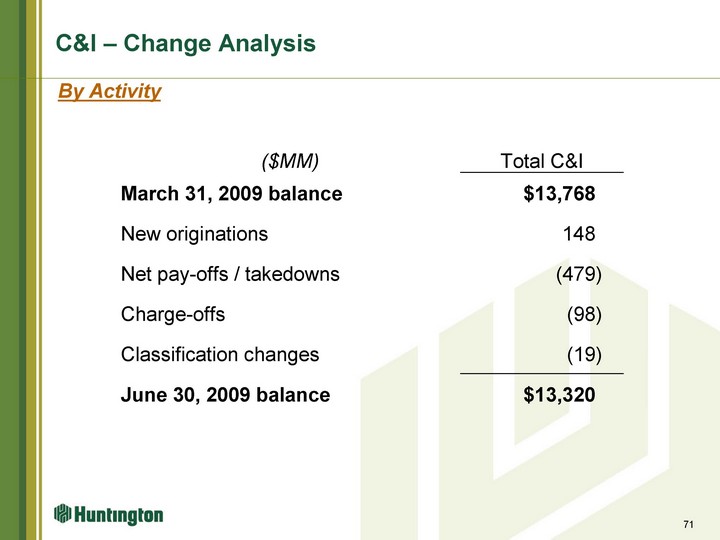
| C&I - Change Analysis ($MM) Total C&I March 31, 2009 balance $13,768 New originations 148 Net pay-offs / takedowns (479) Charge-offs (98) Classification changes (19) June 30, 2009 balance $13,320 71 By Activity |
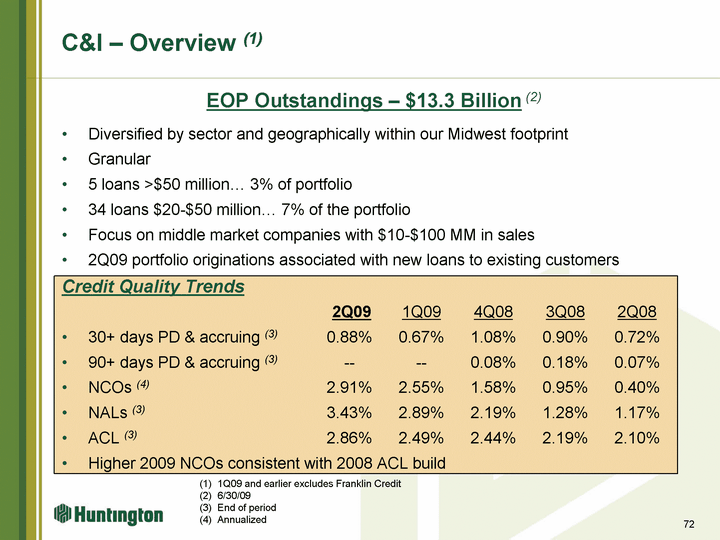
| EOP Outstandings - $13.3 Billion (2) Diversified by sector and geographically within our Midwest footprint Granular 5 loans >$50 million... 3% of portfolio 34 loans $20-$50 million... 7% of the portfolio Focus on middle market companies with $10-$100 MM in sales 2Q09 portfolio originations associated with new loans to existing customers Credit Quality Trends 2Q09 1Q09 4Q08 3Q08 2Q08 30+ days PD & accruing (3) 0.88% 0.67% 1.08% 0.90% 0.72% 90+ days PD & accruing (3) -- -- 0.08% 0.18% 0.07% NCOs (4) 2.91% 2.55% 1.58% 0.95% 0.40% NALs (3) 3.43% 2.89% 2.19% 1.28% 1.17% ACL (3) 2.86% 2.49% 2.44% 2.19% 2.10% Higher 2009 NCOs consistent with 2008 ACL build C&I - Overview (1) 72 (1) 1Q09 and earlier excludes Franklin Credit 6/30/09 End of period (4) Annualized |
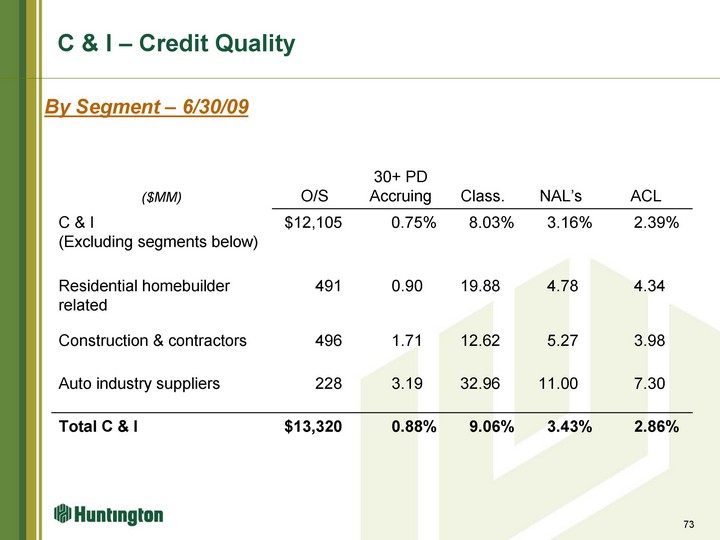
| 73 By Segment - 6/30/09 73 C & I - Credit Quality ($MM) O/S 30+ PD Accruing Class. NAL's ACL C & I (Excluding segments below) $12,105 0.75% 8.03% 3.16% 2.39% Residential homebuilder related 491 0.90 19.88 4.78 4.34 Construction & contractors 496 1.71 12.62 5.27 3.98 Auto industry suppliers 228 3.19 32.96 11.00 7.30 Total C & I $13,320 0.88% 9.06% 3.43% 2.86% |
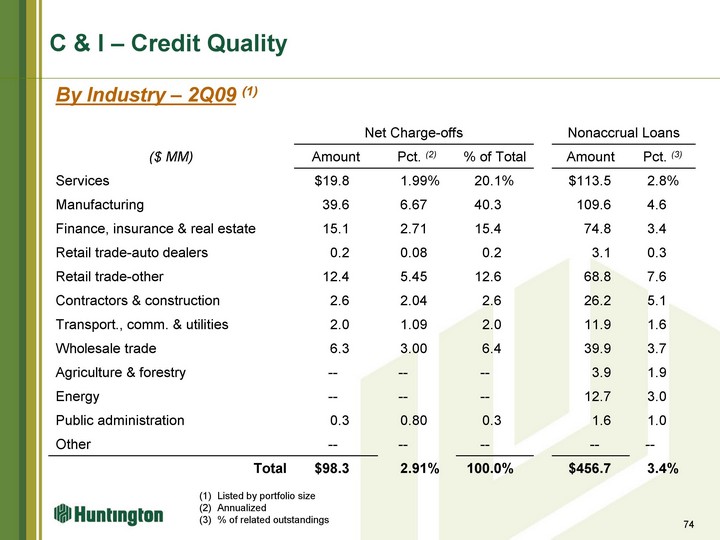
| 74 C & I - Credit Quality 74 Net Charge-offs Net Charge-offs Net Charge-offs Nonaccrual Loans Nonaccrual Loans ($ MM) Amount Pct. (2) % of Total Amount Pct. (3) Services $19.8 1.99% 20.1% $113.5 2.8% Manufacturing 39.6 6.67 40.3 109.6 4.6 Finance, insurance & real estate 15.1 2.71 15.4 74.8 3.4 Retail trade-auto dealers 0.2 0.08 0.2 3.1 0.3 Retail trade-other 12.4 5.45 12.6 68.8 7.6 Contractors & construction 2.6 2.04 2.6 26.2 5.1 Transport., comm. & utilities 2.0 1.09 2.0 11.9 1.6 Wholesale trade 6.3 3.00 6.4 39.9 3.7 Agriculture & forestry -- -- -- 3.9 1.9 Energy -- -- -- 12.7 3.0 Public administration 0.3 0.80 0.3 1.6 1.0 Other -- -- -- -- -- Total $98.3 2.91% 100.0% $456.7 3.4% (1) Listed by portfolio size (2) Annualized (3) % of related outstandings By Industry - 2Q09 (1) |
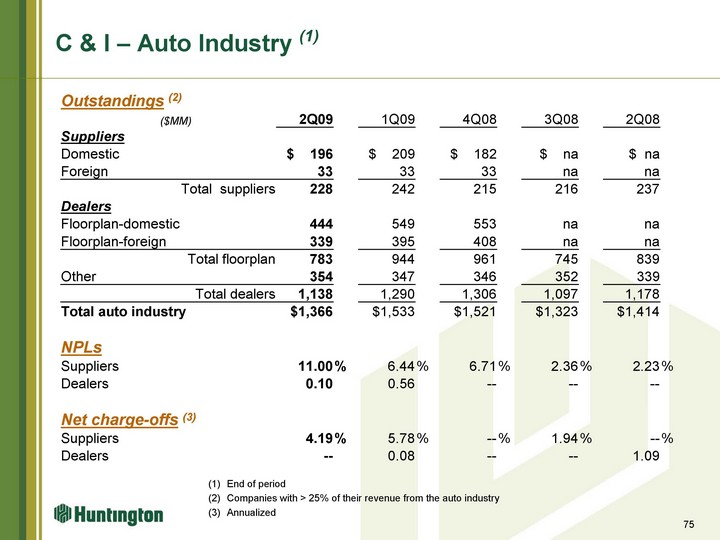
| 75 C & I - Auto Industry (1) Outstandings (2) ($MM) 2Q09 1Q09 4Q08 3Q08 2Q08 Suppliers Domestic $ 196 $ 209 $ 182 $ na $ na Foreign 33 33 33 na na Total suppliers 228 242 215 216 237 Dealers Floorplan-domestic 444 549 553 na na Floorplan-foreign 339 395 408 na na Total floorplan 783 944 961 745 839 Other 354 347 346 352 339 Total dealers 1,138 1,290 1,306 1,097 1,178 Total auto industry $1,366 $1,533 $1,521 $1,323 $1,414 NPLs Suppliers 11.00 % 6.44 % 6.71 % 2.36 % 2.23 % Dealers 0.10 0.56 -- -- -- Net charge-offs (3) Suppliers 4.19 % 5.78 % -- % 1.94 % -- % Dealers -- 0.08 -- -- 1.09 (1) End of period (2) Companies with > 25% of their revenue from the auto industry (3) Annualized 75 |

| Commercial Real Estate Loans (CRE) 76 |
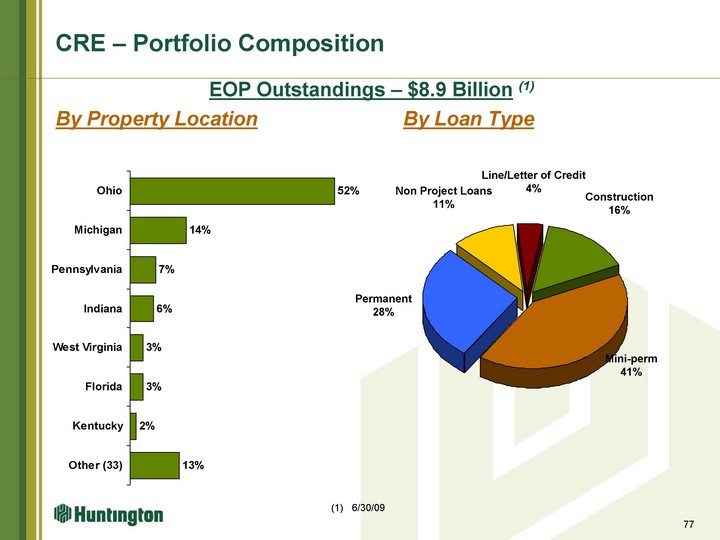
| 77 Construction Mini-Perm Permanent Non Project Loans Line/Letter of Credit 0.1552 0.4106 0.2813 0.1091 0.0438 CRE - Portfolio Composition By Property Location By Loan Type EOP Outstandings - $8.9 Billion (1) Permanent 28% Mini-perm 41% Construction 16% Non Project Loans 11% 77 Other (33) 0.1254 Kentucky 0.015 Florida 0.0331 West Virginia 0.0337 Indiana 0.0608 Pennsylvania 0.0658 Michigan 0.1428 Ohio 0.5234 Line/Letter of Credit 4% (1) 6/30/09 |
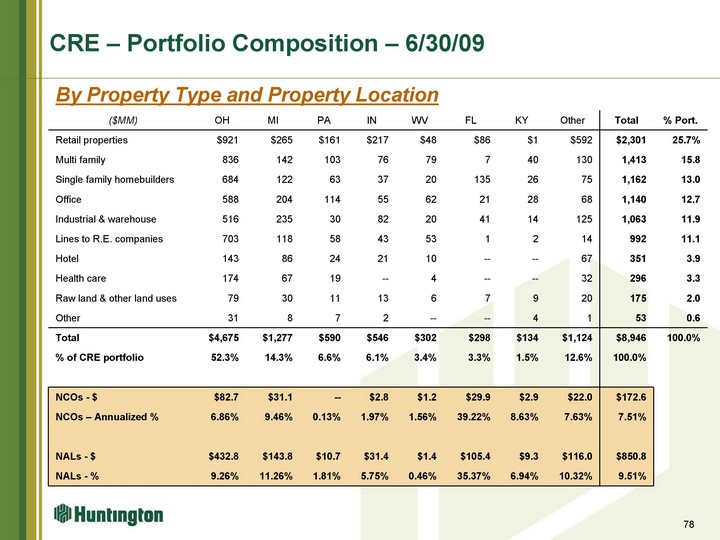
| 78 CRE - Portfolio Composition - 6/30/09 78 By Property Type and Property Location ($MM) OH MI PA IN WV FL KY Other Total % Port. Retail properties $921 $265 $161 $217 $48 $86 $1 $592 $2,301 25.7% Multi family 836 142 103 76 79 7 40 130 1,413 15.8 Single family homebuilders 684 122 63 37 20 135 26 75 1,162 13.0 Office 588 204 114 55 62 21 28 68 1,140 12.7 Industrial & warehouse 516 235 30 82 20 41 14 125 1,063 11.9 Lines to R.E. companies 703 118 58 43 53 1 2 14 992 11.1 Hotel 143 86 24 21 10 -- -- 67 351 3.9 Health care 174 67 19 -- 4 -- -- 32 296 3.3 Raw land & other land uses 79 30 11 13 6 7 9 20 175 2.0 Other 31 8 7 2 -- -- 4 1 53 0.6 Total $4,675 $1,277 $590 $546 $302 $298 $134 $1,124 $8,946 100.0% % of CRE portfolio 52.3% 14.3% 6.6% 6.1% 3.4% 3.3% 1.5% 12.6% 100.0% NCOs - $ $82.7 $31.1 -- $2.8 $1.2 $29.9 $2.9 $22.0 $172.6 NCOs - Annualized % 6.86% 9.46% 0.13% 1.97% 1.56% 39.22% 8.63% 7.63% 7.51% NALs - $ $432.8 $143.8 $10.7 $31.4 $1.4 $105.4 $9.3 $116.0 $850.8 NALs - % 9.26% 11.26% 1.81% 5.75% 0.46% 35.37% 6.94% 10.32% 9.51% |
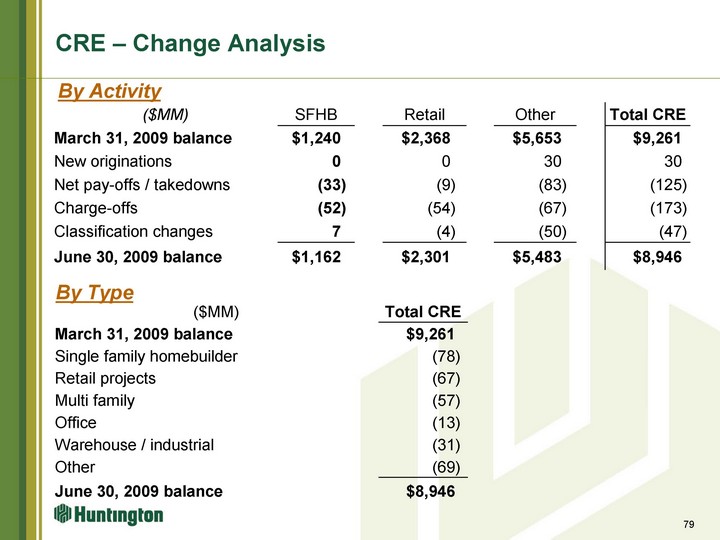
| CRE - Change Analysis ($MM) SFHB Retail Other Total CRE March 31, 2009 balance $1,240 $2,368 $5,653 $9,261 New originations 0 0 30 30 Net pay-offs / takedowns (33) (9) (83) (125) Charge-offs (52) (54) (67) (173) Classification changes 7 (4) (50) (47) June 30, 2009 balance $1,162 $2,301 $5,483 $8,946 79 By Activity By Type ($MM) Total CRE March 31, 2009 balance $9,261 Single family homebuilder (78) Retail projects (67) Multi family (57) Office (13) Warehouse / industrial (31) Other (69) June 30, 2009 balance $8,946 |
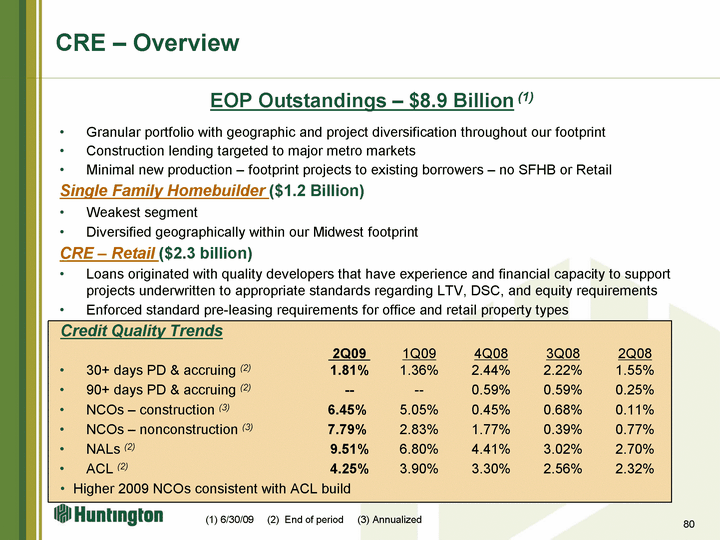
| EOP Outstandings - $8.9 Billion (1) Granular portfolio with geographic and project diversification throughout our footprint Construction lending targeted to major metro markets Minimal new production - footprint projects to existing borrowers - no SFHB or Retail Single Family Homebuilder ($1.2 Billion) Weakest segment Diversified geographically within our Midwest footprint CRE - Retail ($2.3 billion) Loans originated with quality developers that have experience and financial capacity to support projects underwritten to appropriate standards regarding LTV, DSC, and equity requirements Enforced standard pre-leasing requirements for office and retail property types Credit Quality Trends 2Q09 1Q09 4Q08 3Q08 2Q08 30+ days PD & accruing (2) 1.81% 1.36% 2.44% 2.22% 1.55% 90+ days PD & accruing (2) -- -- 0.59% 0.59% 0.25% NCOs - construction (3) 6.45% 5.05% 0.45% 0.68% 0.11% NCOs - nonconstruction (3) 7.79% 2.83% 1.77% 0.39% 0.77% NALs (2) 9.51% 6.80% 4.41% 3.02% 2.70% ACL (2) 4.25% 3.90% 3.30% 2.56% 2.32% Higher 2009 NCOs consistent with ACL build CRE - Overview 80 (1) 6/30/09 (2) End of period (3) Annualized |
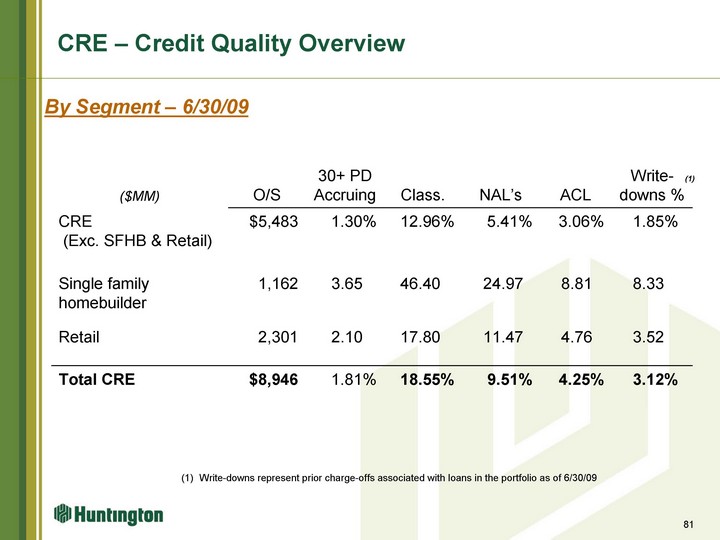
| 81 By Segment - 6/30/09 81 CRE - Credit Quality Overview ($MM) O/S 30+ PD Accruing Class. NAL's ACL Write-downs % CRE (Exc. SFHB & Retail) $5,483 1.30% 12.96% 5.41% 3.06% 1.85% Single family homebuilder 1,162 3.65 46.40 24.97 8.81 8.33 Retail 2,301 2.10 17.80 11.47 4.76 3.52 Total CRE $8,946 1.81% 18.55% 9.51% 4.25% 3.12% (1) (1) Write-downs represent prior charge-offs associated with loans in the portfolio as of 6/30/09 |
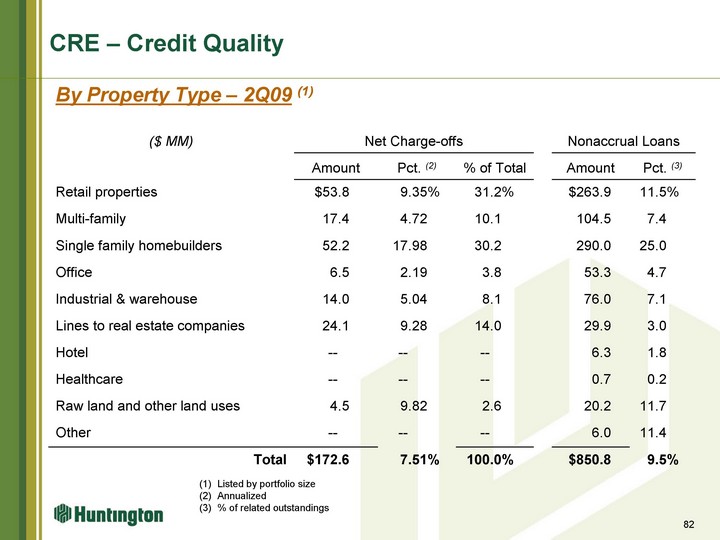
| 82 CRE - Credit Quality 82 ($ MM) Net Charge-offs Net Charge-offs Net Charge-offs Nonaccrual Loans Nonaccrual Loans Amount Pct. (2) % of Total Amount Pct. (3) Retail properties $53.8 9.35% 31.2% $263.9 11.5% Multi-family 17.4 4.72 10.1 104.5 7.4 Single family homebuilders 52.2 17.98 30.2 290.0 25.0 Office 6.5 2.19 3.8 53.3 4.7 Industrial & warehouse 14.0 5.04 8.1 76.0 7.1 Lines to real estate companies 24.1 9.28 14.0 29.9 3.0 Hotel -- -- -- 6.3 1.8 Healthcare -- -- -- 0.7 0.2 Raw land and other land uses 4.5 9.82 2.6 20.2 11.7 Other -- -- -- 6.0 11.4 Total $172.6 7.51% 100.0% $850.8 9.5% (1) Listed by portfolio size (2) Annualized (3) % of related outstandings By Property Type - 2Q09 (1) |
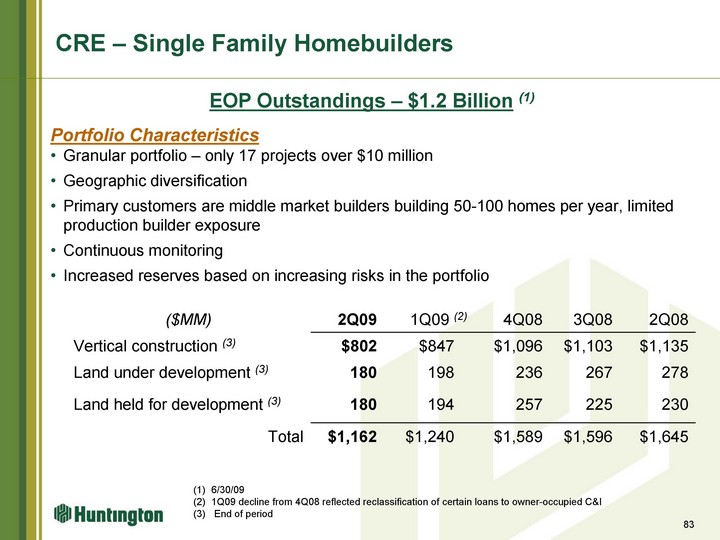
| EOP Outstandings - $1.2 Billion (1) Portfolio Characteristics Granular portfolio - only 17 projects over $10 million Geographic diversification Primary customers are middle market builders building 50-100 homes per year, limited production builder exposure Continuous monitoring Increased reserves based on increasing risks in the portfolio 83 (1) 6/30/09 (2) 1Q09 decline from 4Q08 reflected reclassification of certain loans to owner-occupied C&I (3) End of period CRE - Single Family Homebuilders ($MM) 2Q09 1Q09 (2) 4Q08 3Q08 2Q08 Vertical construction (3) $802 $847 $1,096 $1,103 $1,135 Land under development (3) 180 198 236 267 278 Land held for development (3) 180 194 257 225 230 Total $1,162 $1,240 $1,589 $1,596 $1,645 |
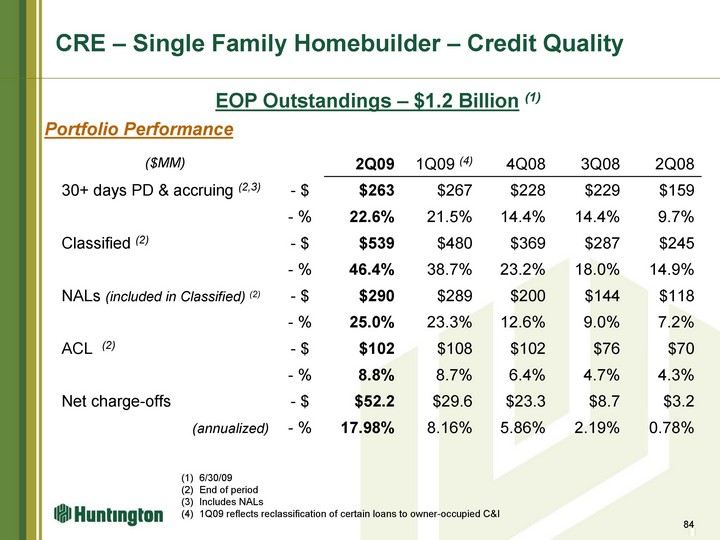
| EOP Outstandings - $1.2 Billion (1) Portfolio Performance 84 CRE - Single Family Homebuilder - Credit Quality ($MM) 2Q09 1Q09 (4) 4Q08 3Q08 2Q08 30+ days PD & accruing (2,3) - $ $263 $267 $228 $229 $159 - % 22.6% 21.5% 14.4% 14.4% 9.7% Classified (2) - $ $539 $480 $369 $287 $245 - % 46.4% 38.7% 23.2% 18.0% 14.9% NALs (included in Classified) (2) - $ $290 $289 $200 $144 $118 - % 25.0% 23.3% 12.6% 9.0% 7.2% ACL (2) - $ $102 $108 $102 $76 $70 - % 8.8% 8.7% 6.4% 4.7% 4.3% Net charge-offs - $ $52.2 $29.6 $23.3 $8.7 $3.2 (annualized) - % 17.98% 8.16% 5.86% 2.19% 0.78% (1) 6/30/09 (2) End of period (3) Includes NALs (4) 1Q09 reflects reclassification of certain loans to owner-occupied C&I |
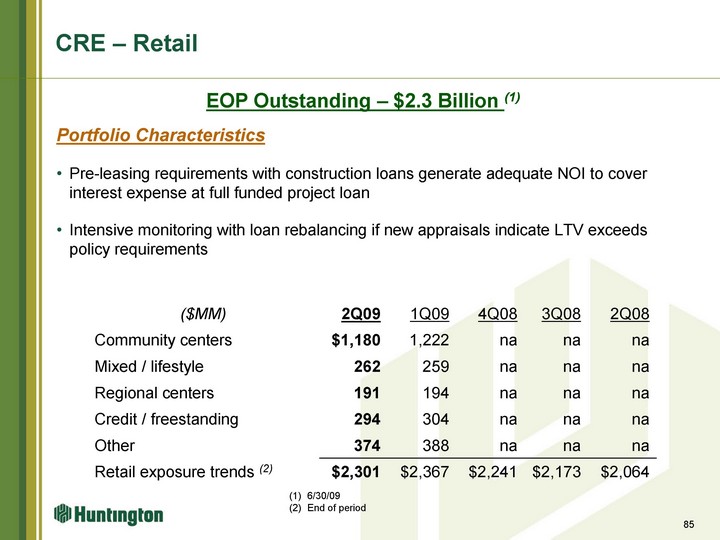
| 85 (1) 6/30/09 (2) End of period CRE - Retail ($MM) 2Q09 1Q09 4Q08 3Q08 2Q08 Community centers $1,180 1,222 na na na Mixed / lifestyle 262 259 na na na Regional centers 191 194 na na na Credit / freestanding 294 304 na na na Other 374 388 na na na Retail exposure trends (2) $2,301 $2,367 $2,241 $2,173 $2,064 EOP Outstanding - $2.3 Billion (1) Portfolio Characteristics Pre-leasing requirements with construction loans generate adequate NOI to cover interest expense at full funded project loan Intensive monitoring with loan rebalancing if new appraisals indicate LTV exceeds policy requirements |
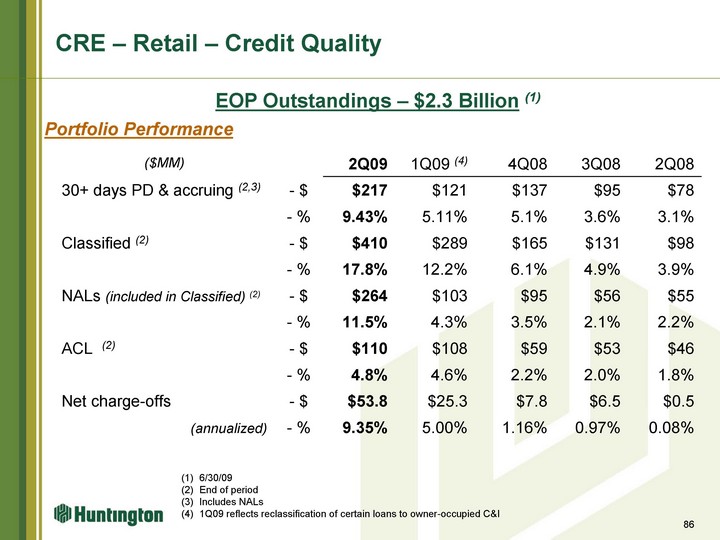
| EOP Outstandings - $2.3 Billion (1) Portfolio Performance 86 CRE - Retail - Credit Quality ($MM) 2Q09 1Q09 (4) 4Q08 3Q08 2Q08 30+ days PD & accruing (2,3) - $ $217 $121 $137 $95 $78 - % 9.43% 5.11% 5.1% 3.6% 3.1% Classified (2) - $ $410 $289 $165 $131 $98 - % 17.8% 12.2% 6.1% 4.9% 3.9% NALs (included in Classified) (2) - $ $264 $103 $95 $56 $55 - % 11.5% 4.3% 3.5% 2.1% 2.2% ACL (2) - $ $110 $108 $59 $53 $46 - % 4.8% 4.6% 2.2% 2.0% 1.8% Net charge-offs - $ $53.8 $25.3 $7.8 $6.5 $0.5 (annualized) - % 9.35% 5.00% 1.16% 0.97% 0.08% (1) 6/30/09 (2) End of period (3) Includes NALs (4) 1Q09 reflects reclassification of certain loans to owner-occupied C&I |

| Total Consumer Loans and Leases 87 |
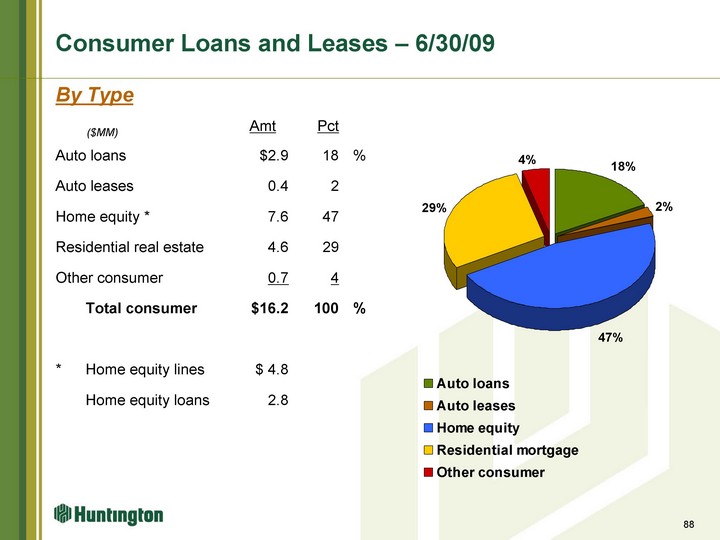
| Auto loans 0.176 Auto leases 0.024 Home equity 0.47 Residential mortgage 0.286 Other consumer 0.044 Consumer Loans and Leases - 6/30/09 By Type ($MM) Amt Pct Auto loans $2.9 18 % Auto leases 0.4 2 Home equity * 7.6 47 Residential real estate 4.6 29 Other consumer 0.7 4 Total consumer $16.2 100 % * Home equity lines $ 4.8 Home equity loans 2.8 88 |
| 89 Credit Risk Management Objective Manage the Probability of Default Footprint Portfolio... markets we know and understand Client Selection... bias for high quality customers and relationship lending vs. third party originations Disciplined Underwriting... borrower ability to repay, collateral value, and stress testing when appropriate 89 |
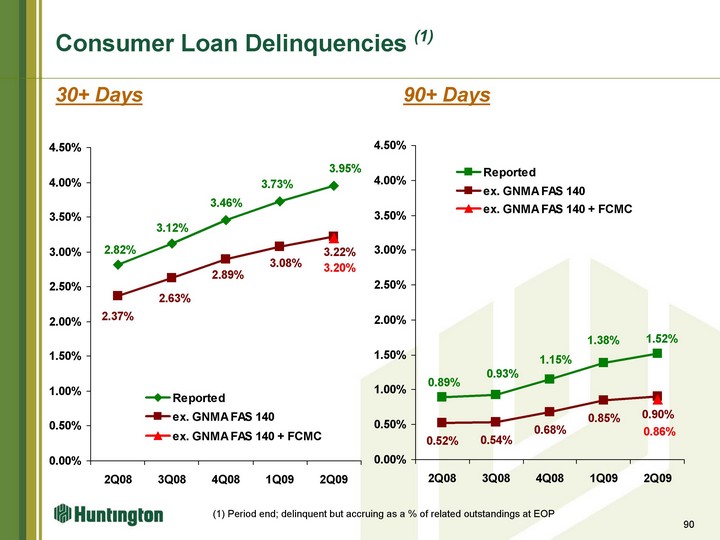
| Consumer Loan Delinquencies (1) 30+ Days 90+ Days Reported ex. GNMA FAS 140 ex. GNMA FAS 140 + FCMC 1Q08 0.0089 0.0056 2Q08 0.0089 0.0052 3Q08 0.0093 0.0054 4Q08 0.0115 0.0068 1Q09 0.0138 0.0085 2Q09 0.0152 0.009 0.0086 Reported ex. GNMA FAS 140 ex. GNMA FAS 140 + FCMC 1Q08 0.0285 0.0243 2Q08 0.0282 0.0237 3Q08 0.0312 0.0263 4Q08 0.0346 0.0289 1Q09 0.0373 0.0308 2Q09 0.0395 0.0322 0.032 (1) Period end; delinquent but accruing as a % of related outstandings at EOP 90 |
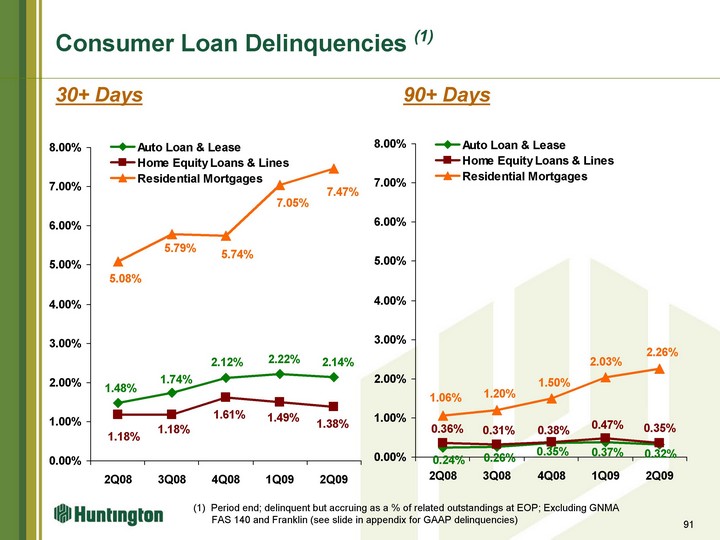
| Consumer Loan Delinquencies (1) 30+ Days 90+ Days (1) Period end; delinquent but accruing as a % of related outstandings at EOP; Excluding GNMA FAS 140 and Franklin (see slide in appendix for GAAP delinquencies) 91 |

| Automobile Loans & Leases 92 |
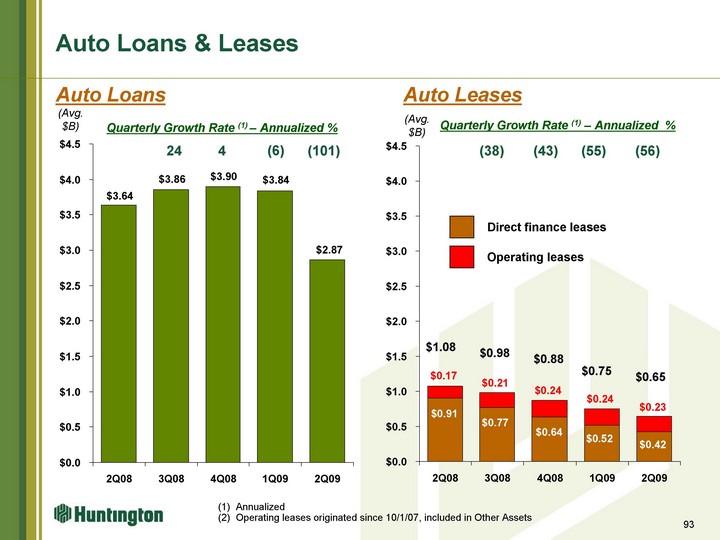
| Auto Direct Finance Leases Auto Operating Leases 3Q02 0.461 2.597 4Q02 0.759 2.328 1Q03 1.006 2.076 2Q03 1.306 1.802 3Q03 1.59 1.565 4Q03 1.802 1.355 1Q04 1.99 1.17 2Q04 2.139 0.97 3Q04 2.25 0.79 4Q04 2.388 0.64 1Q05 2.461 0.51 2Q05 2.468 0.39 3Q05 2.424 0.29 4Q05 2.34 0.22 1Q06 2.221 0.16 2Q06 2.1 0.11 3Q06 1.976 0.07 4Q06 1.838 0.04 1Q07 1.698 0.023 2Q07 1.551 0.009 3Q07 1.423 0.004 4Q07 1.272 0.033 1Q08 1.09 0.099 2Q08 0.91 0.168 3Q08 0.768 0.213 4Q08 0.636 0.24 1Q09 0.517 0.237 2Q09 0.423 0.225 Auto loans Auto loans Securitized loans 2Q02 3Q02 2.764 1.15 4Q02 2.94 1.12 1Q03 3.079 1.09 2Q03 2.83 1.08 3Q03 3.594 0.05 4Q03 3.529 0.04 1Q04 3.041 0.03 2Q04 2.337 3Q04 1.857 4Q04 1.913 1Q05 2.008 2Q05 2.069 3Q05 2.078 4Q05 2.02 1Q06 1.99 2Q06 2.04 3Q06 2.079 4Q06 2.111 1Q07 2.215 2Q07 2.322 3Q07 2.499 0.432 4Q07 3.052 1Q08 3.309 2Q08 3.636 3Q08 3.856 4Q08 3.899 1Q09 3.837 2Q09 2.867 Auto Loans & Leases Auto Loans Auto Leases (Avg. $B) 93 4 Quarterly Growth Rate (1) - Annualized % (6) (101) 24 (Avg. $B) (55) Quarterly Growth Rate (1) - Annualized % (56) (38) (43) (1) Annualized (2) Operating leases originated since 10/1/07, included in Other Assets $1.08 $0.98 $0.75 Operating leases Direct finance leases $0.88 $0.65 |
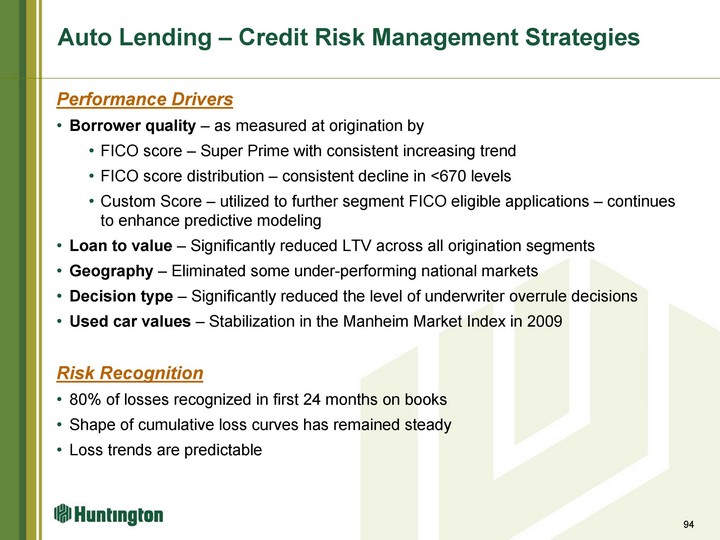
| 94 Auto Lending - Credit Risk Management Strategies Performance Drivers Borrower quality - as measured at origination by FICO score - Super Prime with consistent increasing trend FICO score distribution - consistent decline in <670 levels Custom Score - utilized to further segment FICO eligible applications - continues to enhance predictive modeling Loan to value - Significantly reduced LTV across all origination segments Geography - Eliminated some under-performing national markets Decision type - Significantly reduced the level of underwriter overrule decisions Used car values - Stabilization in the Manheim Market Index in 2009 Risk Recognition 80% of losses recognized in first 24 months on books Shape of cumulative loss curves has remained steady Loss trends are predictable |
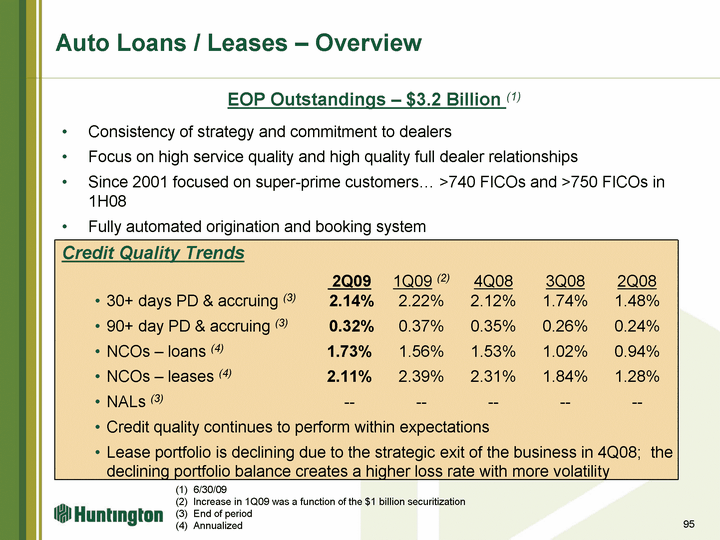
| EOP Outstandings - $3.2 Billion (1) Consistency of strategy and commitment to dealers Focus on high service quality and high quality full dealer relationships Since 2001 focused on super-prime customers... >740 FICOs and >750 FICOs in 1H08 Fully automated origination and booking system Credit Quality Trends 2Q09 1Q09 (2) 4Q08 3Q08 2Q08 30+ days PD & accruing (3) 2.14% 2.22% 2.12% 1.74% 1.48% 90+ day PD & accruing (3) 0.32% 0.37% 0.35% 0.26% 0.24% NCOs - loans (4) 1.73% 1.56% 1.53% 1.02% 0.94% NCOs - leases (4) 2.11% 2.39% 2.31% 1.84% 1.28% NALs (3) -- -- -- -- -- Credit quality continues to perform within expectations Lease portfolio is declining due to the strategic exit of the business in 4Q08; the declining portfolio balance creates a higher loss rate with more volatility Auto Loans / Leases - Overview 95 (1) 6/30/09 Increase in 1Q09 was a function of the $1 billion securitization End of period (4) Annualized |
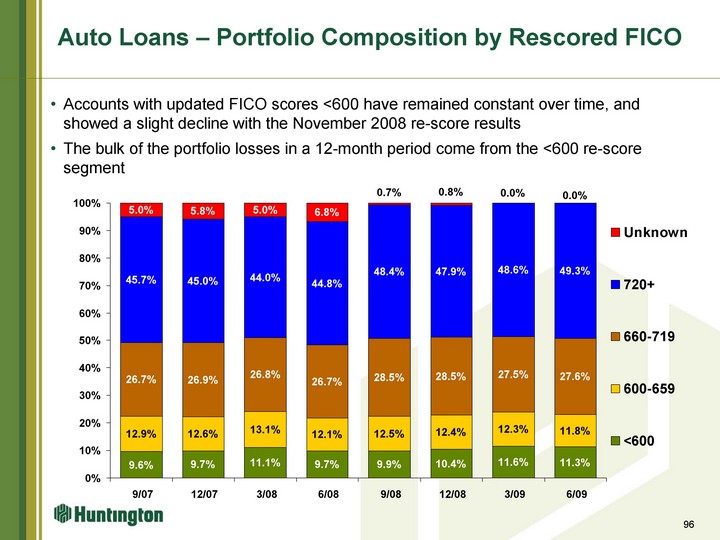
| Auto Loans - Portfolio Composition by Rescored FICO Accounts with updated FICO scores <600 have remained constant over time, and showed a slight decline with the November 2008 re-score results The bulk of the portfolio losses in a 12-month period come from the <600 re-score segment 96 6/07 9/07 12/07 3/08 6/08 9/08 12/08 3/09 6/09 <600 0.089535205 0.095692143 0.097267529 0.110622042 0.096985766 0.098907283 0.104065318 0.116 0.113 600-659 0.123959162 0.129409866 0.125725874 0.131289385 0.120573137 0.125045223 0.124039763 0.123 0.118 660-719 0.261982684 0.267443305 0.268716876 0.268362304 0.266534149 0.284723023 0.284955013 0.275 0.276 720+ 0.462495719 0.457296597 0.4501254 0.439718799 0.447750907 0.483851812 0.479051227 0.486 0.493 Unknown 0.06202723 0.050158088 0.058164321 0.050007471 0.068156041 0.007472658 0.007888678 0 0 |
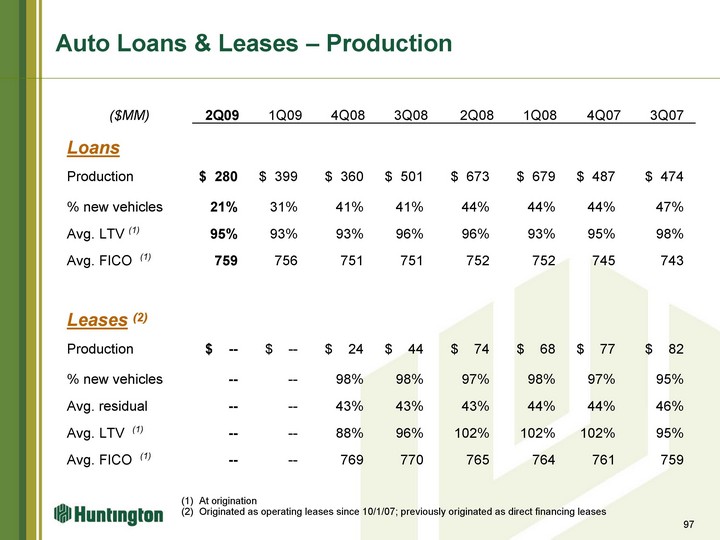
| Auto Loans & Leases - Production ($MM) 2Q09 1Q09 4Q08 3Q08 2Q08 1Q08 4Q07 3Q07 Loans Production $ 280 $ 399 $ 360 $ 501 $ 673 $ 679 $ 487 $ 474 % new vehicles 21% 31% 41% 41% 44% 44% 44% 47% Avg. LTV (1) 95% 93% 93% 96% 96% 93% 95% 98% Avg. FICO (1) 759 756 751 751 752 752 745 743 Leases (2) Production $ -- $ -- $ 24 $ 44 $ 74 $ 68 $ 77 $ 82 % new vehicles -- -- 98% 98% 97% 98% 97% 95% Avg. residual -- -- 43% 43% 43% 44% 44% 46% Avg. LTV (1) -- -- 88% 96% 102% 102% 102% 95% Avg. FICO (1) -- -- 769 770 765 764 761 759 97 (1) At origination (2) Originated as operating leases since 10/1/07; previously originated as direct financing leases |
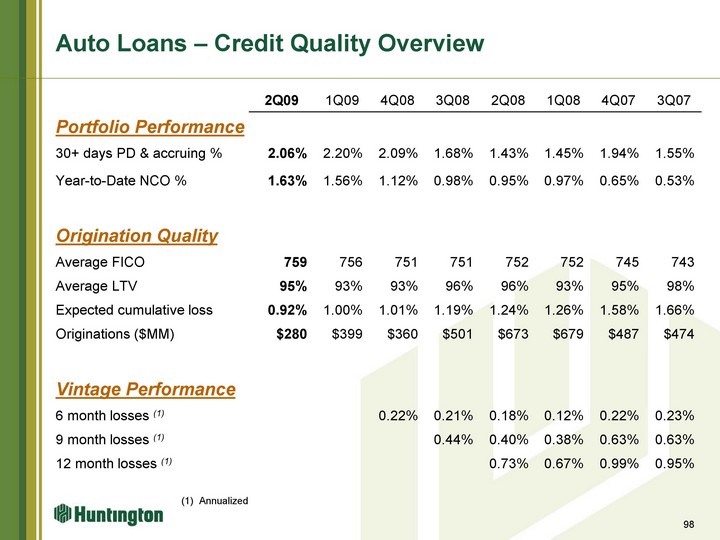
| Auto Loans - Credit Quality Overview 2Q09 1Q09 4Q08 3Q08 2Q08 1Q08 4Q07 3Q07 Portfolio Performance Portfolio Performance 30+ days PD & accruing % 2.06% 2.20% 2.09% 1.68% 1.43% 1.45% 1.94% 1.55% Year-to-Date NCO % 1.63% 1.56% 1.12% 0.98% 0.95% 0.97% 0.65% 0.53% Origination Quality Origination Quality Average FICO 759 756 751 751 752 752 745 743 Average LTV 95% 93% 93% 96% 96% 93% 95% 98% Expected cumulative loss 0.92% 1.00% 1.01% 1.19% 1.24% 1.26% 1.58% 1.66% Originations ($MM) $280 $399 $360 $501 $673 $679 $487 $474 Vintage Performance Vintage Performance 6 month losses (1) 0.22% 0.21% 0.18% 0.12% 0.22% 0.23% 9 month losses (1) 0.44% 0.40% 0.38% 0.63% 0.63% 12 month losses (1) 0.73% 0.67% 0.99% 0.95% 98 (1) Annualized |
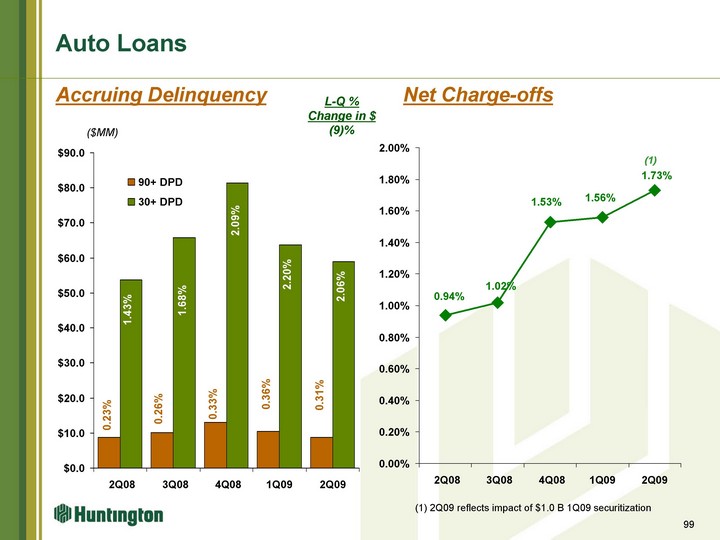
| Auto Loans Accruing Delinquency Net Charge-offs 99 0.23% 0.26% 0.33% 0.36% 0.31% 1.43% 1.68% 2.09% 2.20% 2.06% ($MM) L-Q % Change in $ (9)% (1) (1) 2Q09 reflects impact of $1.0 B 1Q09 securitization |
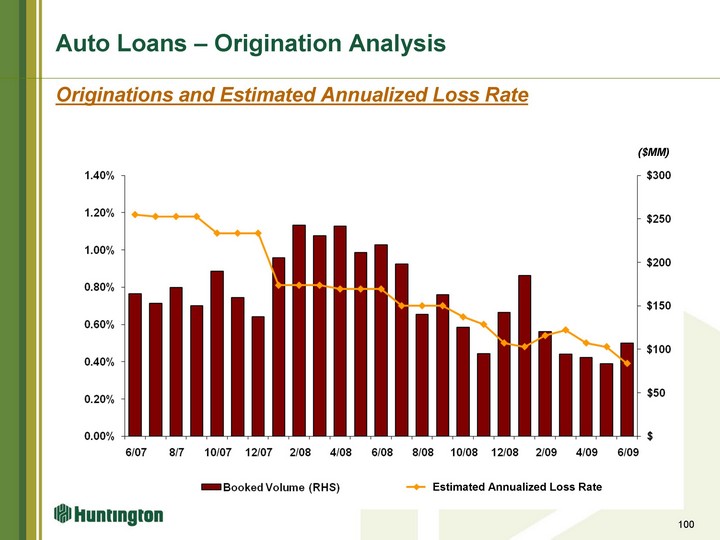
| Auto Loans - Origination Analysis 100 Originations and Estimated Annualized Loss Rate ($MM) Estimated Annualized Loss Rate |
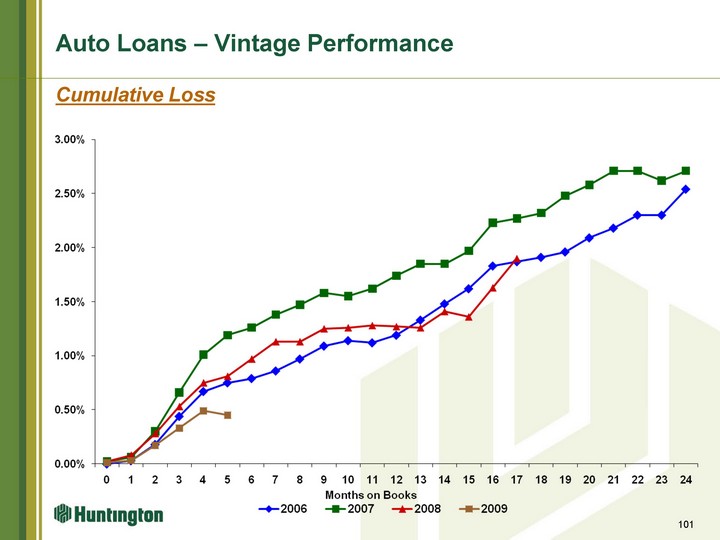
| Auto Loans - Vintage Performance 101 Cumulative Loss |
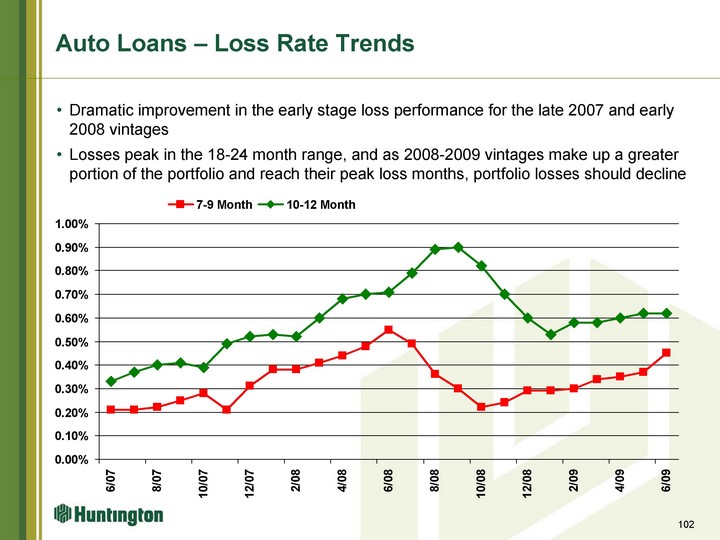
| Auto Loans - Loss Rate Trends Dramatic improvement in the early stage loss performance for the late 2007 and early 2008 vintages Losses peak in the 18-24 month range, and as 2008-2009 vintages make up a greater portion of the portfolio and reach their peak loss months, portfolio losses should decline 102 7-9 Month 10-12 Month 9/05 0.0024 0.0038 10/05 0.0025 0.0038 11/05 0.0025 0.0035 12/05 0.0024 0.0038 1/06 0.0021 0.0041 2/06 0.0019 0.0044 3/06 0.0015 0.0046 4/06 0.0015 0.0041 5/06 0.0015 0.0038 6/06 0.0016 0.003 7/06 0.002 0.0026 8/06 0.0021 0.0027 9/06 0.0018 0.0035 10/06 0.0014 0.0038 11/06 0.0015 0.0032 12/06 0.0015 0.0031 1/07 0.0018 0.0031 2/07 0.0019 0.0032 3/07 0.002 0.0031 4/07 0.0018 0.0034 5/07 0.0021 0.0033 6/07 0.0021 0.0033 7/07 0.0021 0.0037 8/07 0.0022 0.004 9/07 0.0025 0.0041 10/07 0.0028 0.0039 11/07 0.0021 0.0049 12/07 0.0031 0.0052 1/08 0.0038 0.0053 2/08 0.0038 0.0052 3/08 0.0041 0.006 4/08 0.0044 0.0068 5/08 0.0048 0.007 6/08 0.0055 0.0071 7/08 0.0049 0.0079 8/08 0.0036 0.0089 9/08 0.003 0.009 10/08 0.0022 0.0082 11/08 0.0024 0.007 12/08 0.0029 0.006 1/09 0.0029 0.0053 2/09 0.003 0.0058 3/09 0.0034 0.0058 4/09 0.0035 0.006 5/09 0.0037 0.0062 6/09 0.0045 0.0062 |

| Residential Real Estate Loans 103 |
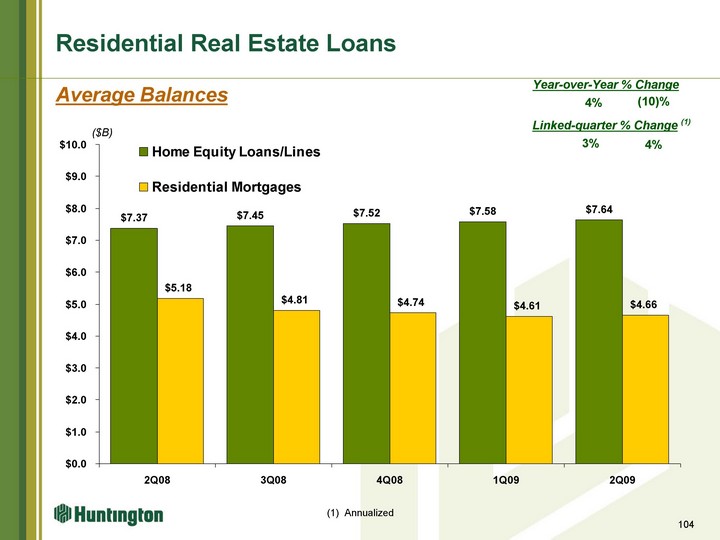
| 104 Home Equity Loans/Lines Residential Mortgages Other 1Q04 3.833 2.674 0.402 2Q04 4.145 2.986 0.397 3Q04 4.408 3.484 0.39 4Q04 4.585 3.695 0.383 1Q05 4.676 3.919 0.374 2Q05 4.75 4.08 0.377 3Q05 4.801 4.157 0.387 4Q05 4.781 4.17 0.393 1Q06 4.833 4.31 0.447 2Q06 5.029 4.63 0.448 3Q06 5.041 4.748 0.43 4Q06 4.973 4.635 0.43 1Q07 4.913 4.496 0.422 2Q07 4.973 4.351 0.424 3Q07 7.468 5.456 0.534 4Q07 7.297 5.437 0.728 1Q08 7.274 5.351 0.713 2Q08 7.365 5.178 0.699 3Q08 7.453 4.812 0.67 4Q08 7.523 4.737 0.678 1Q09 7.577 4.611 0.671 2Q09 7.64 4.657 3.441 Residential Real Estate Loans Average Balances ($B) 4% (10)% Year-over-Year % Change 3% 4% Linked-quarter % Change (1) (1) Annualized 104 |
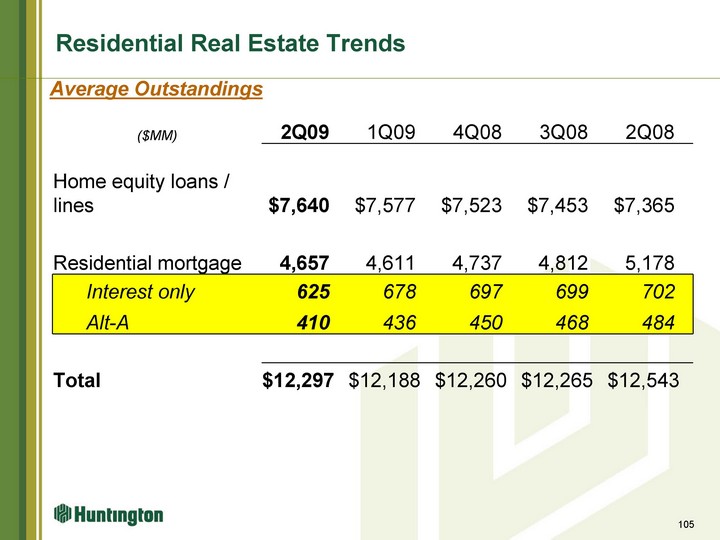
| Residential Real Estate Trends ($MM) 2Q09 1Q09 4Q08 3Q08 2Q08 Home equity loans / lines $7,640 $7,577 $7,523 $7,453 $7,365 Residential mortgage 4,657 4,611 4,737 4,812 5,178 Interest only 625 678 697 699 702 Alt-A 410 436 450 468 484 Total $12,297 $12,188 $12,260 $12,265 $12,543 Average Outstandings 105 |
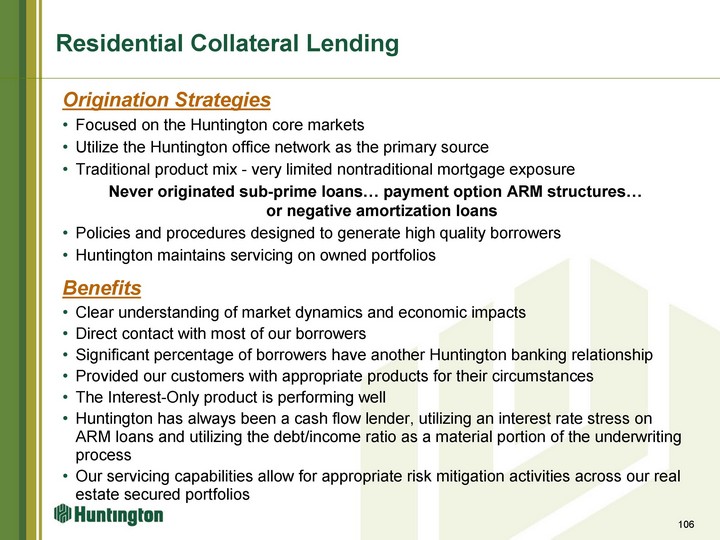
| Origination Strategies Focused on the Huntington core markets Utilize the Huntington office network as the primary source Traditional product mix - very limited nontraditional mortgage exposure Never originated sub-prime loans... payment option ARM structures... or negative amortization loans Policies and procedures designed to generate high quality borrowers Huntington maintains servicing on owned portfolios Benefits Clear understanding of market dynamics and economic impacts Direct contact with most of our borrowers Significant percentage of borrowers have another Huntington banking relationship Provided our customers with appropriate products for their circumstances The Interest-Only product is performing well Huntington has always been a cash flow lender, utilizing an interest rate stress on ARM loans and utilizing the debt/income ratio as a material portion of the underwriting process Our servicing capabilities allow for appropriate risk mitigation activities across our real estate secured portfolios Residential Collateral Lending 106 |

| Home Equity Loans and Lines 107 |
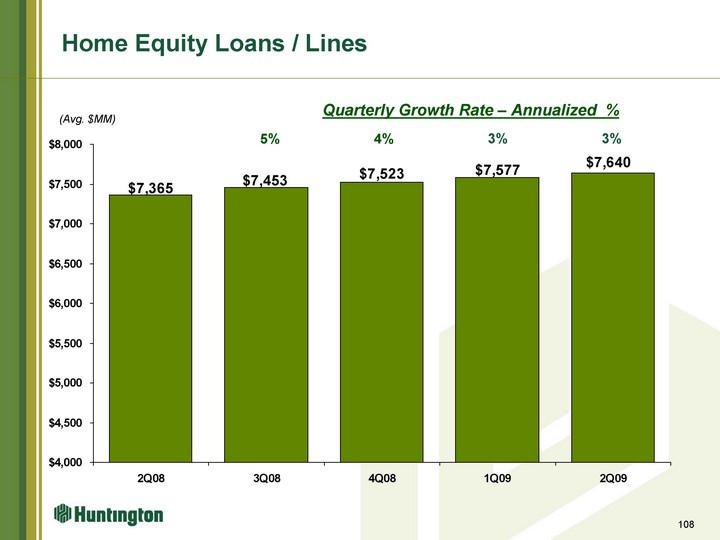
| HBAN HBAN 1Q03 3194 2Q03 3313 3Q03 3448 4Q03 3640 1Q04 3833 2Q04 4145 3Q04 4408 4Q04 4585 1Q05 4676 2Q05 4750 3Q05 4801 4Q05 4781 1Q06 4833 2Q06 5029 3Q06 5041 4Q06 4973 1Q07 4913 2Q07 4973 3Q07 5083 2385 4Q07 7297 1Q08 7274 2Q08 7365 3Q08 7453 4Q08 7523 1Q09 7577 2Q09 7640 Home Equity Loans / Lines (Avg. $MM) 4% 3% 5% 108 3% Quarterly Growth Rate - Annualized % |
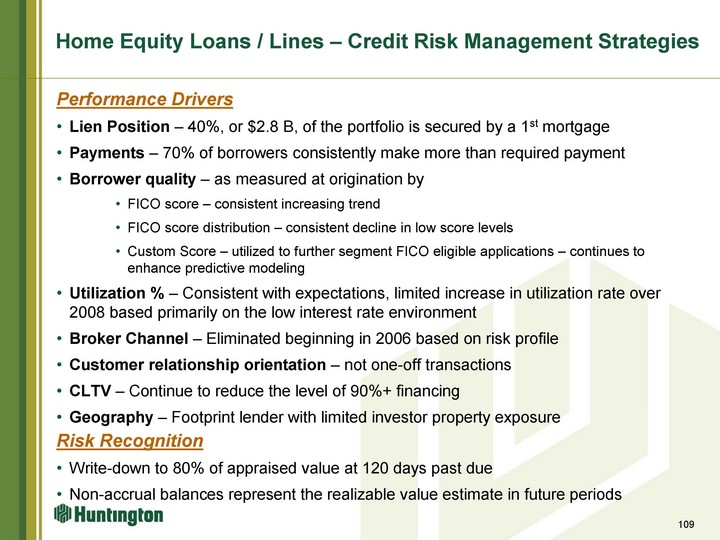
| 109 Home Equity Loans / Lines - Credit Risk Management Strategies Performance Drivers Lien Position - 40%, or $2.8 B, of the portfolio is secured by a 1st mortgage Payments - 70% of borrowers consistently make more than required payment Borrower quality - as measured at origination by FICO score - consistent increasing trend FICO score distribution - consistent decline in low score levels Custom Score - utilized to further segment FICO eligible applications - continues to enhance predictive modeling Utilization % - Consistent with expectations, limited increase in utilization rate over 2008 based primarily on the low interest rate environment Broker Channel - Eliminated beginning in 2006 based on risk profile Customer relationship orientation - not one-off transactions CLTV - Continue to reduce the level of 90%+ financing Geography - Footprint lender with limited investor property exposure Risk Recognition Write-down to 80% of appraised value at 120 days past due Non-accrual balances represent the realizable value estimate in future periods |
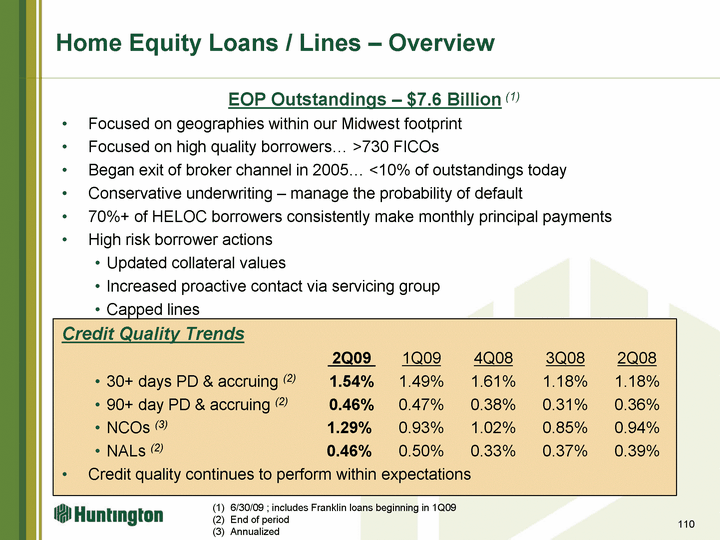
| EOP Outstandings - $7.6 Billion (1) Focused on geographies within our Midwest footprint Focused on high quality borrowers... >730 FICOs Began exit of broker channel in 2005... <10% of outstandings today Conservative underwriting - manage the probability of default 70%+ of HELOC borrowers consistently make monthly principal payments High risk borrower actions Updated collateral values Increased proactive contact via servicing group Capped lines Credit Quality Trends 2Q09 1Q09 4Q08 3Q08 2Q08 30+ days PD & accruing (2) 1.54% 1.49% 1.61% 1.18% 1.18% 90+ day PD & accruing (2) 0.46% 0.47% 0.38% 0.31% 0.36% NCOs (3) 1.29% 0.93% 1.02% 0.85% 0.94% NALs (2) 0.46% 0.50% 0.33% 0.37% 0.39% Credit quality continues to perform within expectations Home Equity Loans / Lines - Overview 110 6/30/09 ; includes Franklin loans beginning in 1Q09 End of period (3) Annualized |
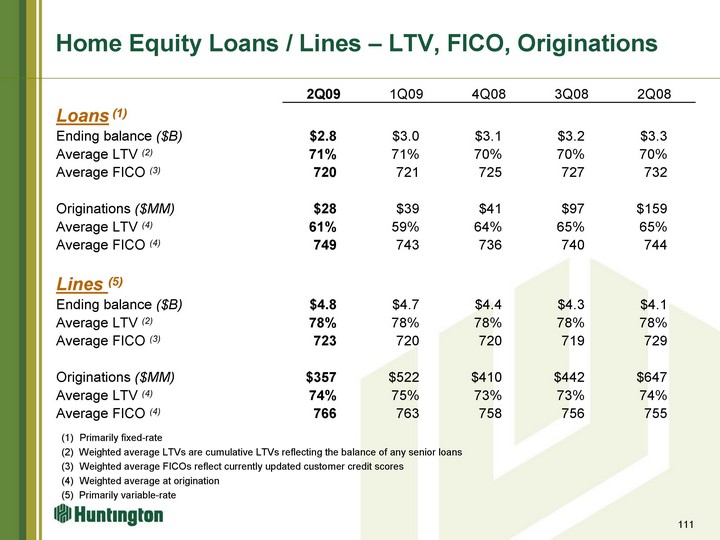
| Home Equity Loans / Lines - LTV, FICO, Originations (1) Primarily fixed-rate (2) Weighted average LTVs are cumulative LTVs reflecting the balance of any senior loans (3) Weighted average FICOs reflect currently updated customer credit scores (4) Weighted average at origination (5) Primarily variable-rate 2Q09 1Q09 4Q08 3Q08 2Q08 Loans (1) Ending balance ($B) $2.8 $3.0 $3.1 $3.2 $3.3 Average LTV (2) 71% 71% 70% 70% 70% Average FICO (3) 720 721 725 727 732 Originations ($MM) $28 $39 $41 $97 $159 Average LTV (4) 61% 59% 64% 65% 65% Average FICO (4) 749 743 736 740 744 Lines (5) Ending balance ($B) $4.8 $4.7 $4.4 $4.3 $4.1 Average LTV (2) 78% 78% 78% 78% 78% Average FICO (3) 723 720 720 719 729 Originations ($MM) $357 $522 $410 $442 $647 Average LTV (4) 74% 75% 73% 73% 74% Average FICO (4) 766 763 758 756 755 111 |
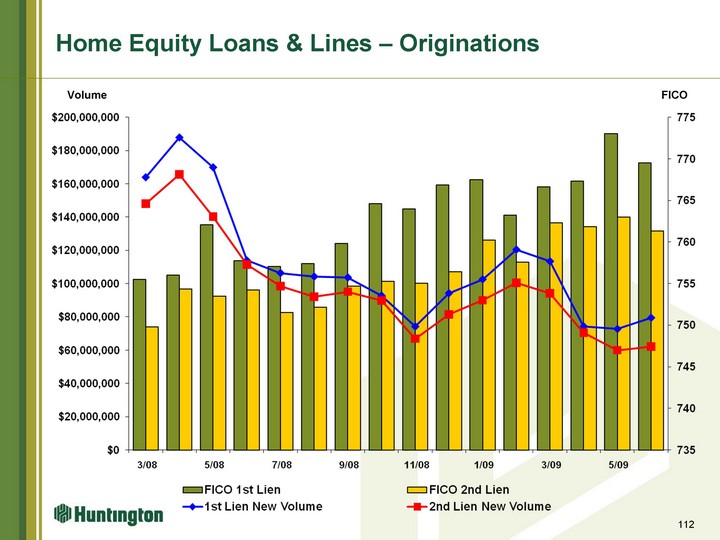
| Home Equity Loans & Lines - Originations 112 Volume FICO |
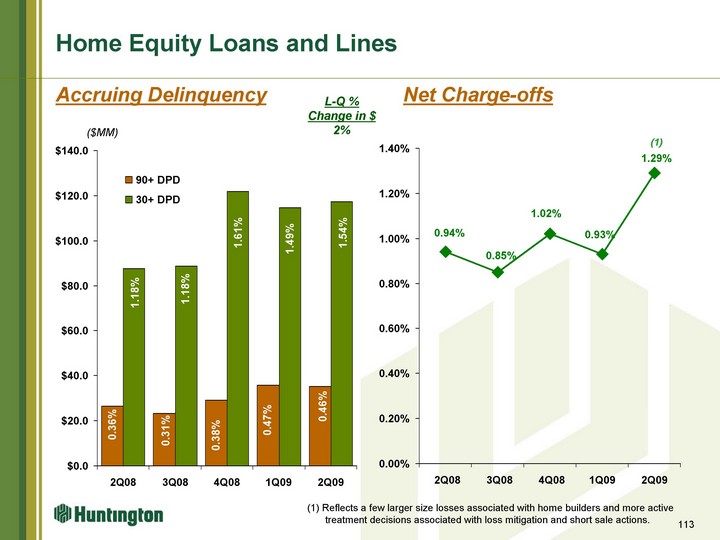
| Home Equity Loans and Lines Net Charge-offs 113 0.36% 0.31% 0.38% 0.47% 0.46% 1.18% 1.18% 1.61% 1.49% 1.54% ($MM) L-Q % Change in $ 2% Accruing Delinquency (1) Reflects a few larger size losses associated with home builders and more active treatment decisions associated with loss mitigation and short sale actions. (1) |
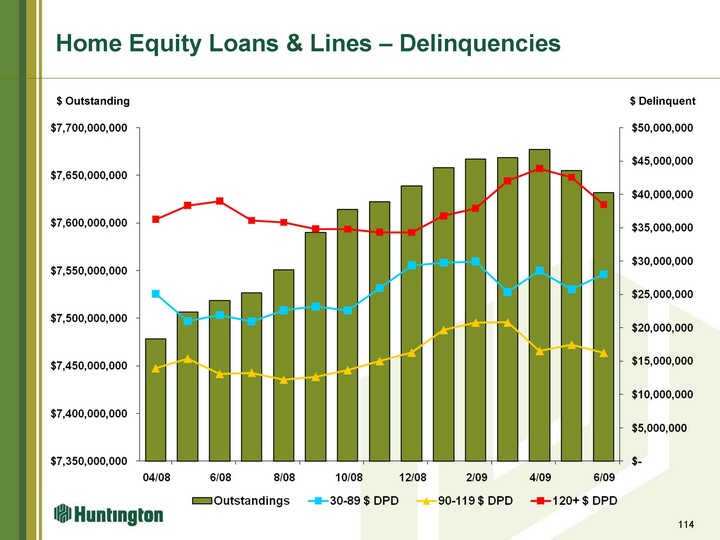
| Home Equity Loans & Lines - Delinquencies 114 $ Delinquent $ Outstanding |
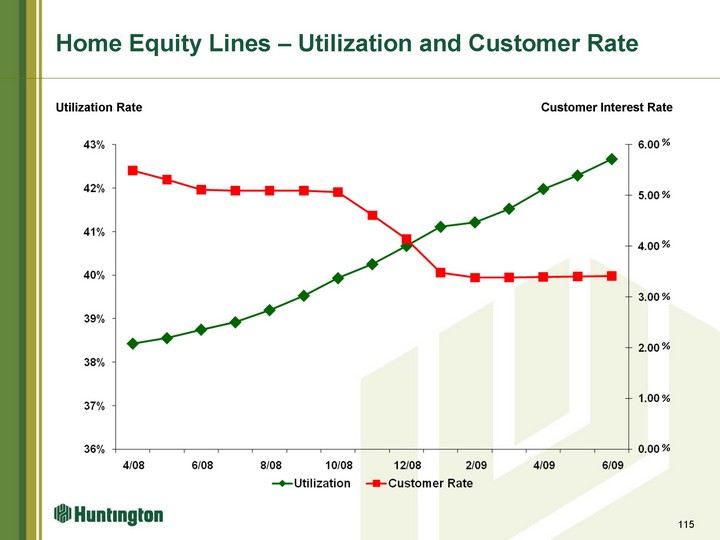
| Home Equity Lines - Utilization and Customer Rate 115 Utilization Rate Customer Interest Rate % % % % % % % |
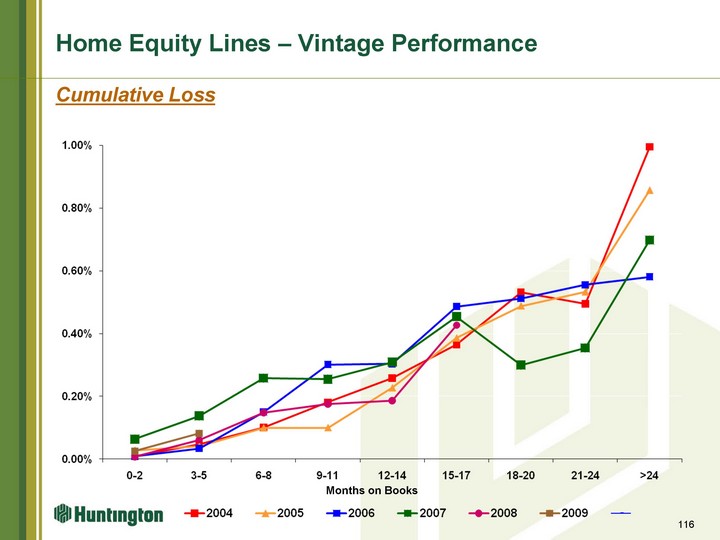
| Home Equity Lines - Vintage Performance 116 Months on Books Cumulative Loss |
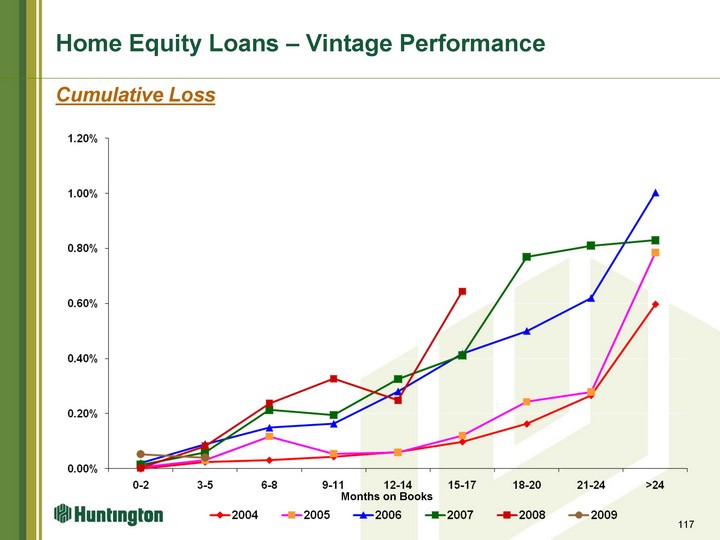
| Home Equity Loans - Vintage Performance 117 Cumulative Loss Months on Books |

| Residential Mortgages 118 |
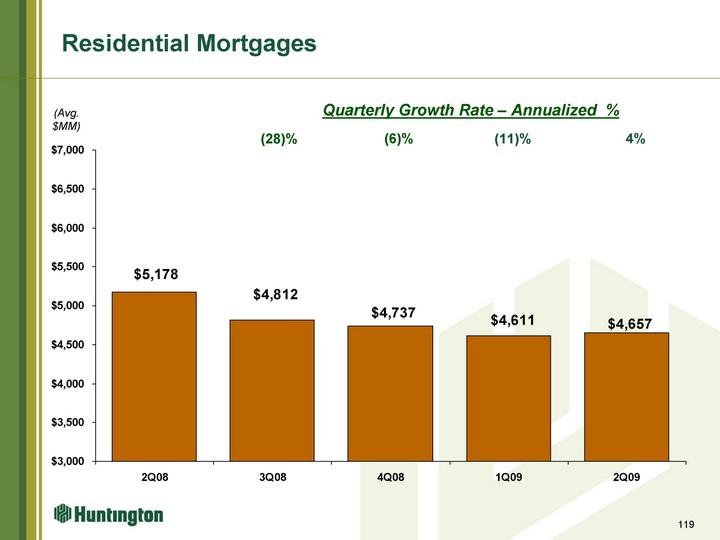
| 1Q03 2Q03 3Q03 4Q03 1Q04 2Q04 3Q04 4Q04 1Q05 2Q05 3Q05 4Q05 1Q06 2Q06 3Q06 4Q06 1Q07 2Q07 3Q07 4Q07 1Q08 2Q08 3Q08 4Q08 1Q09 2Q09 HBAN 1819 1870 2075 2501 2674 2986 3484 3695 3919 4080 4157 4165 4306 4629 4748 4635 4496 4351 4344 5437 5351 5178 4812 4737 4611 4657 1112 Residential Mortgages (Avg. $MM) (6)% Quarterly Growth Rate - Annualized % (11)% (28)% 119 4% |
| 120 Residential Mortgage - Credit Risk Management Strategies Performance Drivers Standard products and borrower quality - as measured at origination by Secondary market underwriting FICO score - consistent increasing trend FICO score distribution - consistent decline in low score levels Non-standard product structures $625 million of Interest Only loans... targeted within executive relocation activities... continues to perform well $410 million of Alt-A mortgages... exited in 2007... represents <10% of total residential portfolio with majority of cumulative losses likely recognized within 24 months. Decision type - Significantly reduced the level of underwriter overrule decisions Geography - Primarily a footprint lender Risk Recognition Updated appraisals at regular intervals Loss mitigation focus |
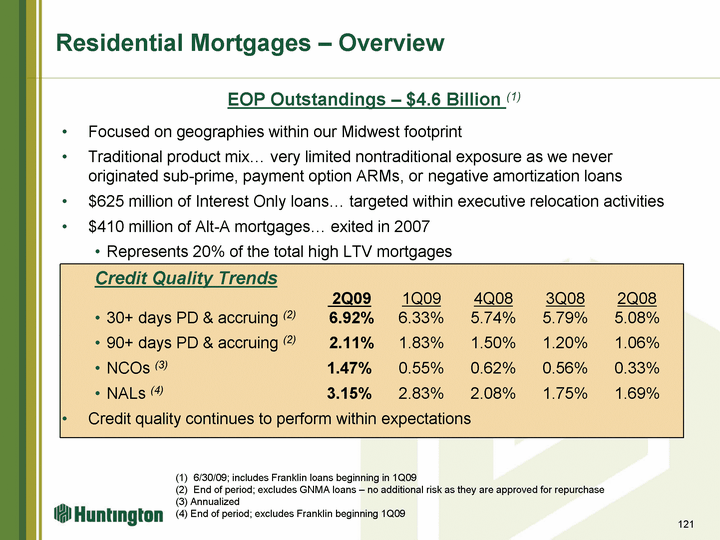
| EOP Outstandings - $4.6 Billion (1) Focused on geographies within our Midwest footprint Traditional product mix... very limited nontraditional exposure as we never originated sub-prime, payment option ARMs, or negative amortization loans $625 million of Interest Only loans... targeted within executive relocation activities $410 million of Alt-A mortgages... exited in 2007 Represents 20% of the total high LTV mortgages Credit Quality Trends 2Q09 1Q09 4Q08 3Q08 2Q08 30+ days PD & accruing (2) 6.92% 6.33% 5.74% 5.79% 5.08% 90+ days PD & accruing (2) 2.11% 1.83% 1.50% 1.20% 1.06% NCOs (3) 1.47% 0.55% 0.62% 0.56% 0.33% NALs (4) 3.15% 2.83% 2.08% 1.75% 1.69% Credit quality continues to perform within expectations Residential Mortgages - Overview 121 (1) 6/30/09; includes Franklin loans beginning in 1Q09 (2) End of period; excludes GNMA loans - no additional risk as they are approved for repurchase (3) Annualized (4) End of period; excludes Franklin beginning 1Q09 |
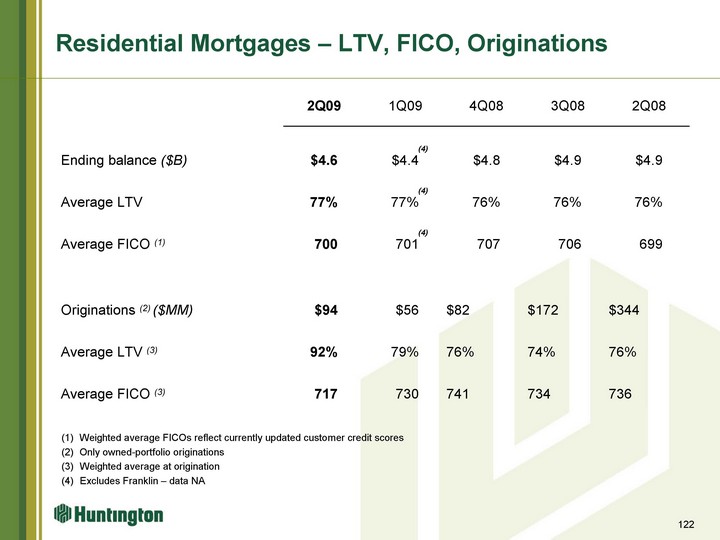
| Residential Mortgages - LTV, FICO, Originations (1) Weighted average FICOs reflect currently updated customer credit scores (2) Only owned-portfolio originations Weighted average at origination Excludes Franklin - data NA 2Q09 1Q09 4Q08 3Q08 2Q08 Ending balance ($B) $4.6 $4.4 $4.8 $4.9 $4.9 Average LTV 77% 77% 76% 76% 76% Average FICO (1) 700 701 707 706 699 Originations (2) ($MM) $94 $56 $82 $172 $344 Average LTV (3) 92% 79% 76% 74% 76% Average FICO (3) 717 730 741 734 736 122 (4) (4) (4) |
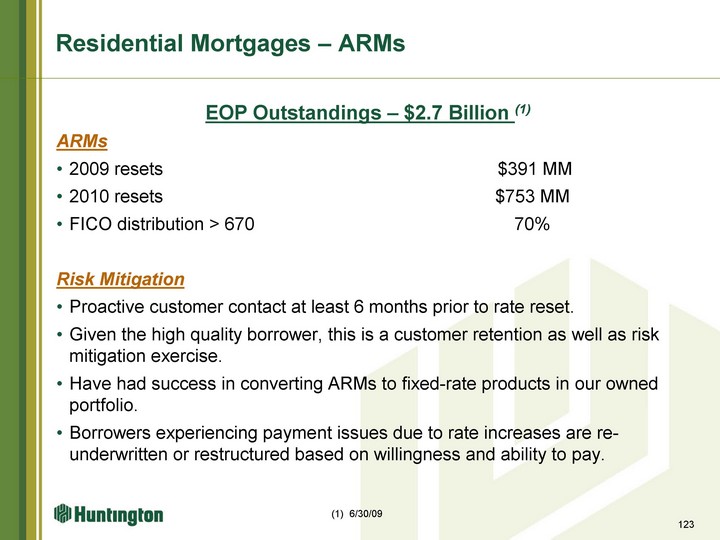
| Residential Mortgages - ARMs EOP Outstandings - $2.7 Billion (1) ARMs 2009 resets $391 MM 2010 resets $753 MM FICO distribution > 670 70% Risk Mitigation Proactive customer contact at least 6 months prior to rate reset. Given the high quality borrower, this is a customer retention as well as risk mitigation exercise. Have had success in converting ARMs to fixed-rate products in our owned portfolio. Borrowers experiencing payment issues due to rate increases are re- underwritten or restructured based on willingness and ability to pay. g 123 (1) 6/30/09 |
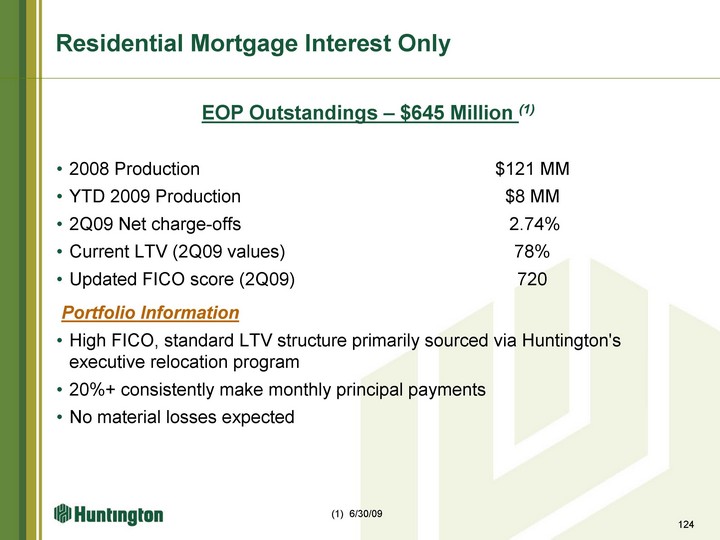
| Residential Mortgage Interest Only EOP Outstandings - $645 Million (1) 2008 Production $121 MM YTD 2009 Production $8 MM 2Q09 Net charge-offs 2.74% Current LTV (2Q09 values) 78% Updated FICO score (2Q09) 720 Portfolio Information High FICO, standard LTV structure primarily sourced via Huntington's executive relocation program 20%+ consistently make monthly principal payments No material losses expected 124 (1) 6/30/09 |
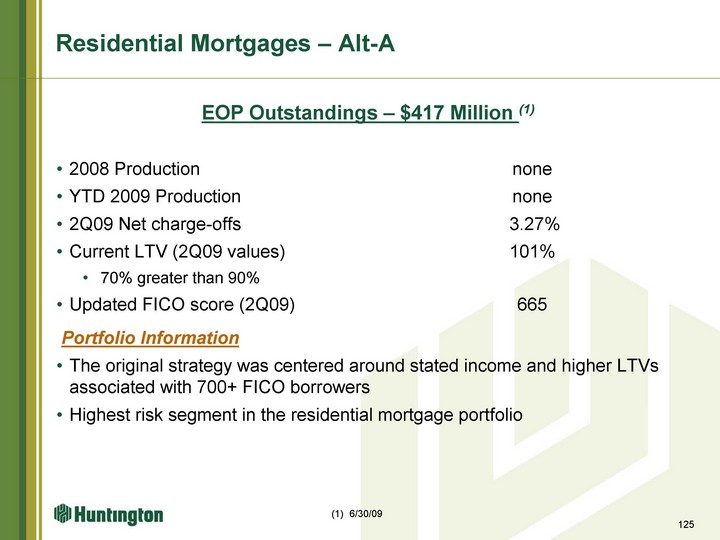
| Residential Mortgages - Alt-A EOP Outstandings - $417 Million (1) 2008 Production none YTD 2009 Production none 2Q09 Net charge-offs 3.27% Current LTV (2Q09 values) 101% 70% greater than 90% Updated FICO score (2Q09) 665 Portfolio Information The original strategy was centered around stated income and higher LTVs associated with 700+ FICO borrowers Highest risk segment in the residential mortgage portfolio 125 (1) 6/30/09 |
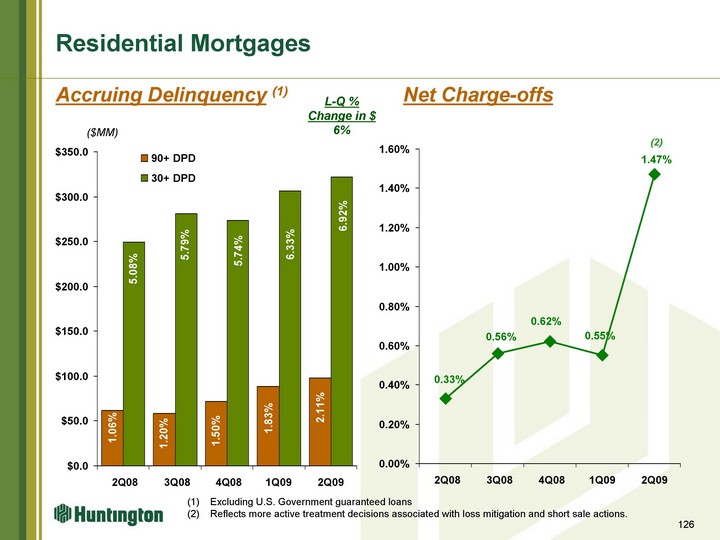
| Residential Mortgages Net Charge-offs 126 1.06% 1.20% 1.50% 1.83% 2.11% 5.08% 5.79% 5.74% 6.33% 6.92% ($MM) L-Q % Change in $ 6% Accruing Delinquency (1) Excluding U.S. Government guaranteed loans Reflects more active treatment decisions associated with loss mitigation and short sale actions. (2) |
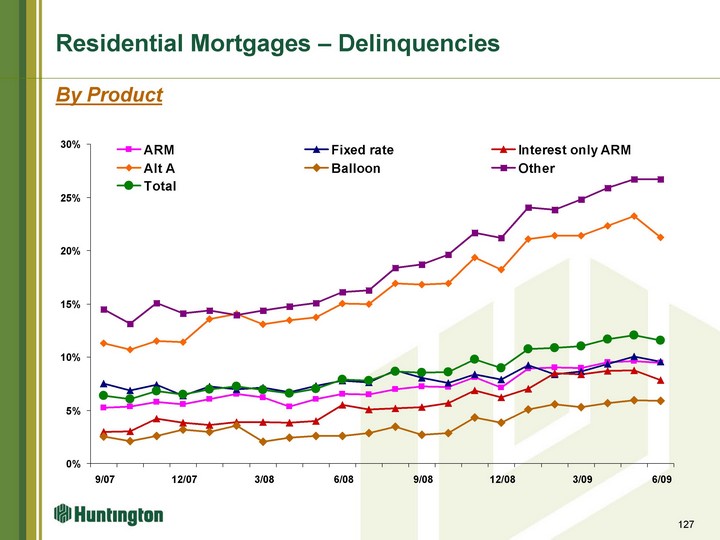
| Residential Mortgages - Delinquencies 127 MONTH ARM Fixed rate Interest only ARM Alt A Balloon Other Total 7/07 0.0384 0.0564 0.0293 0.0932 0.0261 0.1371 0.0533 8/07 0.0406 0.0553 0.0355 0.0962 0.0262 0.139 0.0556 9/07 0.0524 0.0751 0.0299 0.1129 0.0255 0.1451 0.0638 10/07 0.0535 0.0684 0.0303 0.1071 0.0211 0.1315 0.0608 11/07 0.0577 0.0738 0.0423 0.115 0.0257 0.1507 0.068 12/07 0.0557 0.064 0.0384 0.1142 0.0319 0.1412 0.0646 1/08 0.0607 0.0724 0.036 0.1359 0.0299 0.1437 0.07 2/08 0.0654 0.0695 0.0391 0.1404 0.0356 0.1394 0.0724 3/08 0.0622 0.0715 0.0391 0.131 0.0208 0.1436 0.0694 4/08 0.0537 0.0671 0.0383 0.1346 0.0241 0.1474 0.066 5/08 0.0607 0.0729 0.0402 0.1374 0.0262 0.151 0.0705 6/08 0.0652 0.078 0.0554 0.1502 0.0259 0.1611 0.079 7/08 0.0649 0.0762 0.0506 0.1497 0.0287 0.1628 0.0781 8/08 0.0695 0.0875 0.0519 0.1694 0.0348 0.1839 0.0864 9/08 0.0724 0.0805 0.0532 0.1683 0.0271 0.1871 0.0854 10/08 0.0718 0.0757 0.057 0.1692 0.0286 0.1964 0.0859 11/08 0.0809 0.0836 0.0685 0.1937 0.0433 0.2169 0.0981 12/08 0.0712 0.0787 0.0621 0.1819 0.0384 0.2119 0.09 1/09 0.089 0.0927 0.0703 0.2106 0.0508 0.2408 0.1073 2/09 0.0902 0.0837 0.0851 0.2139 0.0556 0.2383 0.1088 3/09 0.0896 0.0864 0.0836 0.2142 0.053 0.2482 0.1104 4/09 0.0954 0.0935 0.087 0.2231 0.0567 0.2589 0.1167 5/09 0.0962 0.1008 0.0876 0.2324 0.0596 0.2668 0.1205 6/09 0.0947 0.0957 0.0786 0.2123 0.059 0.2669 0.1157 By Product |
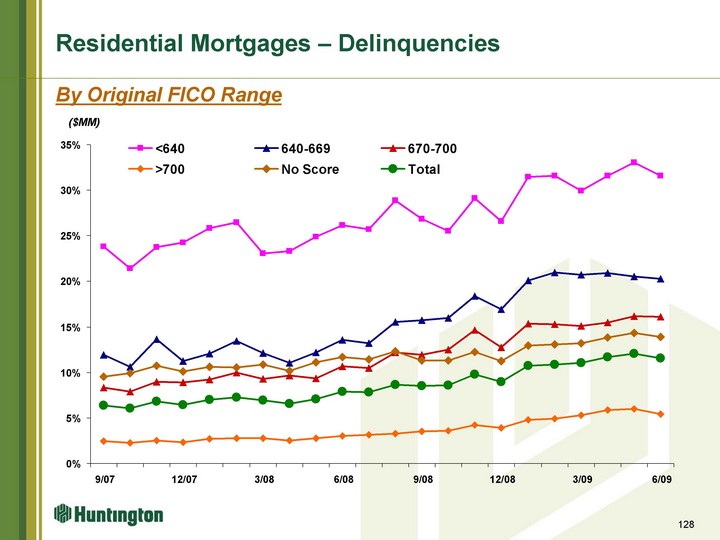
| Residential Mortgages - Delinquencies 128 MONTH <640 640-669 670-700 >700 No Score Total 7/07 0.226 0.1057 0.0703 0.023 0.1117 0.0533 8/07 0.2158 0.1092 0.0766 0.0224 0.1537 0.0556 9/07 0.2384 0.1191 0.0834 0.0249 0.0954 0.0638 10/07 0.2139 0.1063 0.0791 0.023 0.0994 0.0608 11/07 0.2374 0.1366 0.0897 0.025 0.1075 0.068 12/07 0.2427 0.1127 0.0889 0.0231 0.1009 0.0646 1/08 0.2581 0.1208 0.0924 0.0274 0.1063 0.07 2/08 0.2644 0.1345 0.0999 0.0277 0.1057 0.0724 3/08 0.2304 0.1215 0.0931 0.0281 0.1089 0.0694 4/08 0.233 0.1108 0.0968 0.025 0.1014 0.066 5/08 0.2487 0.1218 0.0935 0.0281 0.1113 0.0705 6/08 0.2618 0.1357 0.1065 0.0306 0.1171 0.079 7/08 0.2569 0.1321 0.1047 0.0314 0.1145 0.0781 8/08 0.2886 0.1553 0.1218 0.0326 0.1231 0.0864 9/08 0.2684 0.1574 0.1194 0.0352 0.1133 0.0854 10/08 0.2553 0.1598 0.1251 0.0361 0.1132 0.0859 11/08 0.2912 0.1841 0.1465 0.0425 0.1227 0.0981 12/08 0.2657 0.169 0.1276 0.0394 0.1124 0.09 1/09 0.3149 0.2012 0.1533 0.0483 0.1297 0.1073 2/09 0.3162 0.2097 0.1528 0.0492 0.1307 0.1088 3/09 0.2997 0.2075 0.1508 0.0529 0.1319 0.1104 4/09 0.3158 0.2088 0.1546 0.0585 0.1384 0.1167 5/09 0.3304 0.2052 0.1616 0.0599 0.1434 0.1205 6/09 0.316 0.2027 0.1614 0.0543 0.1393 0.1157 By Original FICO Range ($MM) |

| Other Consumer Loans 129 |
| EOP Outstandings - $0.7 Billion (1) 80% collateralized Autos, untitled vehicles, small boats, mobile homes and other miscellaneous Primarily for existing customers Performed within expectations over the past year though varies by collateral type Other Consumer Loans 130 (1) 6/30/09 |

| 131 Franklin Credit Relationship |
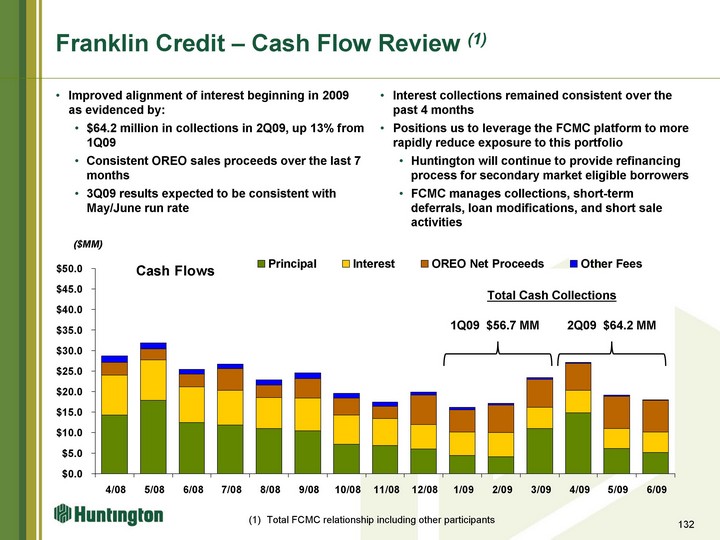
| Improved alignment of interest beginning in 2009 as evidenced by: $64.2 million in collections in 2Q09, up 13% from 1Q09 Consistent OREO sales proceeds over the last 7 months 3Q09 results expected to be consistent with May/June run rate Interest collections remained consistent over the past 4 months Positions us to leverage the FCMC platform to more rapidly reduce exposure to this portfolio Huntington will continue to provide refinancing process for secondary market eligible borrowers FCMC manages collections, short-term deferrals, loan modifications, and short sale activities Franklin Credit - Cash Flow Review (1) 132 1/08 2/08 3/08 4/08 5/08 6/08 7/08 8/08 9/08 10/08 11/08 12/08 1/09 2/09 3/09 4/09 5/09 6/09 Principal 15.7 15.4 15.2 14.3 17.8 12.4 11.8 11 10.4 7.1 6.9 6 4.4 4.2 11 14.8 6.1 5.1 Interest 11.4 10.9 10.9 9.7 9.9 8.7 8.5 7.6 8 7.2 6.5 6 5.8 5.8 5.2 5.5 4.9 5 OREO Net Proceeds 1.6 2.3 3.2 3.1 2.7 3.2 5.3 3 4.8 4.2 3.1 7.2 5.4 6.7 6.8 6.5 7.8 7.8 Other Fees 1.3 1.2 1.2 1.6 1.5 1.1 1.1 1.2 1.4 1.1 1 0.6 0.5 0.4 0.5 0.3 0.4 0.1 Required P&I & SG&A Expense 19.4 19.3 19.6 19.7 18.9 19.1 20.7 18.6 18.6 19.5 20.3 19.4 19.4 19.4 19.4 19.4 19.4 19.4 ($MM) (1) Total FCMC relationship including other participants 132 2Q09 $64.2 MM 1Q09 $56.7 MM Total Cash Collections |

| Credit Quality Review 133 |
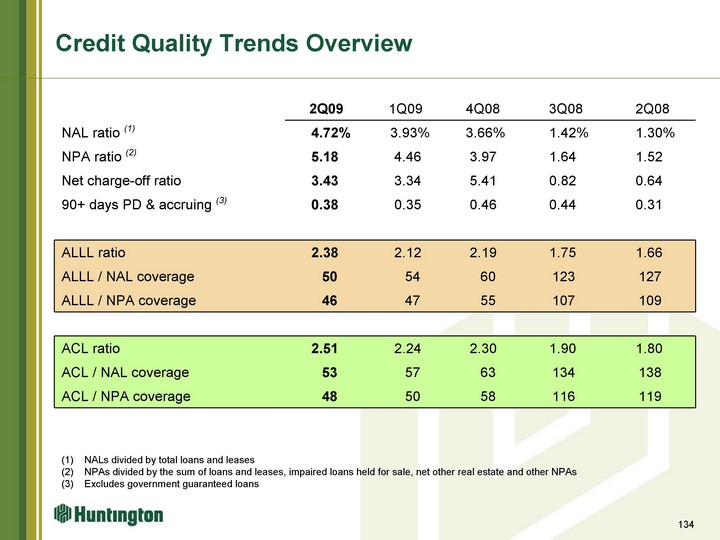
| Credit Quality Trends Overview 2Q09 1Q09 4Q08 3Q08 2Q08 NAL ratio (1) 4.72% 3.93% 3.66% 1.42% 1.30% NPA ratio (2) 5.18 4.46 3.97 1.64 1.52 Net charge-off ratio 3.43 3.34 5.41 0.82 0.64 90+ days PD & accruing (3) 0.38 0.35 0.46 0.44 0.31 ALLL ratio 2.38 2.12 2.19 1.75 1.66 ALLL / NAL coverage 50 54 60 123 127 ALLL / NPA coverage 46 47 55 107 109 ACL ratio 2.51 2.24 2.30 1.90 1.80 ACL / NAL coverage 53 57 63 134 138 ACL / NPA coverage 48 50 58 116 119 (1) NALs divided by total loans and leases (2) NPAs divided by the sum of loans and leases, impaired loans held for sale, net other real estate and other NPAs (3) Excludes government guaranteed loans 134 |
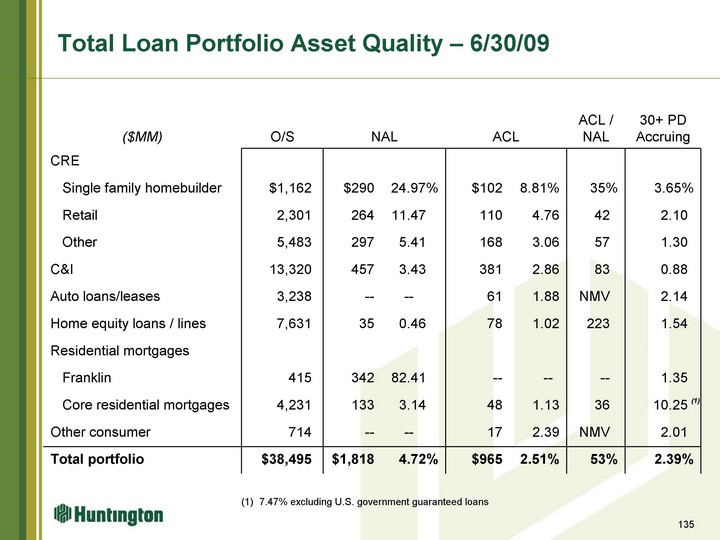
| 135 135 Total Loan Portfolio Asset Quality - 6/30/09 ($MM) O/S NAL NAL ACL ACL ACL / NAL 30+ PD Accruing CRE Single family homebuilder $1,162 $290 24.97% $102 8.81% 35% 3.65% Retail 2,301 264 11.47 110 4.76 42 2.10 Other 5,483 297 5.41 168 3.06 57 1.30 C&I 13,320 457 3.43 381 2.86 83 0.88 Auto loans/leases 3,238 -- -- 61 1.88 NMV 2.14 Home equity loans / lines 7,631 35 0.46 78 1.02 223 1.54 Residential mortgages Franklin 415 342 82.41 -- -- -- 1.35 Core residential mortgages 4,231 133 3.14 48 1.13 36 10.25 Other consumer 714 -- -- 17 2.39 NMV 2.01 Total portfolio $38,495 $1,818 4.72% $965 2.51% 53% 2.39% (1) 7.47% excluding U.S. government guaranteed loans (1) |
| Key Loan Portfolio Credit Quality Metrics 136 |
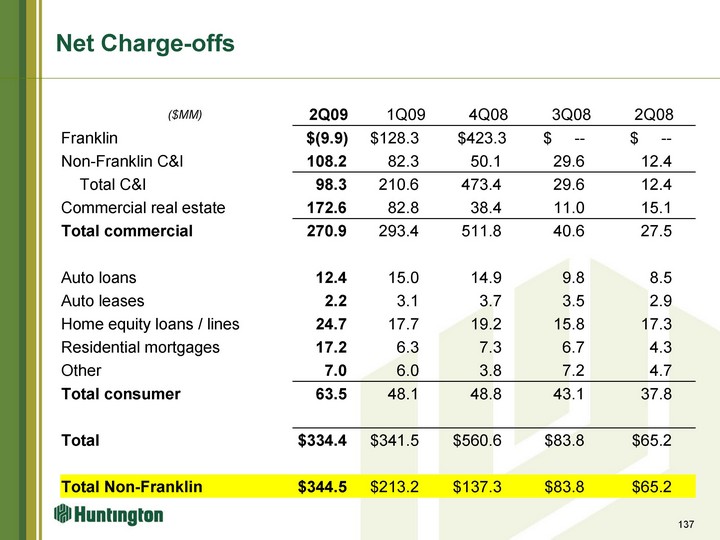
| Net Charge-offs ($MM) 2Q09 1Q09 4Q08 3Q08 2Q08 Franklin $(9.9) $128.3 $423.3 $ -- $ -- Non-Franklin C&I 108.2 82.3 50.1 29.6 12.4 Total C&I 98.3 210.6 473.4 29.6 12.4 Commercial real estate 172.6 82.8 38.4 11.0 15.1 Total commercial 270.9 293.4 511.8 40.6 27.5 Auto loans 12.4 15.0 14.9 9.8 8.5 Auto leases 2.2 3.1 3.7 3.5 2.9 Home equity loans / lines 24.7 17.7 19.2 15.8 17.3 Residential mortgages 17.2 6.3 7.3 6.7 4.3 Other 7.0 6.0 3.8 7.2 4.7 Total consumer 63.5 48.1 48.8 43.1 37.8 Total $334.4 $341.5 $560.6 $83.8 $65.2 Total Non-Franklin $344.5 $213.2 $137.3 $83.8 $65.2 137 |
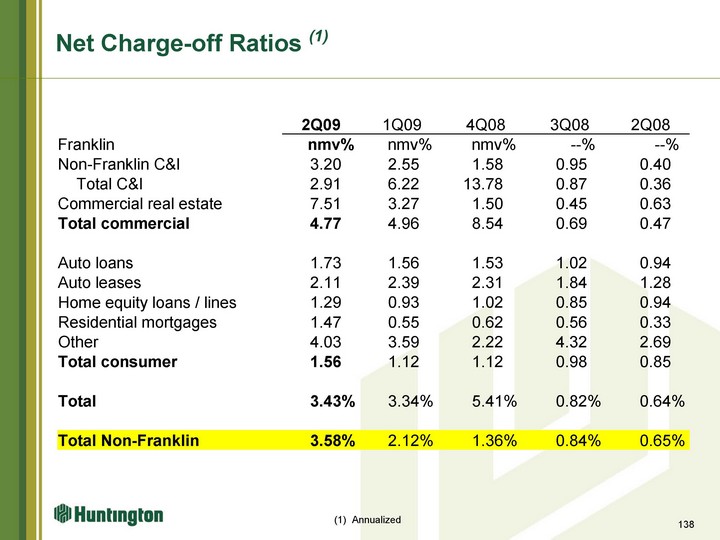
| Net Charge-off Ratios (1) 2Q09 1Q09 4Q08 3Q08 2Q08 Franklin nmv% nmv% nmv% --% --% Non-Franklin C&I 3.20 2.55 1.58 0.95 0.40 Total C&I 2.91 6.22 13.78 0.87 0.36 Commercial real estate 7.51 3.27 1.50 0.45 0.63 Total commercial 4.77 4.96 8.54 0.69 0.47 Auto loans 1.73 1.56 1.53 1.02 0.94 Auto leases 2.11 2.39 2.31 1.84 1.28 Home equity loans / lines 1.29 0.93 1.02 0.85 0.94 Residential mortgages 1.47 0.55 0.62 0.56 0.33 Other 4.03 3.59 2.22 4.32 2.69 Total consumer 1.56 1.12 1.12 0.98 0.85 Total 3.43% 3.34% 5.41% 0.82% 0.64% Total Non-Franklin 3.58% 2.12% 1.36% 0.84% 0.65% (1) Annualized 138 |
| Nonaccrual Loans and Nonperforming Assets 139 |
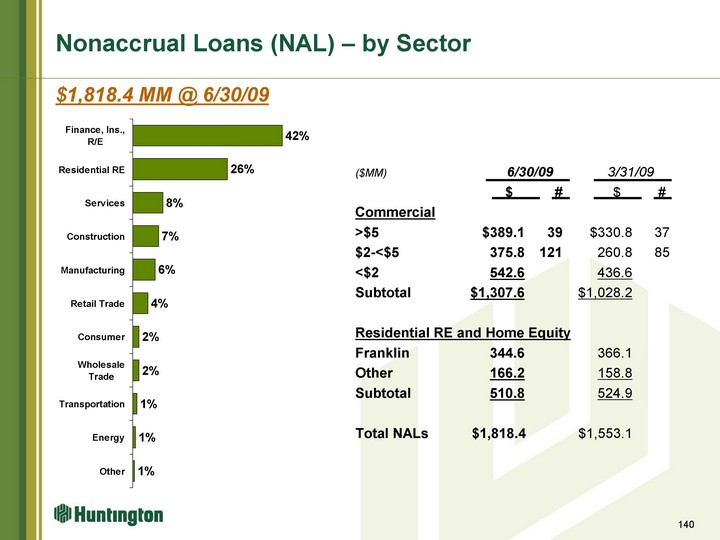
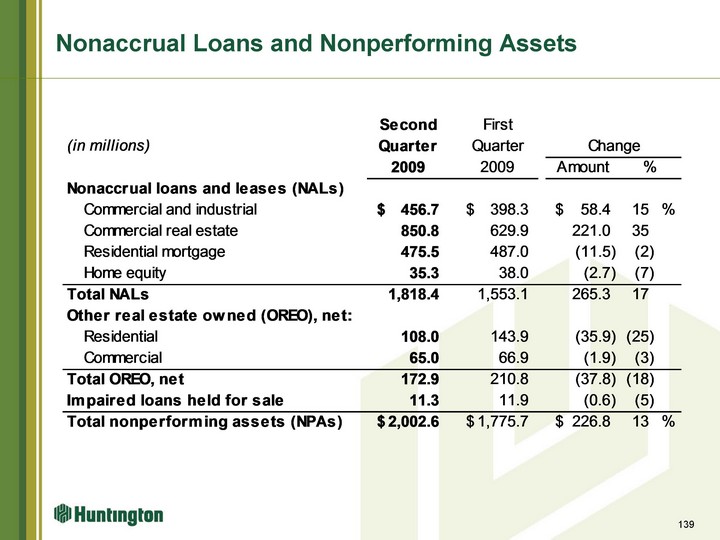
| ($MM) 6/30/09 3/31/09 $ # $ # Commercial >$5 $389.1 39 $330.8 37 $2-<$5 375.8 121 260.8 85 <$2 542.6 436.6 Subtotal $1,307.6 $1,028.2 Residential RE and Home Equity Franklin 344.6 366.1 Other 166.2 158.8 Subtotal 510.8 524.9 Total NALs $1,818.4 $1,553.1 Nonaccrual Loans (NAL) - by Sector $1,818.4 MM @ 6/30/09 Other 0.005 Energy 0.007 Transportation 0.012 Wholesale Trade 0.018 Consumer 0.018 Retail Trade 0.042 Manufacturing 0.062 Construction 0.073 Services 0.084 Residential RE 0.263 Finance, Ins., R/E 0.417 140 |
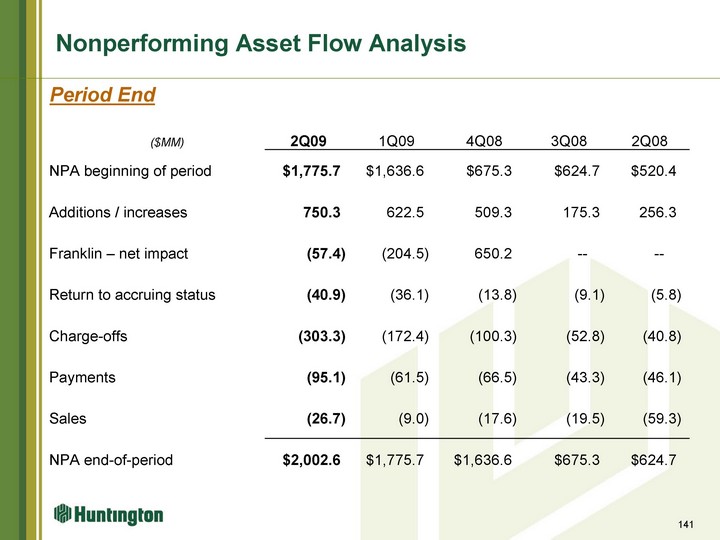
| Nonperforming Asset Flow Analysis ($MM) 2Q09 1Q09 4Q08 3Q08 2Q08 NPA beginning of period $1,775.7 $1,636.6 $675.3 $624.7 $520.4 Additions / increases 750.3 622.5 509.3 175.3 256.3 Franklin - net impact (57.4) (204.5) 650.2 -- -- Return to accruing status (40.9) (36.1) (13.8) (9.1) (5.8) Charge-offs (303.3) (172.4) (100.3) (52.8) (40.8) Payments (95.1) (61.5) (66.5) (43.3) (46.1) Sales (26.7) (9.0) (17.6) (19.5) (59.3) NPA end-of-period $2,002.6 $1,775.7 $1,636.6 $675.3 $624.7 141 Period End |
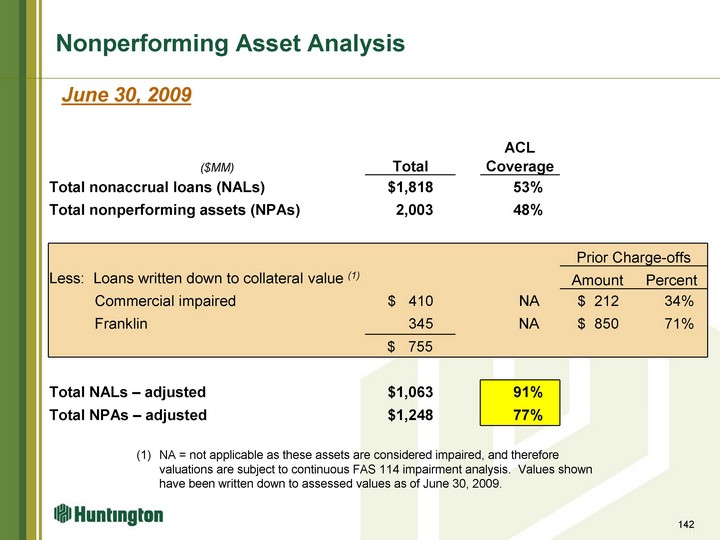
| Nonperforming Asset Analysis 142 ACL ($MM) Total Coverage Total nonaccrual loans (NALs) $1,818 53% Total nonperforming assets (NPAs) 2,003 48% Prior Charge-offs Prior Charge-offs Less: Loans written down to collateral value (1) Amount Percent Commercial impaired $ 410 NA $ 212 34% Franklin 345 NA $ 850 71% $ 755 Total NALs - adjusted $1,063 91% Total NPAs - adjusted $1,248 77% NA = not applicable as these assets are considered impaired, and therefore valuations are subject to continuous FAS 114 impairment analysis. Values shown have been written down to assessed values as of June 30, 2009. June 30, 2009 |
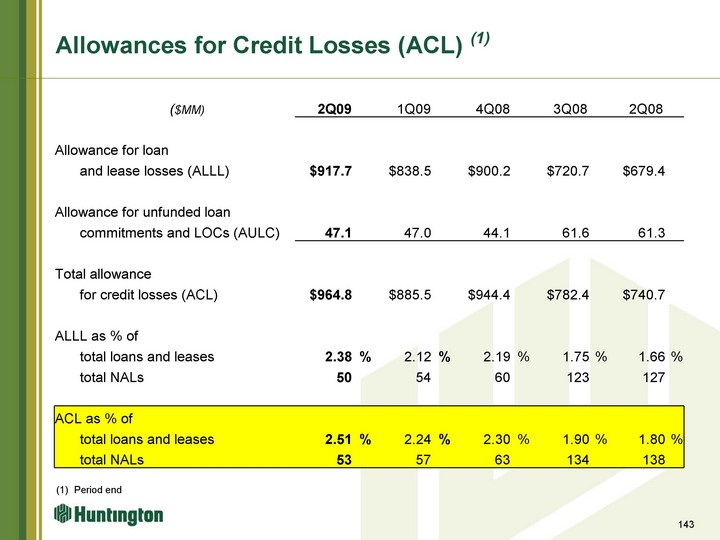
| Allowances for Credit Losses (ACL) (1) ($MM) 2Q09 2Q09 1Q09 1Q09 4Q08 4Q08 3Q08 3Q08 2Q08 2Q08 Allowance for loan Allowance for loan and lease losses (ALLL) $917.7 $838.5 $900.2 $720.7 $679.4 Allowance for unfunded loan Allowance for unfunded loan commitments and LOCs (AULC) 47.1 47.0 44.1 61.6 61.3 Total allowance Total allowance for credit losses (ACL) $964.8 $885.5 $944.4 $782.4 $740.7 ALLL as % of ALLL as % of total loans and leases 2.38 % 2.12 % 2.19 % 1.75 % 1.66 % total NALs 50 54 60 123 127 ACL as % of ACL as % of total loans and leases 2.51 % 2.24 % 2.30 % 1.90 % 1.80 % total NALs 53 57 63 134 138 (1) Period end 143 |
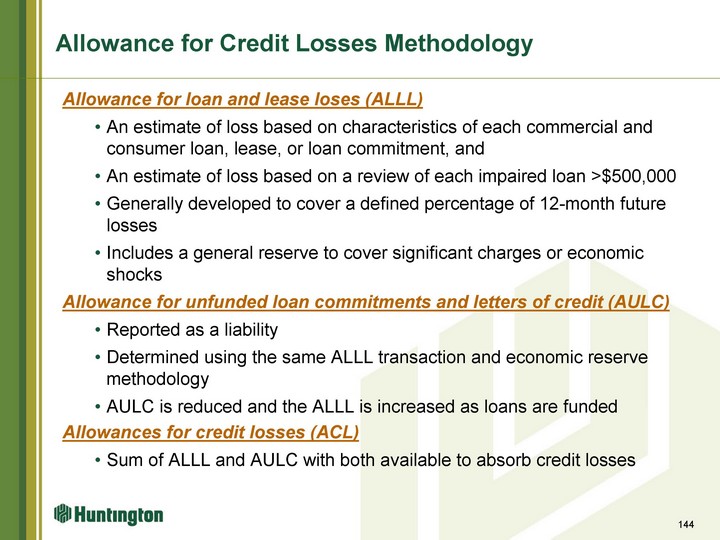
| Allowance for Credit Losses Methodology Allowance for loan and lease loses (ALLL) An estimate of loss based on characteristics of each commercial and consumer loan, lease, or loan commitment, and An estimate of loss based on a review of each impaired loan >$500,000 Generally developed to cover a defined percentage of 12-month future losses Includes a general reserve to cover significant charges or economic shocks Allowance for unfunded loan commitments and letters of credit (AULC) Reported as a liability Determined using the same ALLL transaction and economic reserve methodology AULC is reduced and the ALLL is increased as loans are funded Allowances for credit losses (ACL) Sum of ALLL and AULC with both available to absorb credit losses 144 |

| Illustrative SCAP Analysis - 5/20/09 145 |
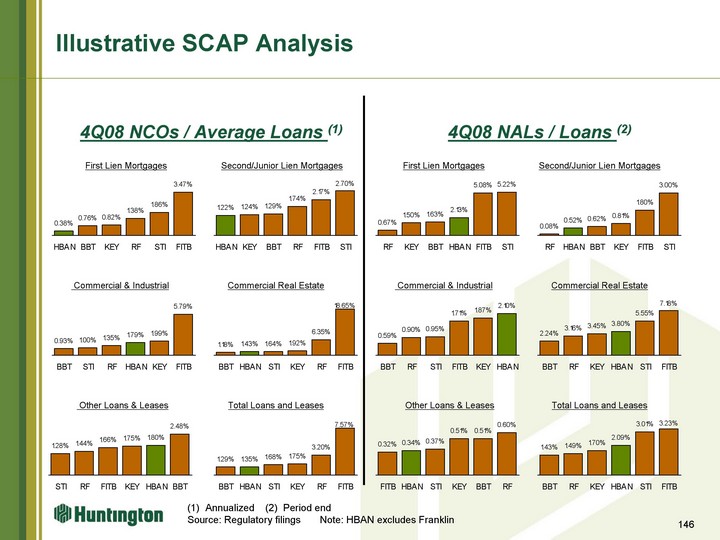
| HBAN 0.0038 BBT 0.0076 KEY 0.0082 RF 0.0138 STI 0.0186 FITB 0.0347 HBAN 0.0122 KEY 0.0124 BBT 0.0129 RF 0.0174 FITB 0.0217 STI 0.027 RF 0.0067 KEY 0.015 BBT 0.0163 HBAN 0.0213 FITB 0.0508 STI 0.0522 RF 0.0008 HBAN 0.0052 BBT 0.0062 KEY 0.0081 FITB 0.018 STI 0.03 BBT 0.0093 STI 0.01 RF 0.0135 HBAN 0.0179 KEY 0.0199 FITB 0.0579 BBT 0.0118 HBAN 0.0143 STI 0.0164 KEY 0.0192 RF 0.0635 FITB 0.1865 BBT 0.0059 RF 0.009 STI 0.0095 FITB 0.0171 KEY 0.0187 HBAN 0.021 BBT 0.0224 RF 0.0316 KEY 0.0345 HBAN 0.038 STI 0.0555 FITB 0.0718 STI 0.0128 RF 0.0144 FITB 0.0166 KEY 0.0175 HBAN 0.018 BBT 0.0248 FITB 0.0032 HBAN 0.0034 STI 0.0037 KEY 0.0051 BBT 0.0051 RF 0.006 146 Illustrative SCAP Analysis Annualized (2) Period end Source: Regulatory filings Note: HBAN excludes Franklin First Lien Mortgages Second/Junior Lien Mortgages First Lien Mortgages Second/Junior Lien Mortgages Commercial & Industrial Commercial Real Estate Commercial & Industrial Commercial Real Estate Other Loans & Leases Other Loans & Leases 4Q08 NALs / Loans (2) 4Q08 NCOs / Average Loans (1) BBT 0.0129 HBAN 0.0135 STI 0.0168 KEY 0.0175 RF 0.032 FITB 0.0757 BBT 0.0143 RF 0.0149 KEY 0.017 HBAN 0.0209 STI 0.0301 FITB 0.0323 Total Loans and Leases Total Loans and Leases |
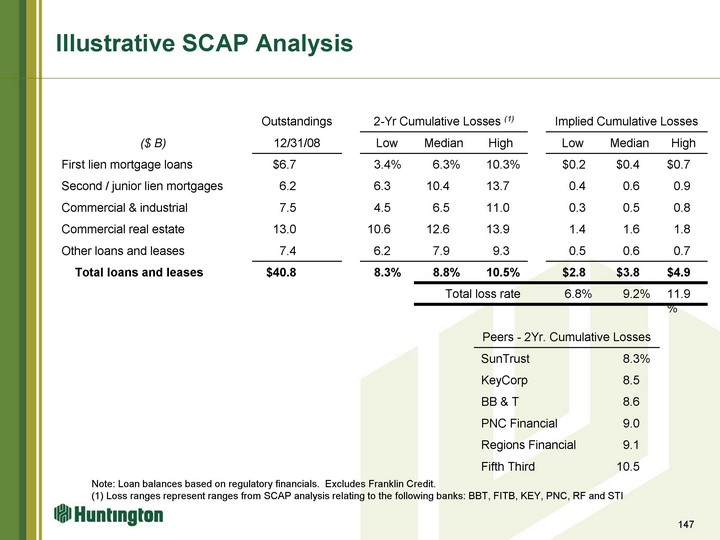
| 147 Illustrative SCAP Analysis Note: Loan balances based on regulatory financials. Excludes Franklin Credit. (1) Loss ranges represent ranges from SCAP analysis relating to the following banks: BBT, FITB, KEY, PNC, RF and STI Outstandings 2-Yr Cumulative Losses (1) 2-Yr Cumulative Losses (1) 2-Yr Cumulative Losses (1) Implied Cumulative Losses Implied Cumulative Losses Implied Cumulative Losses ($ B) 12/31/08 Low Median High Low Median High First lien mortgage loans $6.7 3.4% 6.3% 10.3% $0.2 $0.4 $0.7 Second / junior lien mortgages 6.2 6.3 10.4 13.7 0.4 0.6 0.9 Commercial & industrial 7.5 4.5 6.5 11.0 0.3 0.5 0.8 Commercial real estate 13.0 10.6 12.6 13.9 1.4 1.6 1.8 Other loans and leases 7.4 6.2 7.9 9.3 0.5 0.6 0.7 Total loans and leases $40.8 8.3% 8.8% 10.5% $2.8 $3.8 $4.9 Total loss rate Total loss rate 6.8% 9.2% 11.9% Peers - 2Yr. Cumulative Losses Peers - 2Yr. Cumulative Losses Peers - 2Yr. Cumulative Losses Peers - 2Yr. Cumulative Losses SunTrust SunTrust SunTrust 8.3% KeyCorp KeyCorp KeyCorp 8.5 BB & T BB & T BB & T 8.6 PNC Financial PNC Financial PNC Financial 9.0 Regions Financial Regions Financial Regions Financial 9.1 Fifth Third Fifth Third Fifth Third 10.5 |
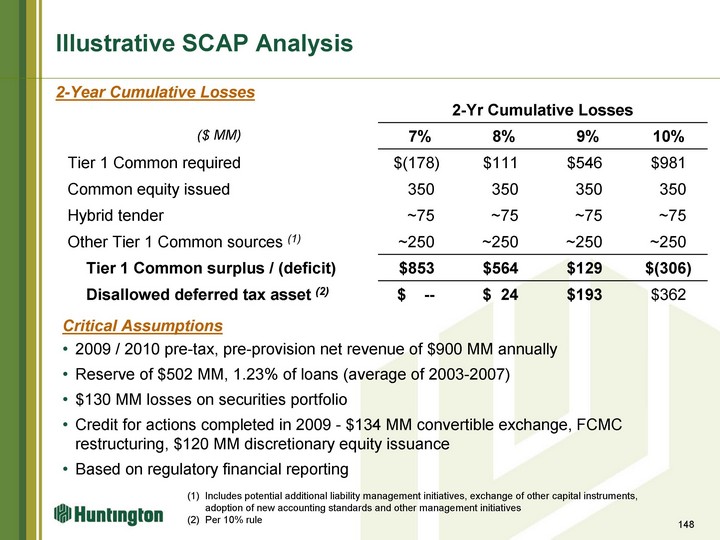
| 148 Illustrative SCAP Analysis Includes potential additional liability management initiatives, exchange of other capital instruments, adoption of new accounting standards and other management initiatives Per 10% rule 2-Year Cumulative Losses 2-Yr Cumulative Losses 2-Yr Cumulative Losses 2-Yr Cumulative Losses 2-Yr Cumulative Losses ($ MM) 7% 8% 9% 10% Tier 1 Common required $(178) $111 $546 $981 Common equity issued 350 350 350 350 Hybrid tender ~75 ~75 ~75 ~75 Other Tier 1 Common sources (1) ~250 ~250 ~250 ~250 Tier 1 Common surplus / (deficit) $853 $564 $129 $(306) Disallowed deferred tax asset (2) $ -- $ 24 $193 $362 Critical Assumptions 2009 / 2010 pre-tax, pre-provision net revenue of $900 MM annually Reserve of $502 MM, 1.23% of loans (average of 2003-2007) $130 MM losses on securities portfolio Credit for actions completed in 2009 - $134 MM convertible exchange, FCMC restructuring, $120 MM discretionary equity issuance Based on regulatory financial reporting |
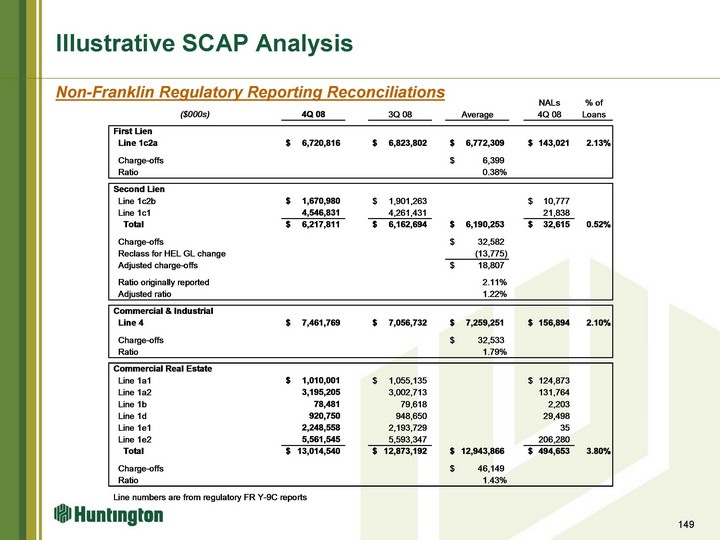
| Illustrative SCAP Analysis 149 Non-Franklin Regulatory Reporting Reconciliations |
| Illustrative SCAP Analysis 150 Non-Franklin Regulatory Reporting Reconciliations |

| Non-Franklin Credit Metrics Reconciliations 151 |
| Non-Franklin Credit Metrics Reconciliation 152 |
| Non-Franklin Credit Metrics Reconciliation 153 |
| Non-Franklin Credit Metrics Reconciliation 154 |
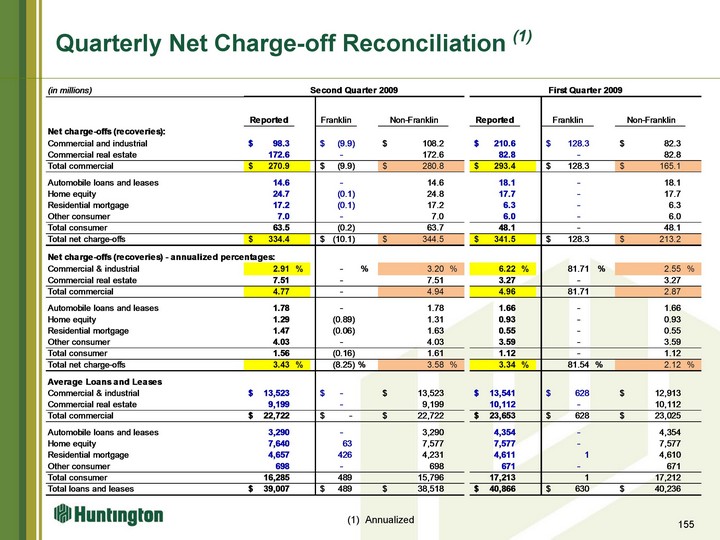
| Quarterly Net Charge-off Reconciliation (1) (1) Annualized 155 |
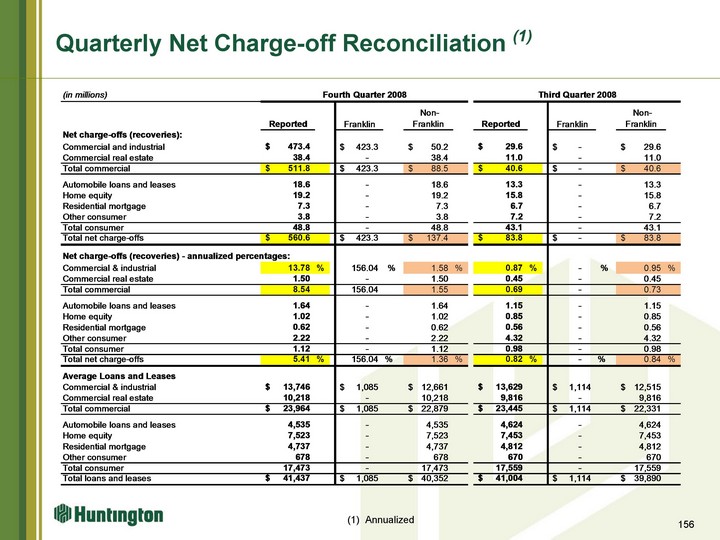
| Quarterly Net Charge-off Reconciliation (1) (1) Annualized 156 |
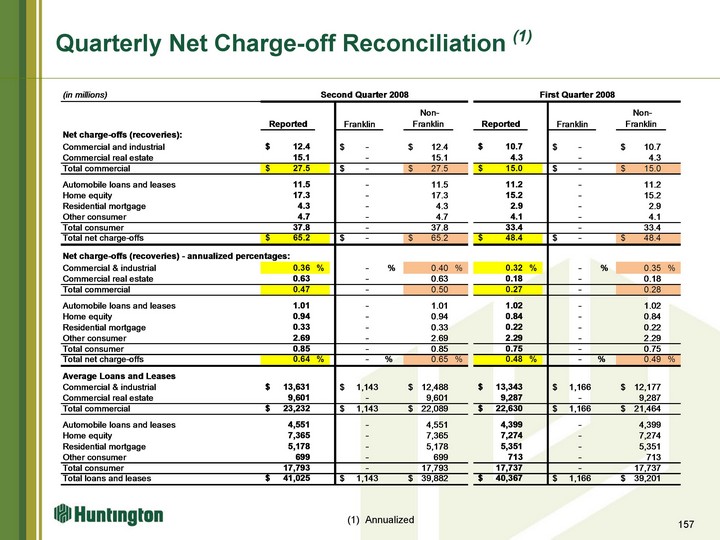
| Quarterly Net Charge-off Reconciliation (1) (1) Annualized 157 |
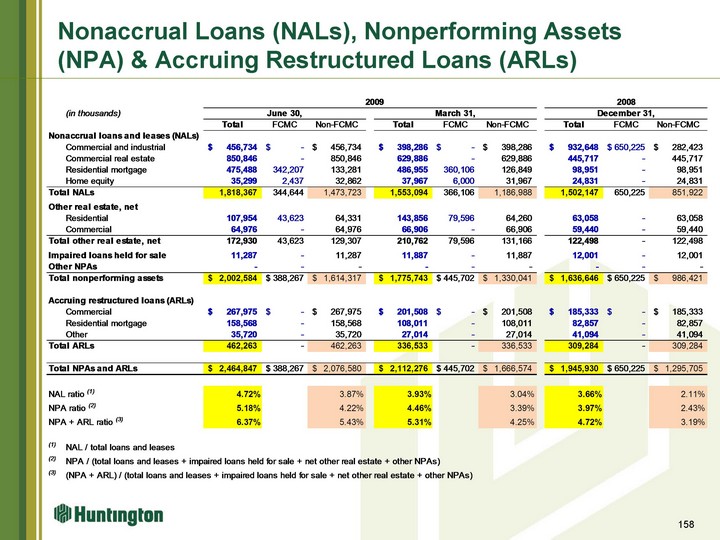
| 158 Nonaccrual Loans (NALs), Nonperforming Assets (NPA) & Accruing Restructured Loans (ARLs) |
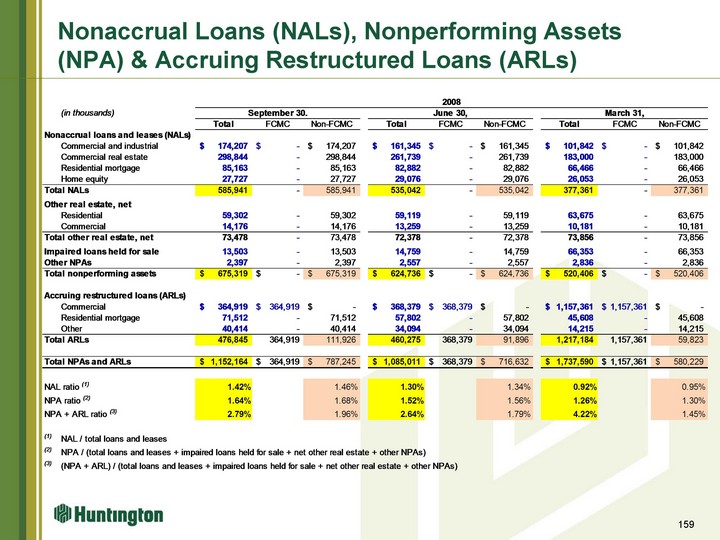
| 159 Nonaccrual Loans (NALs), Nonperforming Assets (NPA) & Accruing Restructured Loans (ARLs) |

| Deposits and Other Funding 160 |
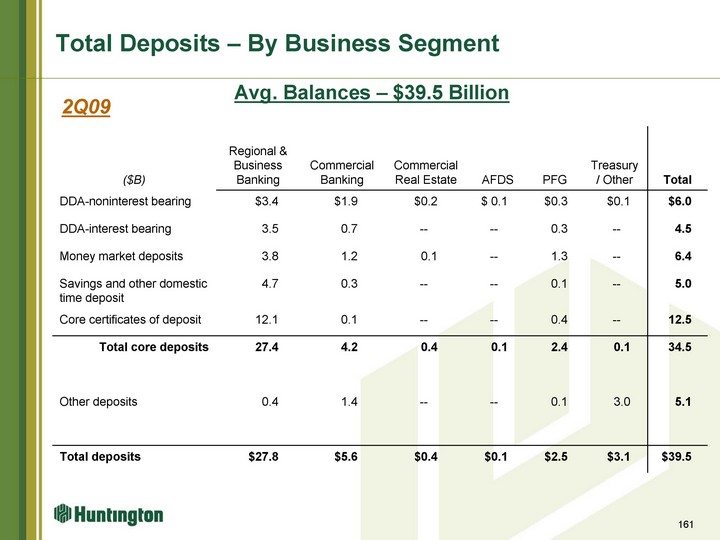
| Total Deposits - By Business Segment 161 Avg. Balances - $39.5 Billion ($B) Regional & Business Banking Commercial Banking Commercial Real Estate AFDS PFG Treasury / Other Total DDA-noninterest bearing $3.4 $1.9 $0.2 $ 0.1 $0.3 $0.1 $6.0 DDA-interest bearing 3.5 0.7 -- -- 0.3 -- 4.5 Money market deposits 3.8 1.2 0.1 -- 1.3 -- 6.4 Savings and other domestic time deposit 4.7 0.3 -- -- 0.1 -- 5.0 Core certificates of deposit 12.1 0.1 -- -- 0.4 -- 12.5 Total core deposits 27.4 4.2 0.4 0.1 2.4 0.1 34.5 Other deposits 0.4 1.4 -- -- 0.1 3.0 5.1 Total deposits $27.8 $5.6 $0.4 $0.1 $2.5 $3.1 $39.5 2Q09 |
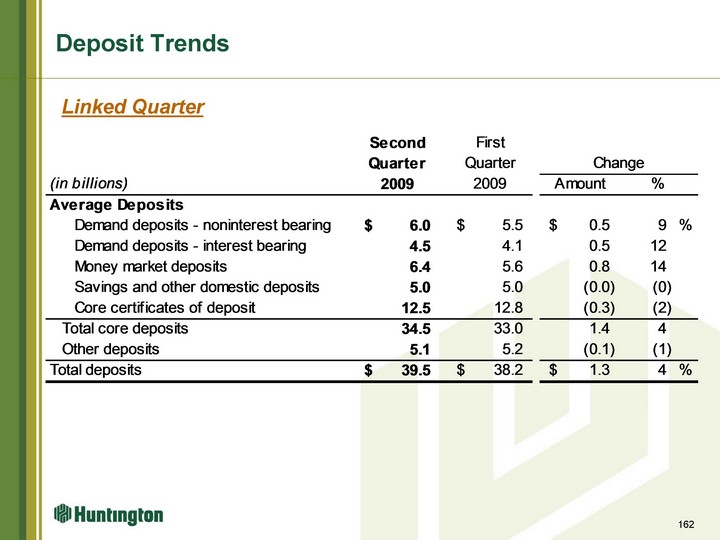
| Deposit Trends 162 Linked Quarter |
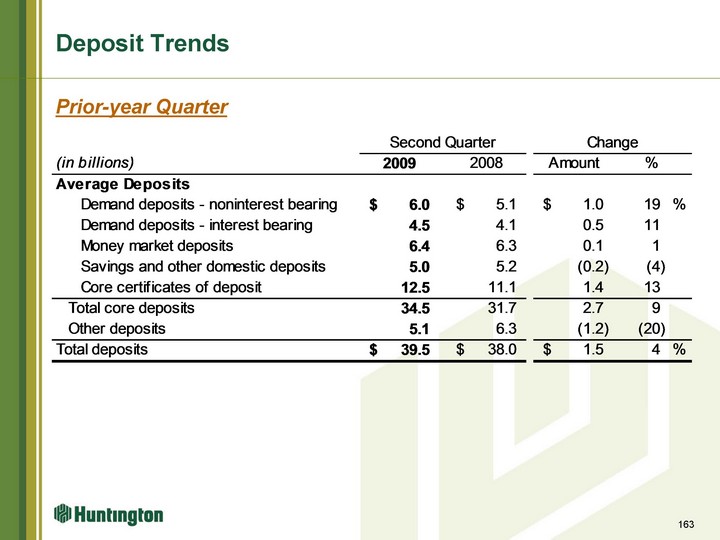
| Deposit Trends 163 Prior-year Quarter |
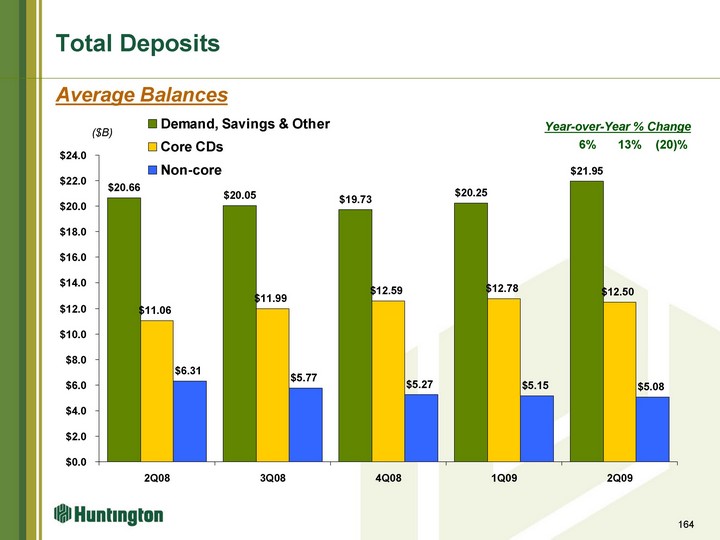
| Demand, Savings & Other Core CDs Non-core 1Q03 12.008 3.415 1.986 2Q03 12.623 3.245 2.028 3Q03 13.24 2.97 2.351 4Q03 13.052 2.84 2.853 1Q04 13.08 2.664 2.979 2Q04 13.83 2.669 2.805 3Q04 14.096 2.691 2.84 4Q04 14.454 2.733 3.124 1Q05 14.556 2.809 4.098 2Q05 14.258 3.067 4.584 3Q05 14.04 3.557 4.619 4Q05 13.92 3.891 4.627 1Q06 14.09 4.389 4.546 2Q06 14.48 5.083 4.823 3Q06 14.29 5.334 4.969 4Q06 14.196 5.38 5.132 1Q07 14.266 5.455 4.73 2Q07 14.392 5.591 4.29 3Q07 21.188 10.451 6.013 4Q07 21.004 10.666 6.005 1Q08 20.725 10.79 6.416 2Q08 20.656 11.058 6.313 3Q08 20.045 11.993 5.765 4Q08 19.727 12.588 5.268 1Q09 20.254 12.784 5.151 2Q09 21.954 12.501 5.079 6% Total Deposits Average Balances ($B) 13% (20)% Year-over-Year % Change 164 |
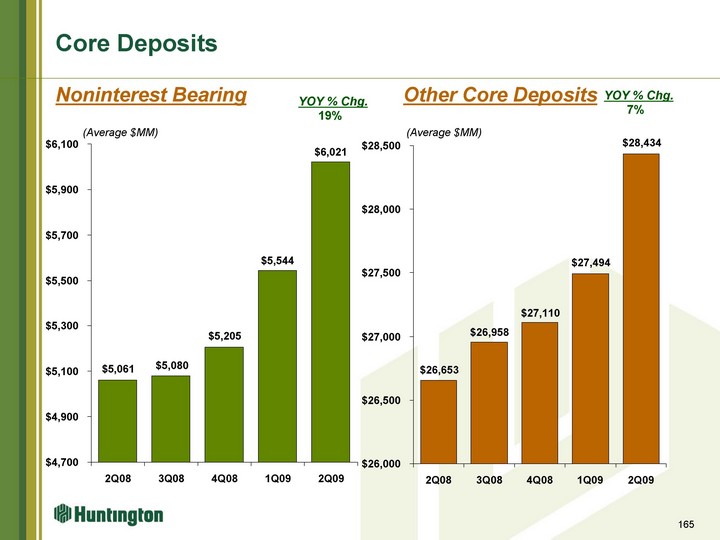
| 3Q04 4Q04 1Q05 2Q05 3Q05 4Q05 1Q06 2Q06 3Q06 4Q06 1Q07 2Q07 3Q07 4Q07 1Q08 2Q08 3Q08 4Q08 1Q09 2Q09 HBAN 3276 3401 3314 3352 3406 3444 3436 3594 3509 3580 16191 16392 16575 26452 26481 26653 26958 27110 27494 28434 HBAN 9680 3Q04 4Q04 1Q05 2Q05 3Q05 4Q05 1Q06 2Q06 3Q06 4Q06 1Q07 2Q07 3Q07 4Q07 1Q08 2Q08 3Q08 4Q08 1Q09 2Q09 HBAN 3276 3401 3314 3352 3406 3444 3436 3594 3509 3580 3530 3591 3555 5218 5034 5061 5080 5205 5544 6021 HBAN 1829 Core Deposits Noninterest Bearing Other Core Deposits (Average $MM) (Average $MM) 165 19% YOY % Chg. 7% YOY % Chg. |
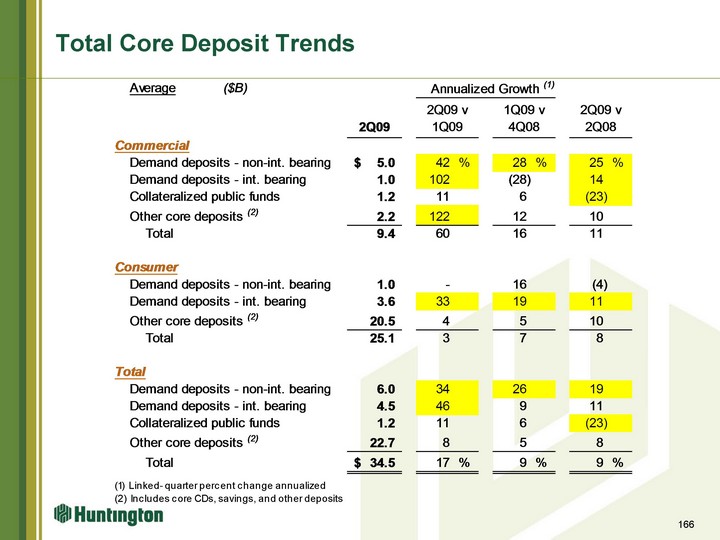
| Total Core Deposit Trends 166 |
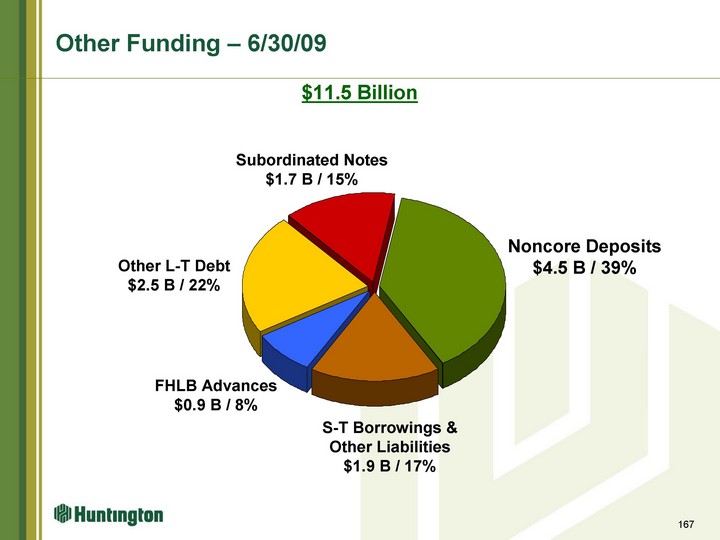
| Other Funding - 6/30/09 Non-core Deposits 0.3896 S-T Borrowings & Other Liab. 0.1657 FHLB Advances 0.0807 Other L-T Debt 0.2183 Subordinated Notes 0.1456 $11.5 Billion Noncore Deposits $4.5 B / 39% S-T Borrowings & Other Liabilities $1.9 B / 17% FHLB Advances $0.9 B / 8% Other L-T Debt $2.5 B / 22% Subordinated Notes $1.7 B / 15% 167 |
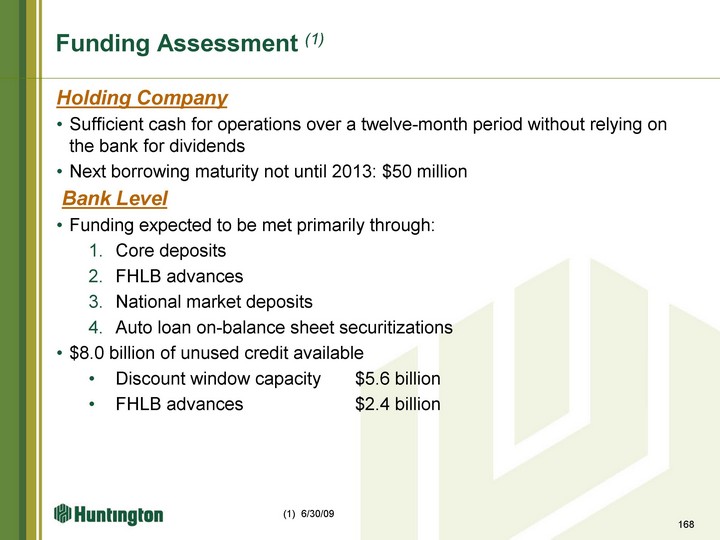
| Funding Assessment (1) Holding Company Sufficient cash for operations over a twelve-month period without relying on the bank for dividends Next borrowing maturity not until 2013: $50 million Bank Level Funding expected to be met primarily through: Core deposits FHLB advances National market deposits Auto loan on-balance sheet securitizations $8.0 billion of unused credit available Discount window capacity $5.6 billion FHLB advances $2.4 billion 168 (1) 6/30/09 |

| Capital 169 |
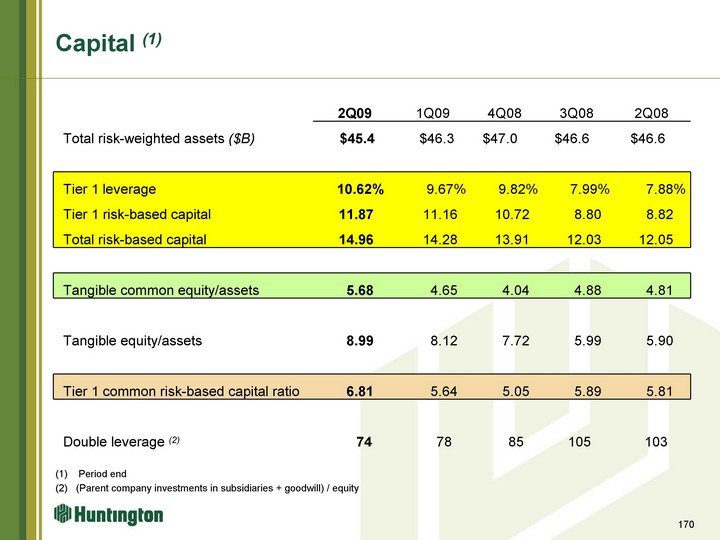
| Capital (1) 2Q09 2Q09 1Q09 4Q08 3Q08 2Q08 Total risk-weighted assets ($B) $45.4 $46.3 $47.0 $46.6 $46.6 Tier 1 leverage 10.62% 9.67% 9.82% 7.99% 7.88% Tier 1 risk-based capital 11.87 11.16 10.72 8.80 8.82 Total risk-based capital 14.96 14.28 13.91 12.03 12.05 Tangible common equity/assets 5.68 4.65 4.04 4.88 4.81 Tangible equity/assets 8.99 8.12 7.72 5.99 5.90 Tier 1 common risk-based capital ratio 6.81 5.64 5.05 5.89 5.81 Double leverage (2) 74 78 85 105 103 (1) Period end (2) (Parent company investments in subsidiaries + goodwill) / equity 170 |
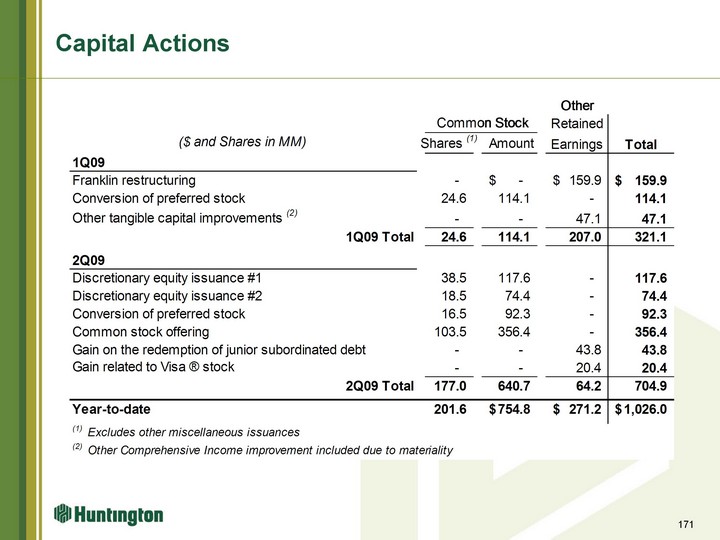
| Capital Actions 171 |
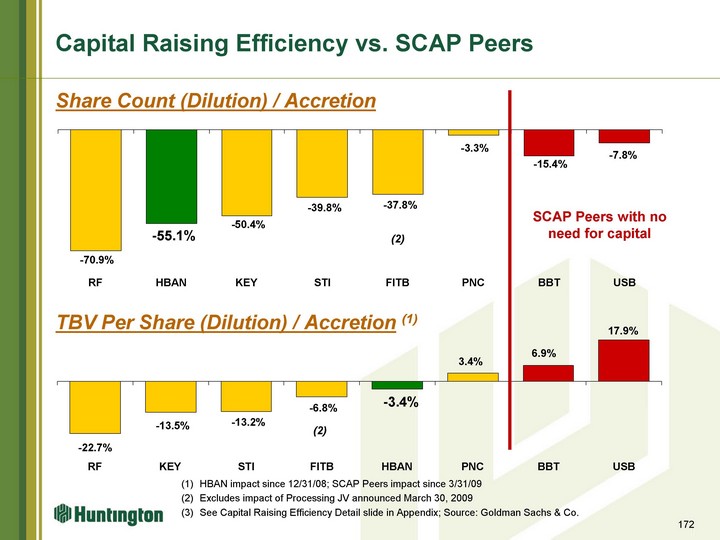
| Amount RF -0.227 KEY -0.135 STI -0.132 FITB -0.068 HBAN -0.034 PNC 0.034 BBT 0.069 USB 0.179 Amount RF -0.709 HBAN -0.551 KEY -0.504 STI -0.398 FITB -0.378 PNC -0.033 BBT -0.154 USB -0.078 Capital Raising Efficiency vs. SCAP Peers Share Count (Dilution) / Accretion TBV Per Share (Dilution) / Accretion (1) 172 HBAN impact since 12/31/08; SCAP Peers impact since 3/31/09 Excludes impact of Processing JV announced March 30, 2009 See Capital Raising Efficiency Detail slide in Appendix; Source: Goldman Sachs & Co. (2) (2) SCAP Peers with no need for capital |
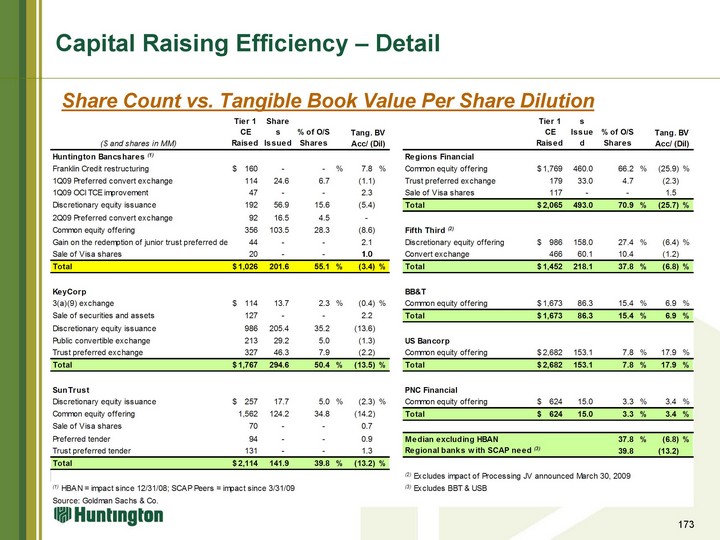
| Capital Raising Efficiency - Detail 173 Share Count vs. Tangible Book Value Per Share Dilution |
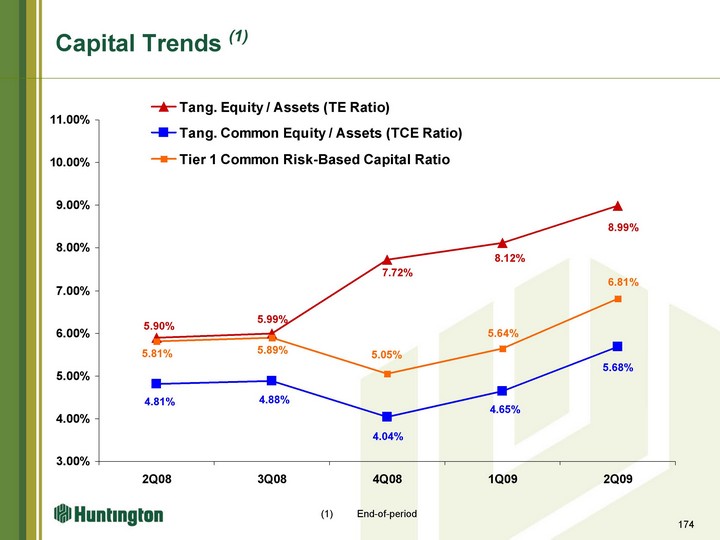
| LLR/NPL ratio 1Q08 2Q08 3Q08 4Q08 1Q09 2Q09 Tang. Equity / Risk-Weighted Assets 0.0558 0.0659 0.066 0.0839 0.0894 0.1004 Tang. Equity / Assets (TE Ratio) 0.0492 0.059 0.0599 0.0772 0.0812 0.0899 Tang. Common Equity / Assets (TCE Ratio) 0.0492 0.0481 0.0488 0.0404 0.0465 0.0568 Tier 1 Common Risk-Based Capital Ratio 0.0558 0.0581 0.0589 0.0505 0.0564 0.0681 Capital Trends (1) End-of-period 174 |
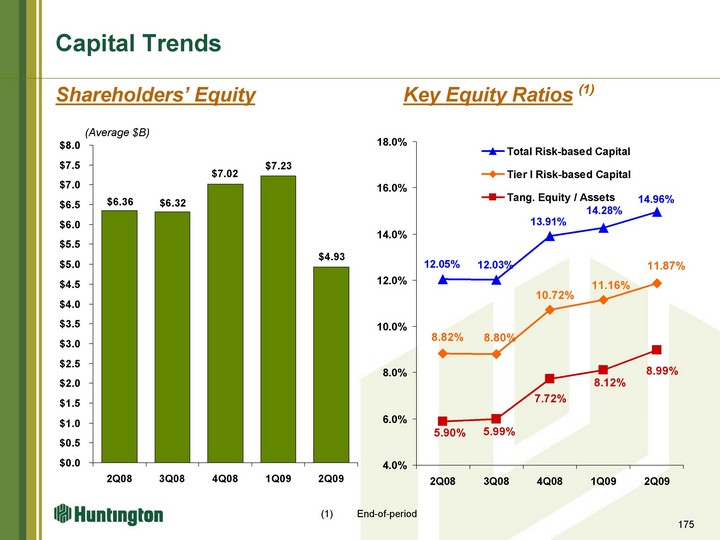
| Total Risk-based Capital Tier I Risk-based Capital Tang. Equity / Risk Weighted Assets Tang. Equity / Assets 3Q02 0.1178 0.0881 0.0764 4Q02 0.1125 0.0834 0.0722 1Q03 0.1104 0.0816 0.07 2Q03 0.1111 0.0832 0.0723 0.0706 3Q03 0.1119 0.084 0.0724 0.0677 4Q03 0.1195 0.0853 0.0731 0.0679 1Q04 0.1213 0.0874 0.076 0.0697 2Q04 0.1256 0.0898 0.0764 0.0695 3Q04 0.1253 0.091 0.0783 0.0711 4Q04 0.1248 0.0908 0.0786 0.0718 1Q05 0.1233 0.0904 0.0784 0.0742 2Q05 0.1239 0.0918 0.0805 0.0736 3Q05 0.127 0.0942 0.0819 0.0739 4Q05 0.1242 0.0913 0.0791 0.0719 1Q06 0.1291 0.0894 0.078 0.0697 2Q06 0.1229 0.0845 0.0729 0.0646 3Q06 0.1281 0.0895 0.0797 0.0713 4Q06 0.1279 0.0893 0.0772 0.0693 1Q07 0.1282 0.0898 0.0777 0.0711 2Q07 0.1349 0.0974 0.0766 0.0687 3Q07 0.1158 0.0835 0.0646 0.057 4Q07 0.1085 0.0751 0.0567 0.0508 1Q08 0.1087 0.0756 0.0558 0.0492 2Q08 0.1205 0.0882 0.0659 0.059 3Q08 0.1203 0.088 0.066 0.0599 4Q08 0.1391 0.1072 0.0839 0.0772 1Q09 0.1428 0.1116 0.0894 0.0812 2Q09 0.1496 0.1187 0.1004 0.0899 Capital Trends Shareholders' Equity Key Equity Ratios (1) (Average $B) Shareholders' Equity 3Q02 2.214 4Q02 2.163 1Q03 2.166 2Q03 2.151 3Q03 2.239 4Q03 2.228 1Q04 2.278 2Q04 2.323 3Q04 2.412 4Q04 2.481 1Q05 2.527 2Q05 2.619 3Q05 2.611 4Q05 2.57 1Q06 2.73 2Q06 2.995 3Q06 2.97 4Q06 3.084 1Q07 3.014 2Q07 3.043 3Q07 6.206 4Q07 6.211 1Q08 5.877 2Q08 6.357 3Q08 6.323 4Q08 7.019 1Q09 7.225 2Q09 4.928 175 End-of-period |
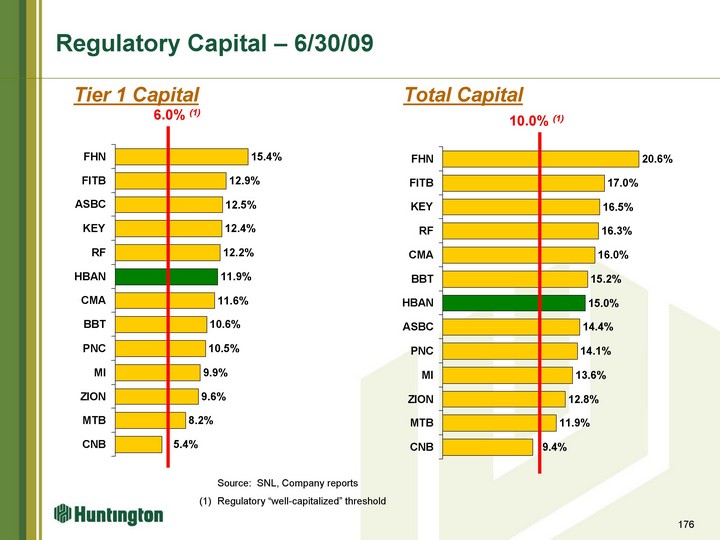
| Regulatory Capital - 6/30/09 176 Tier 1 Capital Total Capital CNB 0.0544 MTB 0.0817 ZION 0.0964 MI 0.0988 PNC 0.105 BBT 0.106 CMA 0.1157 HBAN 0.1187 RF 0.122 KEY 0.1242 ASBC 0.1245 FITB 0.129 FHN 0.154 CNB 0.0943 MTB 0.1187 ZION 0.1284 MI 0.1362 PNC 0.141 ASBC 0.1435 HBAN 0.1496 BBT 0.152 CMA 0.1596 RF 0.163 KEY 0.1647 FITB 0.1696 FHN 0.206 6.0% (1) 10.0% (1) (1) Regulatory "well-capitalized" threshold Source: SNL, Company reports |
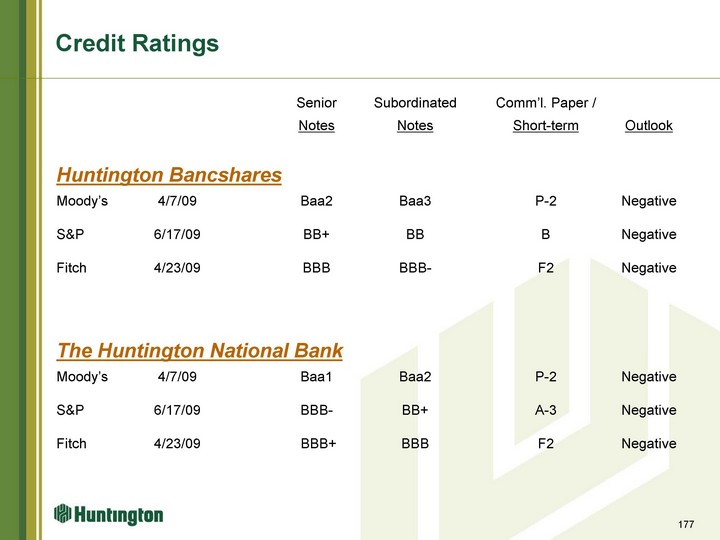
| Credit Ratings Senior Subordinated Comm'l. Paper / Notes Notes Short-term Outlook Huntington Bancshares Moody's 4/7/09 Baa2 Baa3 P-2 Negative S&P 6/17/09 BB+ BB B Negative Fitch 4/23/09 BBB BBB- F2 Negative The Huntington National Bank Moody's 4/7/09 Baa1 Baa2 P-2 Negative S&P 6/17/09 BBB- BB+ A-3 Negative Fitch 4/23/09 BBB+ BBB F2 Negative 177 |

| Franchise 178 |
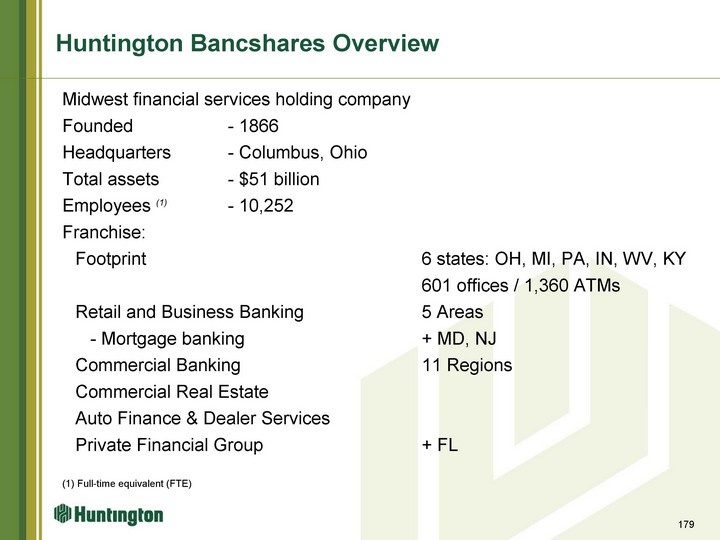
| Midwest financial services holding company Founded - 1866 Headquarters - Columbus, Ohio Total assets - $51 billion Employees (1) - 10,252 Franchise: Footprint 6 states: OH, MI, PA, IN, WV, KY 601 offices / 1,360 ATMs Retail and Business Banking 5 Areas - Mortgage banking + MD, NJ Commercial Banking 11 Regions Commercial Real Estate Auto Finance & Dealer Services Private Financial Group + FL (1) Full-time equivalent (FTE) 179 Huntington Bancshares Overview |
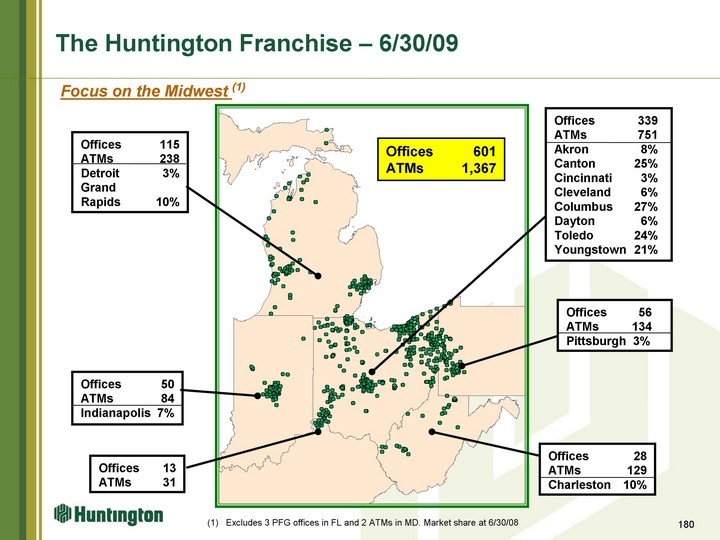
| Focus on the Midwest (1) Offices 115 ATMs 238 Detroit 3% Grand Rapids 10% Offices 339 ATMs 751 Akron 8% Canton 25% Cincinnati 3% Cleveland 6% Columbus 27% Dayton 6% Toledo 24% Youngstown 21% Offices 50 ATMs 84 Indianapolis 7% Offices 13 ATMs 31 Offices 28 ATMs 129 Charleston 10% Excludes 3 PFG offices in FL and 2 ATMs in MD. Market share at 6/30/08 Offices 601 ATMs 1,367 180 Offices 56 ATMs 134 Pittsburgh 3% The Huntington Franchise - 6/30/09 |
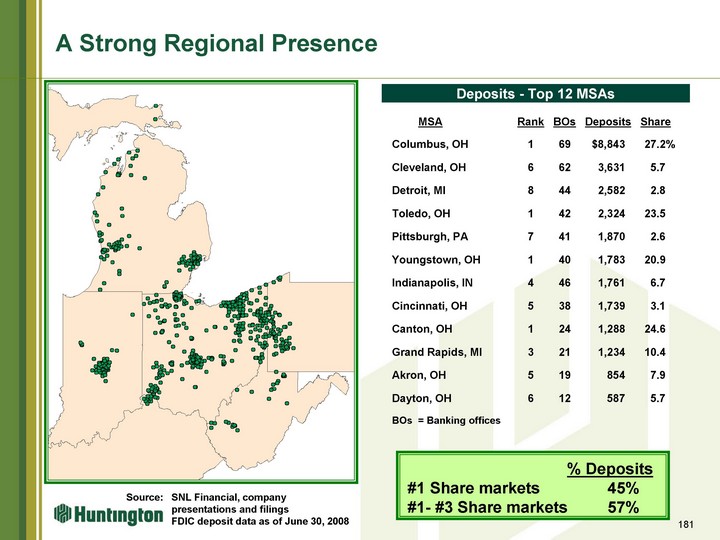
| A Strong Regional Presence Source: SNL Financial, company presentations and filings FDIC deposit data as of June 30, 2008 Deposits - Top 12 MSAs MSA Rank BOs Deposits Share Columbus, OH 1 69 $8,843 27.2% Cleveland, OH 6 62 3,631 5.7 Detroit, MI 8 44 2,582 2.8 Toledo, OH 1 42 2,324 23.5 Pittsburgh, PA 7 41 1,870 2.6 Youngstown, OH 1 40 1,783 20.9 Indianapolis, IN 4 46 1,761 6.7 Cincinnati, OH 5 38 1,739 3.1 Canton, OH 1 24 1,288 24.6 Grand Rapids, MI 3 21 1,234 10.4 Akron, OH 5 19 854 7.9 Dayton, OH 6 12 587 5.7 BOs = Banking offices 181 % Deposits #1 Share markets 45% #1- #3 Share markets 57% |

| Strategy, Organization and History 182 |
| Organization Organization 183 |

| Senior Leadership Team Experience-Yrs Position Appointed Banking HBAN Stephen Steinour Chairman, President and CEO 1Q09 29 new Dan Benhase SEVP-Private Financial Group Director 2Q06 26 9 Kevin Blakely SEVP-Chief Risk Officer 3Q09 35 new Jim Dunlap SEVP-Regional & Commercial Banking Director 1Q06 30 30 Don Kimble SEVP-Chief Financial Officer 3Q04 22 5 Mary Navarro SEVP-Retail & Business Banking Director 1Q06 32 7 Nick Stanutz SEVP-Dealer Sales Group Director 2Q06 30 23 Randy Stickler SEVP-Commercial Real Estate Director 1Q09 28 new Mark Thompson SEVP-Strategy & Segment Performance Director 2Q09 25 new Zahid Afzal EVP-Chief Information Officer 1Q06 25 (1) 3 Jim Baron EVP-Consumer Segment Director 1Q07 30 5 Dick Cheap EVP-General Counsel and Secretary 2Q98 11 11 Michael Cross EVP-Senior Commercial Approval Officer 4Q06 29 7 Shirley Graham EVP-Human Resources Director 1Q09 23 23 Eric Sutphin EVP-Chief Auditor 3Q04 20 4 Peter Dunlap President-Huntington Insurance 3Q08 17 (1) 9 Tim Barber SVP-Credit Policy Manager 1Q99 20 11 (1) Includes outside of banking 184 |
| Regional Banking Structure Commercial Banking Executive - Jim Dunlap 11 Region Presidents Direct reporting responsibility for: Commercial banking Treasury management sales Regional marketing / community affairs Increased responsibility around: New business rainmaker Portfolio and risk management Community and political influence Shared fate for overall region results Retail and Business Banking Executive - Mary Navarro 5 Areas Area retail sales managers report to Mary Navarro Area business banking sales managers report to Jeff Rosen Key support / center positions Business Banking Mortgage / Consumer Administration Deposit Pricing, Product and Fees Payments & Alternative Delivery Corporate Marketing / Customer Experience 185 |
| 11 Commercial Banking Regions Greater Akron/Canton Mahoning Valley Central Ohio NW Ohio S. Ohio/KY Greater Cleveland Central Indiana West Michigan East Michigan West Virginia Pittsburgh Jim Dunlap 186 |
| Regional Banking Presidents Experience - Yrs Region Appointed Banking HBAN Jim Dunlap* West Michigan 1Q06 30 30 Rebecca Smith East Michigan 1Q07 32 2 Sharon Speyer Northwest Ohio 1Q01 21 17 Jerry Kelsheimer Greater Cleveland 1Q05 22 14 Vincent Locher Pittsburgh 3Q02 23 21 Jim Kunk Central Ohio 1Q94 27 27 Mark Reitzes Southern Ohio / KY 1Q08 23 16 Clayton Rice West Virginia 3Q07 22 5 William Shivers Greater Akron/Canton 3Q09 17 2 Mike Newbold Central Indiana 4Q06 33 6 Frank Hierro Mahoning Valley 1Q00 30 23 187 * Regional / Commercial Banking Executive |
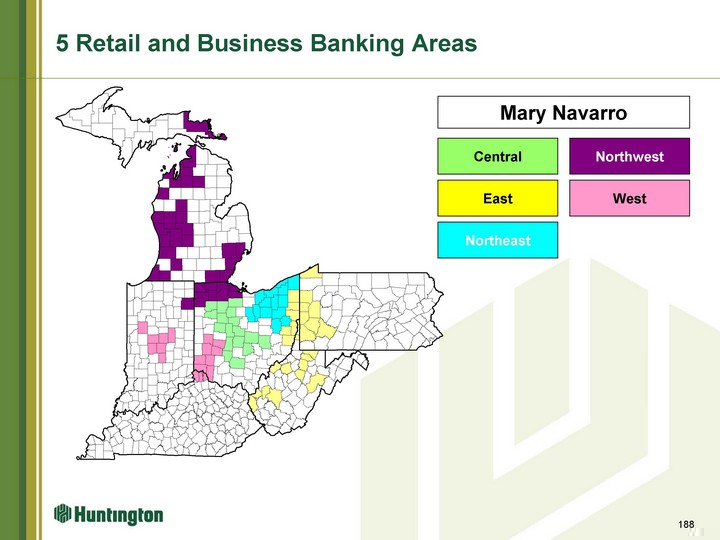
| 5 Retail and Business Banking Areas Central Northwest West Northeast East Mary Navarro 188 |

| Business Segment Summary 189 |
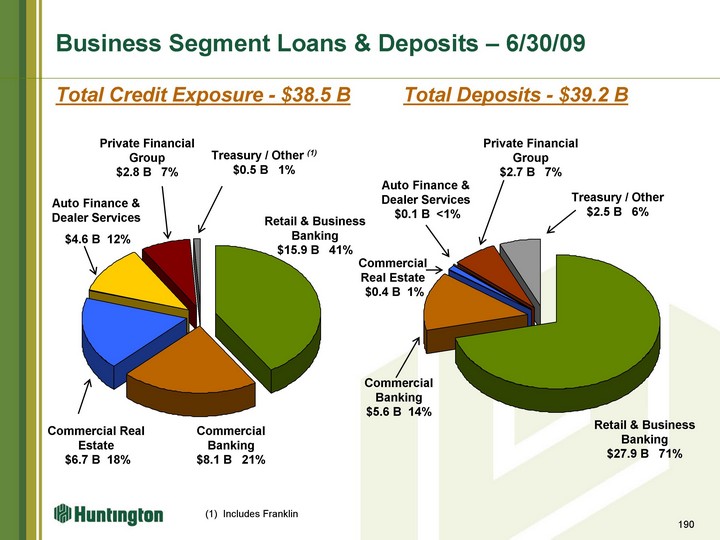
| Business Segment Loans & Deposits - 6/30/09 Total Credit Exposure - $38.5 B Total Deposits - $39.2 B 190 Retail and Business Banking 0.711 Commercial Banking 0.143 Commercial Real Estate 0.01 Dealer sales 0.002 PFG 0.07 Treasury / Other 0.064 Retail & Business Banking 0.412 Commercial Banking 0.21 Commercial Real Estate 0.175 AFDS 0.118 PFG 0.073 Treasuy / Other 0.012 Commercial Real Estate $6.7 B 18% Retail & Business Banking $15.9 B 41% Treasury / Other (1) $0.5 B 1% (1) Includes Franklin Commercial Banking $8.1 B 21% Auto Finance & Dealer Services $4.6 B 12% Private Financial Group $2.8 B 7% Commercial Real Estate $0.4 B 1% Treasury / Other $2.5 B 6% Retail & Business Banking $27.9 B 71% Commercial Banking $5.6 B 14% Private Financial Group $2.7 B 7% Auto Finance & Dealer Services $0.1 B <1% |
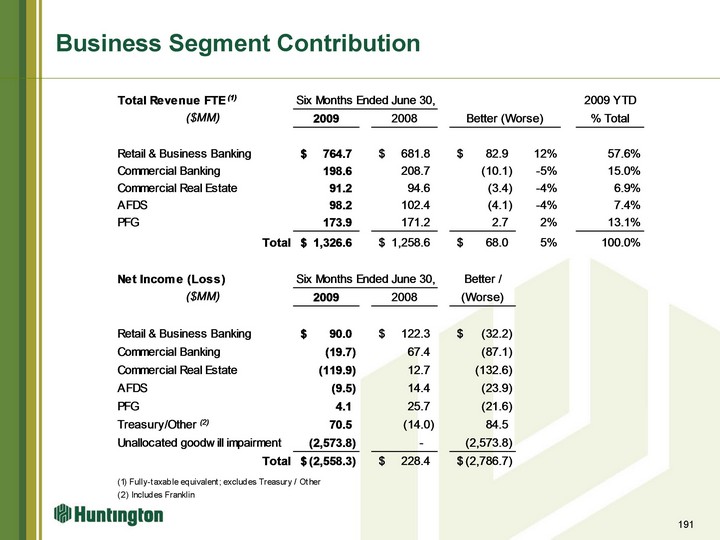
| 191 Business Segment Contribution |