EX-99.1
Published on June 11, 2025

2025 Morgan Stanley US Financials Conference The Huntington National Bank is Member FDIC. ®, Huntington® and Huntington. are federally registered service marks of Huntington Bancshares Incorporated. ©2025 Huntington Bancshares Incorporated. Welcome.
Disclaimer
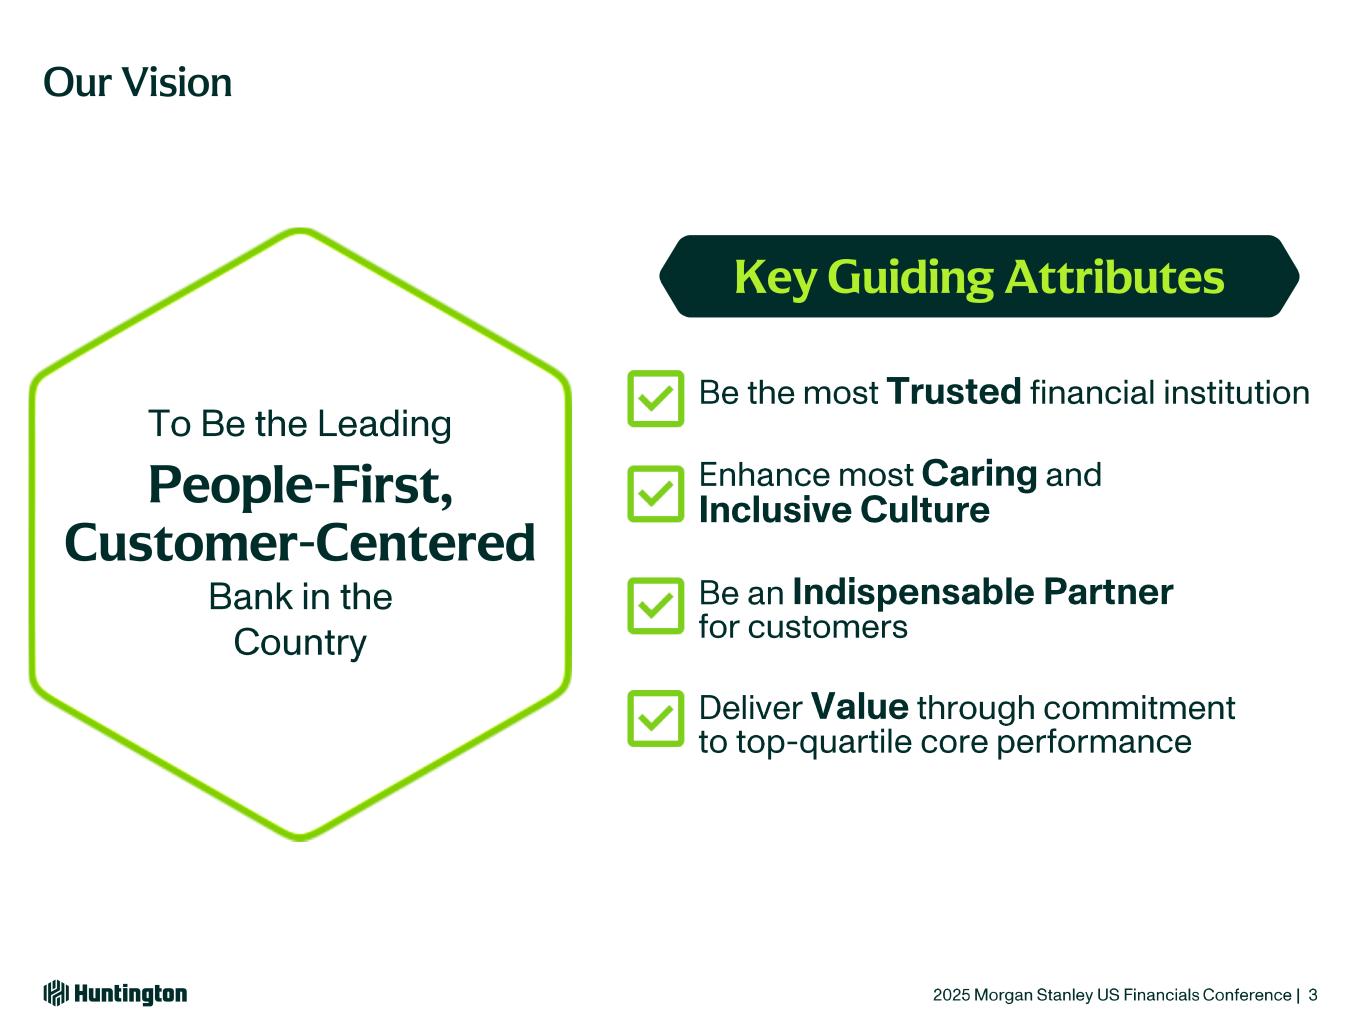
Our Vision Key Guiding Attributes People-First, Customer-Centered
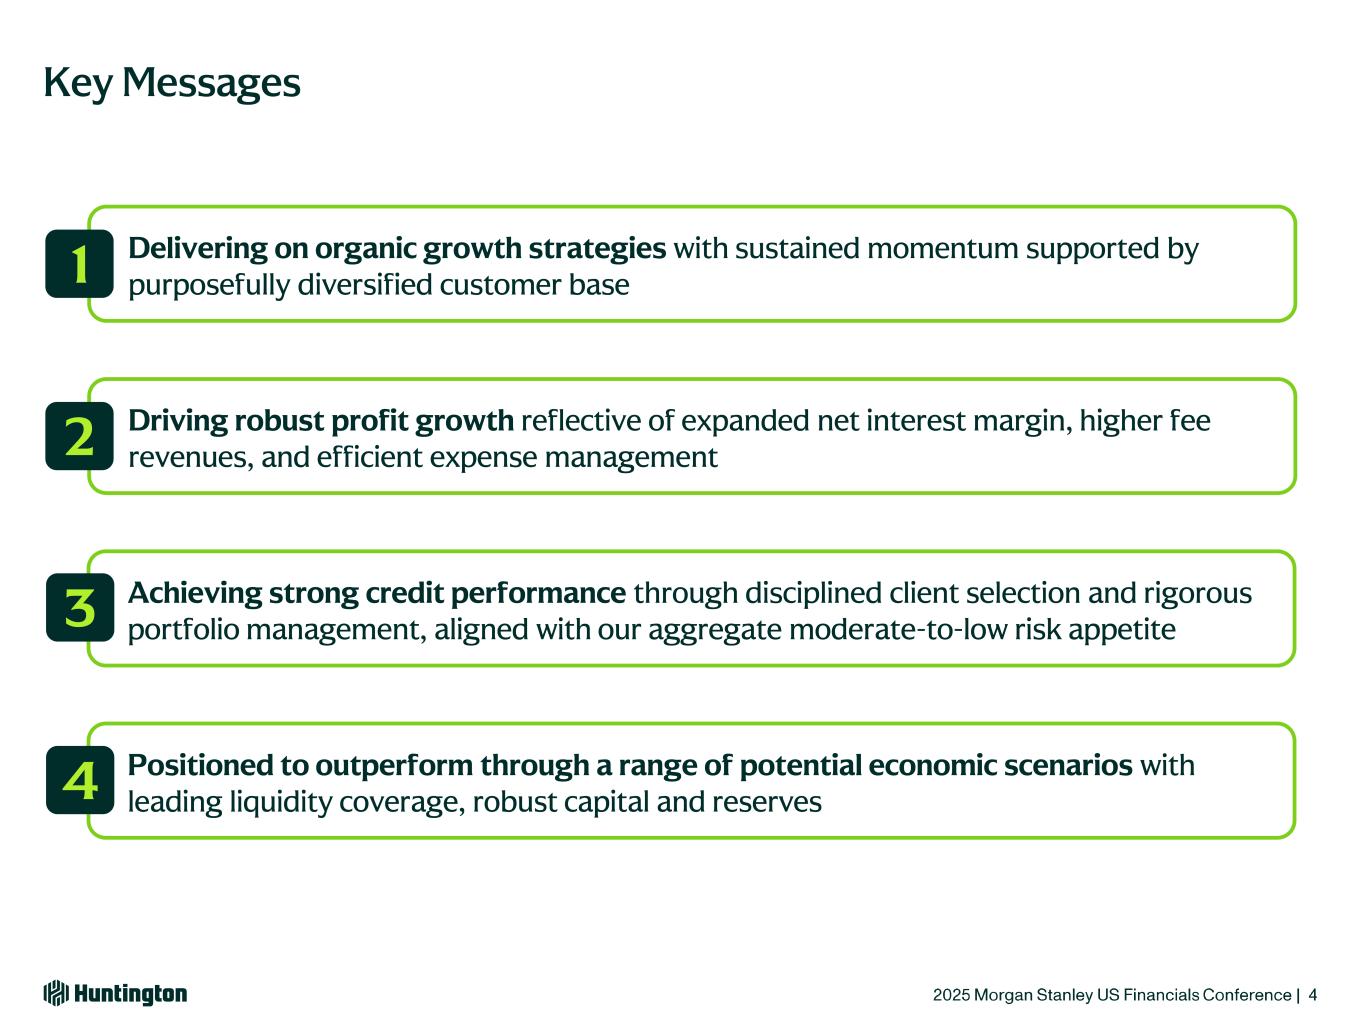
Key Messages Delivering on organic growth strategies with sustained momentum supported by purposefully diversified customer base1 Driving robust profit growth reflective of expanded net interest margin, higher fee revenues, and efficient expense management2 Achieving strong credit performance through disciplined client selection and rigorous portfolio management, aligned with our aggregate moderate-to-low risk appetite3 Positioned to outperform through a range of potential economic scenarios with leading liquidity coverage, robust capital and reserves4
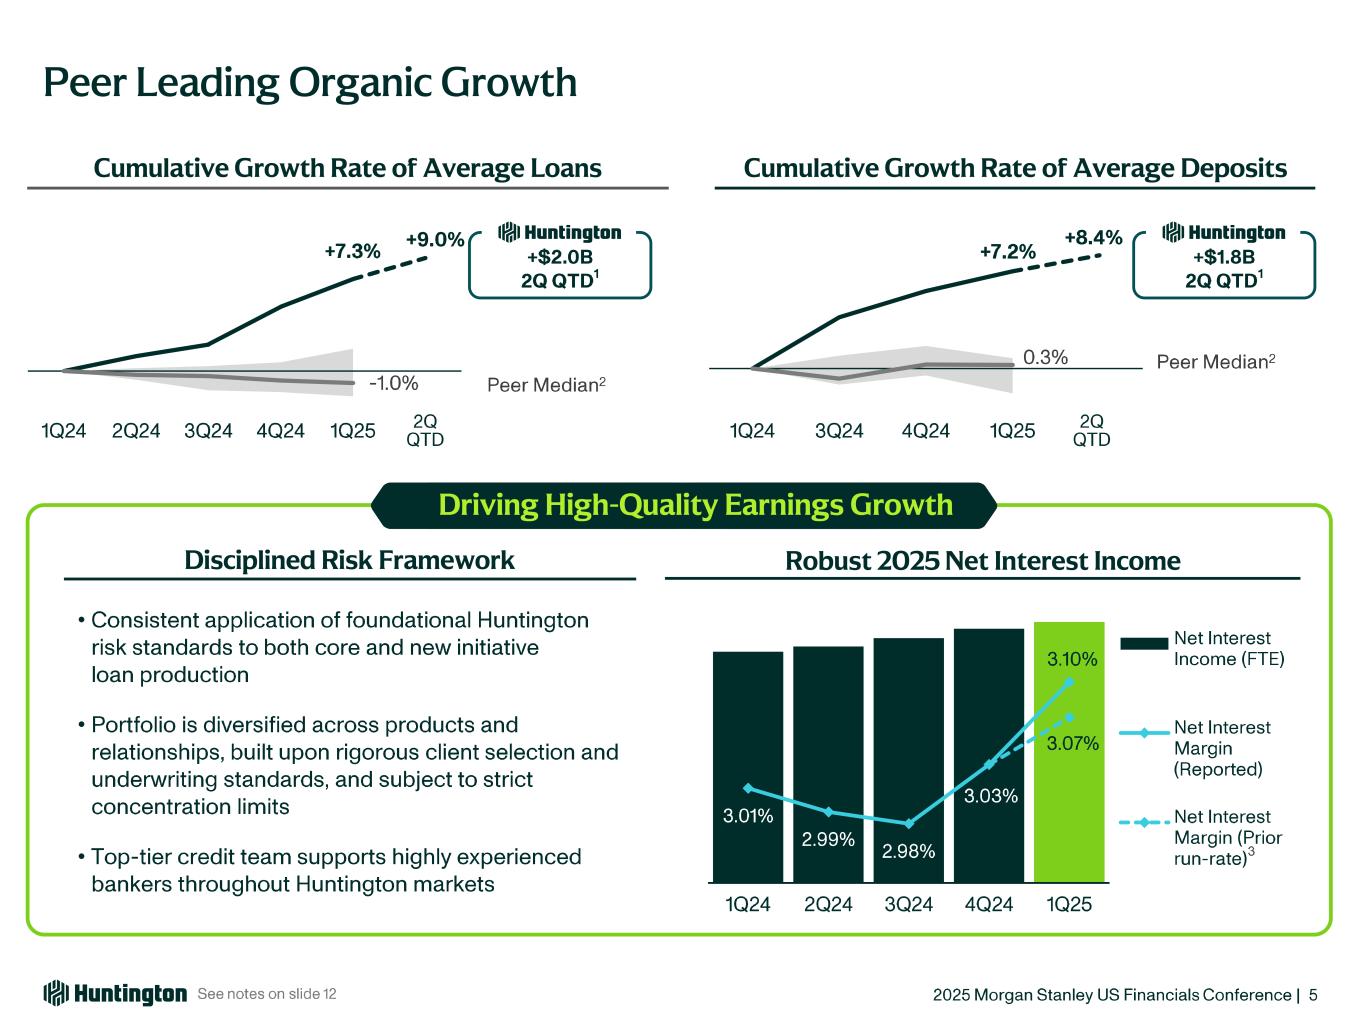
Peer Leading Organic Growth Robust 2025 Net Interest Income • • • Disciplined Risk Framework Driving High-Quality Earnings Growth Cumulative Growth Rate of Average DepositsCumulative Growth Rate of Average Loans … … … … …
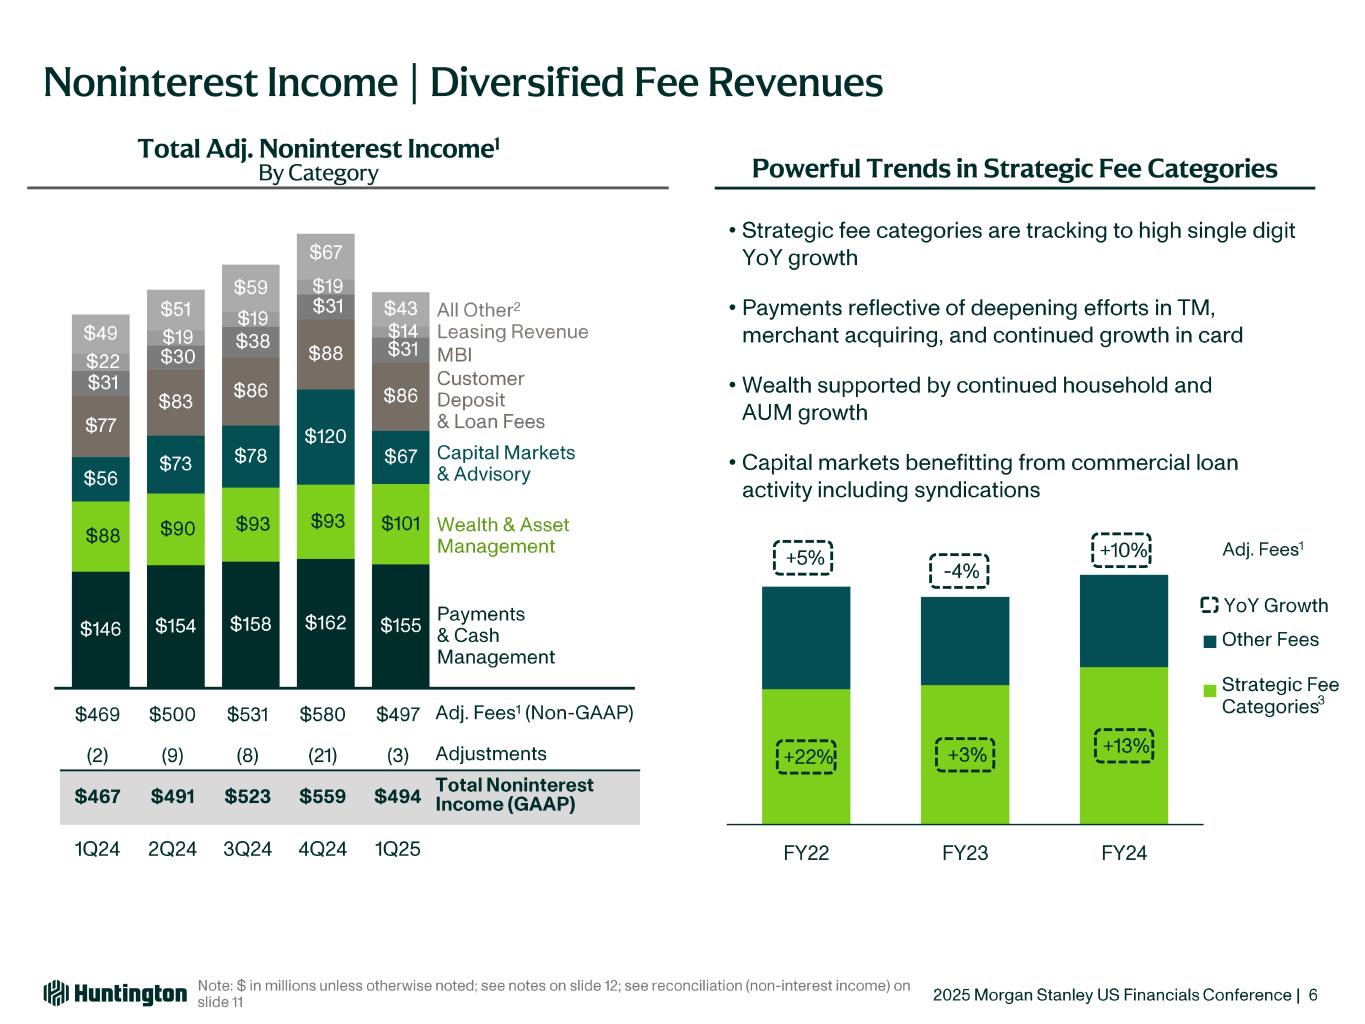
Total Adj. Noninterest Income1 By Category Noninterest Income | Diversified Fee Revenues Powerful Trends in Strategic Fee Categories • • • •
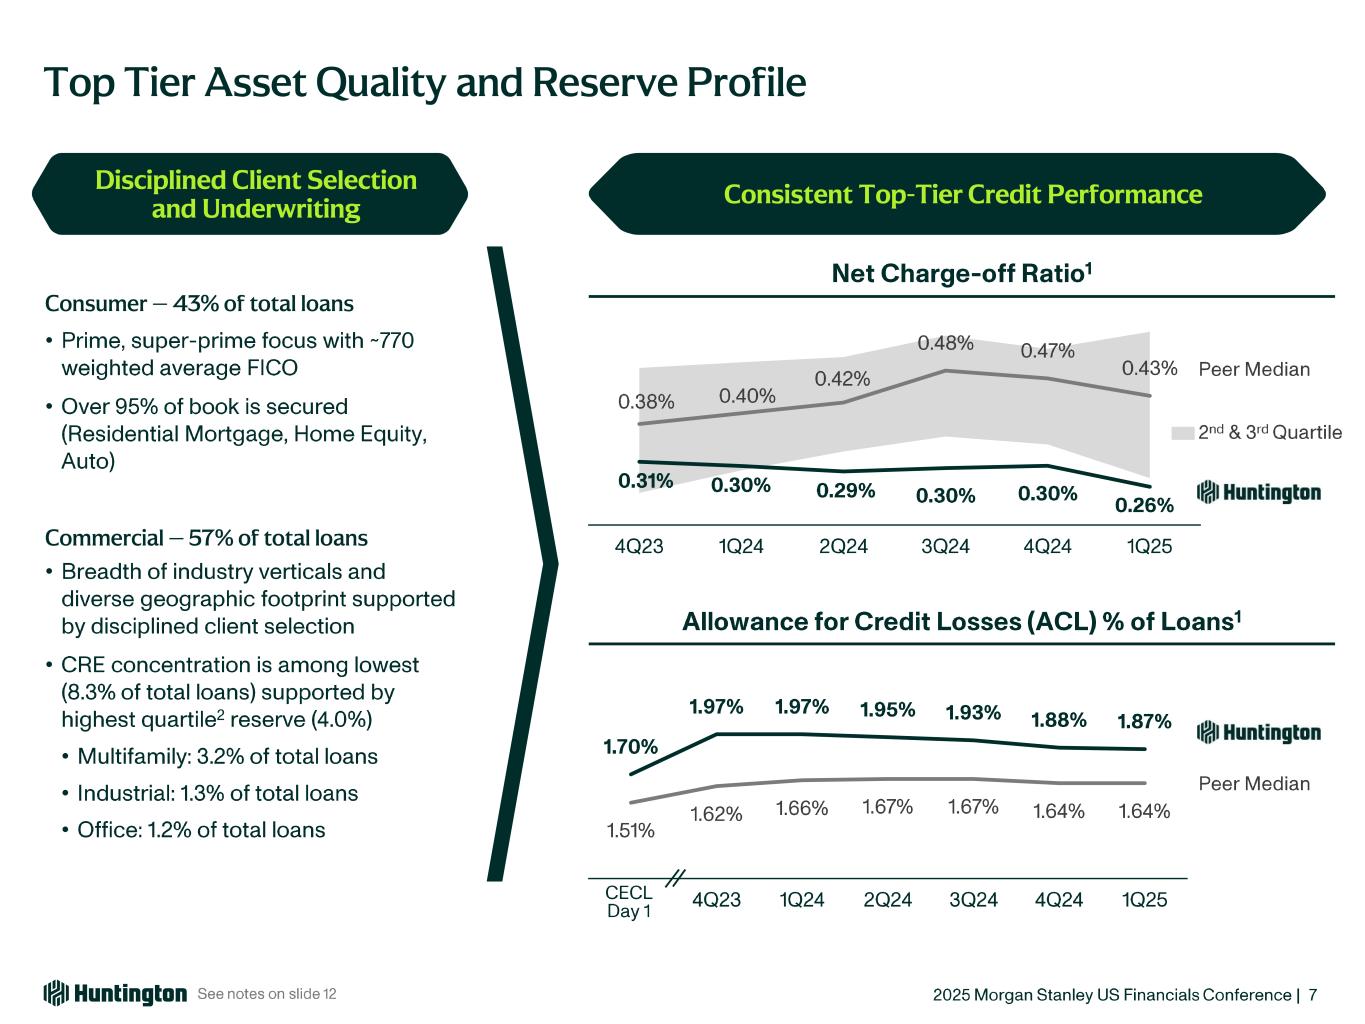
Top Tier Asset Quality and Reserve Profile Consumer – 43% of total loans • • Commercial – 57% of total loans • • • • • Disciplined Client Selection and Underwriting Consistent Top-Tier Credit Performance
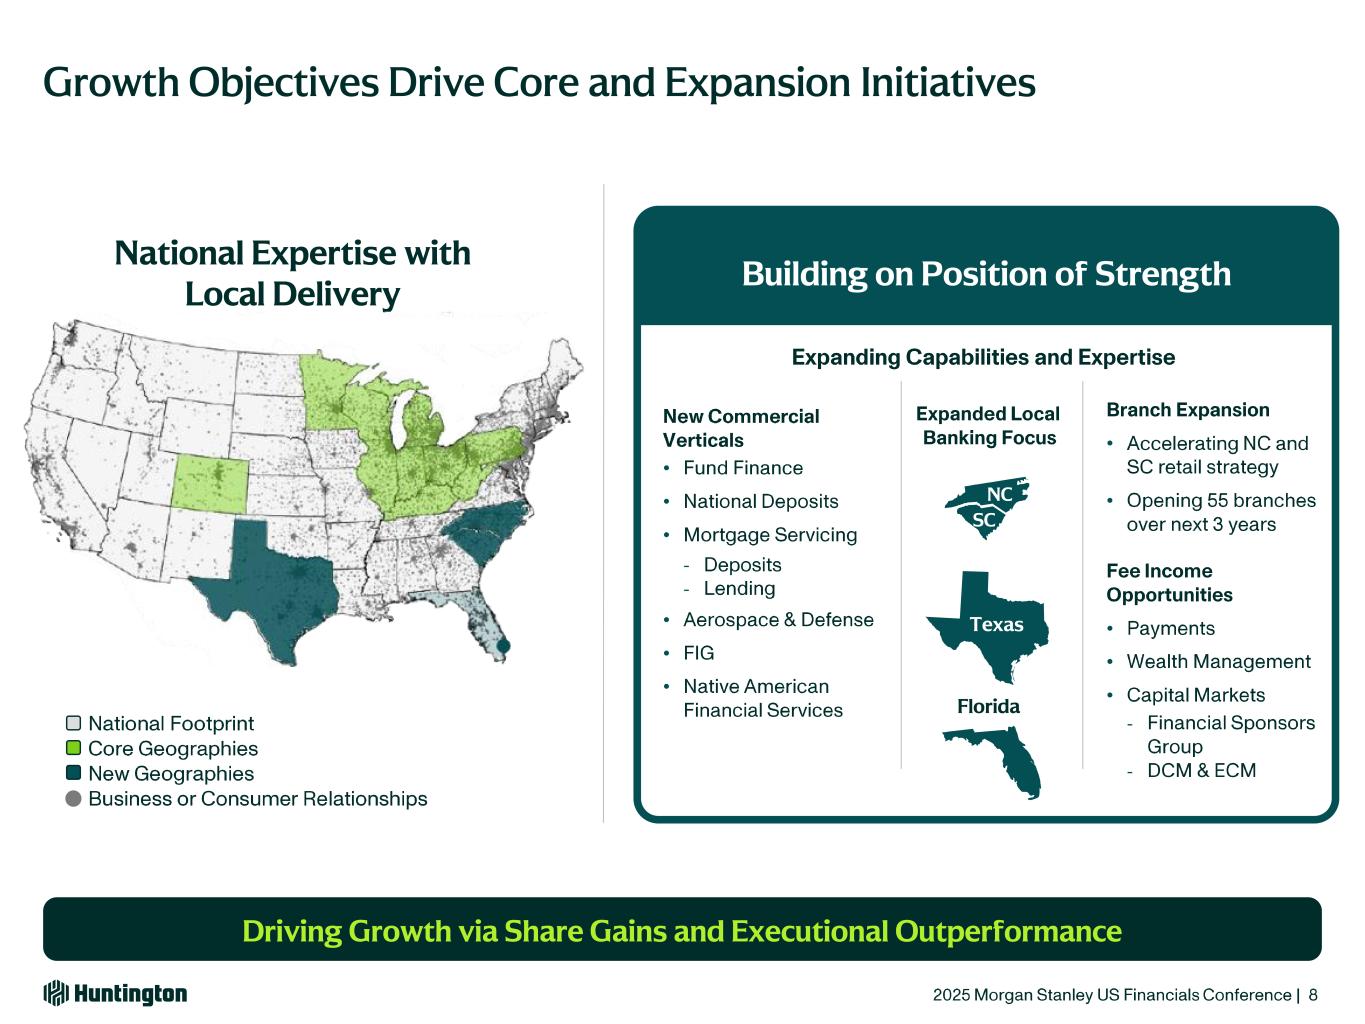
Growth Objectives Drive Core and Expansion Initiatives Driving Growth via Share Gains and Executional Outperformance NC Texas • • • - - • • • • • • • • - - SC Building on Position of Strength National Expertise with Local Delivery Florida NC
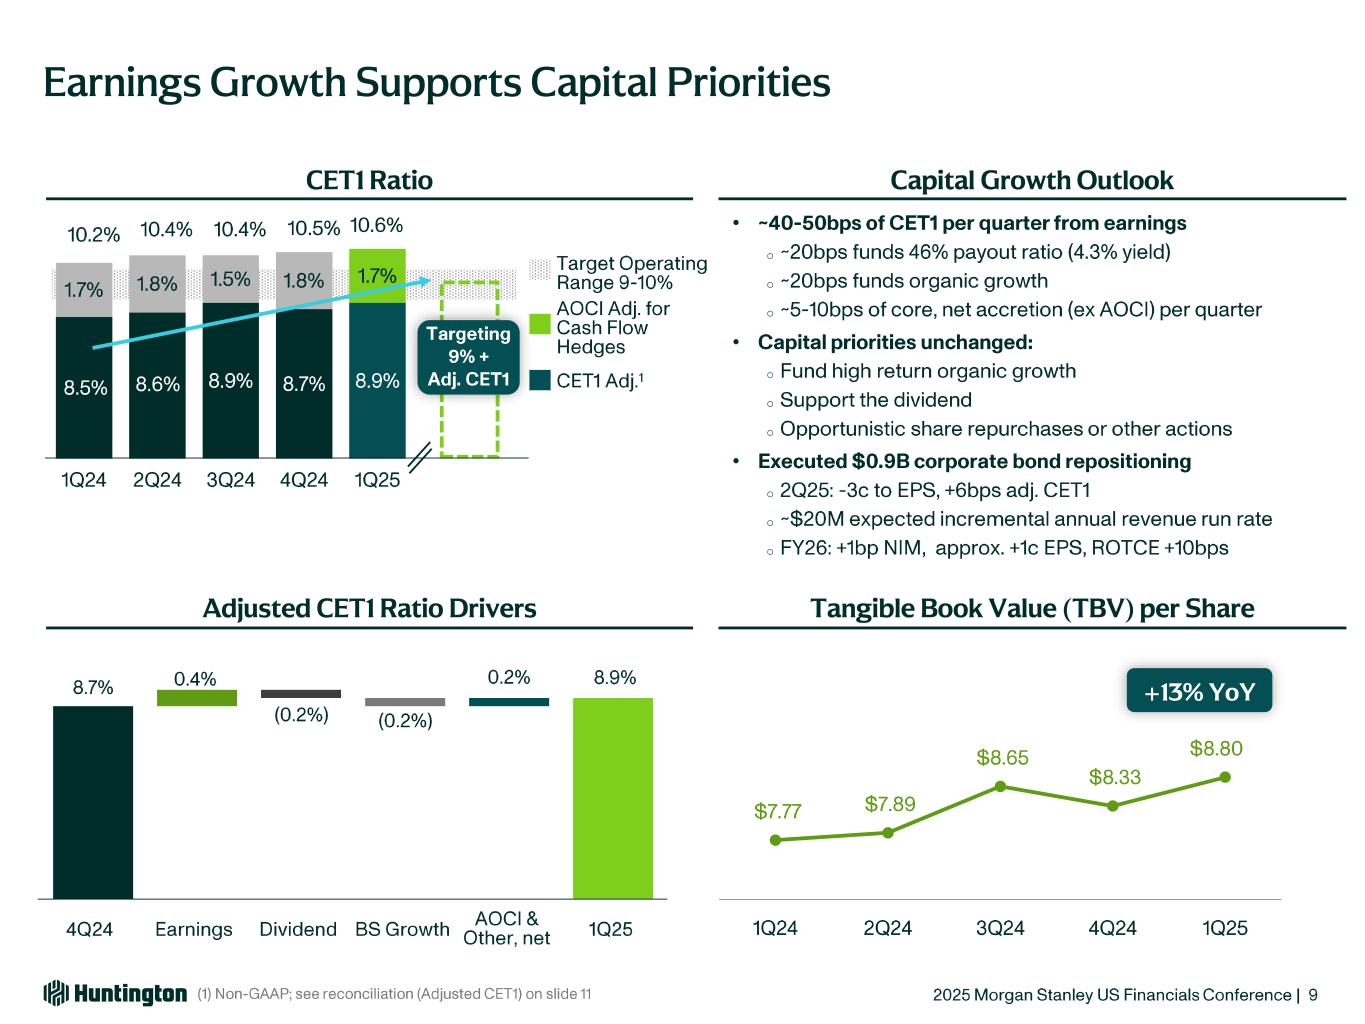
Earnings Growth Supports Capital Priorities • o o o • o o o • o o o CET1 Ratio Adjusted CET1 Ratio Drivers Capital Growth Outlook Tangible Book Value (TBV) per Share +13% YoY
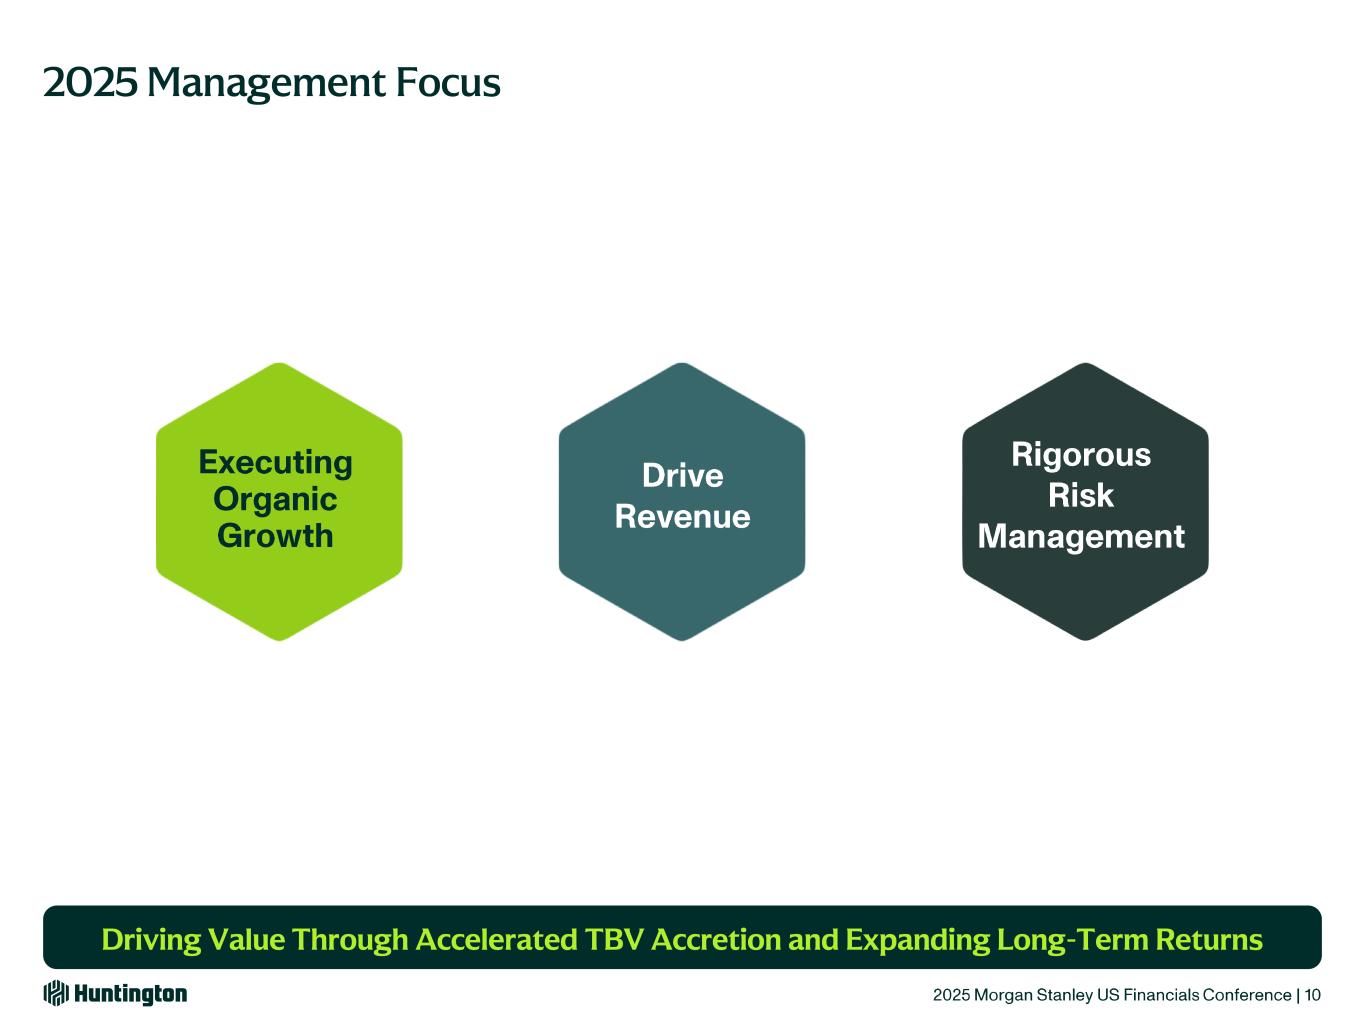
2025 Management Focus Driving Value Through Accelerated TBV Accretion and Expanding Long-Term Returns
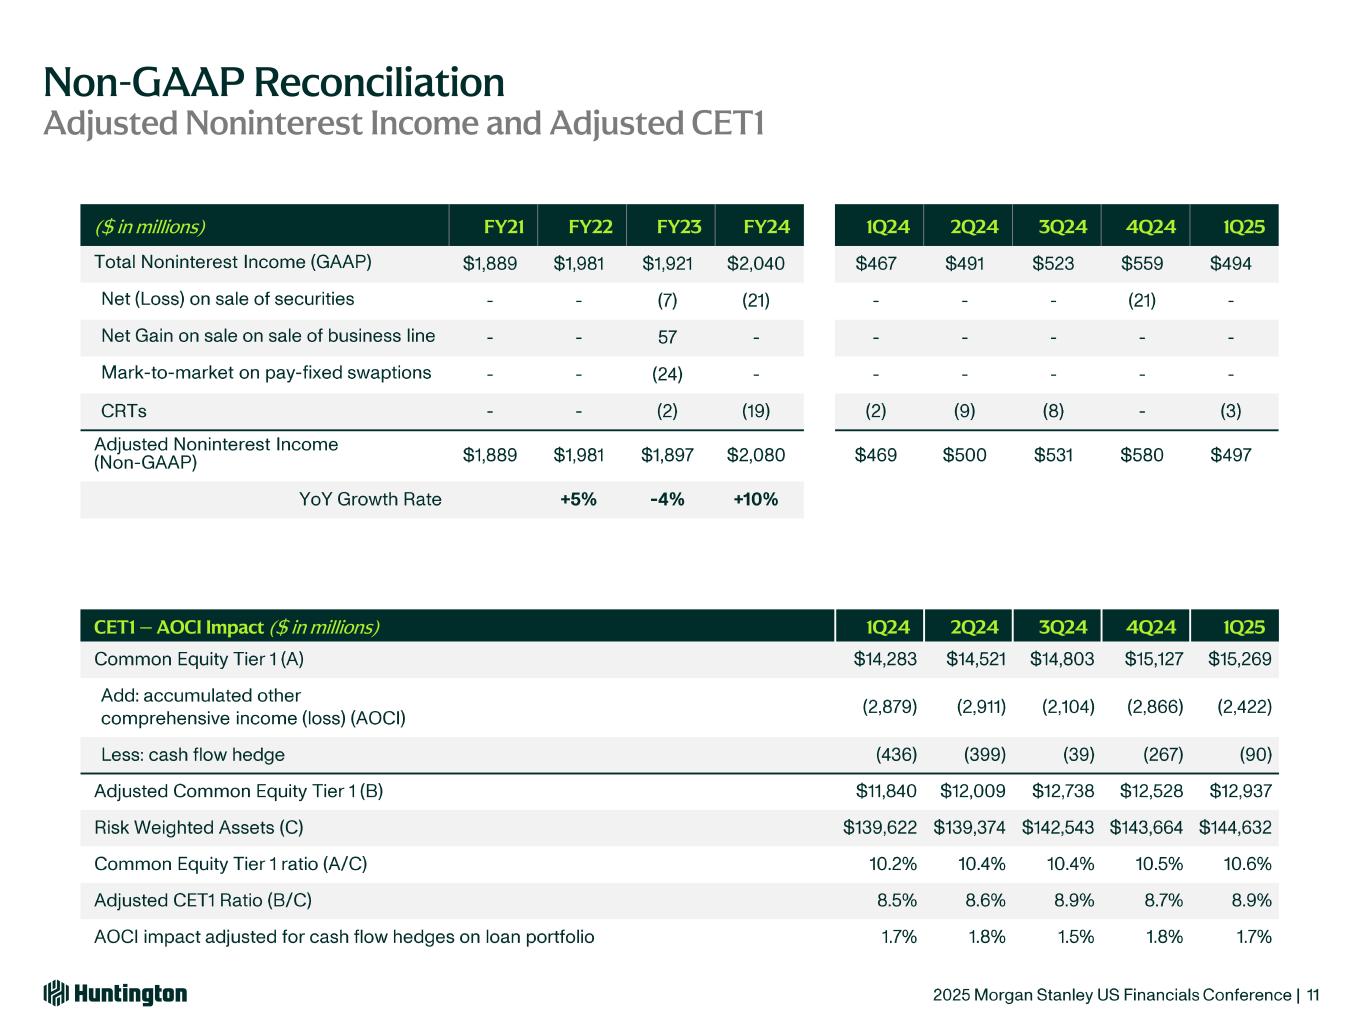
Non-GAAP Reconciliation Adjusted Noninterest Income and Adjusted CET1 ($ in millions) FY21 FY22 FY23 FY24 1Q24 2Q24 3Q24 4Q24 1Q25 CET1 – AOCI Impact ($ in millions) 1Q24 2Q24 3Q24 4Q24 1Q25
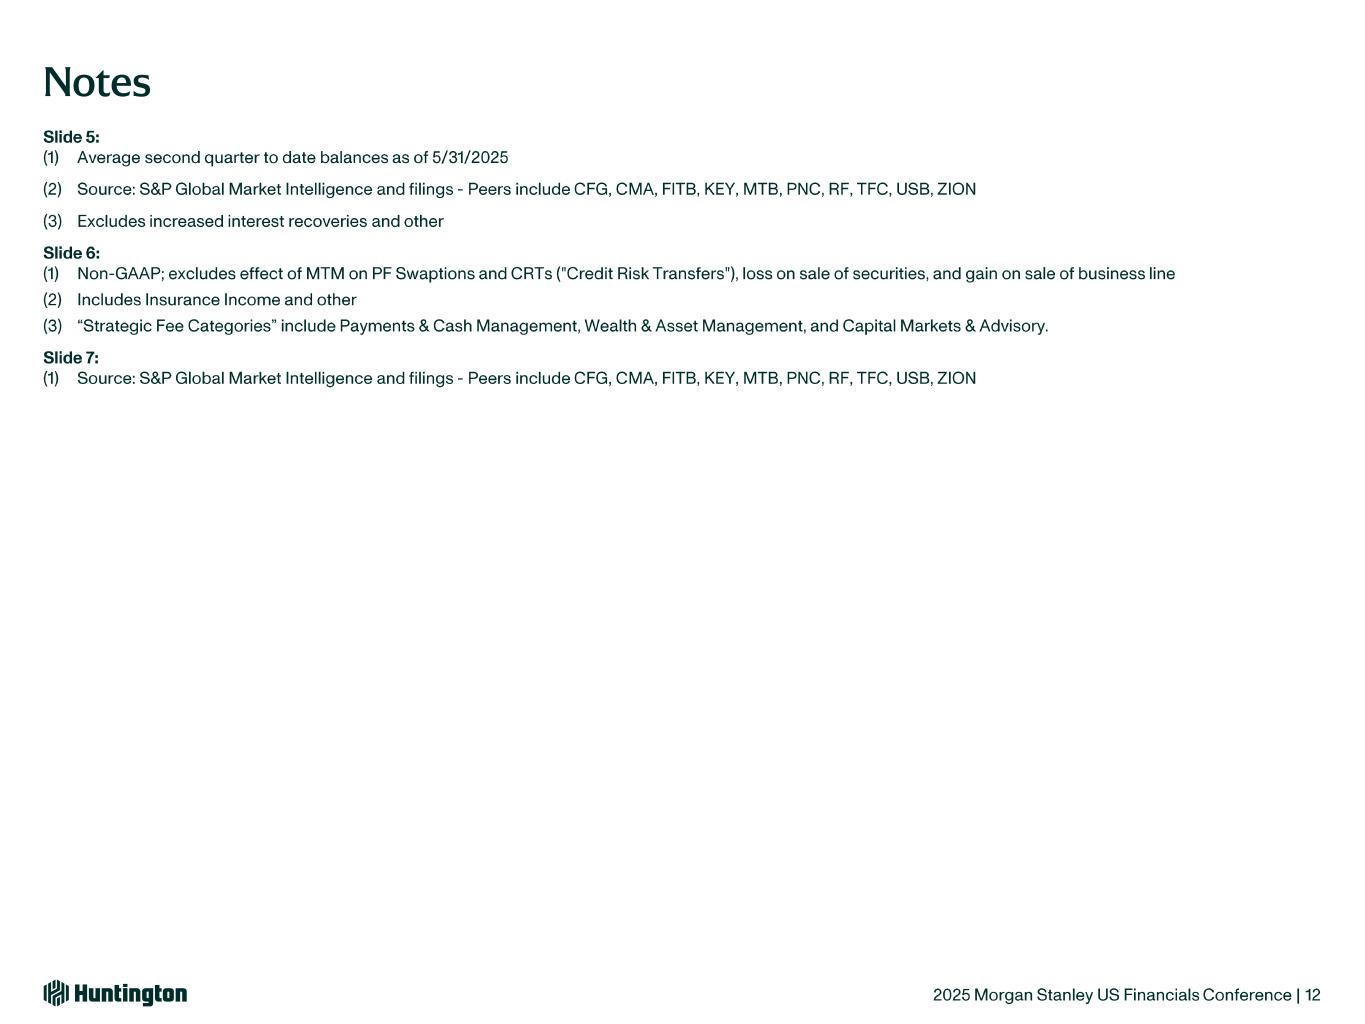
Notes