EXHIBIT 99.1
Published on December 7, 2016

Welcome
©2016 Huntington Bancshares Incorporated. All rights reserved. (NASDAQ: HBAN)
Huntington Bancshares Incorporated
Goldman Sachs US Financial Services Conference
December 7, 2016
Exhibit 99.1
2
Disclaimer
CAUTION REGARDING FORWARD-LOOKING STATEMENTS
This communication contains certain forward-looking statements, including, but not limited to, certain plans, expectations, goals,
projections, and statements, which are not historical facts and are subject to numerous assumptions, risks, and uncertainties.
Statements that do not describe historical or current facts, including statements about beliefs and expectations, are forward-looking
statements. Forward-looking statements may be identified by words such as expect, anticipate, believe, intend, estimate, plan, target,
goal, or similar expressions, or future or conditional verbs such as will, may, might, should, would, could, or similar variations. The
forward-looking statements are intended to be subject to the safe harbor provided by Section 27A of the Securities Act of 1933, Section
21E of the Securities Exchange Act of 1934, and the Private Securities Litigation Reform Act of 1995.
While there is no assurance that any list of risks and uncertainties or risk factors is complete, below are certain factors which could
cause actual results to differ materially from those contained or implied in the forward-looking statements: changes in general economic,
political, or industry conditions; uncertainty in U.S. fiscal and monetary policy, including the interest rate policies of the Federal Reserve
Board; volatility and disruptions in global capital and credit markets; movements in interest rates; competitive pressures on product
pricing and services; success, impact, and timing of our business strategies, including market acceptance of any new products or
services implementing our “Fair Play” banking philosophy; the nature, extent, timing, and results of governmental actions, examinations,
reviews, reforms, regulations, and interpretations, including those related to the Dodd-Frank Wall Street Reform and Consumer
Protection Act and the Basel III regulatory capital reforms, as well as those involving the OCC, Federal Reserve, FDIC, and CFPB; the
possibility that the anticipated benefits of the merger with FirstMerit Corporation are not realized when expected or at all, including as a
result of the impact of, or problems arising from, the integration of the two companies or as a result of the strength of the economy and
competitive factors in the areas where we do business; diversion of management’s attention from ongoing business operations and
opportunities; potential adverse reactions or changes to business or employee relationships, including those resulting from the
completion of the merger with FirstMerit Corporation; our ability to complete the integration of FirstMerit Corporation successfully; and
other factors that may affect our future results. Additional factors that could cause results to differ materially from those described above
can be found in our Annual Report on Form 10-K for the year ended December 31, 2015 and our subsequent Quarterly Reports on Form
10-Q, including for the quarters ended March 31, 2016, June 30, 2016, and September 30, 2016, each of which is on file with the
Securities and Exchange Commission (the “SEC”) and available in the “Investor Relations” section of our website,
http://www.huntington.com, under the heading “Publications and Filings” and in other documents we file with the SEC.
All forward-looking statements speak only as of the date they are made and are based on information available at that time. We do not
assume any obligation to update forward-looking statements to reflect circumstances or events that occur after the date the forward-
looking statements were made or to reflect the occurrence of unanticipated events except as required by federal securities laws. As
forward-looking statements involve significant risks and uncertainties, caution should be exercised against placing undue reliance on
such statements.
3
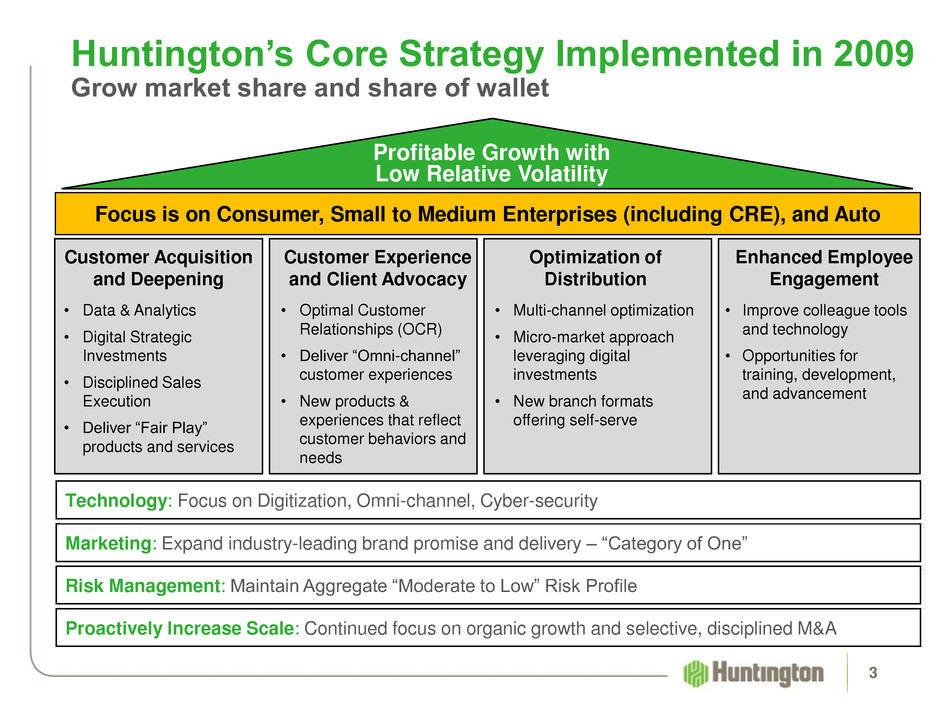
Huntington’s Core Strategy Implemented in 2009
Grow market share and share of wallet
Marketing: Expand industry-leading brand promise and delivery – “Category of One”
Technology: Focus on Digitization, Omni-channel, Cyber-security
Profitable Growth with
Low Relative Volatility
Customer Experience
and Client Advocacy
Optimization of
Distribution
Enhanced Employee
Engagement
Customer Acquisition
and Deepening
• Multi-channel optimization
• Micro-market approach
leveraging digital
investments
• New branch formats
offering self-serve
• Optimal Customer
Relationships (OCR)
• Deliver “Omni-channel”
customer experiences
• New products &
experiences that reflect
customer behaviors and
needs
Risk Management: Maintain Aggregate “Moderate to Low” Risk Profile
• Improve colleague tools
and technology
• Opportunities for
training, development,
and advancement
• Data & Analytics
• Digital Strategic
Investments
• Disciplined Sales
Execution
• Deliver “Fair Play”
products and services
Proactively Increase Scale: Continued focus on organic growth and selective, disciplined M&A
Focus is on Consumer, Small to Medium Enterprises (including CRE), and Auto
4
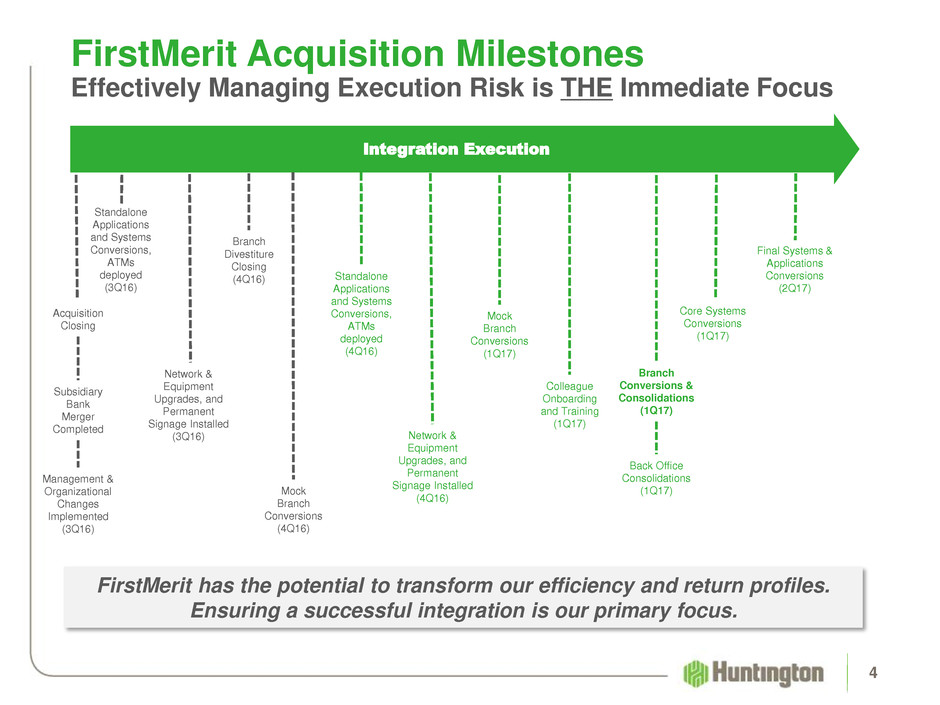
FirstMerit Acquisition Milestones
Effectively Managing Execution Risk is THE Immediate Focus
Back Office
Consolidations
(1Q17)
Acquisition
Closing
Integration Execution
Branch
Divestiture
Closing
(4Q16)
Network &
Equipment
Upgrades, and
Permanent
Signage Installed
(4Q16)
Standalone
Applications
and Systems
Conversions,
ATMs
deployed
(3Q16)
Subsidiary
Bank
Merger
Completed
FirstMerit has the potential to transform our efficiency and return profiles.
Ensuring a successful integration is our primary focus.
Mock
Branch
Conversions
(4Q16)
Colleague
Onboarding
and Training
(1Q17)
Final Systems &
Applications
Conversions
(2Q17)
Management &
Organizational
Changes
Implemented
(3Q16)
Branch
Conversions &
Consolidations
(1Q17)
Core Systems
Conversions
(1Q17)
Network &
Equipment
Upgrades, and
Permanent
Signage Installed
(3Q16)
Standalone
Applications
and Systems
Conversions,
ATMs
deployed
(4Q16)
Mock
Branch
Conversions
(1Q17)
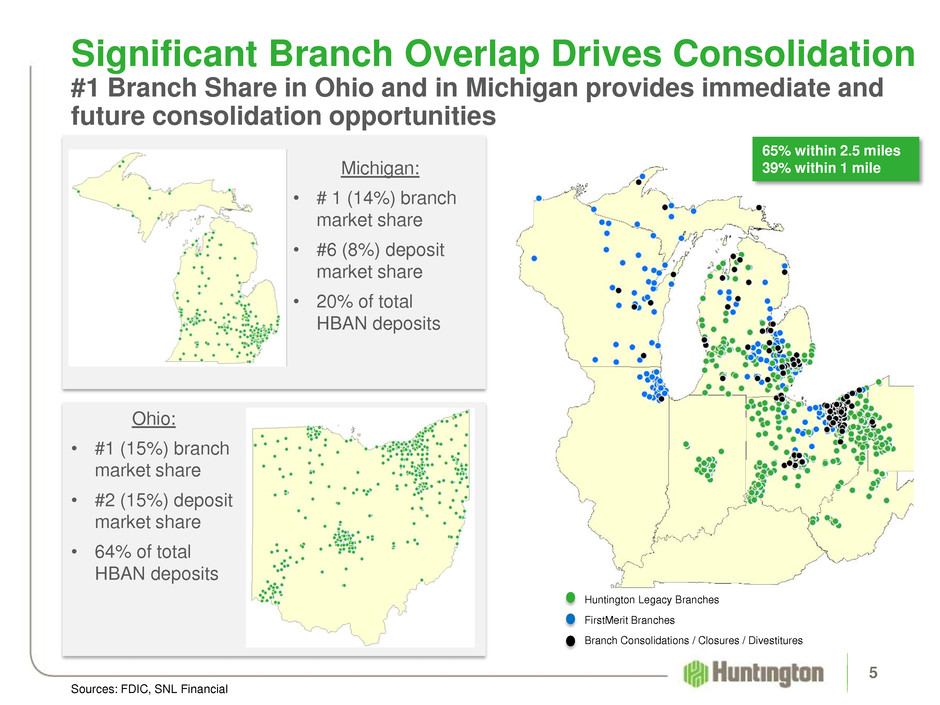
Significant Branch Overlap Drives Consolidation
#1 Branch Share in Ohio and in Michigan provides immediate and
future consolidation opportunities
5
Michigan:
• # 1 (14%) branch
market share
• #6 (8%) deposit
market share
• 20% of total
HBAN deposits
Sources: FDIC, SNL Financial
Ohio:
• #1 (15%) branch
market share
• #2 (15%) deposit
market share
• 64% of total
HBAN deposits
Huntington Legacy Branches
FirstMerit Branches
Branch Consolidations / Closures / Divestitures
65% within 2.5 miles
39% within 1 mile
Implementation of Cost Savings on Pace
6
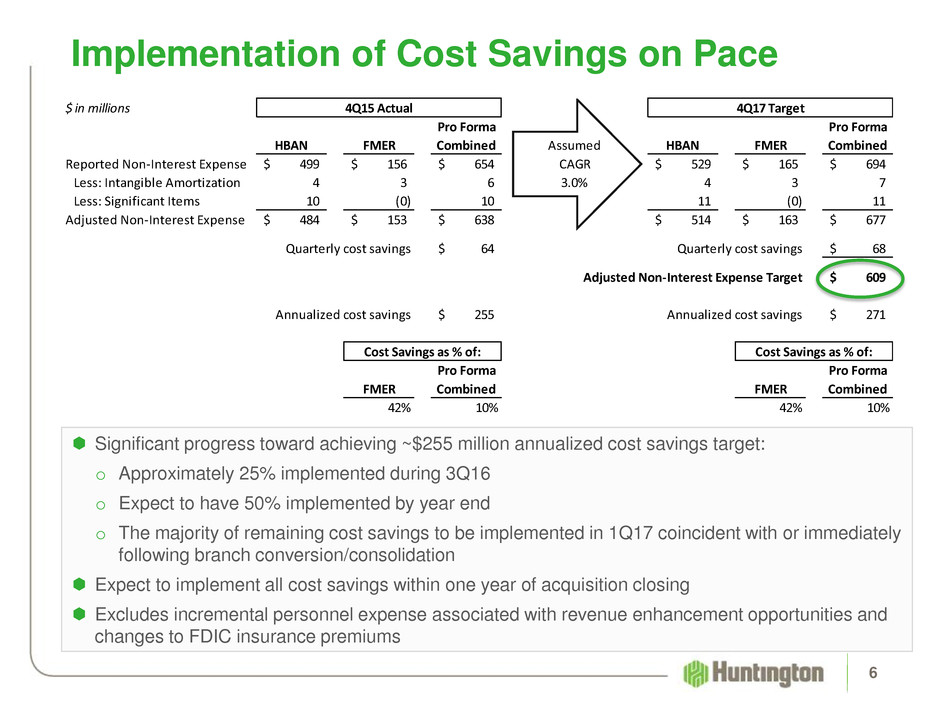
Significant progress toward achieving ~$255 million annualized cost savings target:
o Approximately 25% implemented during 3Q16
o Expect to have 50% implemented by year end
o The majority of remaining cost savings to be implemented in 1Q17 coincident with or immediately
following branch conversion/consolidation
Expect to implement all cost savings within one year of acquisition closing
Excludes incremental personnel expense associated with revenue enhancement opportunities and
changes to FDIC insurance premiums
$ in millions 4Q15 Actual 4Q17 Target
Pro Forma Pro Forma
HBAN FMER Combined Assumed HBAN FMER Combined
Reported Non-Interest Expense 499$ 156$ 654$ CAGR 529$ 165$ 694$
Less: Intangible Amortization 4 3 6 3.0% 4 3 7
Less: Significant Items 10 (0) 10 11 (0) 11
Adjusted Non-Interest Expense 484$ 153$ 638$ 514$ 163$ 677$
Quarterly cost savings 64$ Quarterly cost savings 68$
Adjusted Non-Interest Expense Target 609$
Annualized cost savings 255$ Annualized cost savings 271$
Cost Savings as % of: Cost Savings as % of:
Pro Forma Pro Forma
FMER Combined FMER Combined
42% 10% 42% 10%
7
L-T
Goal
3Q16
(GAAP)
3Q16
Adjusted (1)
(Non-GAAP)
2018
Target
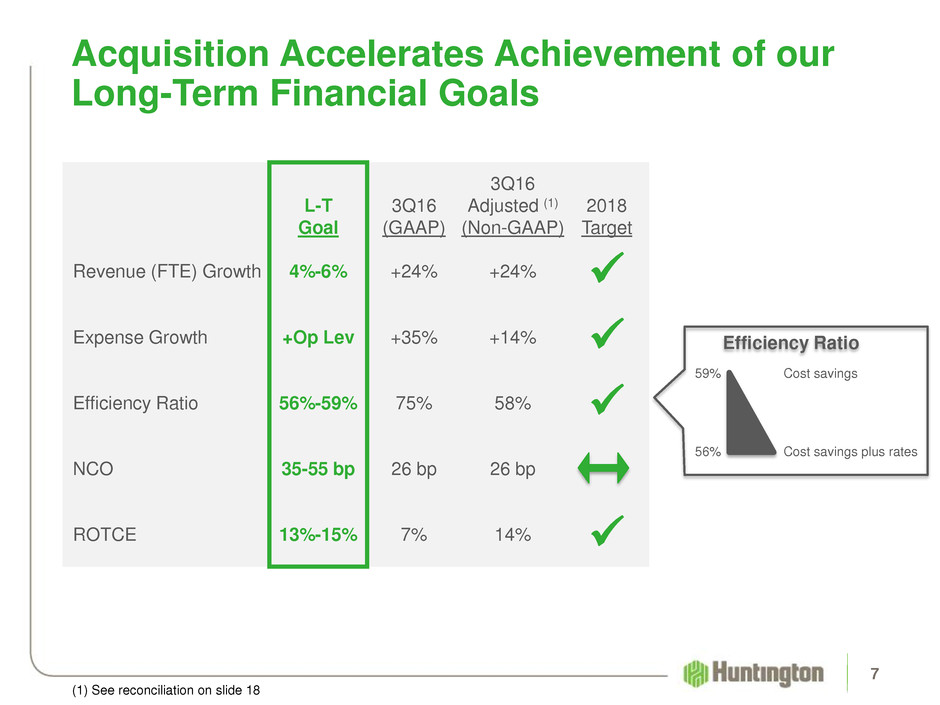
Revenue (FTE) Growth 4%-6% +24% +24%
Expense Growth +Op Lev +35% +14%
Efficiency Ratio 56%-59% 75% 58%
NCO 35-55 bp 26 bp 26 bp
ROTCE 13%-15% 7% 14%
Acquisition Accelerates Achievement of our
Long-Term Financial Goals
59% Cost savings
56% Cost savings plus rates
Efficiency Ratio
(1) See reconciliation on slide 18
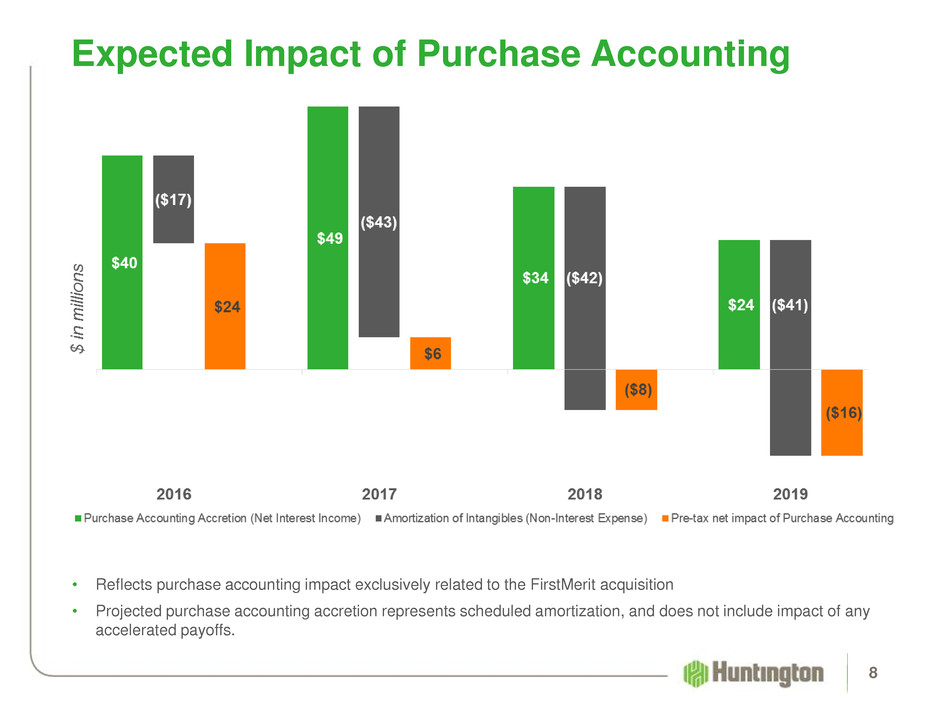
Expected Impact of Purchase Accounting
8
• Reflects purchase accounting impact exclusively related to the FirstMerit acquisition
• Projected purchase accounting accretion represents scheduled amortization, and does not include impact of any
accelerated payoffs.
9
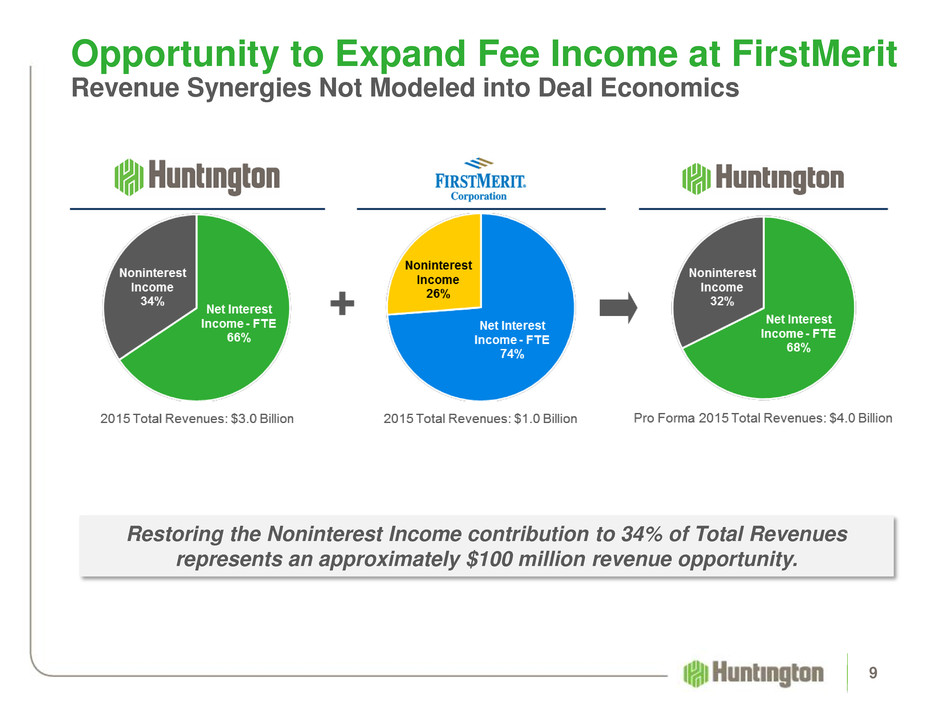
Opportunity to Expand Fee Income at FirstMerit
Revenue Synergies Not Modeled into Deal Economics
Restoring the Noninterest Income contribution to 34% of Total Revenues
represents an approximately $100 million revenue opportunity.
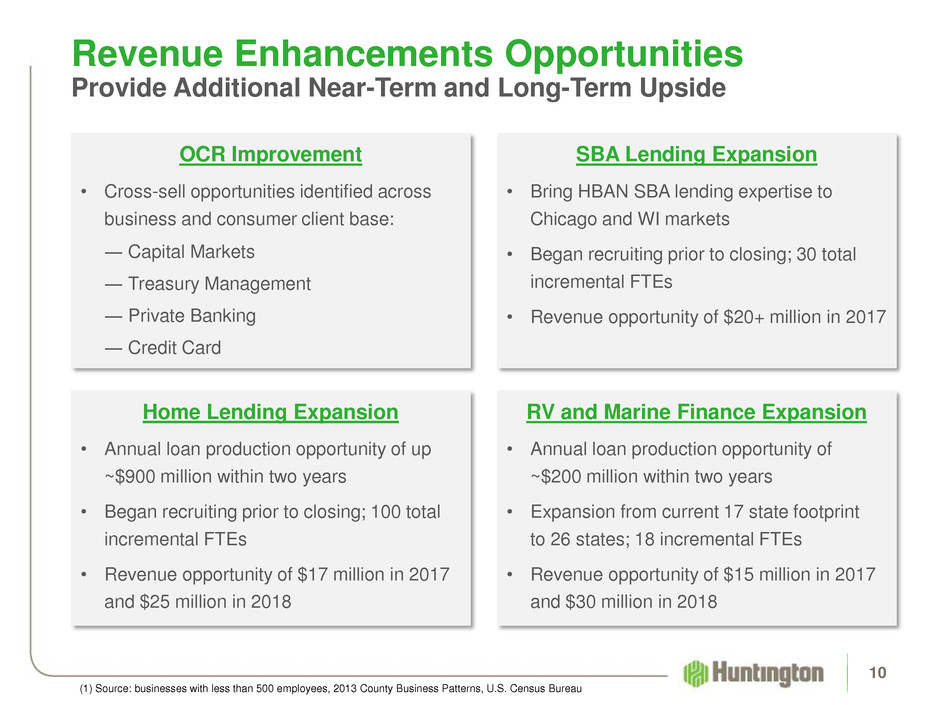
Revenue Enhancements Opportunities
Provide Additional Near-Term and Long-Term Upside
10
(1) Source: businesses with less than 500 employees, 2013 County Business Patterns, U.S. Census Bureau
Home Lending Expansion
• Annual loan production opportunity of up
~$900 million within two years
• Began recruiting prior to closing; 100 total
incremental FTEs
• Revenue opportunity of $17 million in 2017
and $25 million in 2018
OCR Improvement
• Cross-sell opportunities identified across
business and consumer client base:
― Capital Markets
― Treasury Management
― Private Banking
― Credit Card
SBA Lending Expansion
• Bring HBAN SBA lending expertise to
Chicago and WI markets
• Began recruiting prior to closing; 30 total
incremental FTEs
• Revenue opportunity of $20+ million in 2017
RV and Marine Finance Expansion
• Annual loan production opportunity of
~$200 million within two years
• Expansion from current 17 state footprint
to 26 states; 18 incremental FTEs
• Revenue opportunity of $15 million in 2017
and $30 million in 2018
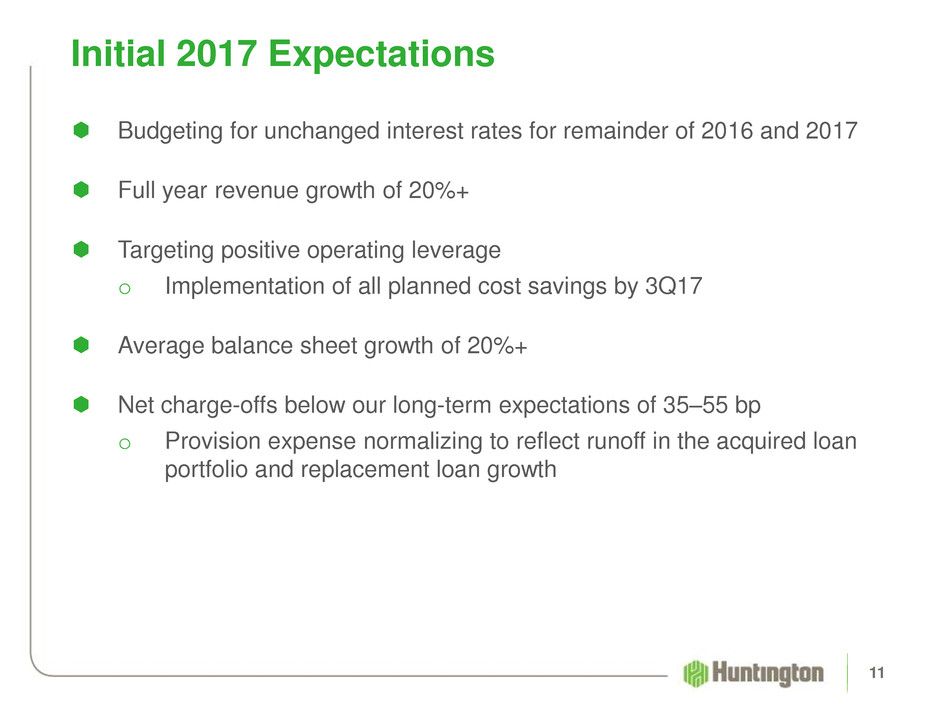
Budgeting for unchanged interest rates for remainder of 2016 and 2017
Full year revenue growth of 20%+
Targeting positive operating leverage
o Implementation of all planned cost savings by 3Q17
Average balance sheet growth of 20%+
Net charge-offs below our long-term expectations of 35–55 bp
o Provision expense normalizing to reflect runoff in the acquired loan
portfolio and replacement loan growth
11
Initial 2017 Expectations
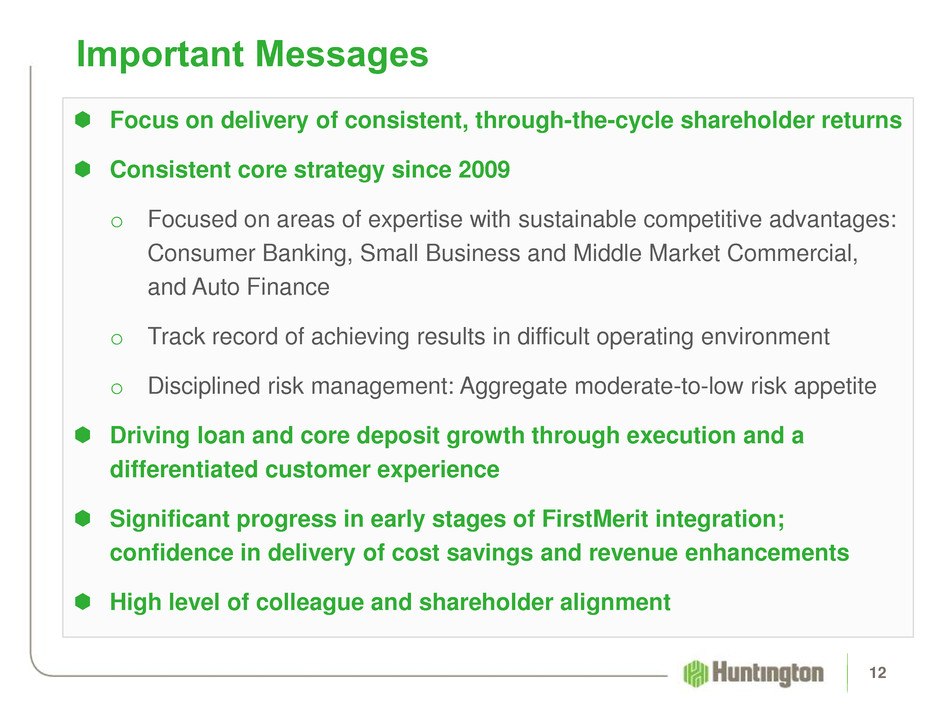
Focus on delivery of consistent, through-the-cycle shareholder returns
Consistent core strategy since 2009
o Focused on areas of expertise with sustainable competitive advantages:
Consumer Banking, Small Business and Middle Market Commercial,
and Auto Finance
o Track record of achieving results in difficult operating environment
o Disciplined risk management: Aggregate moderate-to-low risk appetite
Driving loan and core deposit growth through execution and a
differentiated customer experience
Significant progress in early stages of FirstMerit integration;
confidence in delivery of cost savings and revenue enhancements
High level of colleague and shareholder alignment
Important Messages
12
Appendix
13
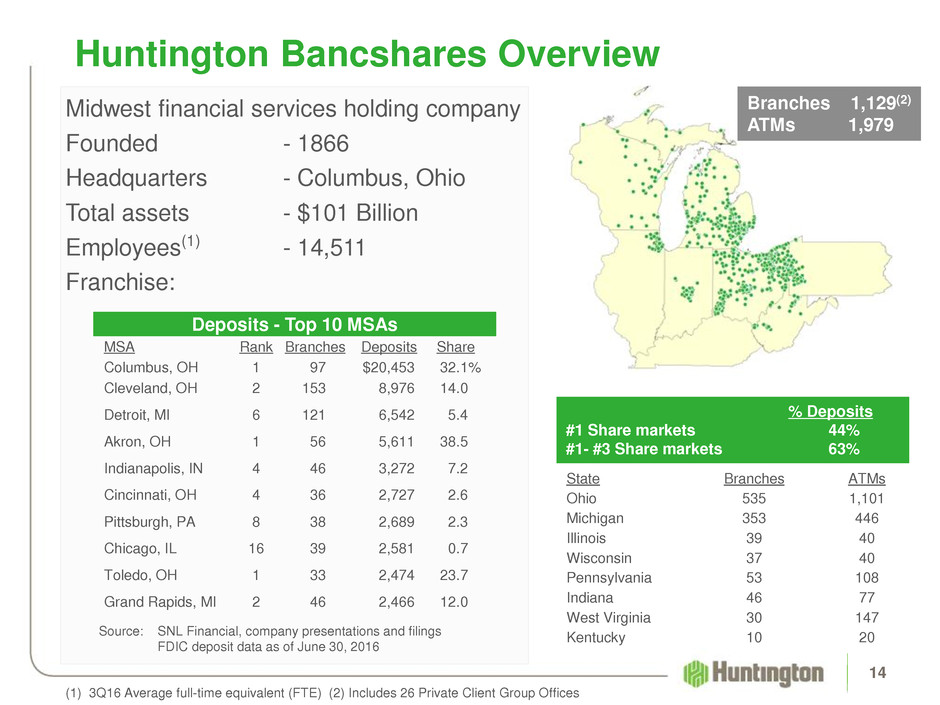
Huntington Bancshares Overview
Midwest financial services holding company
Founded - 1866
Headquarters - Columbus, Ohio
Total assets - $101 Billion
Employees(1) - 14,511
Franchise:
14
(1) 3Q16 Average full-time equivalent (FTE) (2) Includes 26 Private Client Group Offices
Branches 1,129(2)
ATMs 1,979
% Deposits
#1 Share markets 44%
#1- #3 Share markets 63%
State Branches ATMs
Ohio 535 1,101
Michigan 353 446
Illinois 39 40
Wisconsin 37 40
Pennsylvania 53 108
Indiana 46 77
West Virginia 30 147
Kentucky 10 20
MSA Rank Branches Deposits Share
Columbus, OH 1 97 $20,453 32.1%
Cleveland, OH 2 153 8,976 14.0
Detroit, MI 6 121 6,542 5.4
Akron, OH 1 56 5,611 38.5
Indianapolis, IN 4 46 3,272 7.2
Cincinnati, OH 4 36 2,727 2.6
Pittsburgh, PA 8 38 2,689 2.3
Chicago, IL 16 39 2,581 0.7
Toledo, OH 1 33 2,474 23.7
Grand Rapids, MI 2 46 2,466 12.0
Deposits - Top 10 MSAs
Source: SNL Financial, company presentations and filings
FDIC deposit data as of June 30, 2016
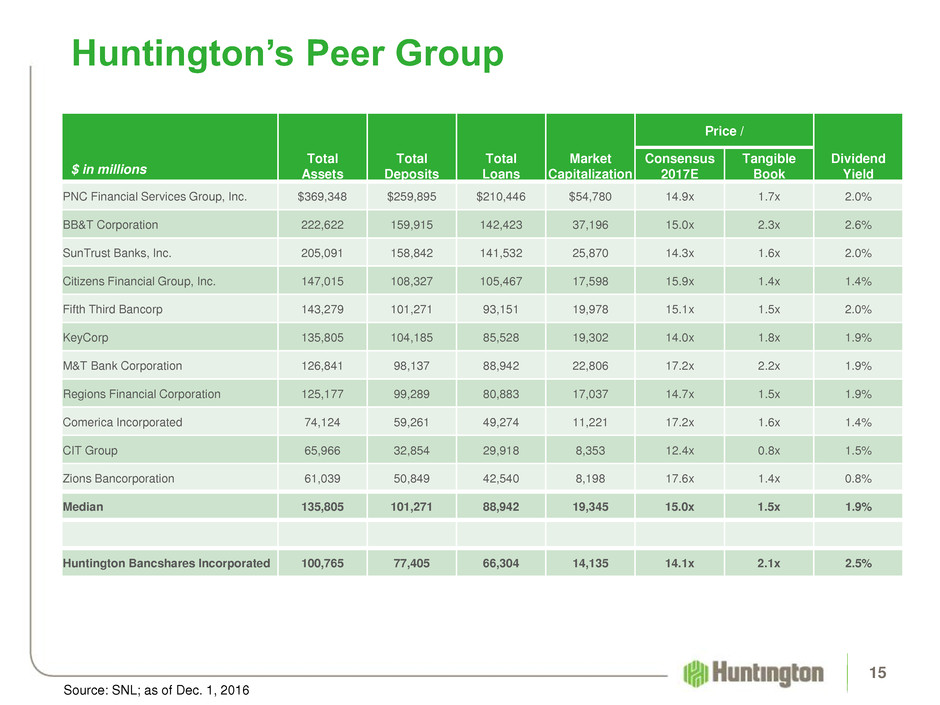
Huntington’s Peer Group
15
$ in millions
Total
Assets
Total
Deposits
Total
Loans
Market
Capitalization
Price /
Dividend
Yield
Consensus
2017E
Tangible
Book
PNC Financial Services Group, Inc. $369,348 $259,895 $210,446 $54,780 14.9x 1.7x 2.0%
BB&T Corporation 222,622 159,915 142,423 37,196 15.0x 2.3x 2.6%
SunTrust Banks, Inc. 205,091 158,842 141,532 25,870 14.3x 1.6x 2.0%
Citizens Financial Group, Inc. 147,015 108,327 105,467 17,598 15.9x 1.4x 1.4%
Fifth Third Bancorp 143,279 101,271 93,151 19,978 15.1x 1.5x 2.0%
KeyCorp 135,805 104,185 85,528 19,302 14.0x 1.8x 1.9%
M&T Bank Corporation 126,841 98,137 88,942 22,806 17.2x 2.2x 1.9%
Regions Financial Corporation 125,177 99,289 80,883 17,037 14.7x 1.5x 1.9%
Comerica Incorporated 74,124 59,261 49,274 11,221 17.2x 1.6x 1.4%
CIT Group 65,966 32,854 29,918 8,353 12.4x 0.8x 1.5%
Zions Bancorporation 61,039 50,849 42,540 8,198 17.6x 1.4x 0.8%
Median 135,805 101,271 88,942 19,345 15.0x 1.5x 1.9%
Huntington Bancshares Incorporated 100,765 77,405 66,304 14,135 14.1x 2.1x 2.5%
Source: SNL; as of Dec. 1, 2016
16
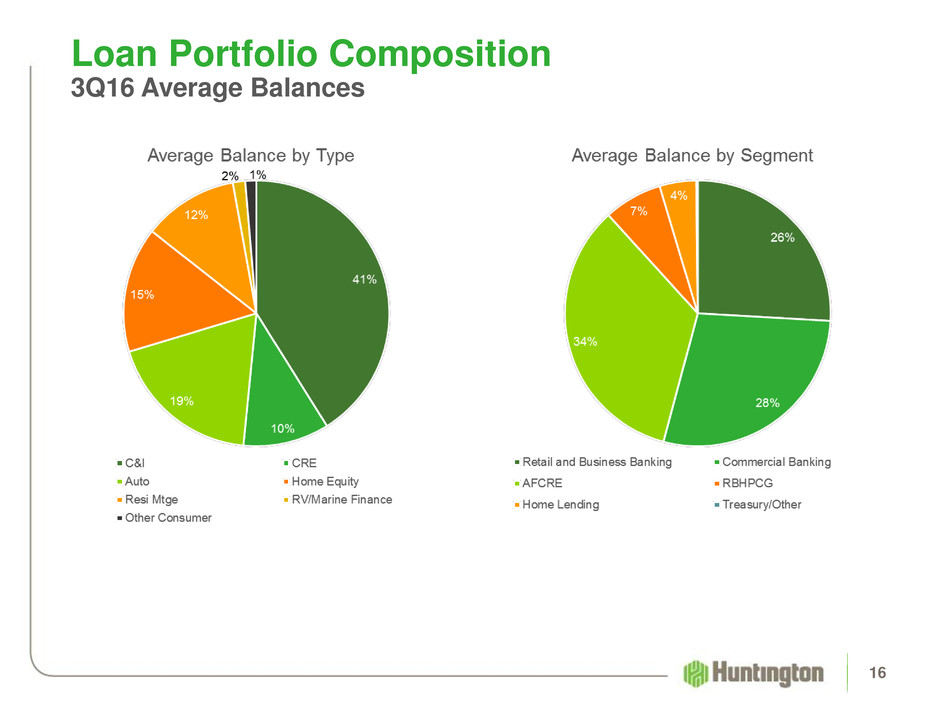
Loan Portfolio Composition
3Q16 Average Balances
17
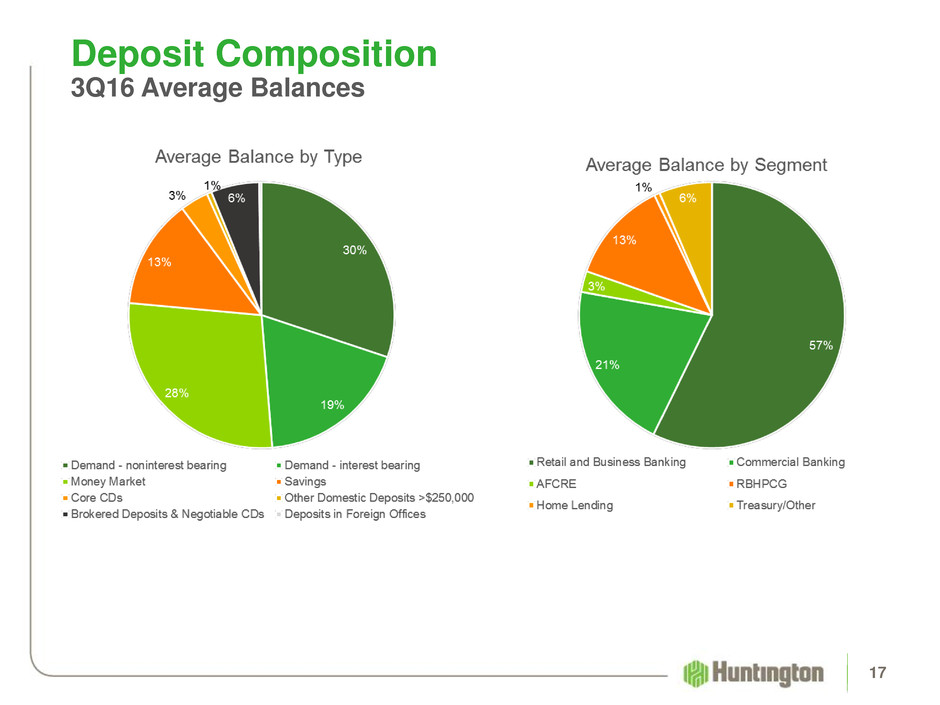
Deposit Composition
3Q16 Average Balances
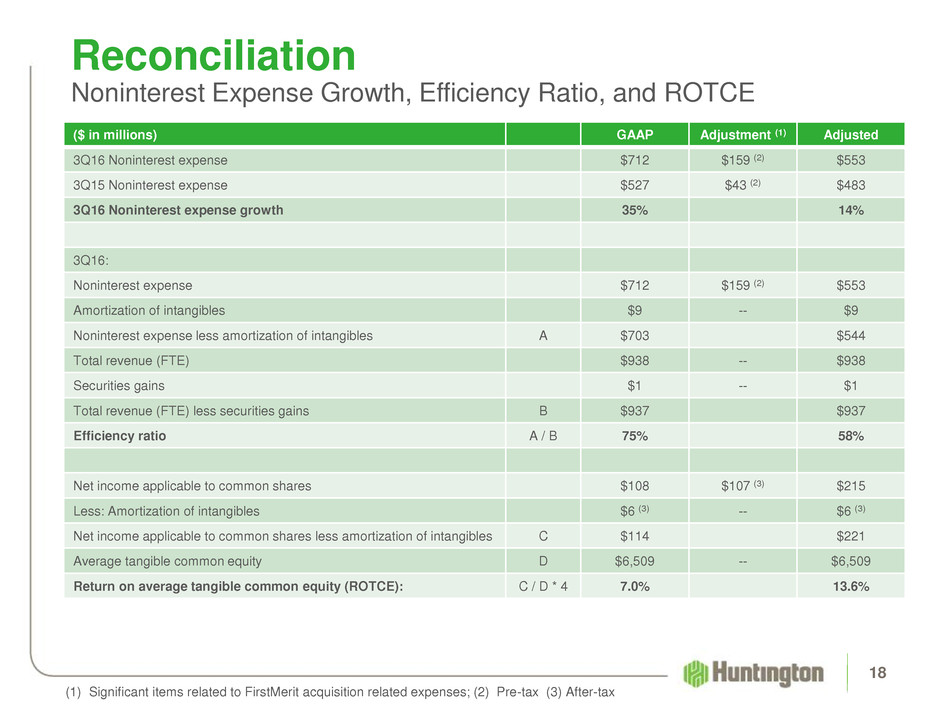
Reconciliation
Noninterest Expense Growth, Efficiency Ratio, and ROTCE
18
($ in millions) GAAP Adjustment (1) Adjusted
3Q16 Noninterest expense $712 $159 (2) $553
3Q15 Noninterest expense $527 $43 (2) $483
3Q16 Noninterest expense growth 35% 14%
3Q16:
Noninterest expense $712 $159 (2) $553
Amortization of intangibles $9 -- $9
Noninterest expense less amortization of intangibles A $703 $544
Total revenue (FTE) $938 -- $938
Securities gains $1 -- $1
Total revenue (FTE) less securities gains B $937 $937
Efficiency ratio A / B 75% 58%
Net income applicable to common shares $108 $107 (3) $215
Less: Amortization of intangibles $6 (3) -- $6 (3)
Net income applicable to common shares less amortization of intangibles C $114 $221
Average tangible common equity D $6,509 -- $6,509
Return on average tangible common equity (ROTCE): C / D * 4 7.0% 13.6%
(1) Significant items related to FirstMerit acquisition related expenses; (2) Pre-tax (3) After-tax

Welcome
©2016 Huntington Bancshares Incorporated. All rights reserved. (NASDAQ: HBAN)
Mark A. Muth
Director of Investor Relations
Office: 614.480.4720
E-mail: mark.muth@huntington.com