EX-99.1
Published on November 16, 2012
Exhibit 99.1

| 2012 Fourth Quarter Investor Handout 1 November 16, 2012 |
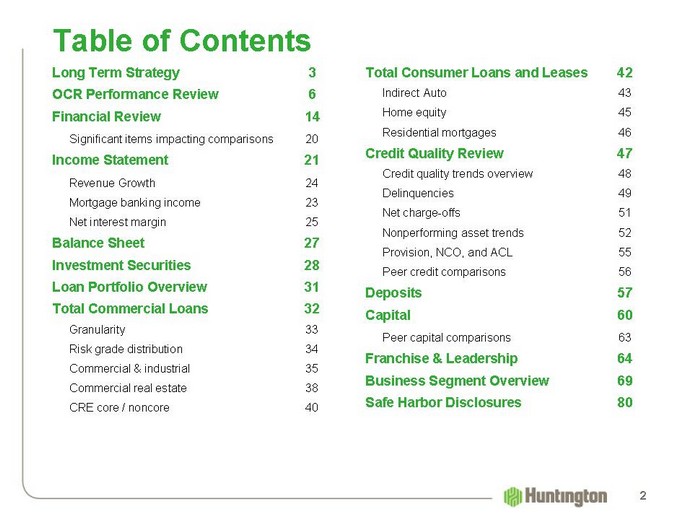
| Table of Contents Long Term Strategy 3 OCR Performance Review 6 Financial Review 14 Significant items impacting comparisons 20 Income Statement 21 Revenue Growth 24 Mortgage banking income 23 Net interest margin 25 Balance Sheet 27 Investment Securities 28 Loan Portfolio Overview 31 Total Commercial Loans 32 Granularity 33 Risk grade distribution 34 Commercial & industrial 35 Commercial real estate 38 CRE core / noncore 40 Total Consumer Loans and Leases 42 Indirect Auto 43 Home equity 45 Residential mortgages 46 Credit Quality Review 47 Credit quality trends overview 48 Delinquencies 49 Net charge-offs 51 Nonperforming asset trends 52 Provision, NCO, and ACL 55 Peer credit comparisons 56 Deposits 57 Capital 60 Peer capital comparisons 63 Franchise & Leadership 64 Business Segment Overview 69 Safe Harbor Disclosures 80 2 |

| Long Term Strategy 3 |
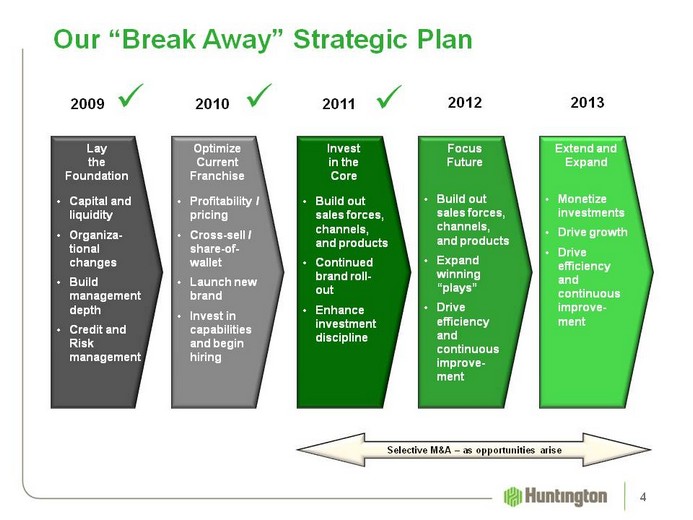
| Optimize Current Franchise Profitability / pricing Cross-sell / share-of-wallet Launch new brand Invest in capabilities and begin hiring Our "Break Away" Strategic Plan 4 Lay the Foundation Capital and liquidity Organiza-tional changes Build management depth Credit and Risk management Invest in the Core Build out sales forces, channels, and products Continued brand roll-out Enhance investment discipline Selective M&A - as opportunities arise 2009 Focus Future Build out sales forces, channels, and products Expand winning "plays" Drive efficiency and continuous improve-ment Extend and Expand Monetize investments Drive growth Drive efficiency and continuous improve-ment 2010 2011 2012 2013 |
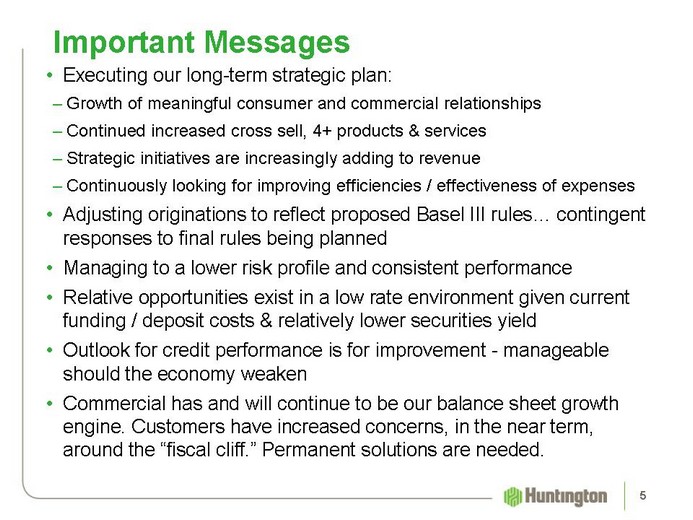
| Important Messages Executing our long-term strategic plan: Growth of meaningful consumer and commercial relationships Continued increased cross sell, 4+ products & services Strategic initiatives are increasingly adding to revenue Continuously looking for improving efficiencies / effectiveness of expenses Adjusting originations to reflect proposed Basel III rules... contingent responses to final rules being planned Managing to a lower risk profile and consistent performance Relative opportunities exist in a low rate environment given current funding / deposit costs & relatively lower securities yield Outlook for credit performance is for improvement - manageable should the economy weaken Commercial has and will continue to be our balance sheet growth engine. Customers have increased concerns, in the near term, around the "fiscal cliff." Permanent solutions are needed. 5 |
| OCR Performance Review 6 |
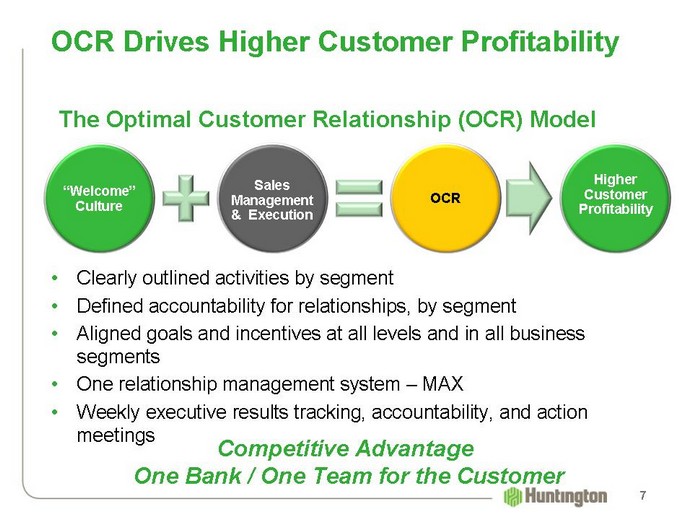
| OCR Drives Higher Customer Profitability Clearly outlined activities by segment Defined accountability for relationships, by segment Aligned goals and incentives at all levels and in all business segments One relationship management system - MAX Weekly executive results tracking, accountability, and action meetings Competitive Advantage One Bank / One Team for the Customer The Optimal Customer Relationship (OCR) Model "Welcome" Culture Sales Management & Execution OCR Higher Customer Profitability 7 |
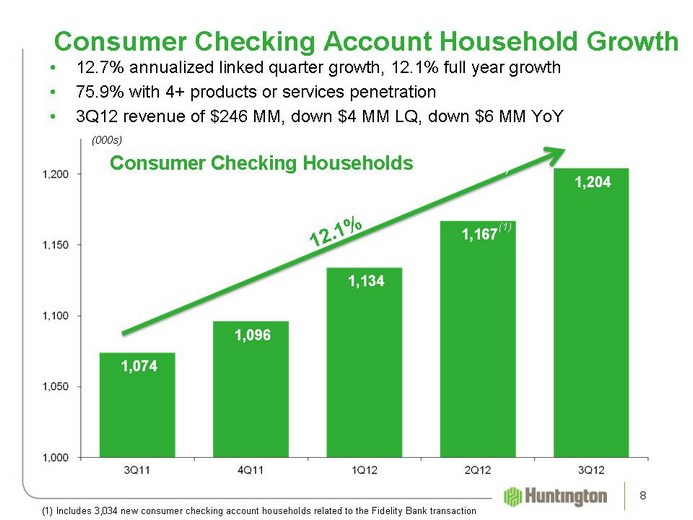
| Consumer Checking Account Household Growth 12.7% annualized linked quarter growth, 12.1% full year growth 75.9% with 4+ products or services penetration 3Q12 revenue of $246 MM, down $4 MM LQ, down $6 MM YoY Consumer Checking Households 12.1% (000s) 8 (1) Includes 3,034 new consumer checking account households related to the Fidelity Bank transaction (1) |
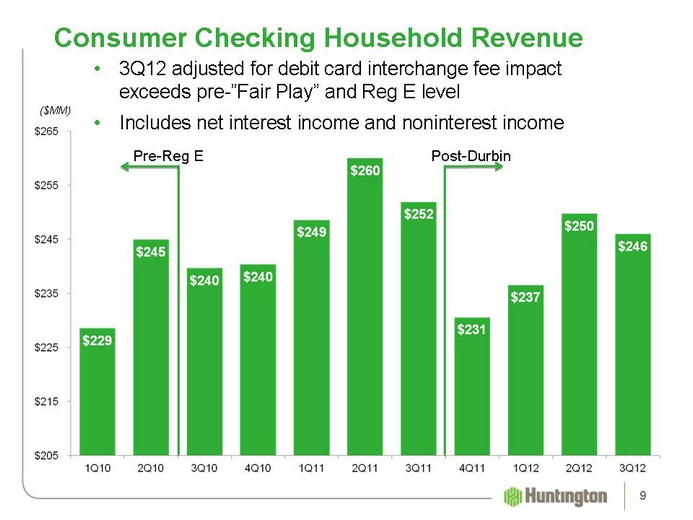
| Consumer Checking Household Revenue ($MM) 9 Pre-Reg E 3Q12 adjusted for debit card interchange fee impact exceeds pre-"Fair Play" and Reg E level Includes net interest income and noninterest income Post-Durbin |
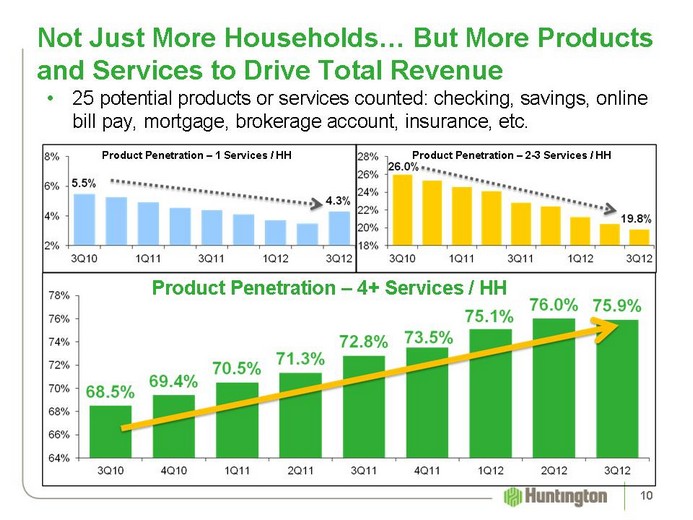
| Product Penetration - 4+ Services / HH Not Just More Households... But More Products and Services to Drive Total Revenue 25 potential products or services counted: checking, savings, online bill pay, mortgage, brokerage account, insurance, etc. Product Penetration - 1 Services / HH Product Penetration - 2-3 Services / HH 10 |
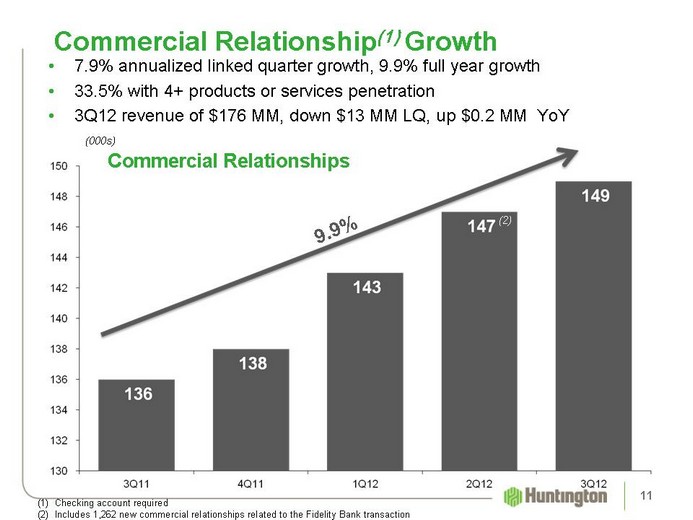
| Commercial Relationship(1) Growth Commercial Relationships 9.9% Checking account required Includes 1,262 new commercial relationships related to the Fidelity Bank transaction 7.9% annualized linked quarter growth, 9.9% full year growth 33.5% with 4+ products or services penetration 3Q12 revenue of $176 MM, down $13 MM LQ, up $0.2 MM YoY (000s) 11 (2) |
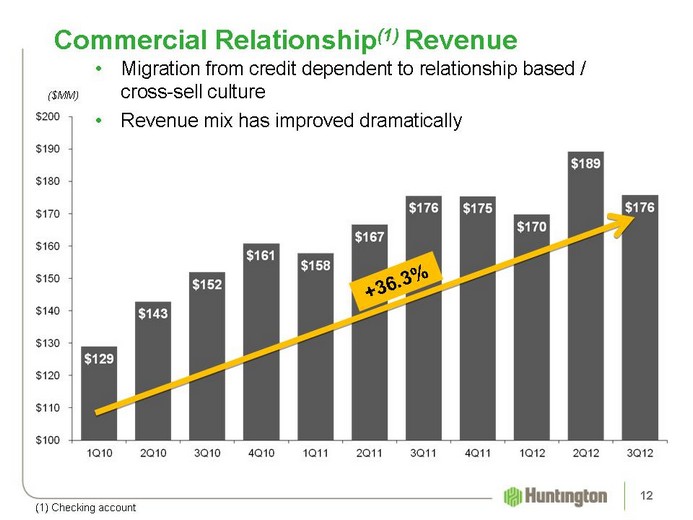
| Migration from credit dependent to relationship based / cross-sell culture Revenue mix has improved dramatically 12 Commercial Relationship(1) Revenue ($MM) +36.3% (1) Checking account |
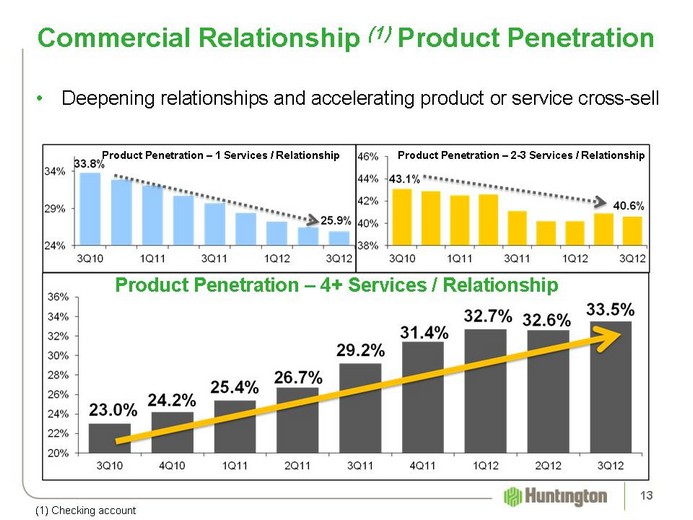
| Product Penetration - 2-3 Services / Relationship Commercial Relationship (1) Product Penetration Product Penetration - 4+ Services / Relationship Deepening relationships and accelerating product or service cross-sell Product Penetration - 1 Services / Relationship 13 (1) Checking account |

| Financial Review 14 |
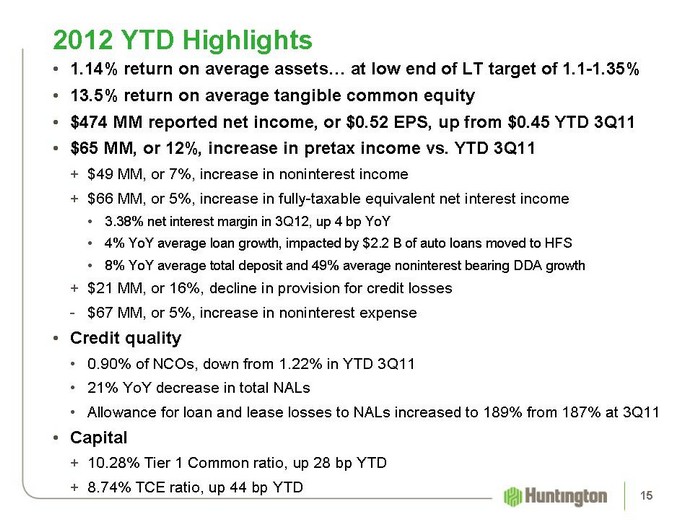
| 1.14% return on average assets... at low end of LT target of 1.1-1.35% 13.5% return on average tangible common equity $474 MM reported net income, or $0.52 EPS, up from $0.45 YTD 3Q11 $65 MM, or 12%, increase in pretax income vs. YTD 3Q11 $49 MM, or 7%, increase in noninterest income $66 MM, or 5%, increase in fully-taxable equivalent net interest income 3.38% net interest margin in 3Q12, up 4 bp YoY 4% YoY average loan growth, impacted by $2.2 B of auto loans moved to HFS 8% YoY average total deposit and 49% average noninterest bearing DDA growth $21 MM, or 16%, decline in provision for credit losses $67 MM, or 5%, increase in noninterest expense Credit quality 0.90% of NCOs, down from 1.22% in YTD 3Q11 21% YoY decrease in total NALs Allowance for loan and lease losses to NALs increased to 189% from 187% at 3Q11 Capital 10.28% Tier 1 Common ratio, up 28 bp YTD 8.74% TCE ratio, up 44 bp YTD 15 2012 YTD Highlights |
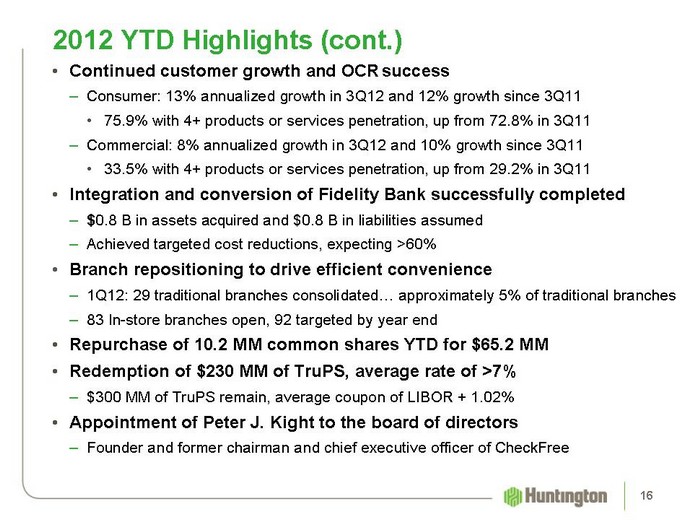
| 16 Continued customer growth and OCR success Consumer: 13% annualized growth in 3Q12 and 12% growth since 3Q11 75.9% with 4+ products or services penetration, up from 72.8% in 3Q11 Commercial: 8% annualized growth in 3Q12 and 10% growth since 3Q11 33.5% with 4+ products or services penetration, up from 29.2% in 3Q11 Integration and conversion of Fidelity Bank successfully completed $0.8 B in assets acquired and $0.8 B in liabilities assumed Achieved targeted cost reductions, expecting >60% Branch repositioning to drive efficient convenience 1Q12: 29 traditional branches consolidated... approximately 5% of traditional branches 83 In-store branches open, 92 targeted by year end Repurchase of 10.2 MM common shares YTD for $65.2 MM Redemption of $230 MM of TruPS, average rate of >7% $300 MM of TruPS remain, average coupon of LIBOR + 1.02% Appointment of Peter J. Kight to the board of directors Founder and former chairman and chief executive officer of CheckFree 2012 YTD Highlights (cont.) |
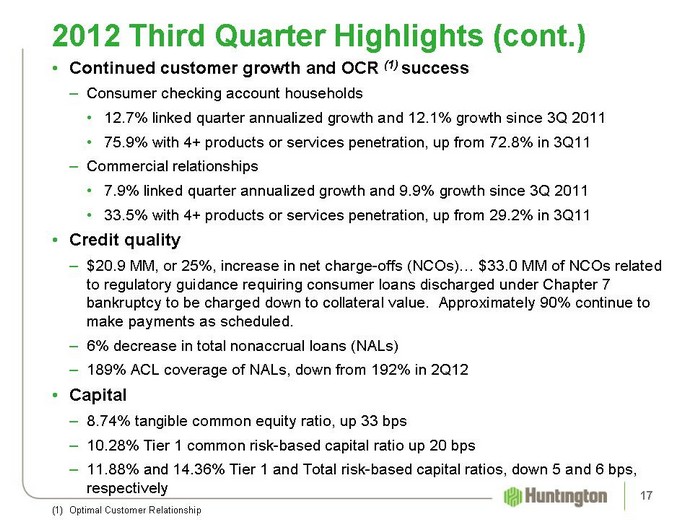
| Continued customer growth and OCR (1) success Consumer checking account households 12.7% linked quarter annualized growth and 12.1% growth since 3Q 2011 75.9% with 4+ products or services penetration, up from 72.8% in 3Q11 Commercial relationships 7.9% linked quarter annualized growth and 9.9% growth since 3Q 2011 33.5% with 4+ products or services penetration, up from 29.2% in 3Q11 Credit quality $20.9 MM, or 25%, increase in net charge-offs (NCOs)... $33.0 MM of NCOs related to regulatory guidance requiring consumer loans discharged under Chapter 7 bankruptcy to be charged down to collateral value. Approximately 90% continue to make payments as scheduled. 6% decrease in total nonaccrual loans (NALs) 189% ACL coverage of NALs, down from 192% in 2Q12 Capital 8.74% tangible common equity ratio, up 33 bps 10.28% Tier 1 common risk-based capital ratio up 20 bps 11.88% and 14.36% Tier 1 and Total risk-based capital ratios, down 5 and 6 bps, respectively 2012 Third Quarter Highlights (cont.) Optimal Customer Relationship 17 |
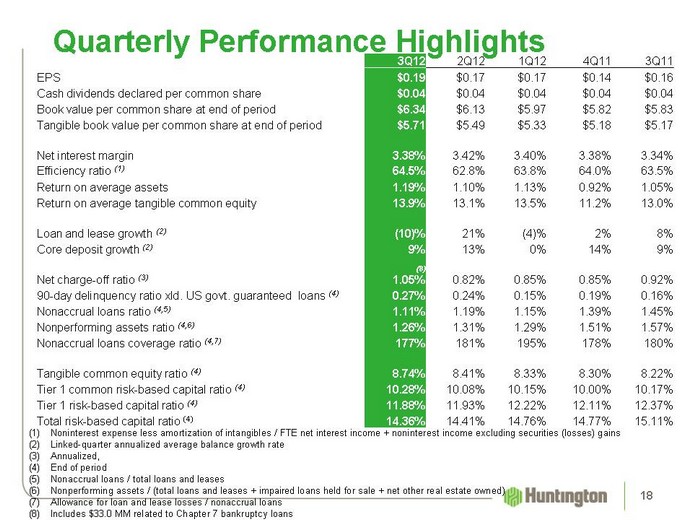
| Quarterly Performance Highlights 3Q12 2Q12 1Q12 4Q11 3Q11 EPS $0.19 $0.17 $0.17 $0.14 $0.16 Cash dividends declared per common share $0.04 $0.04 $0.04 $0.04 $0.04 Book value per common share at end of period $6.34 $6.13 $5.97 $5.82 $5.83 Tangible book value per common share at end of period $5.71 $5.49 $5.33 $5.18 $5.17 Net interest margin 3.38% 3.42% 3.40% 3.38% 3.34% Efficiency ratio (1) 64.5% 62.8% 63.8% 64.0% 63.5% Return on average assets 1.19% 1.10% 1.13% 0.92% 1.05% Return on average tangible common equity 13.9% 13.1% 13.5% 11.2% 13.0% Loan and lease growth (2) (10)% 21% (4)% 2% 8% Core deposit growth (2) 9% 13% 0% 14% 9% Net charge-off ratio (3) 1.05% 0.82% 0.85% 0.85% 0.92% 90-day delinquency ratio xld. US govt. guaranteed loans (4) 0.27% 0.24% 0.15% 0.19% 0.16% Nonaccrual loans ratio (4,5) 1.11% 1.19% 1.15% 1.39% 1.45% Nonperforming assets ratio (4,6) 1.26% 1.31% 1.29% 1.51% 1.57% Nonaccrual loans coverage ratio (4,7) 177% 181% 195% 178% 180% Tangible common equity ratio (4) 8.74% 8.41% 8.33% 8.30% 8.22% Tier 1 common risk-based capital ratio (4) 10.28% 10.08% 10.15% 10.00% 10.17% Tier 1 risk-based capital ratio (4) 11.88% 11.93% 12.22% 12.11% 12.37% Total risk-based capital ratio (4) 14.36% 14.41% 14.76% 14.77% 15.11% (1) Noninterest expense less amortization of intangibles / FTE net interest income + noninterest income excluding securities (losses) gains Linked-quarter annualized average balance growth rate Annualized, End of period Nonaccrual loans / total loans and leases Nonperforming assets / (total loans and leases + impaired loans held for sale + net other real estate owned) Allowance for loan and lease losses / nonaccrual loans Includes $33.0 MM related to Chapter 7 bankruptcy loans 18 (8) |
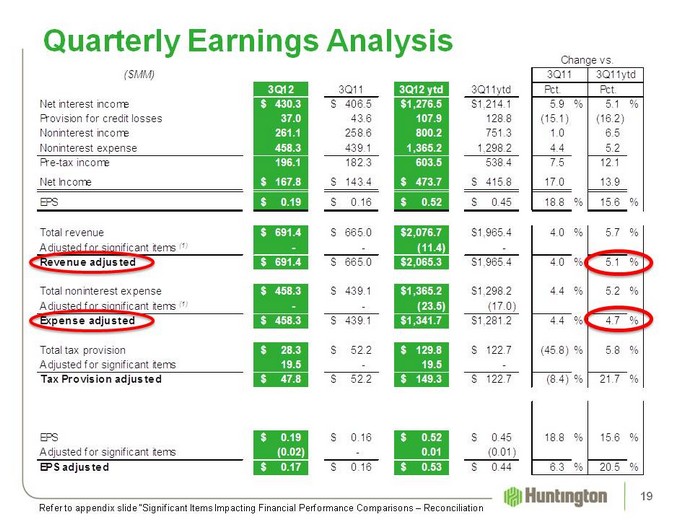
| Quarterly Earnings Analysis 19 Refer to appendix slide "Significant Items Impacting Financial Performance Comparisons - Reconciliation |
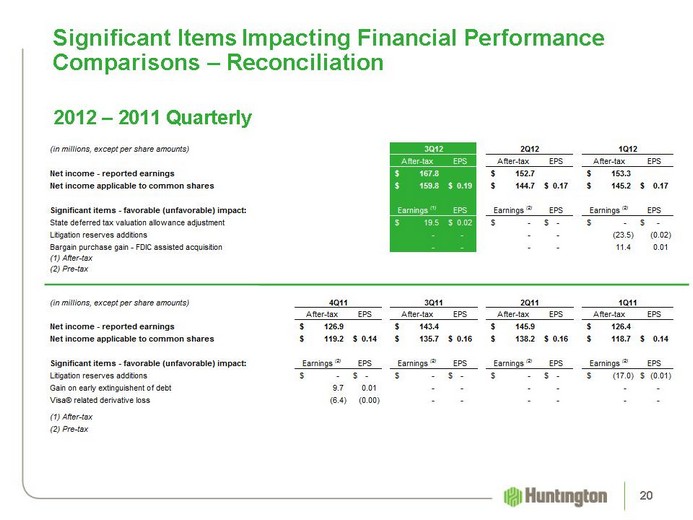
| Significant Items Impacting Financial Performance Comparisons - Reconciliation 2012 - 2011 Quarterly 20 |

| Income Statement 21 |
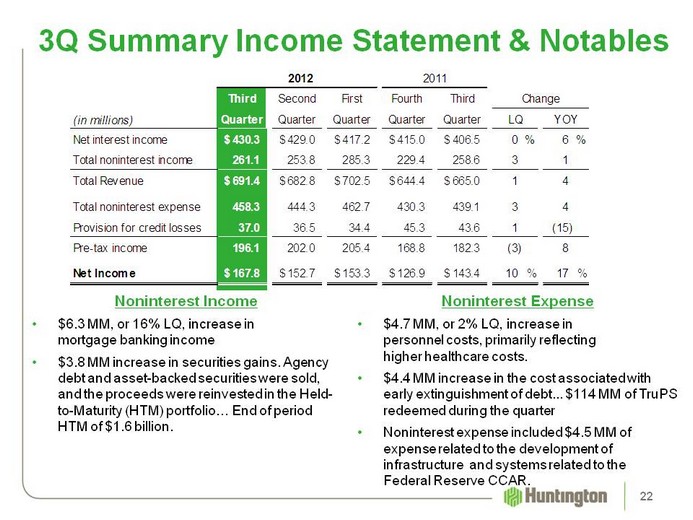
| 3Q Summary Income Statement & Notables 22 Noninterest Income $6.3 MM, or 16% LQ, increase in mortgage banking income $3.8 MM increase in securities gains. Agency debt and asset-backed securities were sold, and the proceeds were reinvested in the Held-to-Maturity (HTM) portfolio... End of period HTM of $1.6 billion. Noninterest Expense $4.7 MM, or 2% LQ, increase in personnel costs, primarily reflecting higher healthcare costs. $4.4 MM increase in the cost associated with early extinguishment of debt... $114 MM of TruPS redeemed during the quarter Noninterest expense included $4.5 MM of expense related to the development of infrastructure and systems related to the Federal Reserve CCAR. |
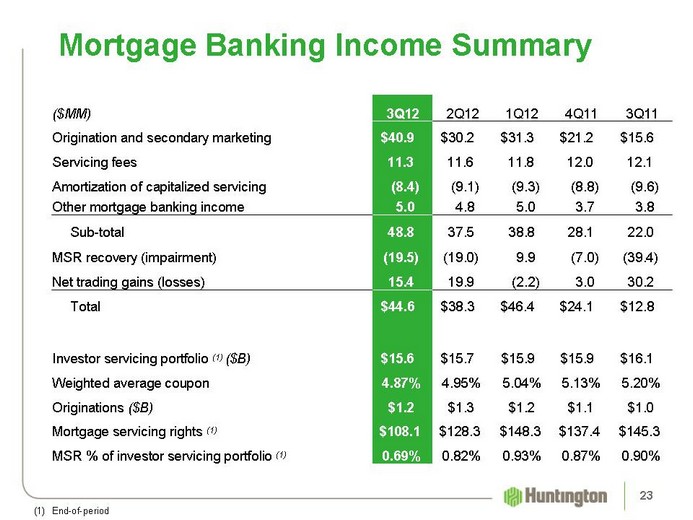
| Mortgage Banking Income Summary ($MM) 3Q12 2Q12 1Q12 4Q11 3Q11 Origination and secondary marketing $40.9 $30.2 $31.3 $21.2 $15.6 Servicing fees 11.3 11.6 11.8 12.0 12.1 Amortization of capitalized servicing (8.4) (9.1) (9.3) (8.8) (9.6) Other mortgage banking income 5.0 4.8 5.0 3.7 3.8 Sub-total 48.8 37.5 38.8 28.1 22.0 MSR recovery (impairment) (19.5) (19.0) 9.9 (7.0) (39.4) Net trading gains (losses) 15.4 19.9 (2.2) 3.0 30.2 Total $44.6 $38.3 $46.4 $24.1 $12.8 Investor servicing portfolio (1) ($B) $15.6 $15.7 $15.9 $15.9 $16.1 Weighted average coupon 4.87% 4.95% 5.04% 5.13% 5.20% Originations ($B) $1.2 $1.3 $1.2 $1.1 $1.0 Mortgage servicing rights (1) $108.1 $128.3 $148.3 $137.4 $145.3 MSR % of investor servicing portfolio (1) 0.69% 0.82% 0.93% 0.87% 0.90% (1) End-of-period 23 |
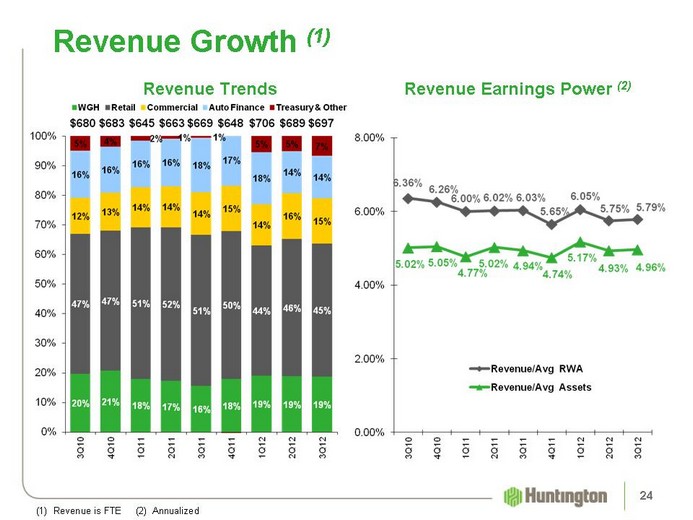
| Revenue Growth (1) (1) Revenue is FTE (2) Annualized Revenue Earnings Power (2) Revenue Trends 24 |
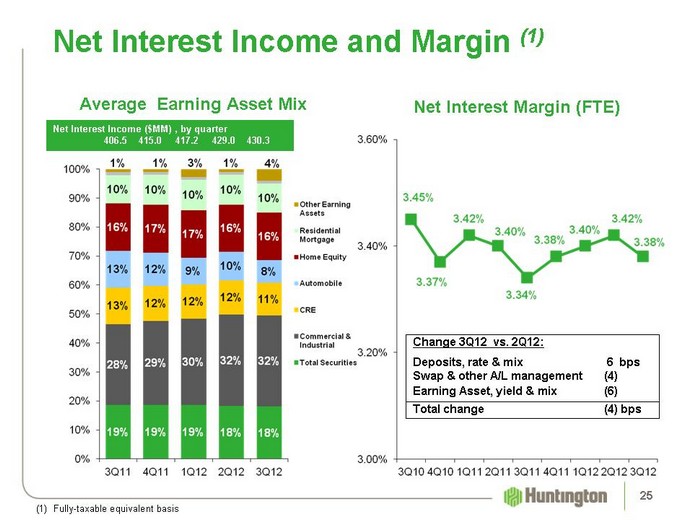
| Net Interest Income and Margin (1) (1) Fully-taxable equivalent basis Net Interest Margin (FTE) Average Earning Asset Mix 25 Net Interest Income ($MM) , by quarter 406.5 415.0 417.2 429.0 430.3 Change 3Q12 vs. 2Q12: Deposits, rate & mix 6 bps Swap & other A/L management (4) Earning Asset, yield & mix (6) Total change (4) bps |
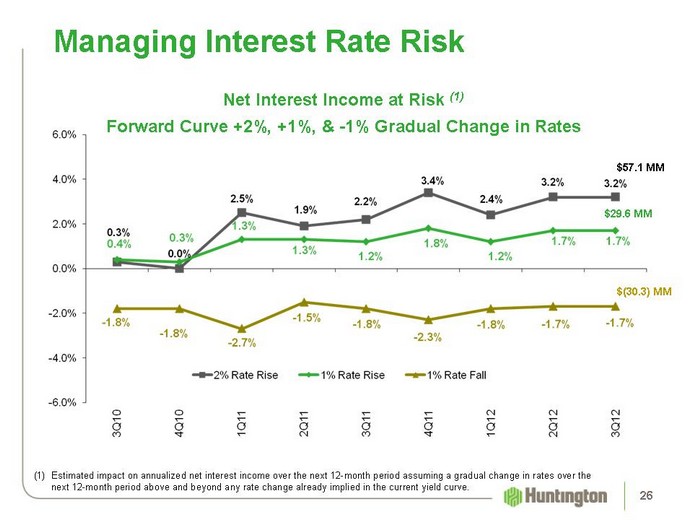
| Net Interest Income at Risk (1) Forward Curve +2%, +1%, & -1% Gradual Change in Rates Managing Interest Rate Risk Estimated impact on annualized net interest income over the next 12-month period assuming a gradual change in rates over the next 12-month period above and beyond any rate change already implied in the current yield curve. 26 $57.1 MM $29.6 MM $(30.3) MM |

| Balance Sheet 27 |

| Investment Securities 28 |
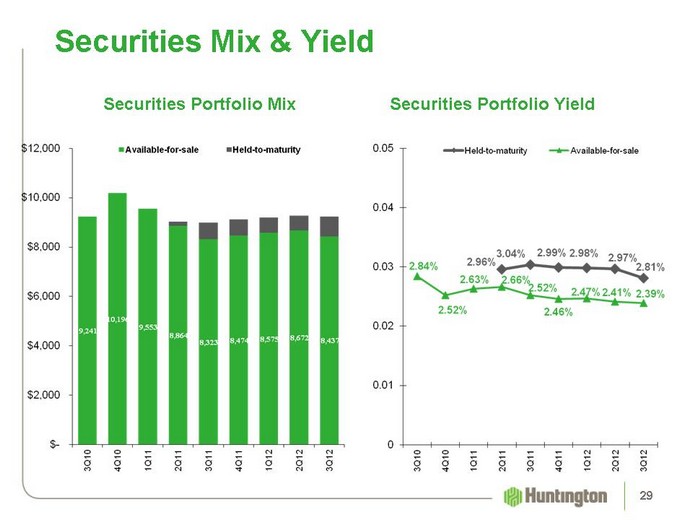
| Securities Mix & Yield Securities Portfolio Yield Securities Portfolio Mix 29 |
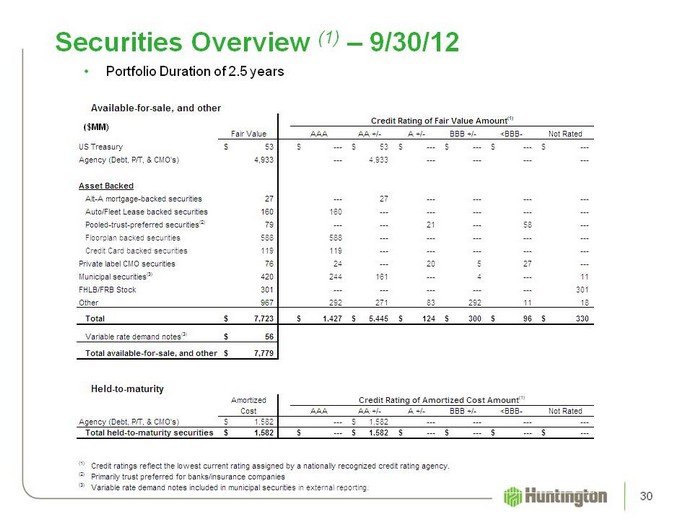
| Securities Overview (1) - 9/30/12 30 Portfolio Duration of 2.5 years ($MM) |

| Loan Portfolio Overview 31 |
| Total Commercial Loans 32 |
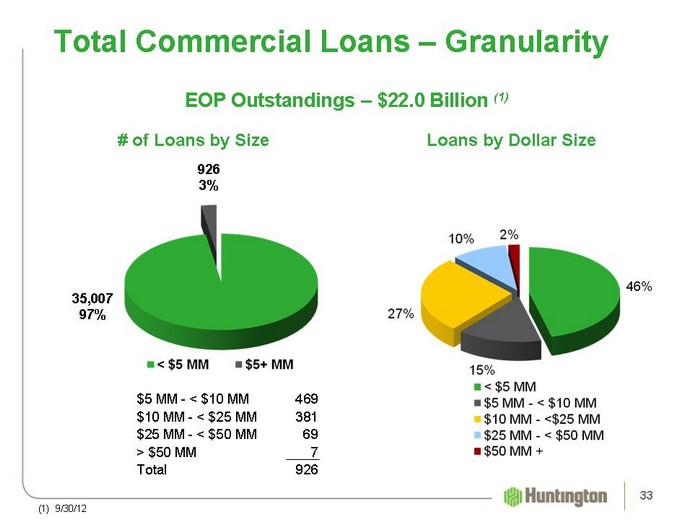
| Total Commercial Loans - Granularity EOP Outstandings - $22.0 Billion (1) 926 3% 35,007 97% (1) 9/30/12 Loans by Dollar Size # of Loans by Size $5 MM - < $10 MM 469 $10 MM - < $25 MM 381 $25 MM - < $50 MM 69 > $50 MM 7 Total 926 33 |
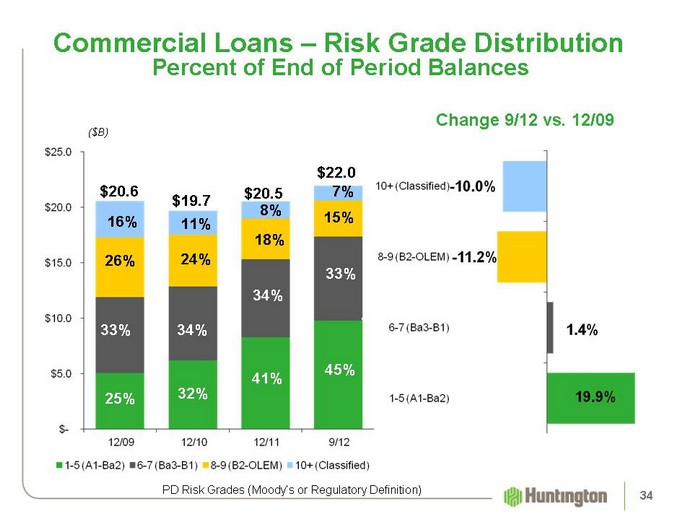
| Commercial Loans - Risk Grade Distribution PD Risk Grades (Moody's or Regulatory Definition) Percent of End of Period Balances ($B) $20.6 $19.7 26% 11% 16% 33% 25% 8% $20.5 15% 7% $22.0 34 24% 34% 32% 18% 34% 41% 15% 33% 45% Change 9/12 vs. 12/09 |
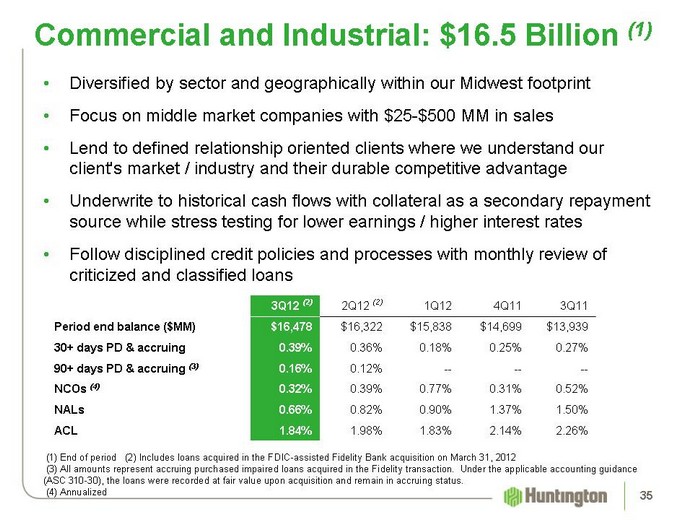
| Diversified by sector and geographically within our Midwest footprint Focus on middle market companies with $25-$500 MM in sales Lend to defined relationship oriented clients where we understand our client's market / industry and their durable competitive advantage Underwrite to historical cash flows with collateral as a secondary repayment source while stress testing for lower earnings / higher interest rates Follow disciplined credit policies and processes with monthly review of criticized and classified loans Commercial and Industrial: $16.5 Billion (1) (1) End of period (2) Includes loans acquired in the FDIC-assisted Fidelity Bank acquisition on March 31, 2012 (3) All amounts represent accruing purchased impaired loans acquired in the Fidelity transaction. Under the applicable accounting guidance (ASC 310-30), the loans were recorded at fair value upon acquisition and remain in accruing status. (4) Annualized 35 3Q12 (2) 2Q12 (2) 1Q12 4Q11 3Q11 Period end balance ($MM) $16,478 $16,322 $15,838 $14,699 $13,939 30+ days PD & accruing 0.39% 0.36% 0.18% 0.25% 0.27% 90+ days PD & accruing (3) 0.16% 0.12% -- -- -- NCOs (4) 0.32% 0.39% 0.77% 0.31% 0.52% NALs 0.66% 0.82% 0.90% 1.37% 1.50% ACL 1.84% 1.98% 1.83% 2.14% 2.26% |
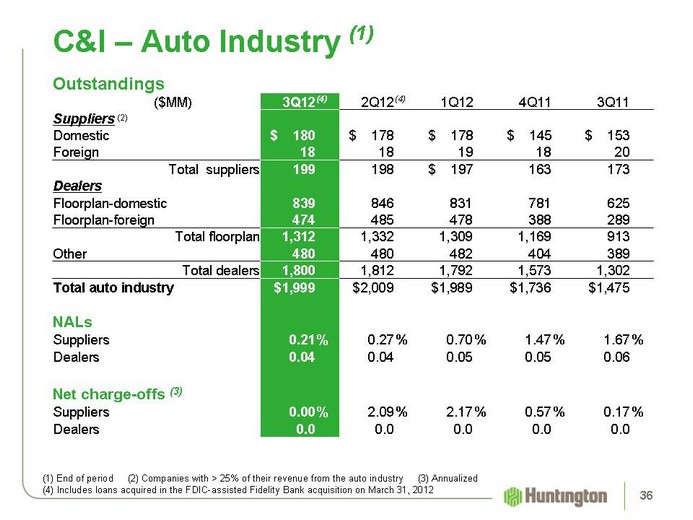
| C&I - Auto Industry (1) Outstandings ($MM) 3Q12 (4) 2Q12 (4) 1Q12 4Q11 3Q11 Suppliers (2) Domestic $ 180 $ 178 $ 178 $ 145 $ 153 Foreign 18 18 19 18 20 Total suppliers 199 198 $ 197 163 173 Dealers Floorplan-domestic 839 846 831 781 625 Floorplan-foreign 474 485 478 388 289 Total floorplan 1,312 1,332 1,309 1,169 913 Other 480 480 482 404 389 Total dealers 1,800 1,812 1,792 1,573 1,302 Total auto industry $1,999 $2,009 $1,989 $1,736 $1,475 NALs Suppliers 0.21 % 0.27 % 0.70 % 1.47 % 1.67 % Dealers 0.04 0.04 0.05 0.05 0.06 Net charge-offs (3) Suppliers 0.00 % 2.09 % 2.17 % 0.57 % 0.17 % Dealers 0.0 0.0 0.0 0.0 0.0 (1) End of period (2) Companies with > 25% of their revenue from the auto industry (3) Annualized (4) Includes loans acquired in the FDIC-assisted Fidelity Bank acquisition on March 31, 2012 36 |
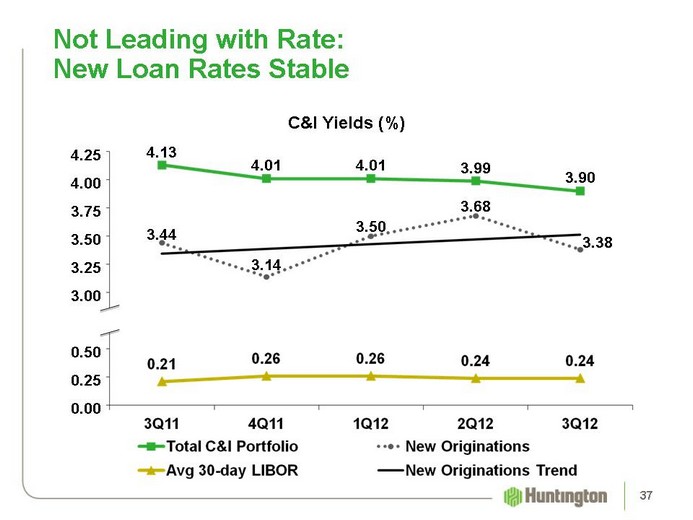
| Not Leading with Rate: New Loan Rates Stable 37 C&I Yields (%) 4.25 4.00 3.75 3.50 3.25 3.00 0.50 0.25 0.00 3.90 3.99 4.01 4.01 4.13 3.44 3.14 3.50 3.68 3.38 |
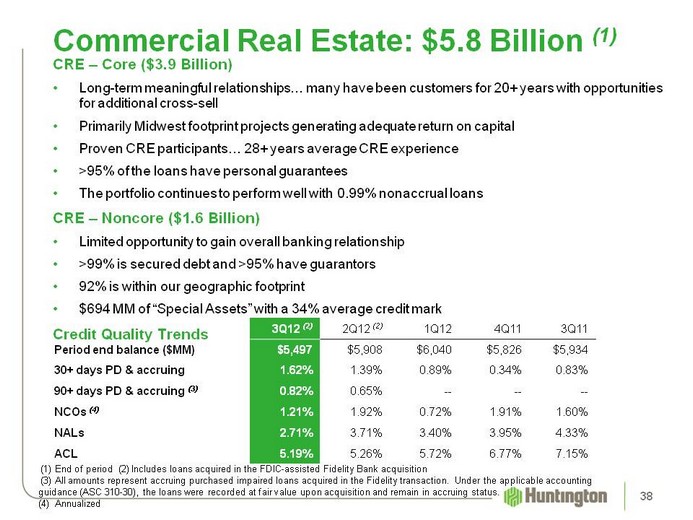
| Commercial Real Estate: $5.8 Billion (1) CRE - Core ($3.9 Billion) Long-term meaningful relationships... many have been customers for 20+ years with opportunities for additional cross-sell Primarily Midwest footprint projects generating adequate return on capital Proven CRE participants... 28+ years average CRE experience >95% of the loans have personal guarantees The portfolio continues to perform well with 0.99% nonaccrual loans CRE - Noncore ($1.6 Billion) Limited opportunity to gain overall banking relationship >99% is secured debt and >95% have guarantors 92% is within our geographic footprint $694 MM of "Special Assets" with a 34% average credit mark Credit Quality Trends 3Q12 (2) 2Q12 (2) 1Q12 4Q11 3Q11 Period end balance ($MM) $5,497 $5,908 $6,040 $5,826 $5,934 30+ days PD & accruing 1.62% 1.39% 0.89% 0.34% 0.83% 90+ days PD & accruing (3) 0.82% 0.65% -- -- -- NCOs (4) 1.21% 1.92% 0.72% 1.91% 1.60% NALs 2.71% 3.71% 3.40% 3.95% 4.33% ACL 5.19% 5.26% 5.72% 6.77% 7.15% 38 (1) End of period (2) Includes loans acquired in the FDIC-assisted Fidelity Bank acquisition (3) All amounts represent accruing purchased impaired loans acquired in the Fidelity transaction. Under the applicable accounting guidance (ASC 310-30), the loans were recorded at fair value upon acquisition and remain in accruing status. (4) Annualized |
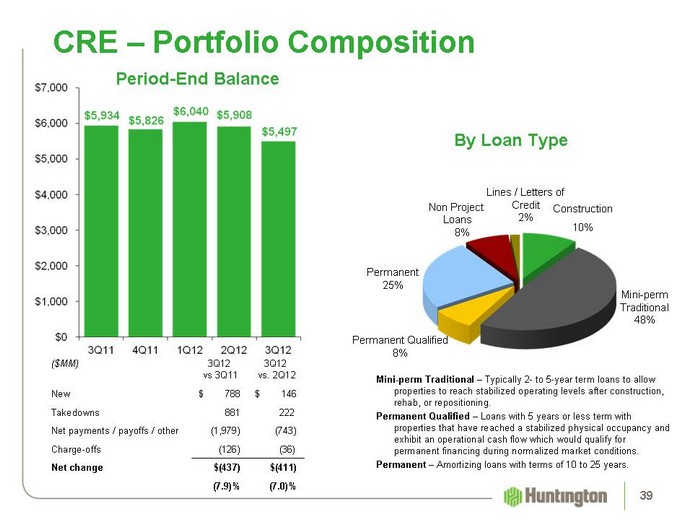
| CRE - Portfolio Composition Permanent 25% Mini-perm Traditional 48% Construction 10% Non Project Loans 8% Lines / Letters of Credit 2% Permanent Qualified 8% Mini-perm Traditional - Typically 2- to 5-year term loans to allow properties to reach stabilized operating levels after construction, rehab, or repositioning. Permanent Qualified - Loans with 5 years or less term with properties that have reached a stabilized physical occupancy and exhibit an operational cash flow which would qualify for permanent financing during normalized market conditions. Permanent - Amortizing loans with terms of 10 to 25 years. By Loan Type 39 Period-End Balance ($MM) 3Q12 vs 3Q11 3Q12 vs. 2Q12 New $ 788 $ 146 Takedowns 881 222 Net payments / payoffs / other (1,979) (743) Charge-offs (126) (36) Net change $(437) $(411) (7.9)% (7.0)% |
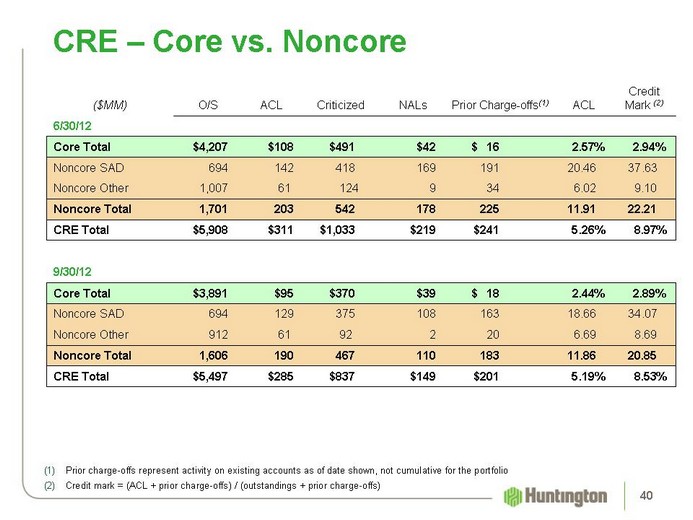
| CRE - Core vs. Noncore ($MM) O/S ACL Criticized NALs Prior Charge-offs(1) ACL Credit Mark (2) 6/30/12 Core Total $4,207 $108 $491 $42 $ 16 2.57% 2.94% Noncore SAD 694 142 418 169 191 20.46 37.63 Noncore Other 1,007 61 124 9 34 6.02 9.10 Noncore Total 1,701 203 542 178 225 11.91 22.21 CRE Total $5,908 $311 $1,033 $219 $241 5.26% 8.97% 9/30/12 Core Total $3,891 $95 $370 $39 $ 18 2.44% 2.89% Noncore SAD 694 129 375 108 163 18.66 34.07 Noncore Other 912 61 92 2 20 6.69 8.69 Noncore Total 1,606 190 467 110 183 11.86 20.85 CRE Total $5,497 $285 $837 $149 $201 5.19% 8.53% Prior charge-offs represent activity on existing accounts as of date shown, not cumulative for the portfolio Credit mark = (ACL + prior charge-offs) / (outstandings + prior charge-offs) 40 |
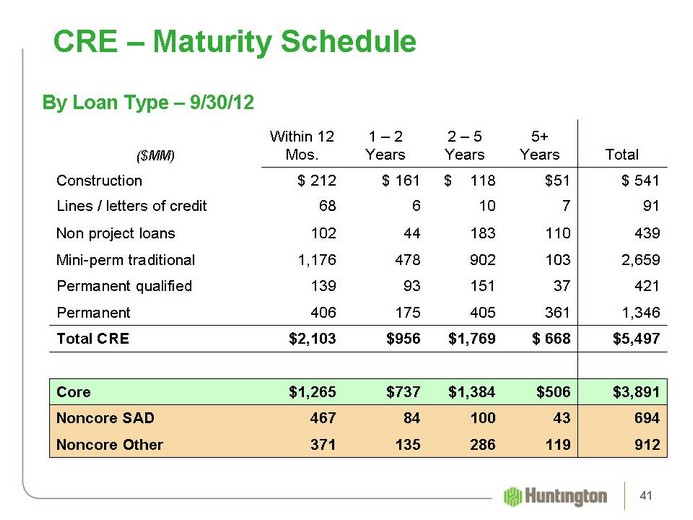
| CRE - Maturity Schedule By Loan Type - 9/30/12 ($MM) Within 12 Mos. 1 - 2 Years 2 - 5 Years 5+ Years Total Construction $ 212 $ 161 $ 118 $51 $ 541 Lines / letters of credit 68 6 10 7 91 Non project loans 102 44 183 110 439 Mini-perm traditional 1,176 478 902 103 2,659 Permanent qualified 139 93 151 37 421 Permanent 406 175 405 361 1,346 Total CRE $2,103 $956 $1,769 $ 668 $5,497 Core $1,265 $737 $1,384 $506 $3,891 Noncore SAD 467 84 100 43 694 Noncore Other 371 135 286 119 912 41 |

| Total Consumer Loans and Leases 42 |
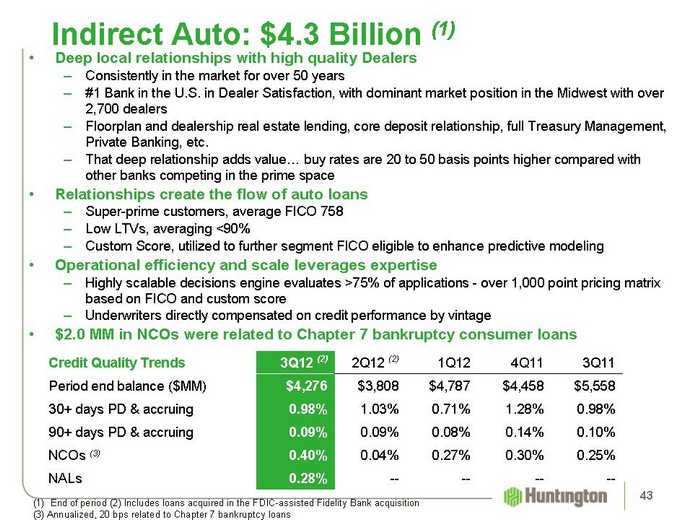
| Indirect Auto: $4.3 Billion (1) Deep local relationships with high quality Dealers Consistently in the market for over 50 years #1 Bank in the U.S. in Dealer Satisfaction, with dominant market position in the Midwest with over 2,700 dealers Floorplan and dealership real estate lending, core deposit relationship, full Treasury Management, Private Banking, etc. That deep relationship adds value... buy rates are 20 to 50 basis points higher compared with other banks competing in the prime space Relationships create the flow of auto loans Super-prime customers, average FICO 758 Low LTVs, averaging <90% Custom Score, utilized to further segment FICO eligible to enhance predictive modeling Operational efficiency and scale leverages expertise Highly scalable decisions engine evaluates >75% of applications - over 1,000 point pricing matrix based on FICO and custom score Underwriters directly compensated on credit performance by vintage $2.0 MM in NCOs were related to Chapter 7 bankruptcy consumer loans Credit Quality Trends 3Q12 (2) 2Q12 (2) 1Q12 4Q11 3Q11 Period end balance ($MM) $4,276 $3,808 $4,787 $4,458 $5,558 30+ days PD & accruing 0.98% 1.03% 0.71% 1.28% 0.98% 90+ days PD & accruing 0.09% 0.09% 0.08% 0.14% 0.10% NCOs (3) 0.40% 0.04% 0.27% 0.30% 0.25% NALs 0.28% -- -- -- -- 43 End of period (2) Includes loans acquired in the FDIC-assisted Fidelity Bank acquisition (3) Annualized, 20 bps related to Chapter 7 bankruptcy loans |
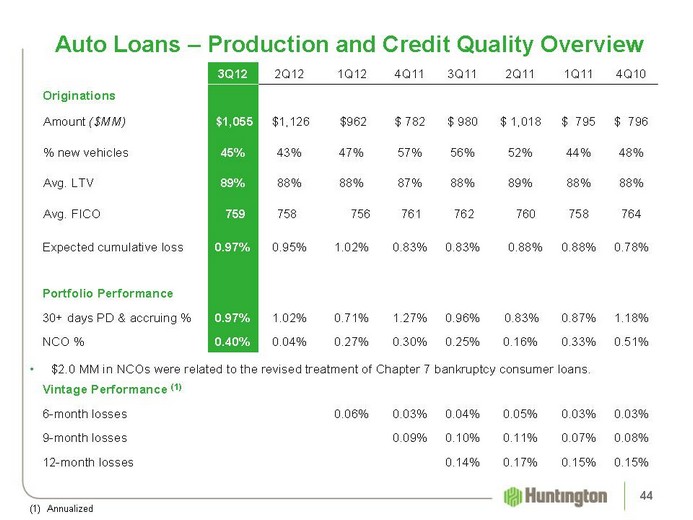
| Auto Loans - Production and Credit Quality Overview 3Q12 3Q12 2Q12 1Q12 4Q11 3Q11 2Q11 1Q11 4Q10 Originations Amount ($MM) $1,055 $1,055 $1,126 $962 $ 782 $ 980 $ 1,018 $ 795 $ 796 % new vehicles 45% 45% 43% 47% 57% 56% 52% 44% 48% Avg. LTV 89% 89% 88% 88% 87% 88% 89% 88% 88% Avg. FICO 759 759 758 756 761 762 760 758 764 Expected cumulative loss 0.97% 0.97% 0.95% 1.02% 0.83% 0.83% 0.88% 0.88% 0.78% Portfolio Performance 30+ days PD & accruing % 0.97% 0.97% 1.02% 0.71% 1.27% 0.96% 0.83% 0.87% 1.18% NCO % 0.40% 0.40% 0.04% 0.27% 0.30% 0.25% 0.16% 0.33% 0.51% Vintage Performance (1) Vintage Performance (1) Vintage Performance (1) 6-month losses 6-month losses 0.06% 0.03% 0.04% 0.05% 0.03% 0.03% 9-month losses 9-month losses 0.09% 0.10% 0.11% 0.07% 0.08% 12-month losses 12-month losses 0.14% 0.17% 0.15% 0.15% (1) Annualized 44 $2.0 MM in NCOs were related to the revised treatment of Chapter 7 bankruptcy consumer loans. |
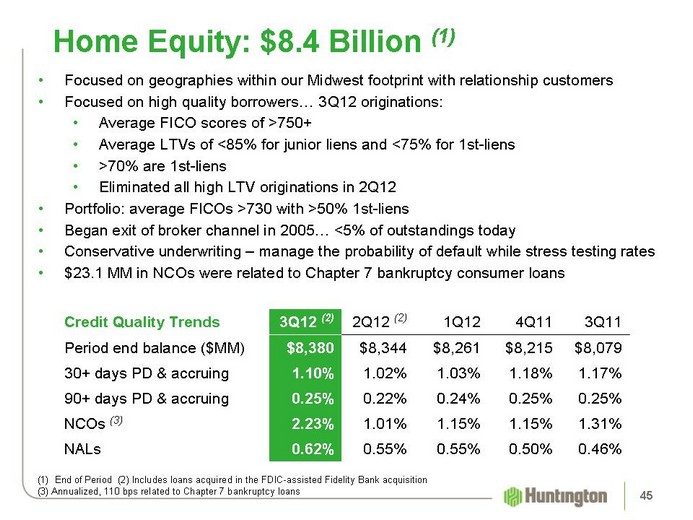
| Home Equity: $8.4 Billion (1) Credit Quality Trends 3Q12 (2) 2Q12 (2) 1Q12 4Q11 3Q11 Period end balance ($MM) $8,380 $8,344 $8,261 $8,215 $8,079 30+ days PD & accruing 1.10% 1.02% 1.03% 1.18% 1.17% 90+ days PD & accruing 0.25% 0.22% 0.24% 0.25% 0.25% NCOs (3) 2.23% 1.01% 1.15% 1.15% 1.31% NALs 0.62% 0.55% 0.55% 0.50% 0.46% 45 End of Period (2) Includes loans acquired in the FDIC-assisted Fidelity Bank acquisition (3) Annualized, 110 bps related to Chapter 7 bankruptcy loans Focused on geographies within our Midwest footprint with relationship customers Focused on high quality borrowers... 3Q12 originations: Average FICO scores of >750+ Average LTVs of <85% for junior liens and <75% for 1st-liens >70% are 1st-liens Eliminated all high LTV originations in 2Q12 Portfolio: average FICOs >730 with >50% 1st-liens Began exit of broker channel in 2005... <5% of outstandings today Conservative underwriting - manage the probability of default while stress testing rates $23.1 MM in NCOs were related to Chapter 7 bankruptcy consumer loans |
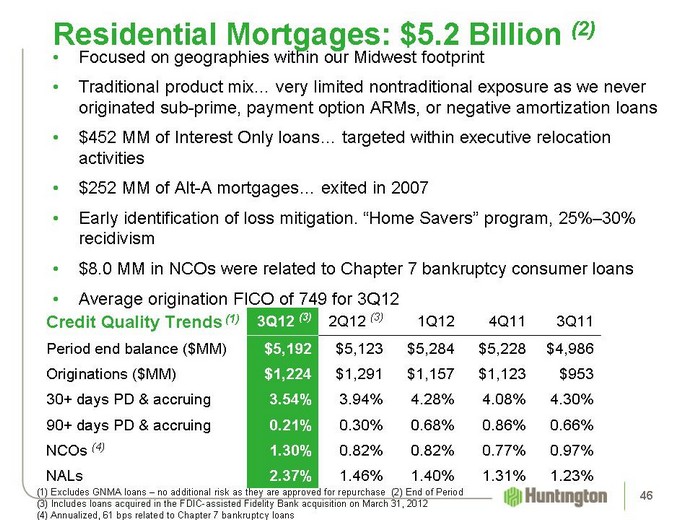
| Focused on geographies within our Midwest footprint Traditional product mix... very limited nontraditional exposure as we never originated sub-prime, payment option ARMs, or negative amortization loans $452 MM of Interest Only loans... targeted within executive relocation activities $252 MM of Alt-A mortgages... exited in 2007 Early identification of loss mitigation. "Home Savers" program, 25%-30% recidivism $8.0 MM in NCOs were related to Chapter 7 bankruptcy consumer loans Average origination FICO of 749 for 3Q12 Credit Quality Trends (1) 3Q12 (3) 2Q12 (3) 1Q12 4Q11 3Q11 Period end balance ($MM) $5,192 $5,123 $5,284 $5,228 $4,986 Originations ($MM) $1,224 $1,291 $1,157 $1,123 $953 30+ days PD & accruing 3.54% 3.94% 4.28% 4.08% 4.30% 90+ days PD & accruing 0.21% 0.30% 0.68% 0.86% 0.66% NCOs (4) 1.30% 0.82% 0.82% 0.77% 0.97% NALs 2.37% 1.46% 1.40% 1.31% 1.23% Residential Mortgages: $5.2 Billion (2) 46 (1) Excludes GNMA loans - no additional risk as they are approved for repurchase (2) End of Period (3) Includes loans acquired in the FDIC-assisted Fidelity Bank acquisition on March 31, 2012 (4) Annualized, 61 bps related to Chapter 7 bankruptcy loans |
| Credit Quality Review 47 |
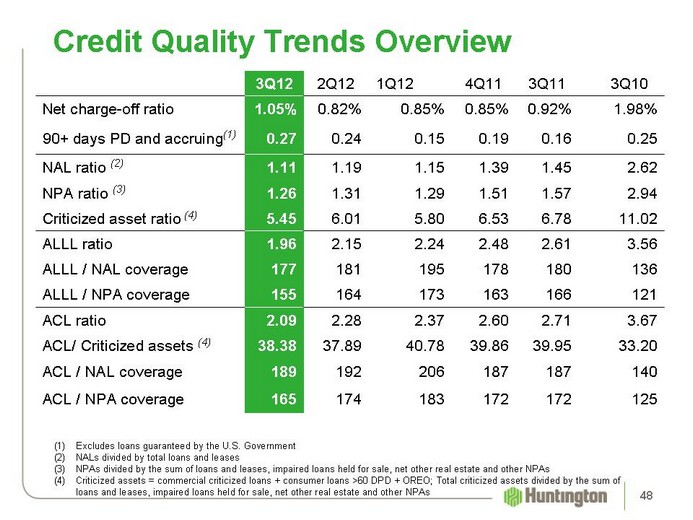
| Credit Quality Trends Overview 3Q12 2Q12 1Q12 4Q11 3Q11 3Q10 Net charge-off ratio 1.05% 0.82% 0.85% 0.85% 0.92% 1.98% 90+ days PD and accruing(1) 0.27 0.24 0.15 0.19 0.16 0.25 NAL ratio (2) 1.11 1.19 1.15 1.39 1.45 2.62 NPA ratio (3) 1.26 1.31 1.29 1.51 1.57 2.94 Criticized asset ratio (4) 5.45 6.01 5.80 6.53 6.78 11.02 ALLL ratio 1.96 2.15 2.24 2.48 2.61 3.56 ALLL / NAL coverage 177 181 195 178 180 136 ALLL / NPA coverage 155 164 173 163 166 121 ACL ratio 2.09 2.28 2.37 2.60 2.71 3.67 ACL/ Criticized assets (4) 38.38 37.89 40.78 39.86 39.95 33.20 ACL / NAL coverage 189 192 206 187 187 140 ACL / NPA coverage 165 174 183 172 172 125 Excludes loans guaranteed by the U.S. Government NALs divided by total loans and leases (3) NPAs divided by the sum of loans and leases, impaired loans held for sale, net other real estate and other NPAs (4) Criticized assets = commercial criticized loans + consumer loans >60 DPD + OREO; Total criticized assets divided by the sum of loans and leases, impaired loans held for sale, net other real estate and other NPAs 48 |
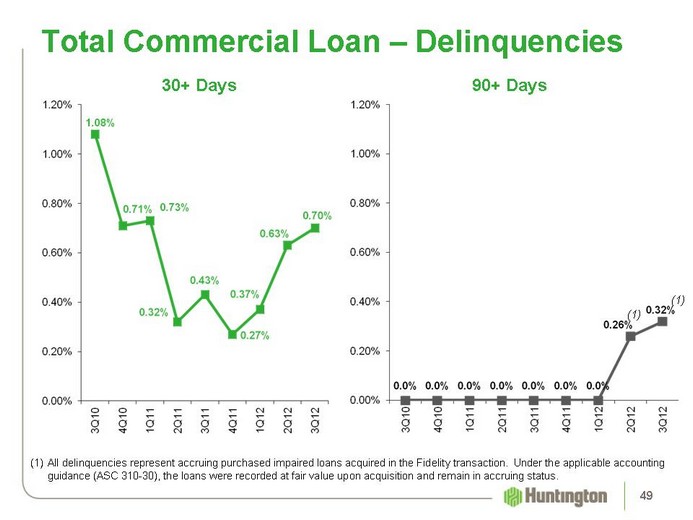
| Total Commercial Loan - Delinquencies All delinquencies represent accruing purchased impaired loans acquired in the Fidelity transaction. Under the applicable accounting guidance (ASC 310-30), the loans were recorded at fair value upon acquisition and remain in accruing status. 90+ Days 30+ Days 49 (1) (1) |
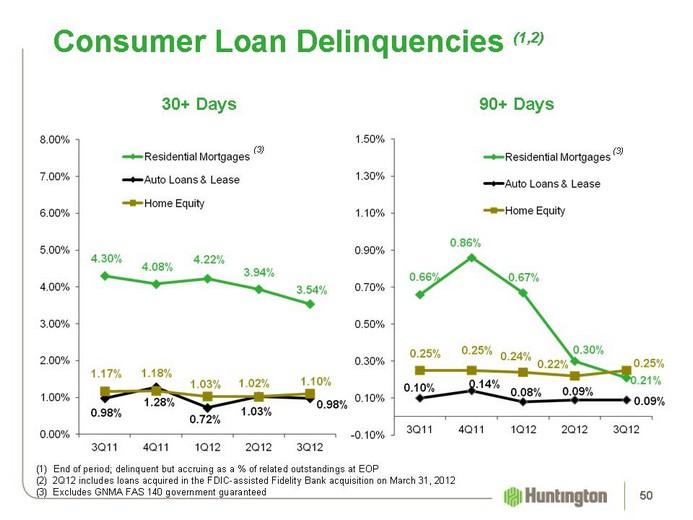
| Consumer Loan Delinquencies (1,2) End of period; delinquent but accruing as a % of related outstandings at EOP (2) 2Q12 includes loans acquired in the FDIC-assisted Fidelity Bank acquisition on March 31, 2012 (3) Excludes GNMA FAS 140 government guaranteed (3) (3) 90+ Days 30+ Days 50 |
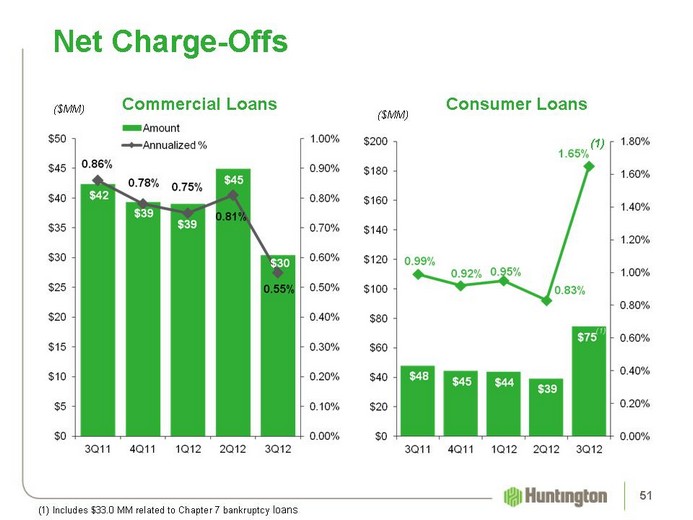
| Net Charge-Offs ($MM) ($MM) Consumer Loans Commercial Loans (2) (1) 51 (1) (1) Includes $33.0 MM related to Chapter 7 bankruptcy loans |
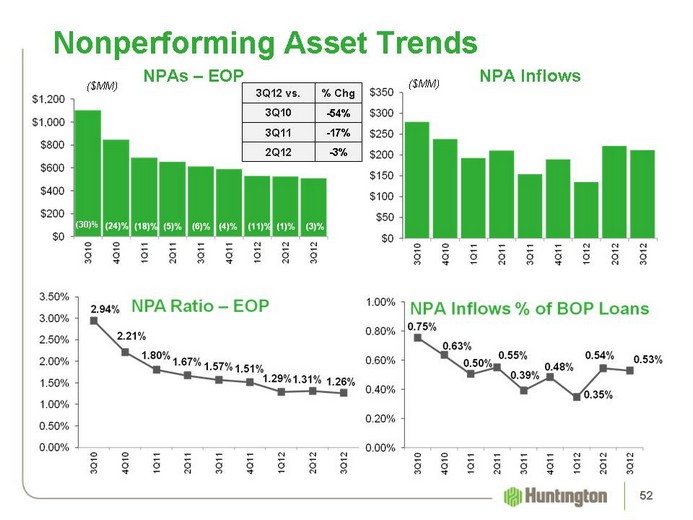
| Nonperforming Asset Trends ($MM) ($MM) 10% (8)% (18)% (3)% (19)% NPA Inflows NPAs - EOP (4)% (27)% (15)% (38)% 23% 52 3Q12 vs. % Chg 3Q10 -54% 3Q11 -17% 2Q12 -3% (30)% |
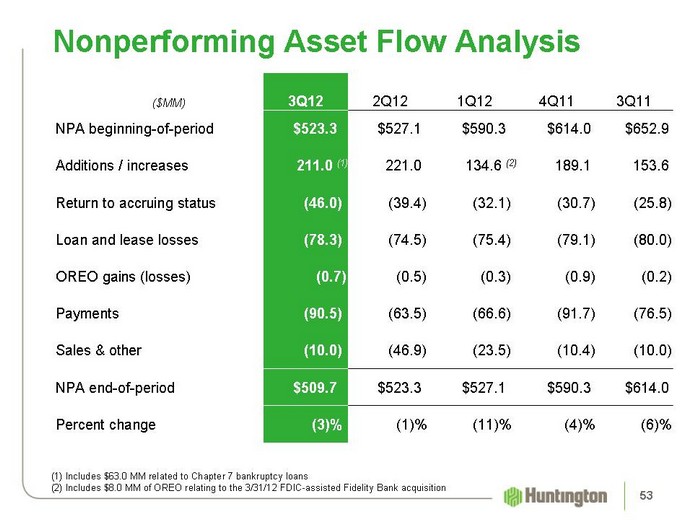
| ($MM) 3Q12 2Q12 1Q12 4Q11 3Q11 NPA beginning-of-period $523.3 $527.1 $590.3 $614.0 $652.9 Additions / increases 211.0 (1) 221.0 134.6 (2) 189.1 153.6 Return to accruing status (46.0) (39.4) (32.1) (30.7) (25.8) Loan and lease losses (78.3) (74.5) (75.4) (79.1) (80.0) OREO gains (losses) (0.7) (0.5) (0.3) (0.9) (0.2) Payments (90.5) (63.5) (66.6) (91.7) (76.5) Sales & other (10.0) (46.9) (23.5) (10.4) (10.0) NPA end-of-period $509.7 $523.3 $527.1 $590.3 $614.0 Percent change (3)% (1)% (11)% (4)% (6)% Nonperforming Asset Flow Analysis 53 (1) Includes $63.0 MM related to Chapter 7 bankruptcy loans (2) Includes $8.0 MM of OREO relating to the 3/31/12 FDIC-assisted Fidelity Bank acquisition |
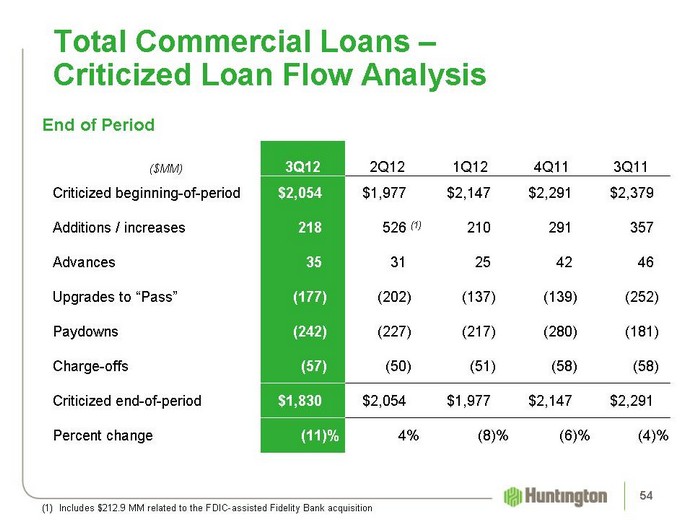
| ($MM) 3Q12 2Q12 1Q12 4Q11 3Q11 Criticized beginning-of-period $2,054 $1,977 $2,147 $2,291 $2,379 Additions / increases 218 526 (1) 210 291 357 Advances 35 31 25 42 46 Upgrades to "Pass" (177) (202) (137) (139) (252) Paydowns (242) (227) (217) (280) (181) Charge-offs (57) (50) (51) (58) (58) Criticized end-of-period $1,830 $2,054 $1,977 $2,147 $2,291 Percent change (11)% 4% (8)% (6)% (4)% Total Commercial Loans - Criticized Loan Flow Analysis End of Period 54 Includes $212.9 MM related to the FDIC-assisted Fidelity Bank acquisition |
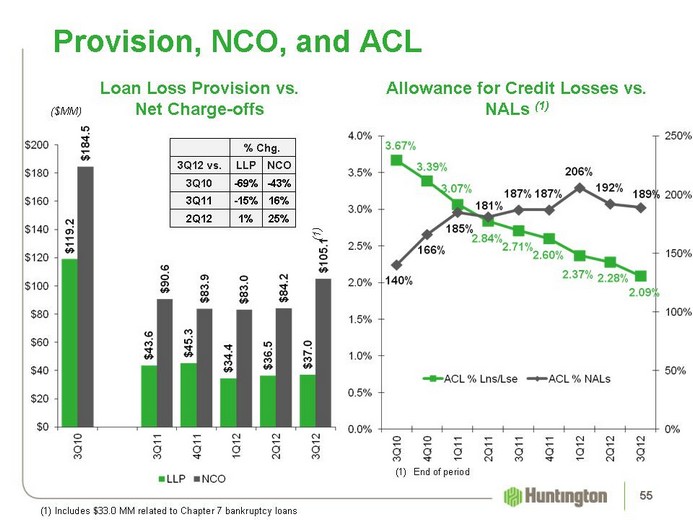
| Provision, NCO, and ACL ($MM) (1) End of period Allowance for Credit Losses vs. NALs (1) Loan Loss Provision vs. Net Charge-offs 55 % Chg. % Chg. 3Q12 vs. LLP NCO 3Q10 -69% -43% 3Q11 -15% 16% 2Q12 1% 25% (1) Includes $33.0 MM related to Chapter 7 bankruptcy loans (1) |
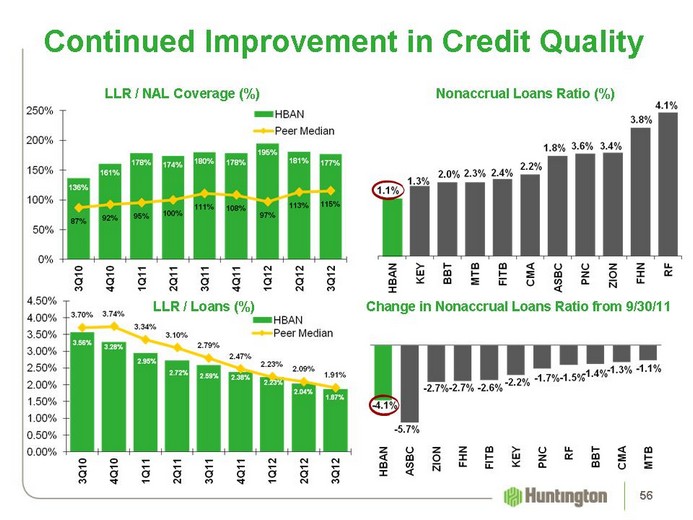
| 56 Nonaccrual Loans Ratio (%) LLR / NAL Coverage (%) LLR / Loans (%) Change in Nonaccrual Loans Ratio from 9/30/11 Continued Improvement in Credit Quality |

| Deposits 57 |
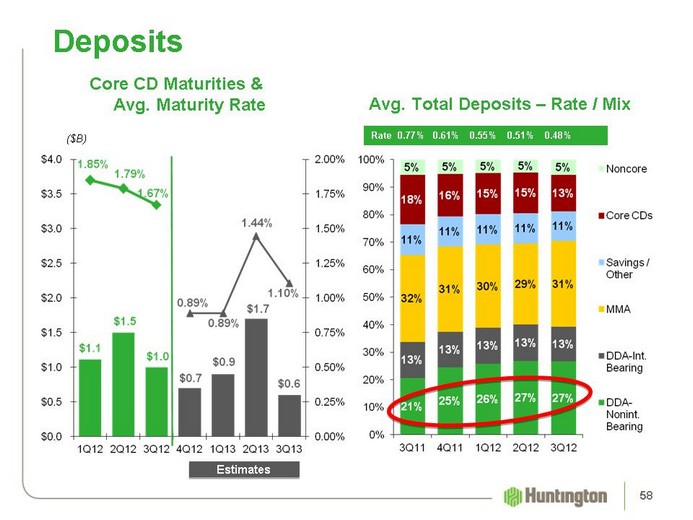
| Deposits ($B) Avg. Total Deposits - Rate / Mix Core CD Maturities & Avg. Maturity Rate Rate 0.77% 0.61% 0.55% 0.51% 0.48% Estimates 58 |
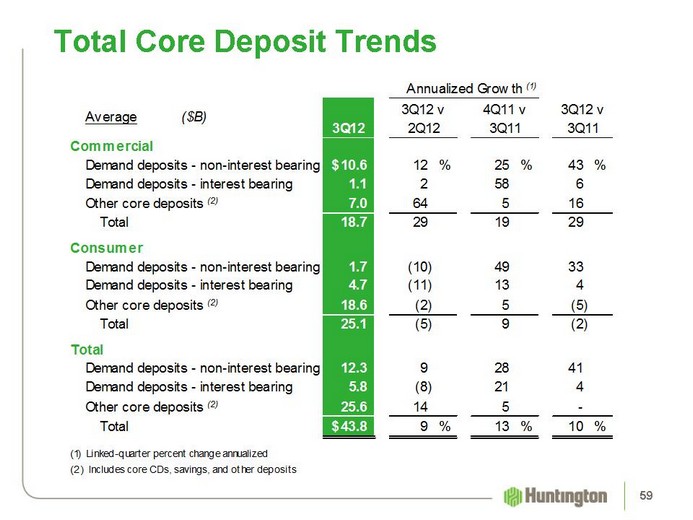
| Total Core Deposit Trends 59 |

| Capital 60 |
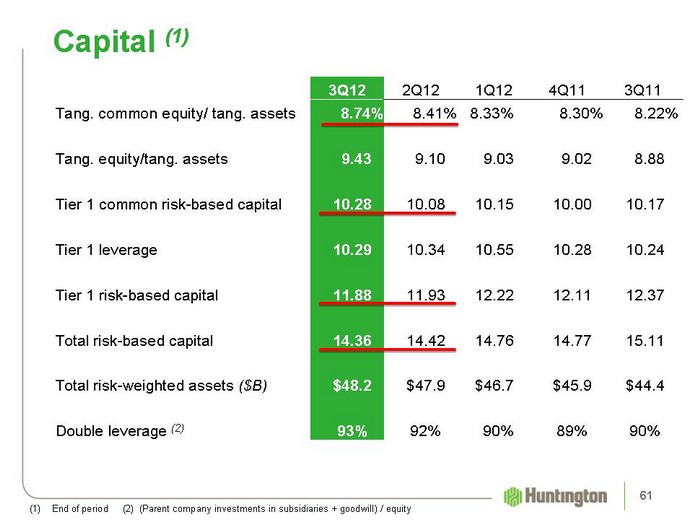
| 3Q12 2Q12 1Q12 4Q11 3Q11 Tang. common equity/ tang. assets 8.74% 8.41% 8.33% 8.30% 8.22% Tang. equity/tang. assets 9.43 9.10 9.03 9.02 8.88 Tier 1 common risk-based capital 10.28 10.08 10.15 10.00 10.17 Tier 1 leverage 10.29 10.34 10.55 10.28 10.24 Tier 1 risk-based capital 11.88 11.93 12.22 12.11 12.37 Total risk-based capital 14.36 14.42 14.76 14.77 15.11 Total risk-weighted assets ($B) $48.2 $47.9 $46.7 $45.9 $44.4 Double leverage (2) 93% 92% 90% 89% 90% Capital (1) (1) End of period (2) (Parent company investments in subsidiaries + goodwill) / equity 61 |
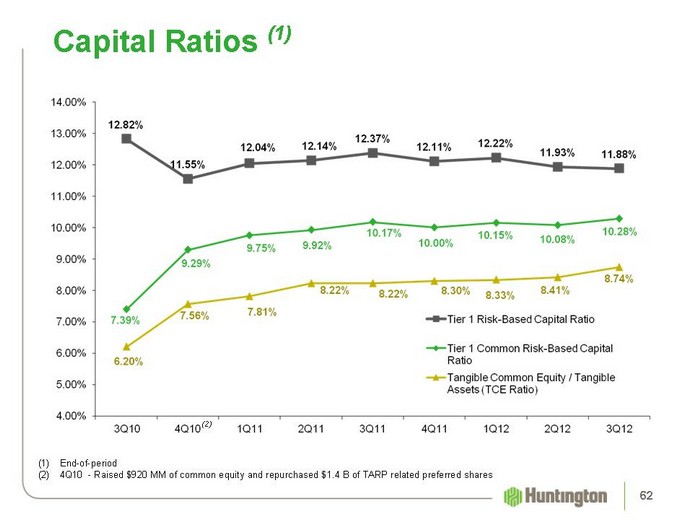
| Capital Ratios (1) End-of-period 4Q10 - Raised $920 MM of common equity and repurchased $1.4 B of TARP related preferred shares (2) 62 |
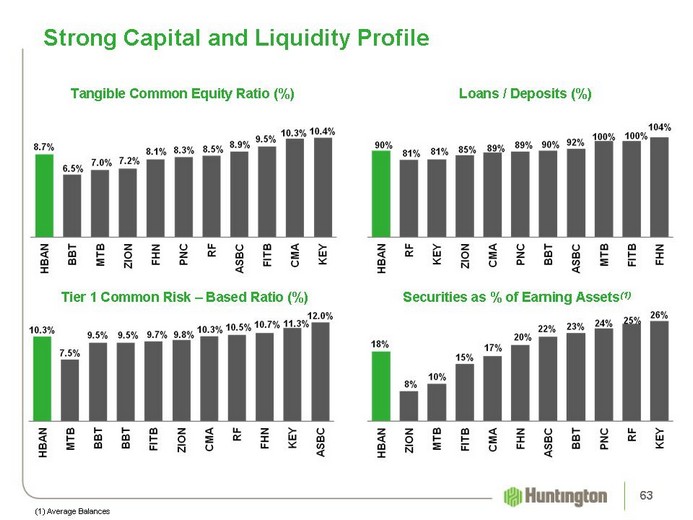
| 63 Loans / Deposits (%) Tangible Common Equity Ratio (%) Tier 1 Common Risk - Based Ratio (%) Securities as % of Earning Assets(1) Strong Capital and Liquidity Profile (1) Average Balances |

| Franchise and Leadership 64 |
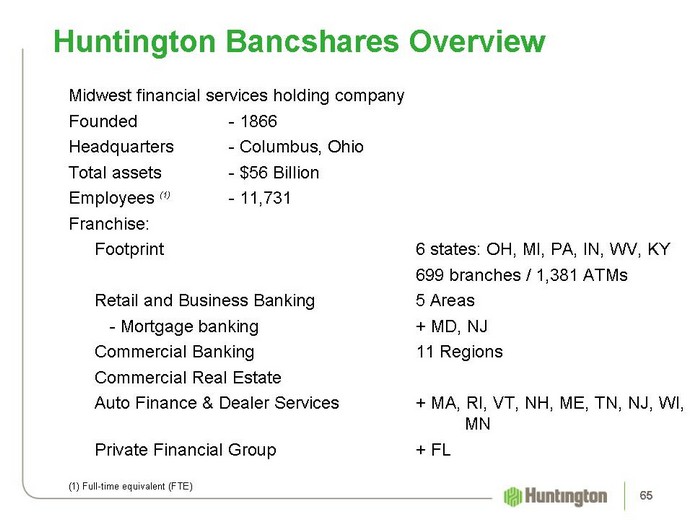
| Huntington Bancshares Overview Midwest financial services holding company Founded - 1866 Headquarters - Columbus, Ohio Total assets - $56 Billion Employees (1) - 11,731 Franchise: Footprint 6 states: OH, MI, PA, IN, WV, KY 699 branches / 1,381 ATMs Retail and Business Banking 5 Areas - Mortgage banking + MD, NJ Commercial Banking 11 Regions Commercial Real Estate Auto Finance & Dealer Services + MA, RI, VT, NH, ME, TN, NJ, WI, MN Private Financial Group + FL (1) Full-time equivalent (FTE) 65 |
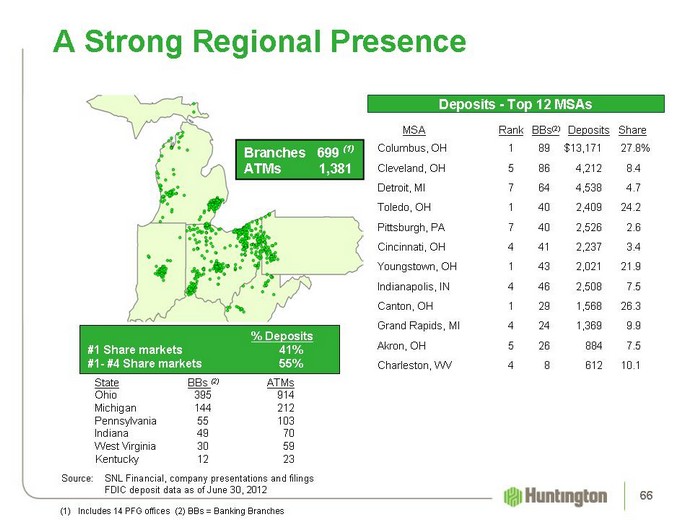
| A Strong Regional Presence Source: SNL Financial, company presentations and filings FDIC deposit data as of June 30, 2012 Deposits - Top 12 MSAs MSA Rank BBs(2) Deposits Share Columbus, OH 1 89 $13,171 27.8% Cleveland, OH 5 86 4,212 8.4 Detroit, MI 7 64 4,538 4.7 Toledo, OH 1 40 2,409 24.2 Pittsburgh, PA 7 40 2,526 2.6 Cincinnati, OH 4 41 2,237 3.4 Youngstown, OH 1 43 2,021 21.9 Indianapolis, IN 4 46 2,508 7.5 Canton, OH 1 29 1,568 26.3 Grand Rapids, MI 4 24 1,369 9.9 Akron, OH 5 26 884 7.5 Charleston, WV 4 8 612 10.1 % Deposits #1 Share markets 41% #1- #4 Share markets 55% 66 Includes 14 PFG offices (2) BBs = Banking Branches Branches 699 (1) ATMs 1,381 State BBs (2) ATMs Ohio 395 914 Michigan 144 212 Pennsylvania 55 103 Indiana 49 70 West Virginia 30 59 Kentucky 12 23 |
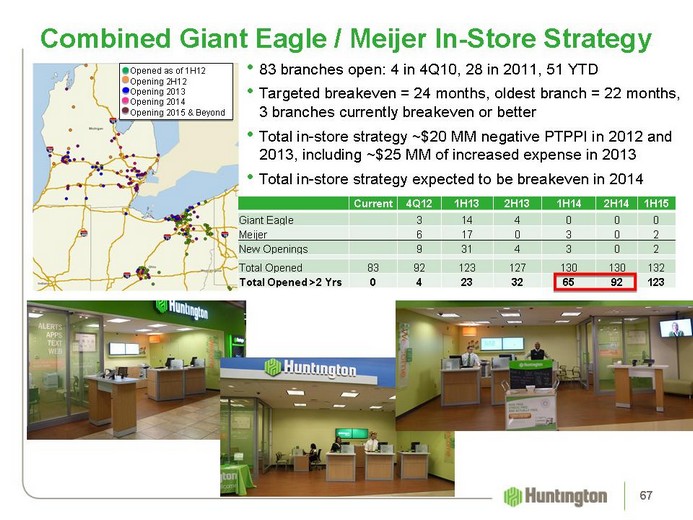
| Combined Giant Eagle / Meijer In-Store Strategy 67 Current 4Q12 1H13 2H13 1H14 2H14 1H15 Giant Eagle 3 14 4 0 0 0 Meijer 6 17 0 3 0 2 New Openings 9 31 4 3 0 2 Total Opened 83 92 123 127 130 130 132 Total Opened >2 Yrs 0 4 23 32 65 92 123 Opened as of 1H12 Opening 2H12 Opening 2013 Opening 2014 Opening 2015 & Beyond 83 branches open: 4 in 4Q10, 28 in 2011, 51 YTD Targeted breakeven = 24 months, oldest branch = 22 months, 3 branches currently breakeven or better Total in-store strategy ~$20 MM negative PTPPI in 2012 and 2013, including ~$25 MM of increased expense in 2013 Total in-store strategy expected to be breakeven in 2014 |
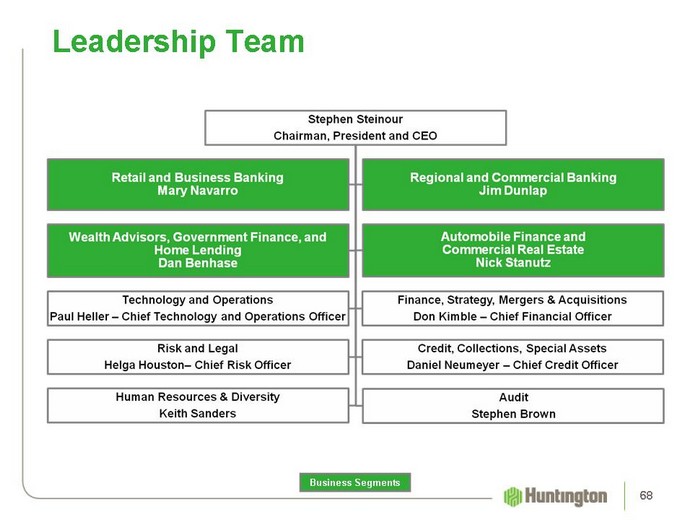
| Leadership Team Leadership Team Business Segments 68 |

| Business Segment Overview 69 |
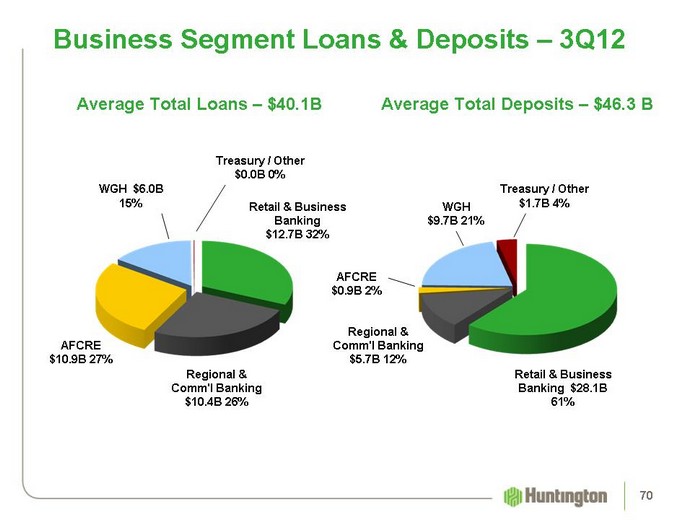
| Business Segment Loans & Deposits - 3Q12 Average Total Deposits - $46.3 B Average Total Loans - $40.1B AFCRE $10.9B 27% Retail & Business Banking $12.7B 32% Treasury / Other $0.0B 0% Regional & Comm'l Banking $10.4B 26% WGH $6.0B 15% AFCRE $0.9B 2% Treasury / Other $1.7B 4% Retail & Business Banking $28.1B 61% Regional & Comm'l Banking $5.7B 12% WGH $9.7B 21% 70 |
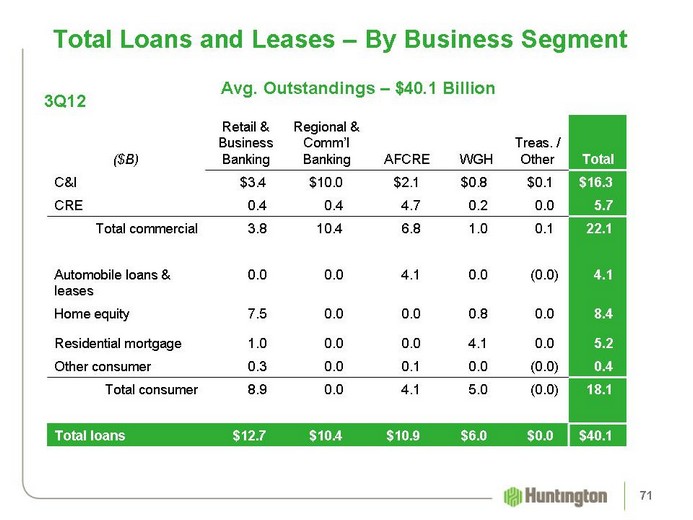
| Total Loans and Leases - By Business Segment ($B) Retail & Business Banking Regional & Comm'l Banking AFCRE WGH Treas. / Other Total C&I $3.4 $10.0 $2.1 $0.8 $0.1 $16.3 CRE 0.4 0.4 4.7 0.2 0.0 5.7 Total commercial 3.8 10.4 6.8 1.0 0.1 22.1 Automobile loans & leases 0.0 0.0 4.1 0.0 (0.0) 4.1 Home equity 7.5 0.0 0.0 0.8 0.0 8.4 Residential mortgage 1.0 0.0 0.0 4.1 0.0 5.2 Other consumer 0.3 0.0 0.1 0.0 (0.0) 0.4 Total consumer 8.9 0.0 4.1 5.0 (0.0) 18.1 Total loans $12.7 $10.4 $10.9 $6.0 $0.0 $40.1 Avg. Outstandings - $40.1 Billion 3Q12 71 |
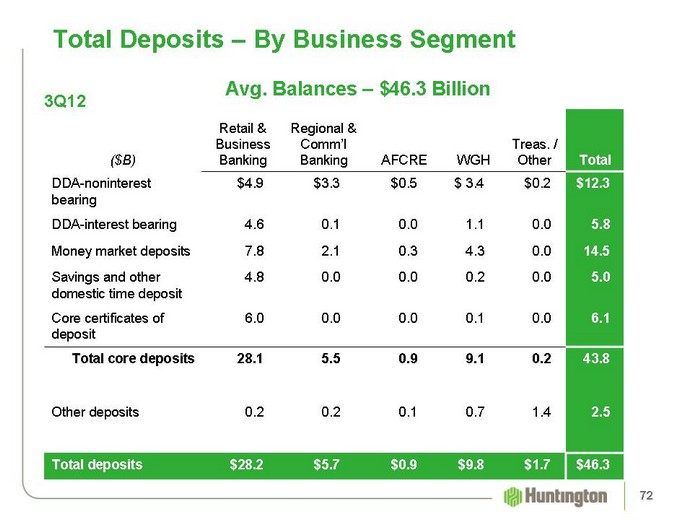
| Total Deposits - By Business Segment ($B) Retail & Business Banking Regional & Comm'l Banking AFCRE WGH Treas. / Other Total DDA-noninterest bearing $4.9 $3.3 $0.5 $ 3.4 $0.2 $12.3 DDA-interest bearing 4.6 0.1 0.0 1.1 0.0 5.8 Money market deposits 7.8 2.1 0.3 4.3 0.0 14.5 Savings and other domestic time deposit 4.8 0.0 0.0 0.2 0.0 5.0 Core certificates of deposit 6.0 0.0 0.0 0.1 0.0 6.1 Total core deposits 28.1 5.5 0.9 9.1 0.2 43.8 Other deposits 0.2 0.2 0.1 0.7 1.4 2.5 Total deposits $28.2 $5.7 $0.9 $9.8 $1.7 $46.3 Avg. Balances - $46.3 Billion 3Q12 72 |
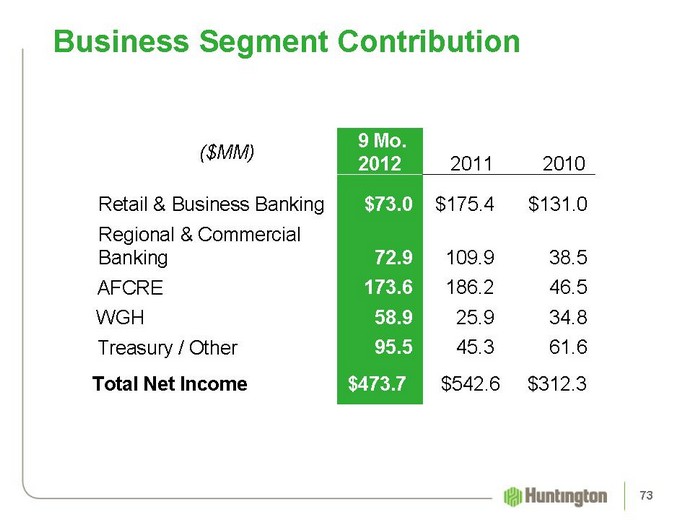
| Business Segment Contribution ($MM) 9 Mo. 2012 2011 2010 Retail & Business Banking $73.0 $175.4 $131.0 Regional & Commercial Banking 72.9 109.9 38.5 AFCRE 173.6 186.2 46.5 WGH 58.9 25.9 34.8 Treasury / Other 95.5 45.3 61.6 Total Net Income $473.7 $542.6 $312.3 73 |
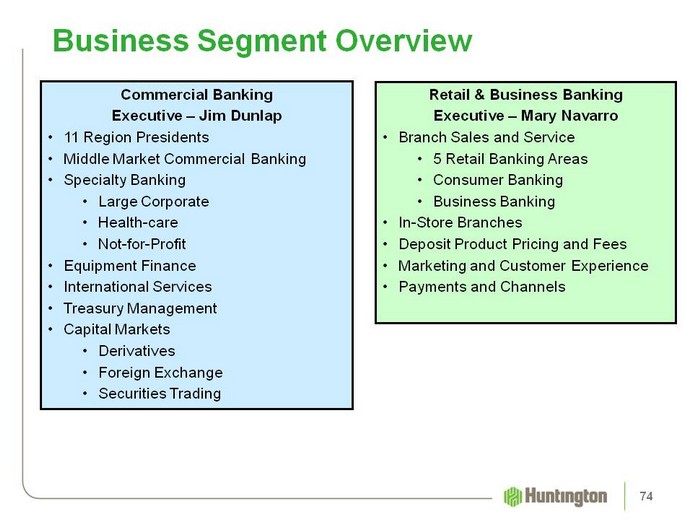
| Business Segment Overview Commercial Banking Executive - Jim Dunlap 11 Region Presidents Middle Market Commercial Banking Specialty Banking Large Corporate Health-care Not-for-Profit Equipment Finance International Services Treasury Management Capital Markets Derivatives Foreign Exchange Securities Trading Retail & Business Banking Executive - Mary Navarro Branch Sales and Service 5 Retail Banking Areas Consumer Banking Business Banking In-Store Branches Deposit Product Pricing and Fees Marketing and Customer Experience Payments and Channels 74 |
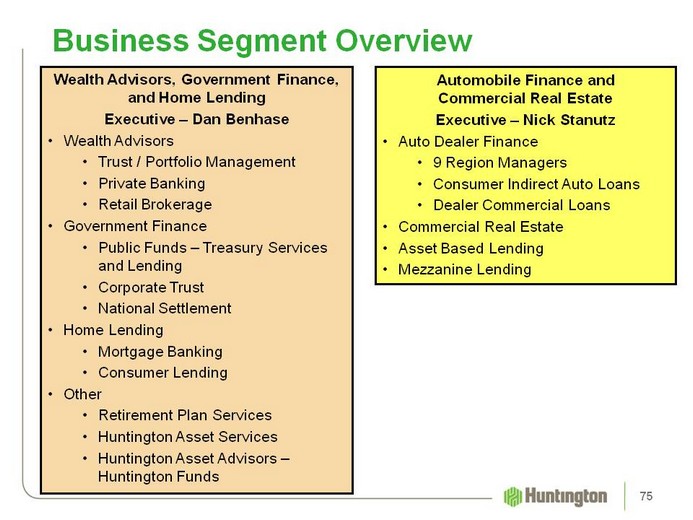
| Business Segment Overview Wealth Advisors, Government Finance, and Home Lending Executive - Dan Benhase Wealth Advisors Trust / Portfolio Management Private Banking Retail Brokerage Government Finance Public Funds - Treasury Services and Lending Corporate Trust National Settlement Home Lending Mortgage Banking Consumer Lending Other Retirement Plan Services Huntington Asset Services Huntington Asset Advisors - Huntington Funds Automobile Finance and Commercial Real Estate Executive - Nick Stanutz Auto Dealer Finance 9 Region Managers Consumer Indirect Auto Loans Dealer Commercial Loans Commercial Real Estate Asset Based Lending Mezzanine Lending 75 |
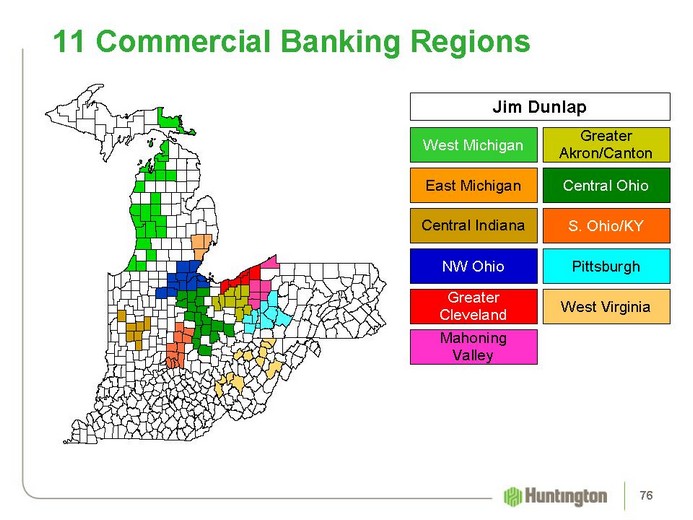
| 11 Commercial Banking Regions Greater Akron/Canton Mahoning Valley Central Ohio NW Ohio S. Ohio/KY Greater Cleveland Central Indiana West Michigan East Michigan West Virginia Pittsburgh Jim Dunlap 76 |
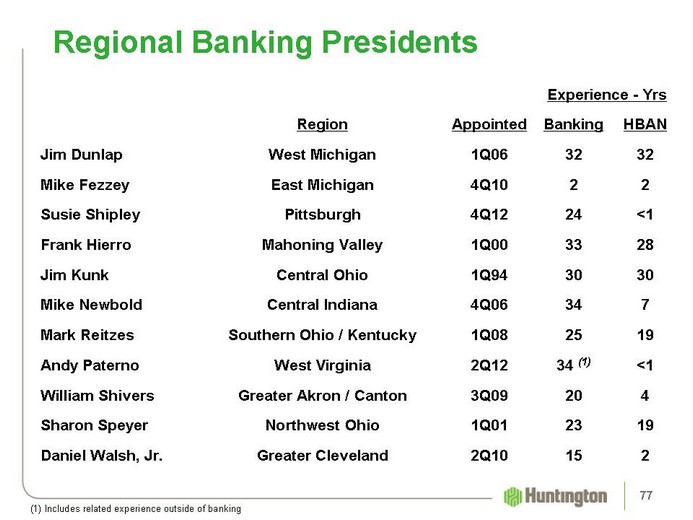
| Experience - Yrs Experience - Yrs Region Appointed Banking HBAN Jim Dunlap West Michigan 1Q06 32 32 Mike Fezzey East Michigan 4Q10 2 2 Susie Shipley Pittsburgh 4Q12 24 <1 Frank Hierro Mahoning Valley 1Q00 33 28 Jim Kunk Central Ohio 1Q94 30 30 Mike Newbold Central Indiana 4Q06 34 7 Mark Reitzes Southern Ohio / Kentucky 1Q08 25 19 Andy Paterno West Virginia 2Q12 34 (1) <1 William Shivers Greater Akron / Canton 3Q09 20 4 Sharon Speyer Northwest Ohio 1Q01 23 19 Daniel Walsh, Jr. Greater Cleveland 2Q10 15 2 Regional Banking Presidents 77 (1) Includes related experience outside of banking |
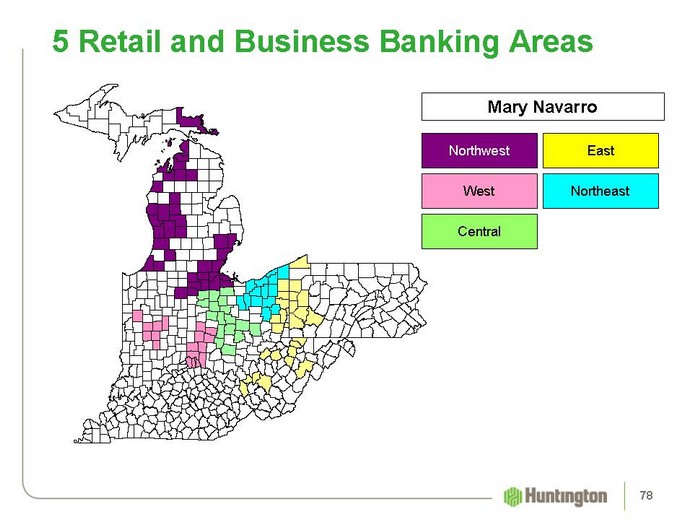
| 5 Retail and Business Banking Areas Central Northwest West Northeast East Mary Navarro 78 |
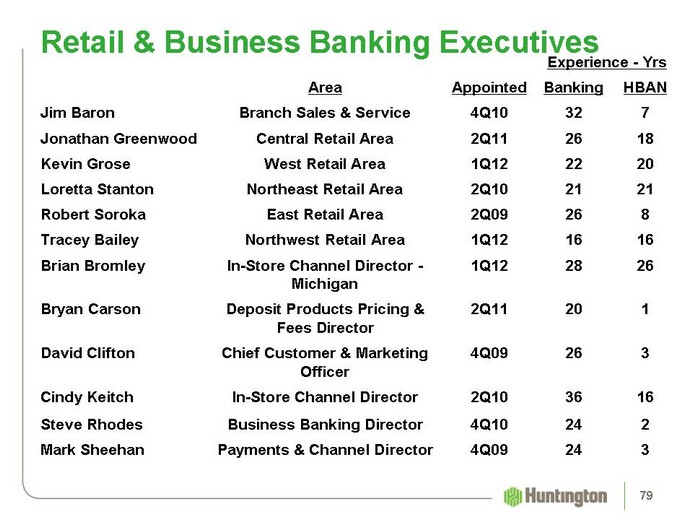
| Experience - Yrs Experience - Yrs Area Appointed Banking HBAN Jim Baron Branch Sales & Service 4Q10 32 7 Jonathan Greenwood Central Retail Area 2Q11 26 18 Kevin Grose West Retail Area 1Q12 22 20 Loretta Stanton Northeast Retail Area 2Q10 21 21 Robert Soroka East Retail Area 2Q09 26 8 Tracey Bailey Northwest Retail Area 1Q12 16 16 Brian Bromley In-Store Channel Director - Michigan 1Q12 28 26 Bryan Carson Deposit Products Pricing & Fees Director 2Q11 20 1 David Clifton Chief Customer & Marketing Officer 4Q09 26 3 Cindy Keitch In-Store Channel Director 2Q10 36 16 Steve Rhodes Business Banking Director 4Q10 24 2 Mark Sheehan Payments & Channel Director 4Q09 24 3 Retail & Business Banking Executives 79 |

| Safe Harbor Disclosures 80 |
| Use of non-GAAP financial measures This document may contain GAAP financial measures and non-GAAP financial measures where management believes it to be helpful in understanding Huntington's results of operations or financial position. Where non-GAAP financial measures are used, the comparable GAAP financial measure, as well as the reconciliation to the comparable GAAP financial measure, can be found in this document, the 2012 Third Quarter Performance Discussion and Quarterly Financial Review supplements, the 2012 third quarter earnings press release, or the Form 8-K related to this document, all of which can be found on Huntington's website at www.huntington-ir.com. Annualized data Certain returns, yields, performance ratios, or quarterly growth rates are presented on an "annualized" basis. This is done for analytical and decision-making purposes to better discern underlying performance trends when compared to full year or year-over-year amounts. For example, loan and deposit growth rates, as well as net charge-off percentages, are most often expressed in terms of an annual rate like 8%. As such, a 2% growth rate for a quarter would represent an annualized 8% growth rate. Fully-taxable equivalent interest income and net interest margin Income from tax-exempt earning assets is increased by an amount equivalent to the taxes that would have been paid if this income had been taxable at statutory rates. This adjustment puts all earning assets, most notably tax-exempt municipal securities and certain lease assets, on a common basis that facilitates comparison of results to results of competitors. Rounding Please note that columns of data in the presentation may not add due to rounding. Earnings per share equivalent data Significant income or expense items may be expressed on a per common share basis. This is done for analytical and decision-making purposes to better discern underlying trends in total corporate earnings per share performance excluding the impact of such items. Investors may also find this information helpful in their evaluation of the company's financial performance against published earnings per share mean estimate amounts, which typically exclude the impact of Significant Items. Earnings per share equivalents are usually calculated by applying a 35% effective tax rate to a pre- tax amount to derive an after-tax amount, which is divided by the average shares outstanding during the respective reporting period. Occasionally, when the item involves special tax treatment, the after-tax amount is disclosed separately, with this then being the amount used to calculate the earnings per share equivalent. Basis of Presentation 81 Do we consolidate this and next slide? |
| Significant Items From time to time, revenue, expenses, or taxes are impacted by items judged by Management to be outside of ordinary banking activities and/or by items that, while they may be associated with ordinary banking activities, are so unusually large that their outsized impact is believed by Management at that time to be infrequent or short term in nature. We refer to such items as "Significant Items". Most often, these Significant Items result from factors originating outside the company - e.g., regulatory actions/assessments, windfall gains, changes in accounting principles, one-time tax assessments/refunds, litigation actions, etc. In other cases they may result from Management decisions associated with significant corporate actions out of the ordinary course of business - e.g., merger/restructuring charges, recapitalization actions, goodwill impairment, etc. Even though certain revenue and expense items are naturally subject to more volatility than others due to changes in market and economic environment conditions, as a general rule volatility alone does not define a Significant Item. For example, changes in the provision for credit losses, gains/losses from investment activities, asset valuation write downs, etc., reflect ordinary banking activities and are, therefore, typically excluded from consideration as a Significant Item. Management believes the disclosure of "Significant Items", when appropriate, aids analysts/investors in better understanding corporate performance and trends so that they can ascertain which of such items, if any, they may wish to include/exclude from their analysis of the company's performance - i.e., within the context of determining how that performance differed from their expectations, as well as how, if at all, to adjust their estimates of future performance accordingly. To this end, Management has adopted a practice of listing "Significant Items" in its external disclosure documents (e.g., earnings press releases, quarterly performance discussions, investor presentations, Forms 10-Q and 10 K). "Significant Items" for any particular period are not intended to be a complete list of items that may materially impact current or future period performance. A number of items could materially impact these periods, including those described in Huntington's 2011 Annual Report on Form 10-K and other factors described from time to time in Huntington's other filings with the Securities and Exchange Commission. Basis of Presentation 82 |
| This document contains certain forward-looking statements, including certain plans, expectations, goals, projections, and statements, which are subject to numerous assumptions, risks, and uncertainties. Forward-looking statements may be identified by words such as expect, anticipate, believe, intend, estimate, plan, target, goal, or similar expressions, or future or conditional verbs such as will, may, might, should, would, could, or similar variations. While there is no assurance that any list of risks and uncertainties or risk factors is complete, below are certain factors which could cause actual results to differ materially from those contained or implied in the forward-looking statements: (1) worsening of credit quality performance due to a number of factors such as the underlying value of collateral that could prove less valuable than otherwise assumed and assumed cash flows may be worse than expected; (2) changes in economic conditions, including impacts from the implementation of the Budget Control Act of 2011 as well as the continuing economic uncertainty in the US, the European Union, and other areas; (3) movements in interest rates; (4) competitive pressures on product pricing and services; (5) success, impact, and timing of our business strategies, including market acceptance of any new products or services introduced to implement our "Fair Play" banking philosophy; (6) changes in accounting policies and principles and the accuracy of our assumptions and estimates used to prepare our financial statements; (7) extended disruption of vital infrastructure; (8) the final outcome of significant litigation; (9) the nature, extent, timing and results of governmental actions, examinations, reviews, reforms, and regulations including those related to the Dodd-Frank Wall Street Reform and Consumer Protection Act; and (10) the outcome of judicial and regulatory decisions regarding practices in the residential mortgage industry, including among other things the processes followed for foreclosing residential mortgages. Additional factors that could cause results to differ materially from those described above can be found in Huntington's 2011 Annual Report on Form 10-K, and documents subsequently filed by Huntington with the Securities and Exchange Commission. All forward-looking statements included in this document are based on information available at the time of the release. Huntington assumes no obligation to update any forward-looking statement. Forward Looking Statements 83 |

| 84 |