EX-99.1
Published on February 14, 2012
Exhibit 99.1

| 2012 First Quarter Investor Handout 1 February 14, 2012 |
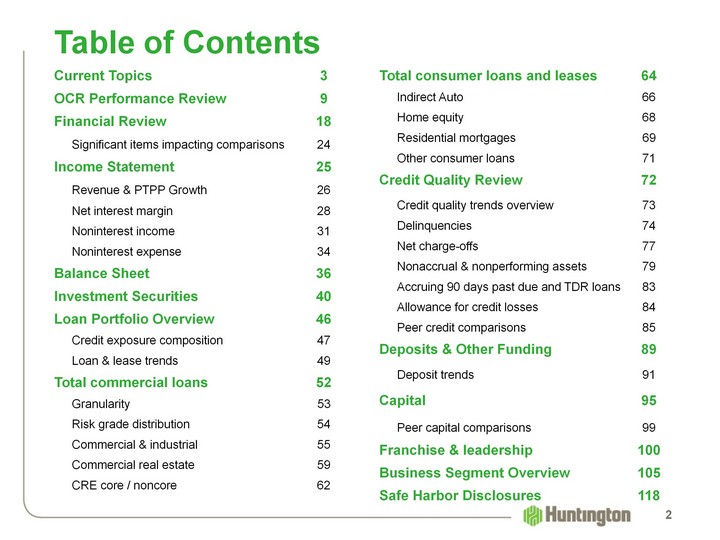
| Table of Contents Current Topics 3OCR Performance Review 9Financial Review 18 Significant items impacting comparisons 24Income Statement 25 Revenue & PTPP Growth 26 Net interest margin 28 Noninterest income 31 Noninterest expense 34Balance Sheet 36Investment Securities 40Loan Portfolio Overview 46 Credit exposure composition 47 Loan & lease trends 49Total commercial loans 52 Granularity 53 Risk grade distribution 54 Commercial & industrial 55 Commercial real estate 59 CRE core / noncore 62 Total consumer loans and leases 64 Indirect Auto 66 Home equity 68 Residential mortgages 69 Other consumer loans 71Credit Quality Review 72 Credit quality trends overview 73 Delinquencies 74 Net charge-offs 77 Nonaccrual & nonperforming assets 79 Accruing 90 days past due and TDR loans 83 Allowance for credit losses 84 Peer credit comparisons 85Deposits & Other Funding 89 Deposit trends 91Capital 95 Peer capital comparisons 99Franchise & leadership 100Business Segment Overview 105Safe Harbor Disclosures 118 2 |

| Current Topics 3 |
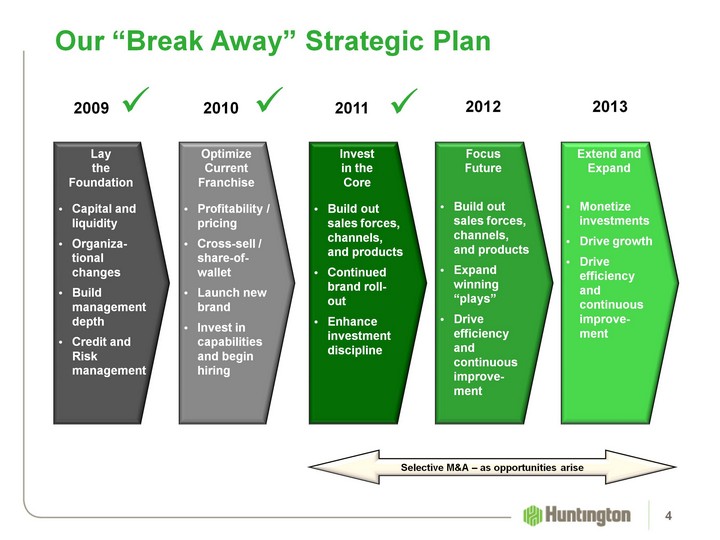
| OptimizeCurrentFranchiseProfitability / pricingCross-sell / share-of- walletLaunch new brandInvest in capabilities and begin hiring Our "Break Away" Strategic Plan 4 LaytheFoundationCapital and liquidityOrganiza- tional changes Build management depthCredit and Risk management Invest in theCoreBuild out sales forces, channels, and productsContinued brand roll- outEnhance investment discipline Selective M&A - as opportunities arise 2009 Focus FutureBuild out sales forces, channels, and productsExpand winning "plays"Drive efficiency and continuous improve- ment Extend and ExpandMonetize investmentsDrive growthDrive efficiency and continuous improve- ment 2010 2011 2012 2013 |
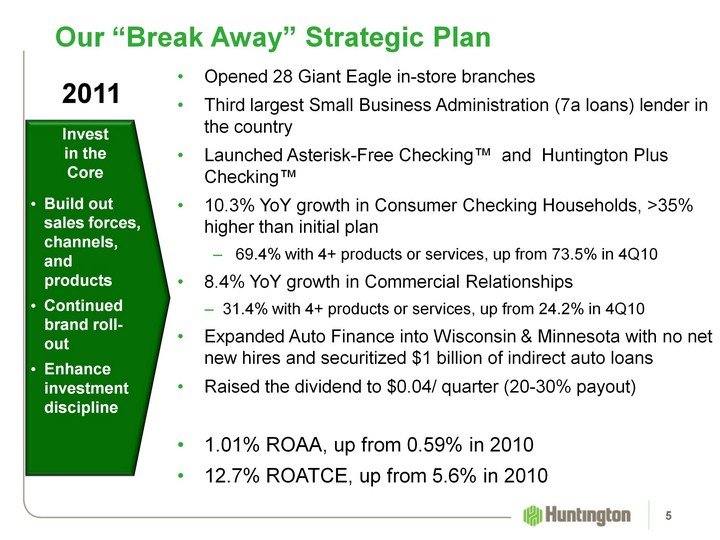
| Our "Break Away" Strategic Plan 5 Invest in theCoreBuild out sales forces, channels, and productsContinued brand roll- outEnhance investment discipline 2011 Opened 28 Giant Eagle in-store branchesThird largest Small Business Administration (7a loans) lender in the countryLaunched Asterisk-Free Checking(tm) and Huntington Plus Checking(tm)10.3% YoY growth in Consumer Checking Households, >35% higher than initial plan69.4% with 4+ products or services, up from 73.5% in 4Q108.4% YoY growth in Commercial Relationships31.4% with 4+ products or services, up from 24.2% in 4Q10Expanded Auto Finance into Wisconsin & Minnesota with no net new hires and securitized $1 billion of indirect auto loansRaised the dividend to $0.04/ quarter (20-30% payout)1.01% ROAA, up from 0.59% in 201012.7% ROATCE, up from 5.6% in 2010 |
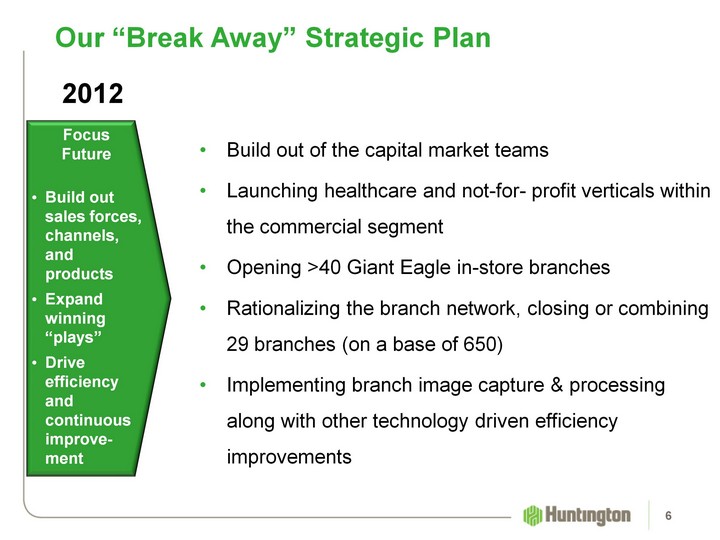
| Our "Break Away" Strategic Plan 6 Build out of the capital market teamsLaunching healthcare and not-for- profit verticals within the commercial segmentOpening >40 Giant Eagle in-store branchesRationalizing the branch network, closing or combining 29 branches (on a base of 650)Implementing branch image capture & processing along with other technology driven efficiency improvements Focus FutureBuild out sales forces, channels, and productsExpand winning "plays"Drive efficiency and continuous improve- ment 2012 |
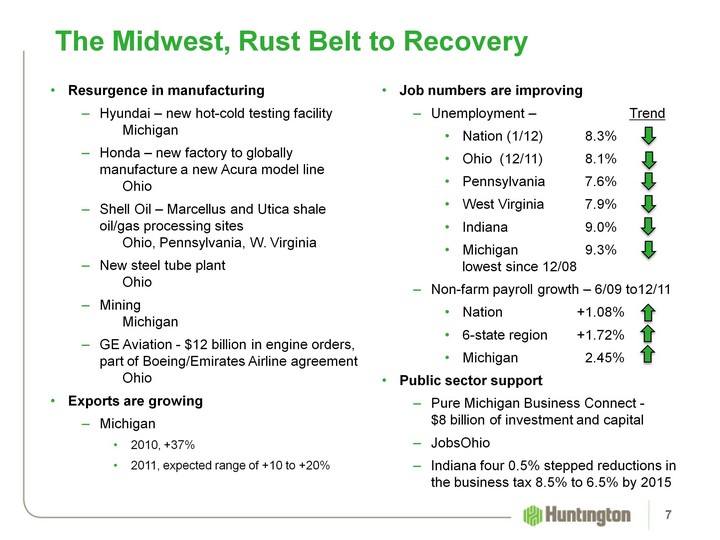
| Job numbers are improvingUnemployment - TrendNation (1/12) 8.3%Ohio (12/11) 8.1%Pennsylvania 7.6%West Virginia 7.9%Indiana 9.0%Michigan 9.3% lowest since 12/08Non-farm payroll growth - 6/09 to12/11Nation +1.08%6-state region +1.72% Michigan 2.45%Public sector supportPure Michigan Business Connect - $8 billion of investment and capitalJobsOhioIndiana four 0.5% stepped reductions in the business tax 8.5% to 6.5% by 2015 The Midwest, Rust Belt to Recovery Resurgence in manufacturingHyundai - new hot-cold testing facility MichiganHonda - new factory to globally manufacture a new Acura model line OhioShell Oil - Marcellus and Utica shale oil/gas processing sites Ohio, Pennsylvania, W. VirginiaNew steel tube plant OhioMining MichiganGE Aviation - $12 billion in engine orders, part of Boeing/Emirates Airline agreement OhioExports are growingMichigan 2010, +37%2011, expected range of +10 to +20% 7 |
| Important Messages Executing our long-term strategic planStrategic initiatives are increasingly adding to revenue"Fair Play" is working... accelerated growth in consumer checking households and increasing cross sellOCR is working... accelerated growth in commercial relationships and revenue contributionOutlook for credit performance is for improvement - manageable should the economy weakenContinuously looking for improving efficiencies / effectiveness of expense spendRelative earnings opportunities exist in a low rate environment given current funding / deposit costsStrong capital position and liquidityManaging Our Break Away Strategy 8 |
| OCR Performance Review 9 |
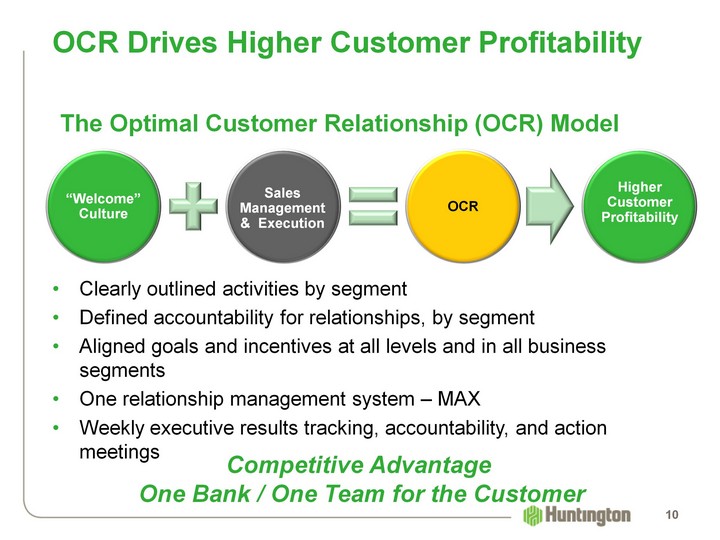
| OCR Drives Higher Customer Profitability Clearly outlined activities by segmentDefined accountability for relationships, by segmentAligned goals and incentives at all levels and in all business segmentsOne relationship management system - MAXWeekly executive results tracking, accountability, and action meetings Competitive Advantage One Bank / One Team for the Customer The Optimal Customer Relationship (OCR) Model "Welcome" Culture Sales Management & Execution OCR Higher Customer Profitability 10 |
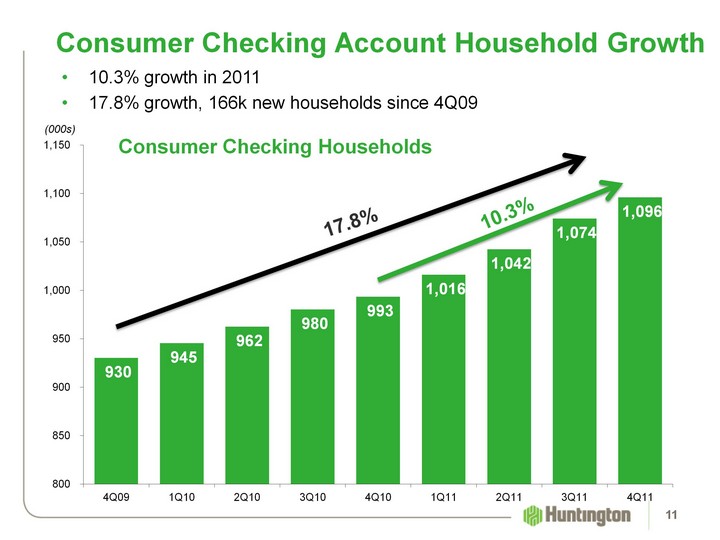
| (CHART) Consumer Checking Account Household Growth Consumer Checking Households 10.3% 10.3% growth in 201117.8% growth, 166k new households since 4Q09 (000s) 11 17.8% |
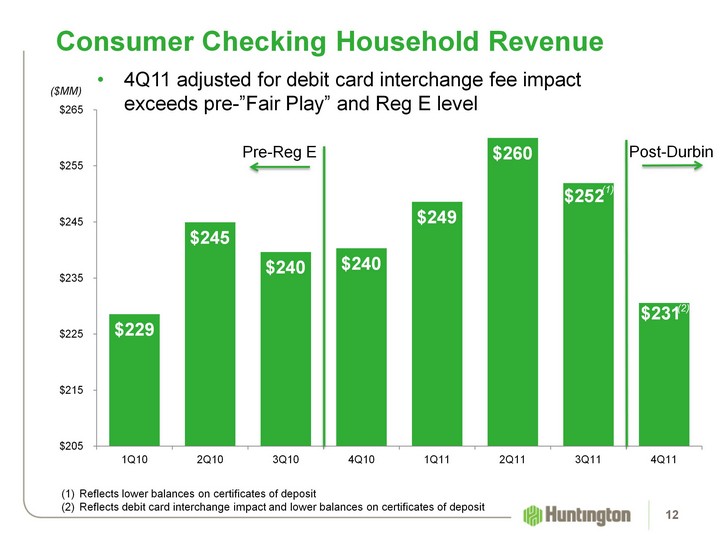
| Consumer Checking Household Revenue (CHART) (1) ($MM) 4Q11 adjusted for debit card interchange fee impact exceeds pre-"Fair Play" and Reg E level 12 Pre-Reg E Reflects lower balances on certificates of deposit Reflects debit card interchange impact and lower balances on certificates of deposit (2) Post-Durbin |
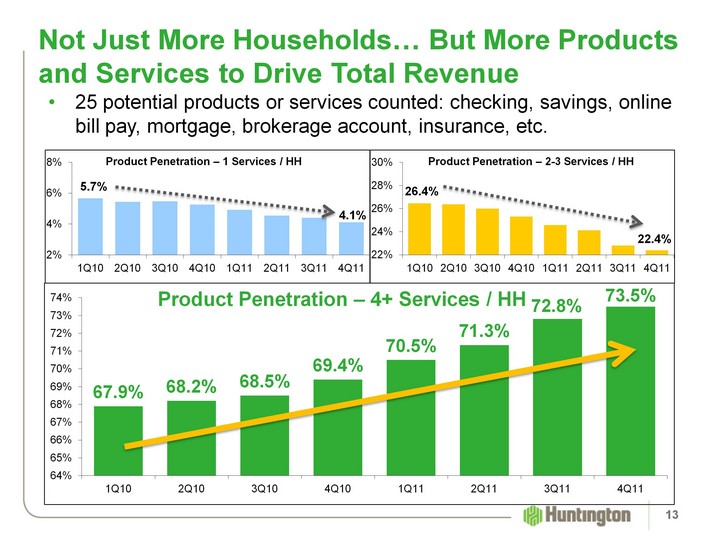
| (CHART) Not Just More Households... But More Products and Services to Drive Total Revenue Product Penetration - 4+ Services / HH 25 potential products or services counted: checking, savings, online bill pay, mortgage, brokerage account, insurance, etc. (CHART) (CHART) Product Penetration - 1 Services / HH Product Penetration - 2-3 Services / HH 13 |
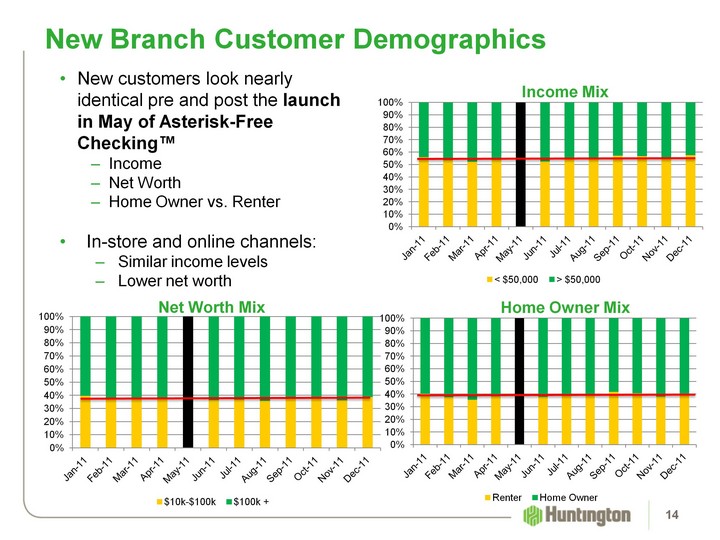
| New Branch Customer Demographics 14 (CHART) Income Mix Home Owner Mix (CHART) Net Worth Mix (CHART) New customers look nearly identical pre and post the launch in May of Asterisk-Free Checking(tm)IncomeNet WorthHome Owner vs. RenterIn-store and online channels:Similar income levels Lower net worth |
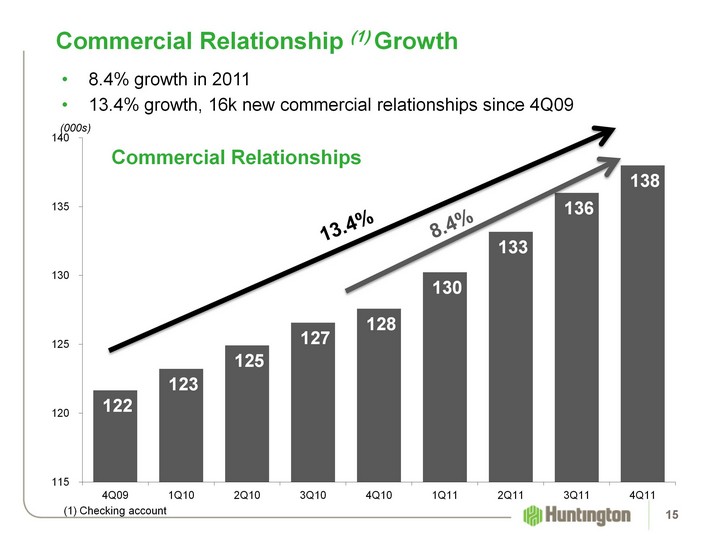
| (CHART) Commercial Relationships 8.4% (1) Checking account 8.4% growth in 201113.4% growth, 16k new commercial relationships since 4Q09 (000s) 15 Commercial Relationship (1) Growth 13.4% |
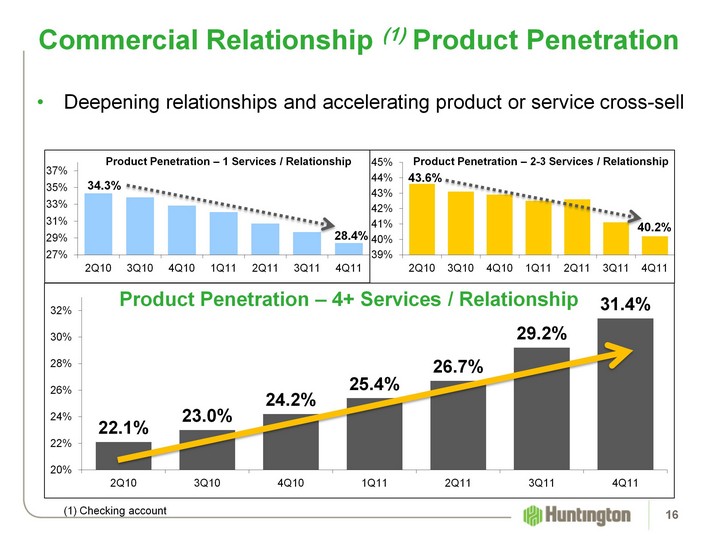
| Product Penetration - 2-3 Services / Relationship (CHART) Commercial Relationship (1) Product Penetration Product Penetration - 4+ Services / Relationship Deepening relationships and accelerating product or service cross-sell (CHART) (CHART) Product Penetration - 1 Services / Relationship 16 (1) Checking account |
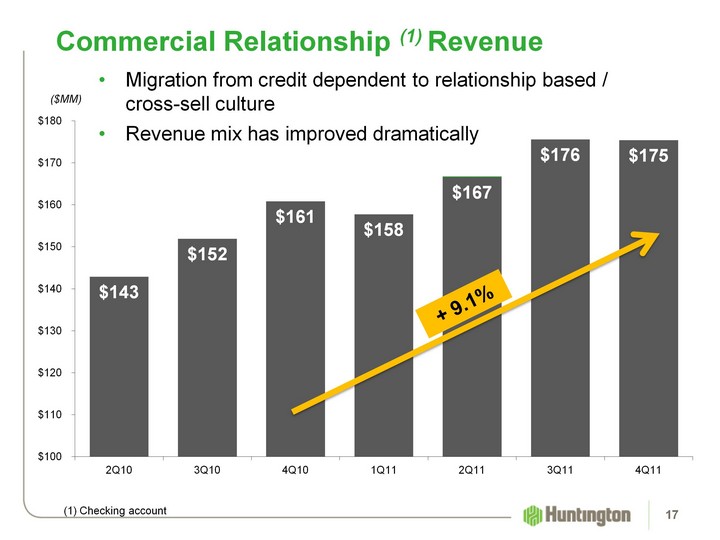
| Migration from credit dependent to relationship based / cross-sell cultureRevenue mix has improved dramatically (CHART) 17 Commercial Relationship (1) Revenue ($MM) + 9.1% (1) Checking account |

| Financial Review 18 |
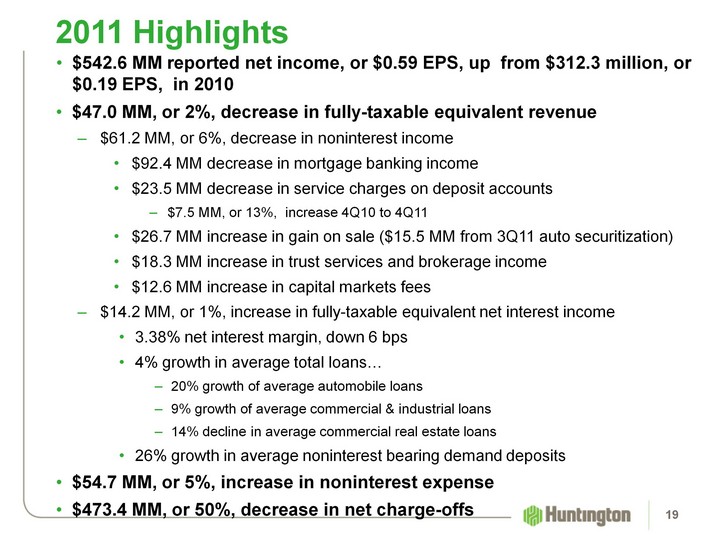
| $542.6 MM reported net income, or $0.59 EPS, up from $312.3 million, or $0.19 EPS, in 2010$47.0 MM, or 2%, decrease in fully-taxable equivalent revenue$61.2 MM, or 6%, decrease in noninterest income$92.4 MM decrease in mortgage banking income$23.5 MM decrease in service charges on deposit accounts$7.5 MM, or 13%, increase 4Q10 to 4Q11$26.7 MM increase in gain on sale ($15.5 MM from 3Q11 auto securitization)$18.3 MM increase in trust services and brokerage income$12.6 MM increase in capital markets fees$14.2 MM, or 1%, increase in fully-taxable equivalent net interest income3.38% net interest margin, down 6 bps4% growth in average total loans... 20% growth of average automobile loans9% growth of average commercial & industrial loans14% decline in average commercial real estate loans26% growth in average noninterest bearing demand deposits$54.7 MM, or 5%, increase in noninterest expense$473.4 MM, or 50%, decrease in net charge-offs 2011 Highlights 19 |
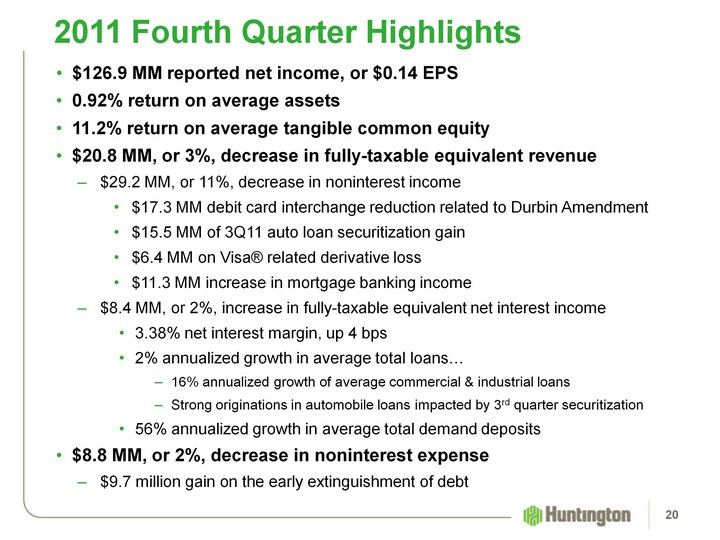
| $126.9 MM reported net income, or $0.14 EPS0.92% return on average assets11.2% return on average tangible common equity$20.8 MM, or 3%, decrease in fully-taxable equivalent revenue$29.2 MM, or 11%, decrease in noninterest income$17.3 MM debit card interchange reduction related to Durbin Amendment$15.5 MM of 3Q11 auto loan securitization gain $6.4 MM on Visa(r) related derivative loss$11.3 MM increase in mortgage banking income$8.4 MM, or 2%, increase in fully-taxable equivalent net interest income3.38% net interest margin, up 4 bps2% annualized growth in average total loans... 16% annualized growth of average commercial & industrial loansStrong originations in automobile loans impacted by 3rd quarter securitization56% annualized growth in average total demand deposits$8.8 MM, or 2%, decrease in noninterest expense$9.7 million gain on the early extinguishment of debt 2011 Fourth Quarter Highlights 20 |
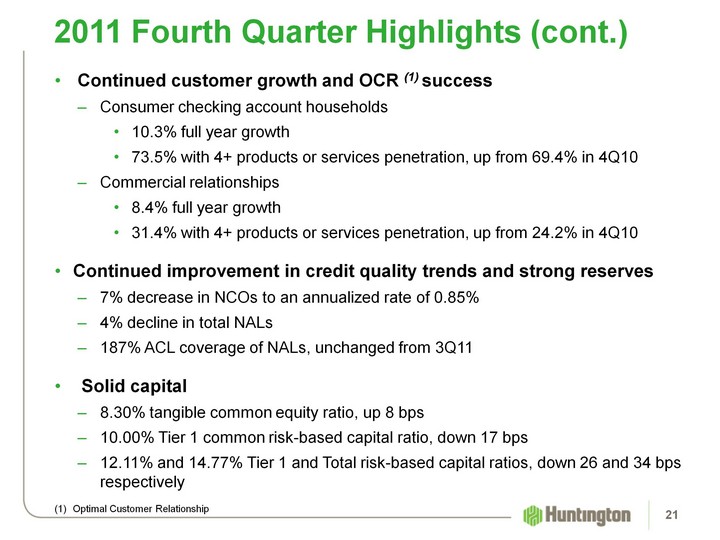
| Continued customer growth and OCR (1) successConsumer checking account households10.3% full year growth 73.5% with 4+ products or services penetration, up from 69.4% in 4Q10Commercial relationships8.4% full year growth31.4% with 4+ products or services penetration, up from 24.2% in 4Q10Continued improvement in credit quality trends and strong reserves7% decrease in NCOs to an annualized rate of 0.85%4% decline in total NALs187% ACL coverage of NALs, unchanged from 3Q11Solid capital8.30% tangible common equity ratio, up 8 bps10.00% Tier 1 common risk-based capital ratio, down 17 bps12.11% and 14.77% Tier 1 and Total risk-based capital ratios, down 26 and 34 bps respectively 2011 Fourth Quarter Highlights (cont.) Optimal Customer Relationship 21 |
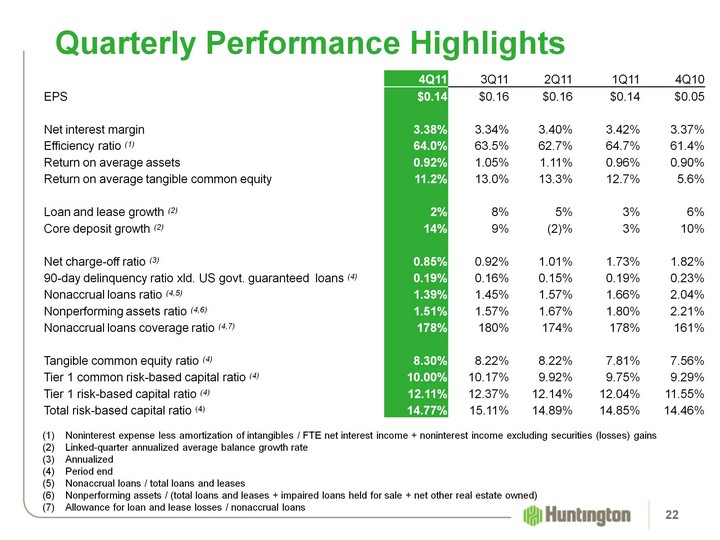
| Quarterly Performance Highlights 4Q11 3Q11 2Q11 1Q11 4Q10 EPS $0.14 $0.16 $0.16 $0.14 $0.05 Net interest margin 3.38% 3.34% 3.40% 3.42% 3.37% Efficiency ratio (1) 64.0% 63.5% 62.7% 64.7% 61.4% Return on average assets 0.92% 1.05% 1.11% 0.96% 0.90% Return on average tangible common equity 11.2% 13.0% 13.3% 12.7% 5.6% Loan and lease growth (2) 2% 8% 5% 3% 6% Core deposit growth (2) 14% 9% (2)% 3% 10% Net charge-off ratio (3) 0.85% 0.92% 1.01% 1.73% 1.82% 90-day delinquency ratio xld. US govt. guaranteed loans (4) 0.19% 0.16% 0.15% 0.19% 0.23% Nonaccrual loans ratio (4,5) 1.39% 1.45% 1.57% 1.66% 2.04% Nonperforming assets ratio (4,6) 1.51% 1.57% 1.67% 1.80% 2.21% Nonaccrual loans coverage ratio (4,7) 178% 180% 174% 178% 161% Tangible common equity ratio (4) 8.30% 8.22% 8.22% 7.81% 7.56% Tier 1 common risk-based capital ratio (4) 10.00% 10.17% 9.92% 9.75% 9.29% Tier 1 risk-based capital ratio (4) 12.11% 12.37% 12.14% 12.04% 11.55% Total risk-based capital ratio (4) 14.77% 15.11% 14.89% 14.85% 14.46% (1) Noninterest expense less amortization of intangibles / FTE net interest income + noninterest income excluding securities (losses) gainsLinked-quarter annualized average balance growth rateAnnualizedPeriod endNonaccrual loans / total loans and leasesNonperforming assets / (total loans and leases + impaired loans held for sale + net other real estate owned)Allowance for loan and lease losses / nonaccrual loans 22 |
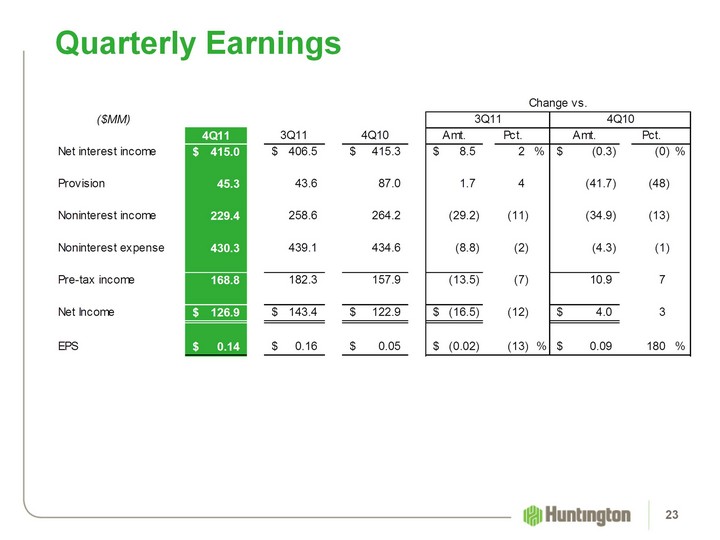
| Quarterly Earnings 23 |
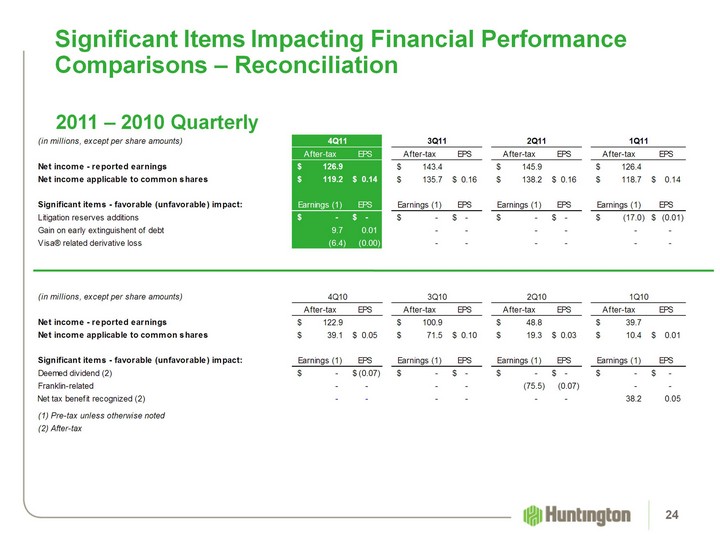
| Significant Items Impacting Financial Performance Comparisons - Reconciliation 2011 - 2010 Quarterly 24 |

| Income Statement 25 |
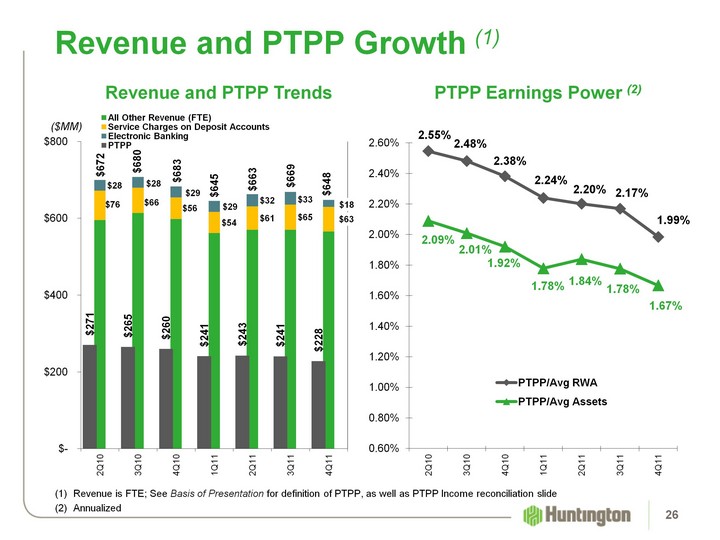
| (CHART) Revenue and PTPP Growth (1) ($MM) (CHART) (1) Revenue is FTE; See Basis of Presentation for definition of PTPP, as well as PTPP Income reconciliation slide(2) Annualized PTPP Earnings Power (2) Revenue and PTPP Trends 26 |
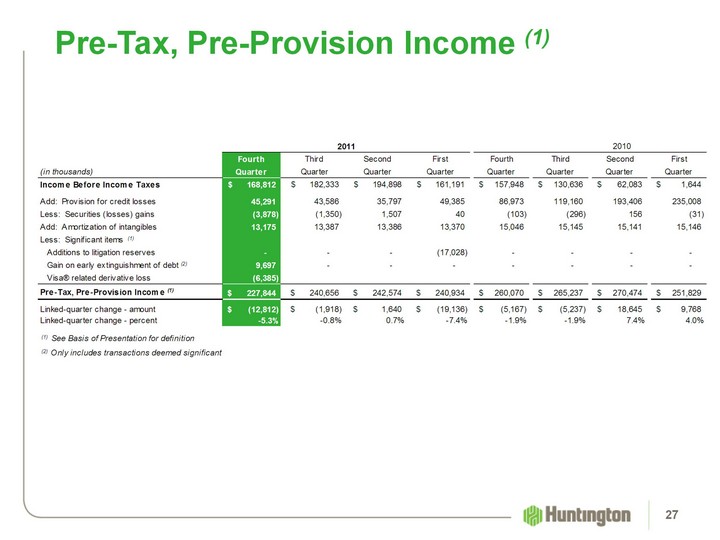
| Pre-Tax, Pre-Provision Income (1) 27 |
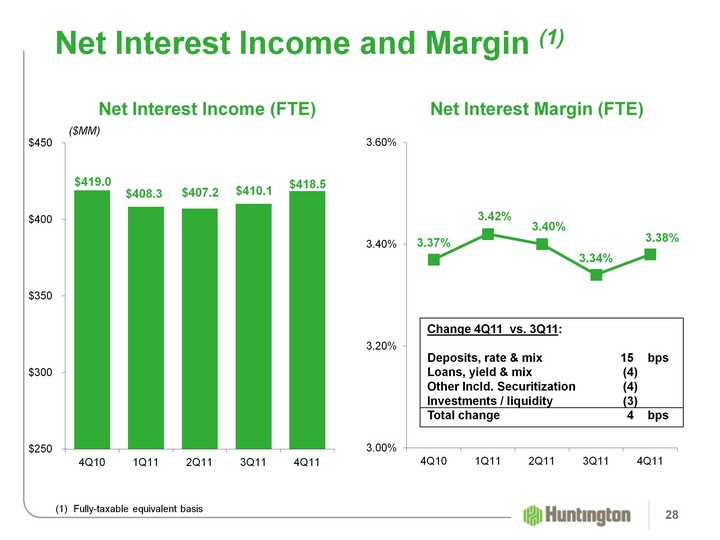
| (CHART) (CHART) Change 4Q11 vs. 3Q11:Deposits, rate & mix 15 bpsLoans, yield & mix (4) Other Incld. Securitization (4)Investments / liquidity (3)Total change 4 bps Net Interest Income and Margin (1) ($MM) (1) Fully-taxable equivalent basis Net Interest Margin (FTE) Net Interest Income (FTE) 28 |
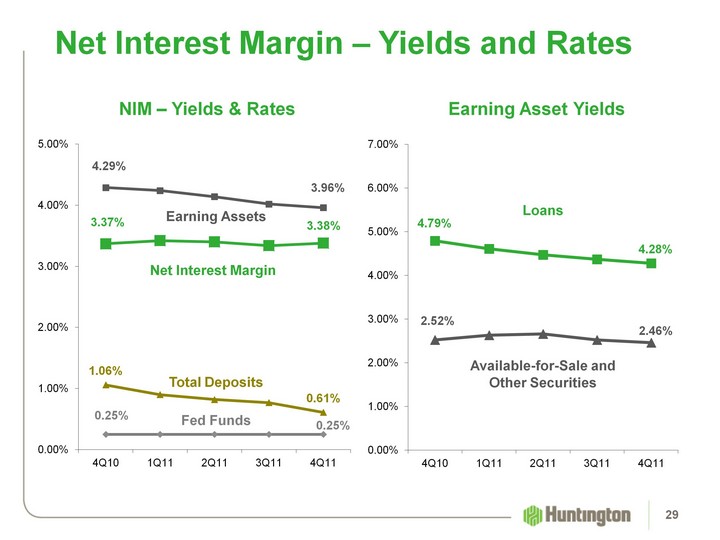
| Net Interest Margin - Yields and Rates (CHART) (CHART) Earning Assets Total Deposits Fed Funds Net Interest Margin Loans Available-for-Sale and Other Securities Earning Asset Yields NIM - Yields & Rates 29 |
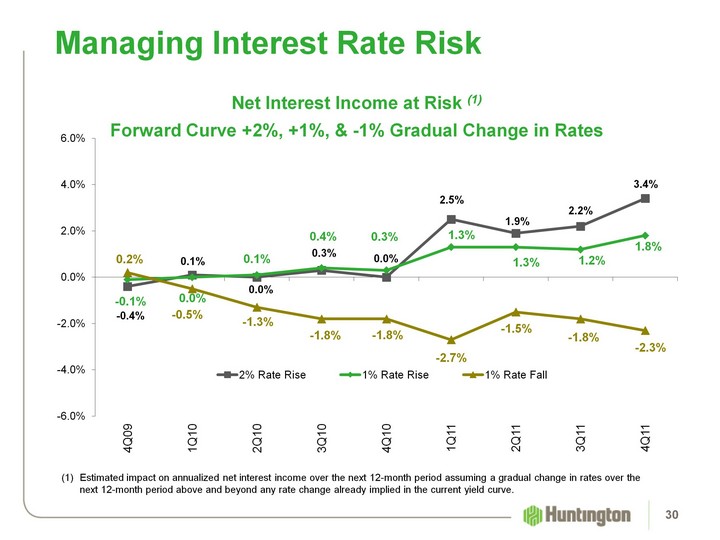
| Net Interest Income at Risk (1) Forward Curve +2%, +1%, & -1% Gradual Change in Rates(CHART) Managing Interest Rate Risk Estimated impact on annualized net interest income over the next 12-month period assuming a gradual change in rates over the next 12-month period above and beyond any rate change already implied in the current yield curve. 30 |
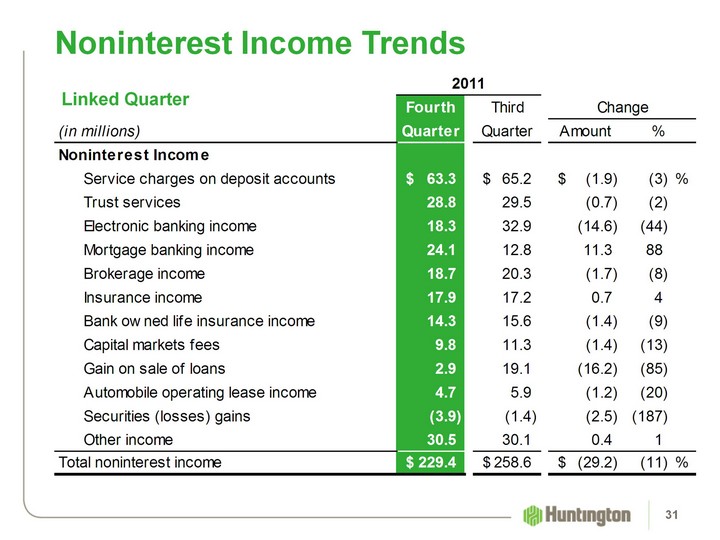
| Noninterest Income Trends Linked Quarter 31 |
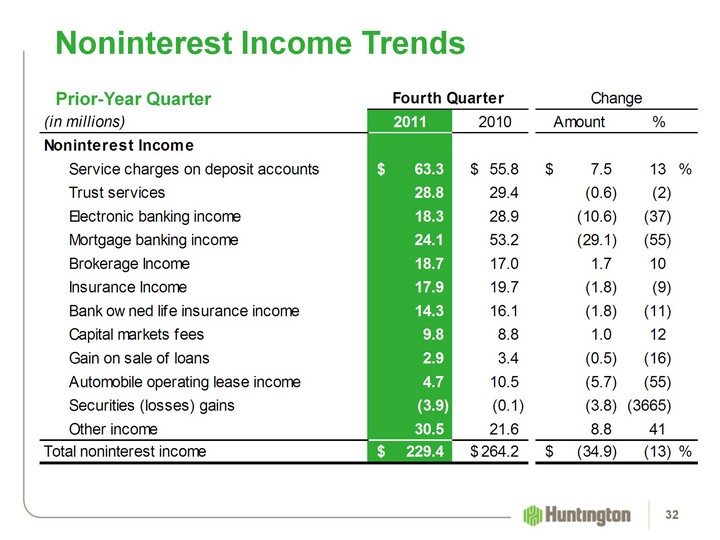
| Noninterest Income Trends Prior-Year Quarter 32 |
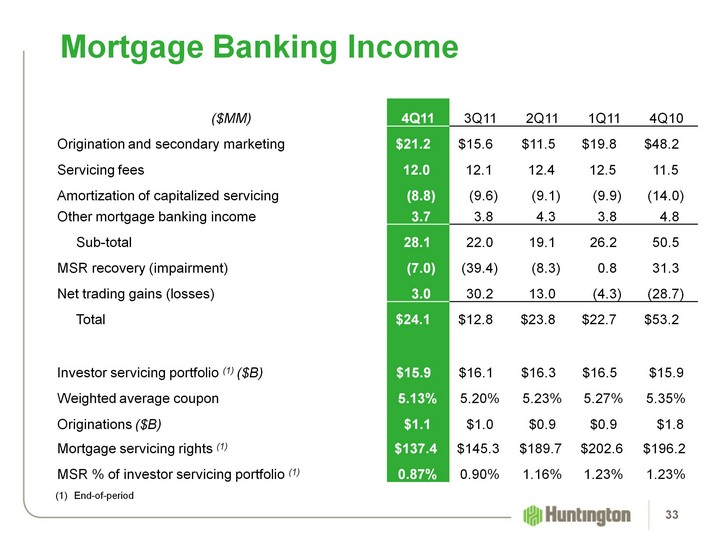
| Mortgage Banking Income ($MM) 4Q11 3Q11 2Q11 1Q11 4Q10 Origination and secondary marketing $21.2 $15.6 $11.5 $19.8 $48.2 Servicing fees 12.0 12.1 12.4 12.5 11.5 Amortization of capitalized servicing (8.8) (9.6) (9.1) (9.9) (14.0) Other mortgage banking income 3.7 3.8 4.3 3.8 4.8 Sub-total 28.1 22.0 19.1 26.2 50.5 MSR recovery (impairment) (7.0) (39.4) (8.3) 0.8 31.3 Net trading gains (losses) 3.0 30.2 13.0 (4.3) (28.7) Total $24.1 $12.8 $23.8 $22.7 $53.2 Investor servicing portfolio (1) ($B) $15.9 $16.1 $16.3 $16.5 $15.9 Weighted average coupon 5.13% 5.20% 5.23% 5.27% 5.35% Originations ($B) $1.1 $1.0 $0.9 $0.9 $1.8 Mortgage servicing rights (1) $137.4 $145.3 $189.7 $202.6 $196.2 MSR % of investor servicing portfolio (1) 0.87% 0.90% 1.16% 1.23% 1.23% (1) End-of-period 33 |
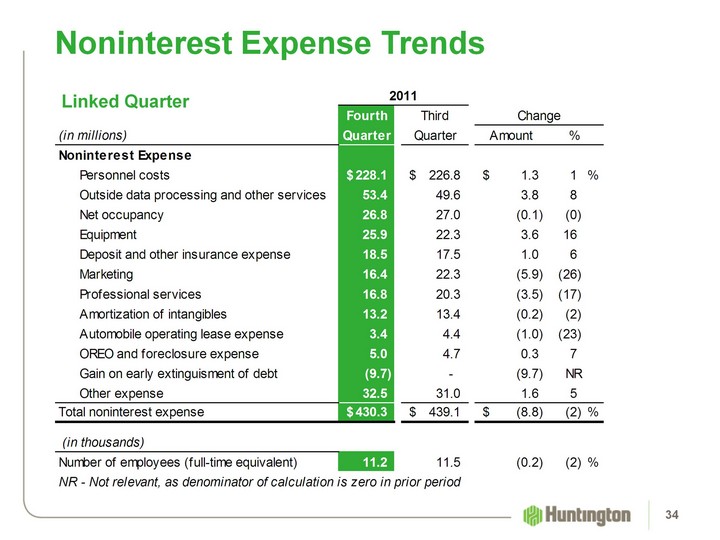
| Noninterest Expense Trends Linked Quarter 34 |
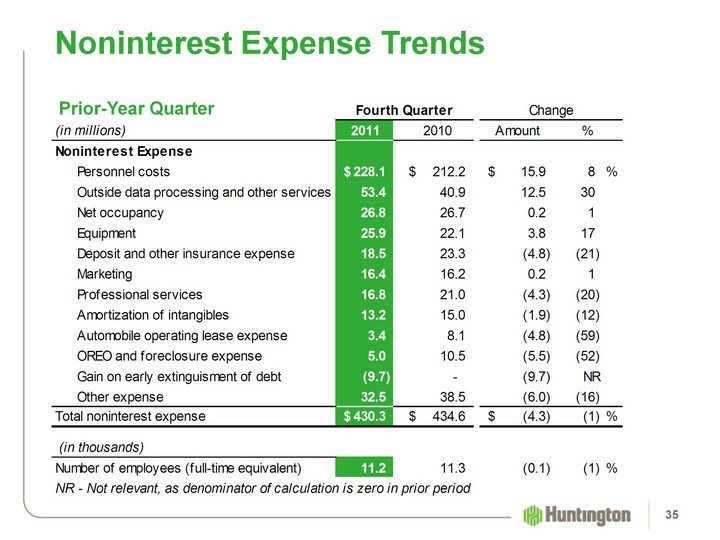
| Noninterest Expense Trends Prior-Year Quarter 35 |

| Balance Sheet 36 |
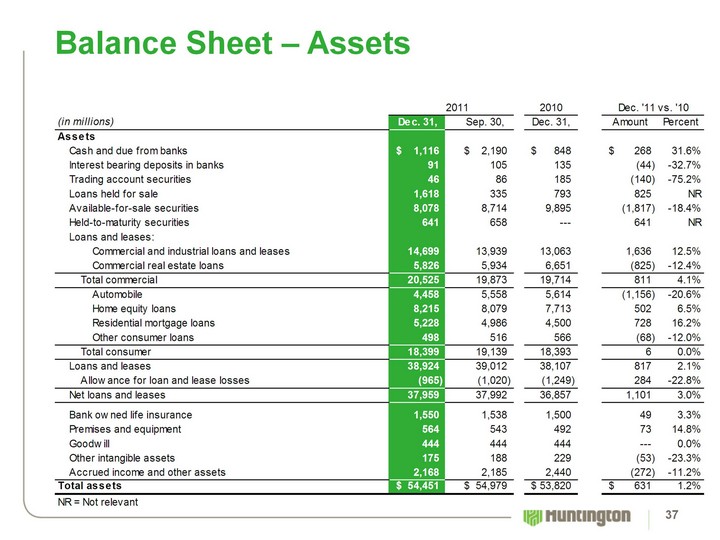
| Balance Sheet - Assets 37 |
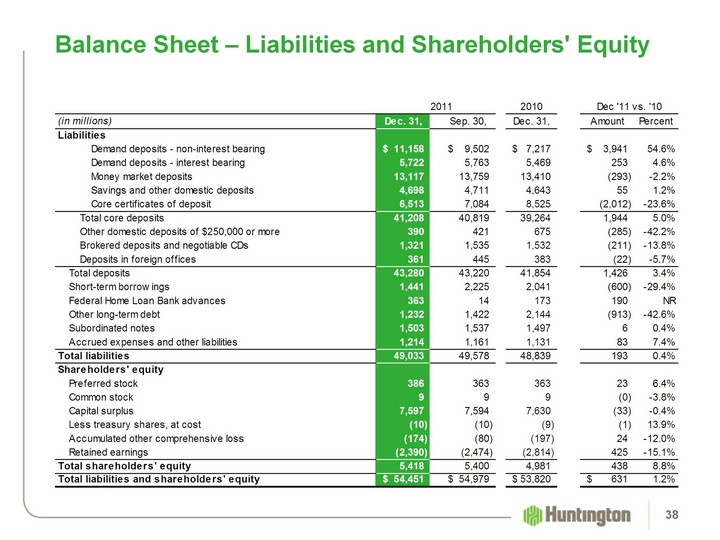
| Balance Sheet - Liabilities and Shareholders' Equity 38 |
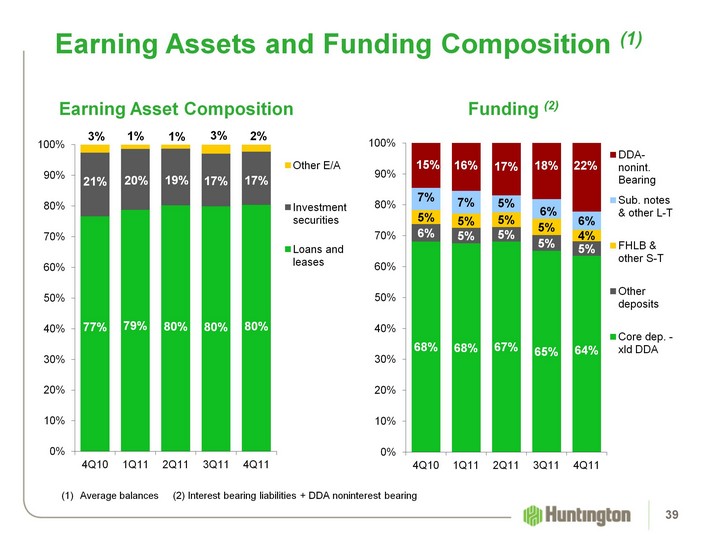
| Earning Assets and Funding Composition (1) (CHART) (1) Average balances (2) Interest bearing liabilities + DDA noninterest bearing Funding (2) Earning Asset Composition 39 (CHART) |

| Investment Securities 40 |
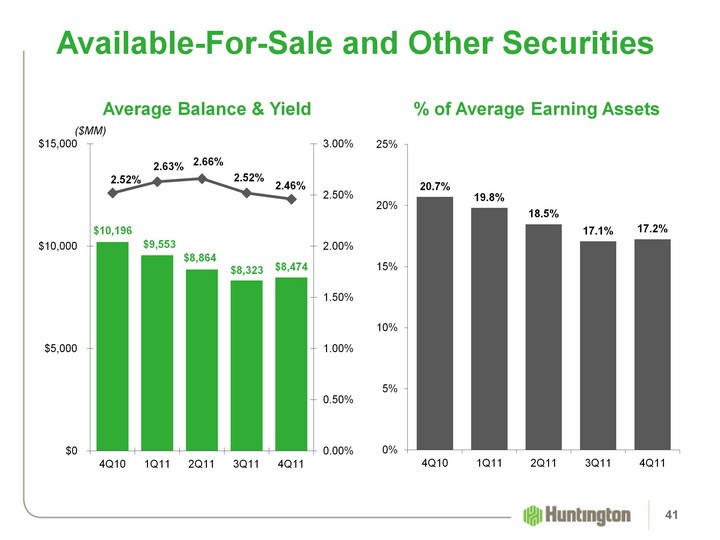
| (CHART) (CHART) Available-For-Sale and Other Securities ($MM) % of Average Earning Assets Average Balance & Yield 41 |
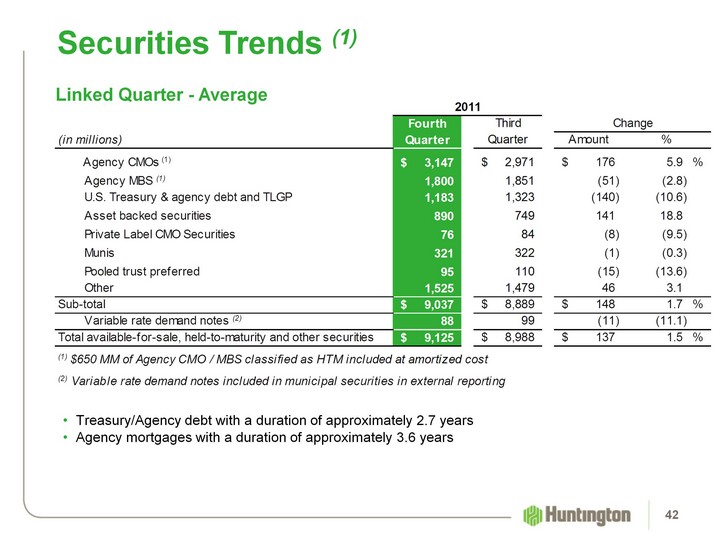
| Securities Trends (1) Linked Quarter - Average Treasury/Agency debt with a duration of approximately 2.7 yearsAgency mortgages with a duration of approximately 3.6 years 42 |
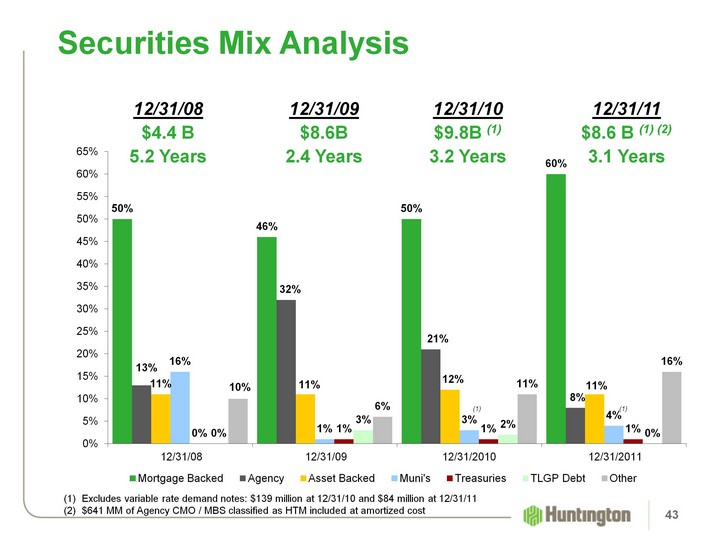
| (CHART) Securities Mix Analysis 12/31/10$9.8B (1)3.2 Years 12/31/08$4.4 B5.2 Years 12/31/09$8.6B2.4 Years Excludes variable rate demand notes: $139 million at 12/31/10 and $84 million at 12/31/11$641 MM of Agency CMO / MBS classified as HTM included at amortized cost (1) 12/31/11$8.6 B (1) (2)3.1 Years 43 (1) |
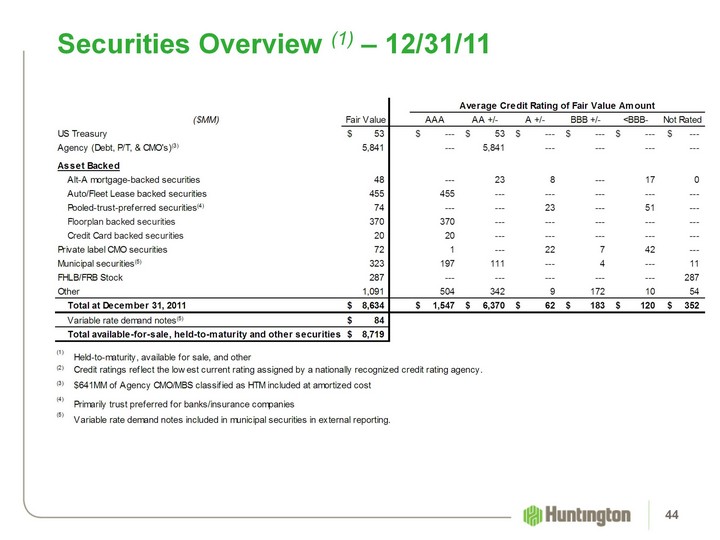
| Securities Overview (1) - 12/31/11 44 |
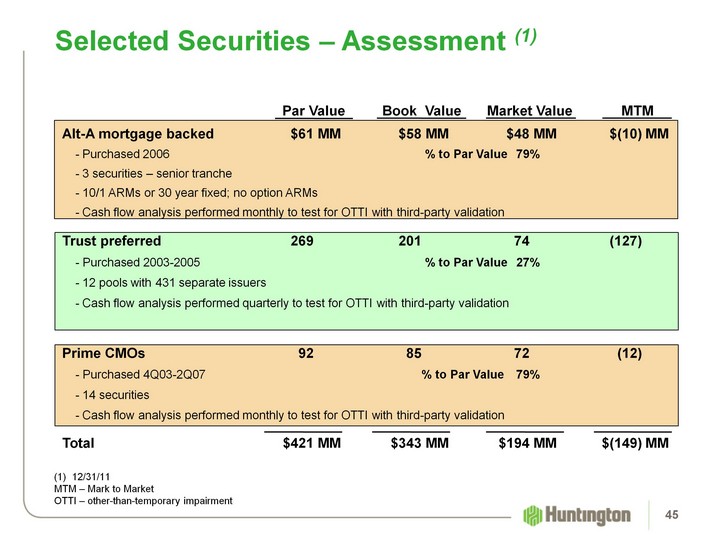
| Selected Securities - Assessment (1) Par Value Book Value Market Value MTMAlt-A mortgage backed $61 MM $58 MM $48 MM $(10) MM - Purchased 2006 % to Par Value 79% - 3 securities - senior tranche - 10/1 ARMs or 30 year fixed; no option ARMs - Cash flow analysis performed monthly to test for OTTI with third-party validationTrust preferred 269 201 74 (127) - Purchased 2003-2005 % to Par Value 27% - 12 pools with 431 separate issuers - Cash flow analysis performed quarterly to test for OTTI with third-party validationPrime CMOs 92 85 72 (12) - Purchased 4Q03-2Q07 % to Par Value 79% - 14 securities - Cash flow analysis performed monthly to test for OTTI with third-party validationTotal $421 MM $343 MM $194 MM $(149) MM 12/31/11MTM - Mark to MarketOTTI - other-than-temporary impairment 45 |

| Loan Portfolio Overview 46 |
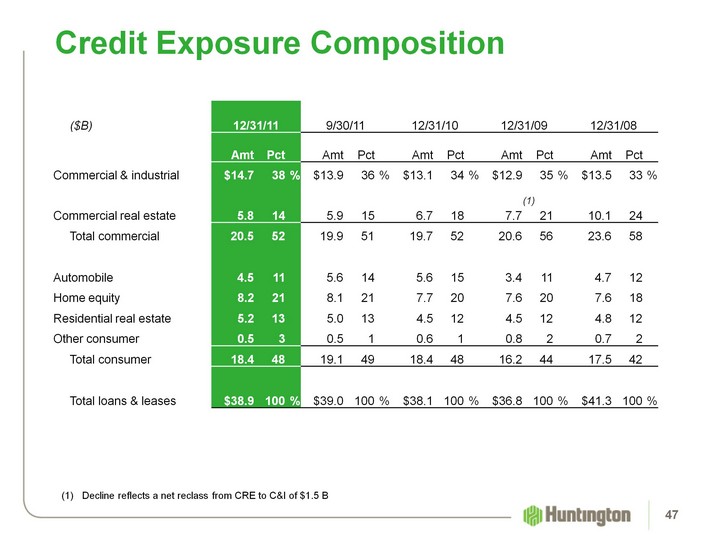
| ($B) 12/31/11 12/31/11 12/31/11 9/30/11 9/30/11 9/30/11 12/31/10 12/31/10 12/31/10 12/31/09 12/31/09 12/31/09 12/31/08 12/31/08 12/31/08 Amt Pct Amt Pct Amt Pct Amt Pct Amt Pct Commercial & industrial $14.7 38 % $13.9 36 % $13.1 34 % $12.9 35 % $13.5 33 % Commercial real estate 5.8 14 5.9 15 6.7 18 7.7 21 10.1 24 Total commercial 20.5 52 19.9 51 19.7 52 20.6 56 23.6 58 Automobile 4.5 11 5.6 14 5.6 15 3.4 11 4.7 12 Home equity 8.2 21 8.1 21 7.7 20 7.6 20 7.6 18 Residential real estate 5.2 13 5.0 13 4.5 12 4.5 12 4.8 12 Other consumer 0.5 3 0.5 1 0.6 1 0.8 2 0.7 2 Total consumer 18.4 48 19.1 49 18.4 48 16.2 44 17.5 42 Total loans & leases $38.9 100 % $39.0 100 % $38.1 100 % $36.8 100 % $41.3 100 % Credit Exposure Composition (1) Decline reflects a net reclass from CRE to C&I of $1.5 B (1) 47 |
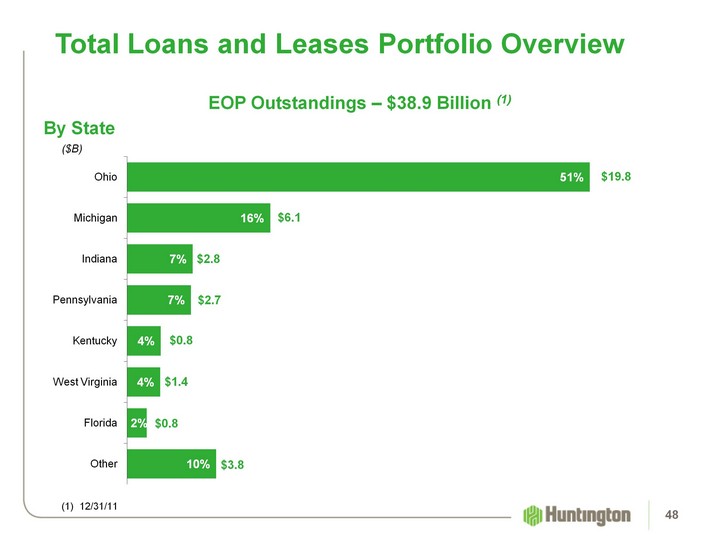
| (CHART) Total Loans and Leases Portfolio Overview ($B) $19.8 $6.1 $2.8 $1.4 $2.7 $0.8 $0.8 $3.8 EOP Outstandings - $38.9 Billion (1) (1) 12/31/11 By State 48 |
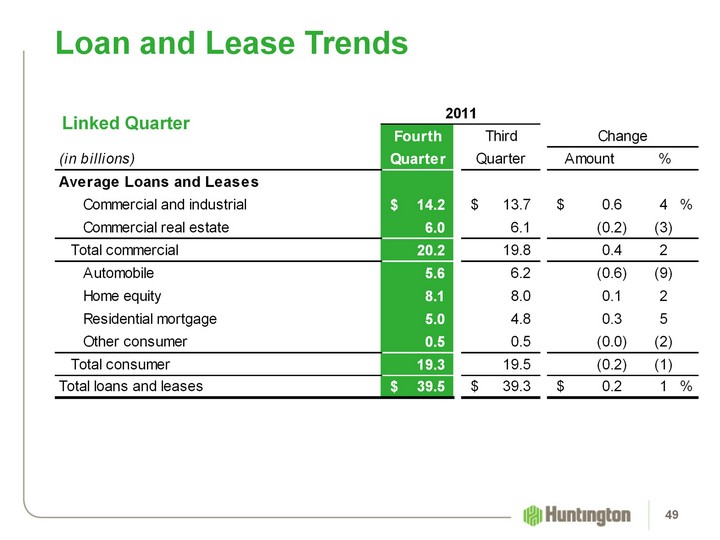
| Linked Quarter Loan and Lease Trends 49 |
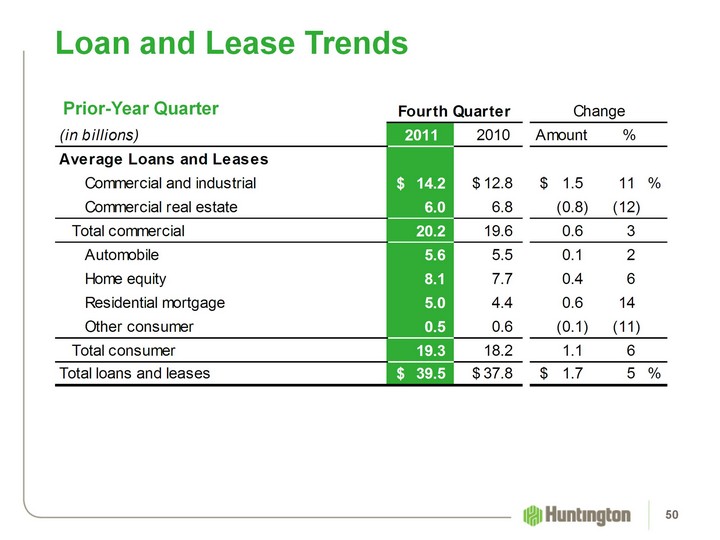
| Loan and Lease Trends 50 Prior-Year Quarter |
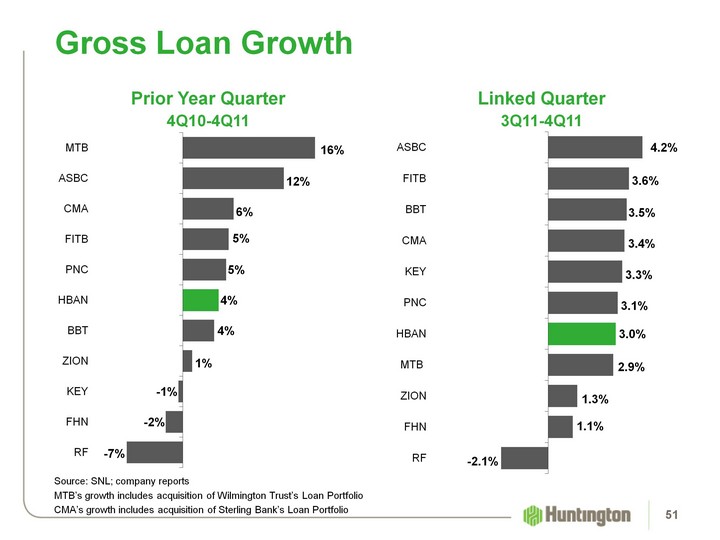
| Gross Loan Growth (CHART) (CHART) Source: SNL; company reportsMTB's growth includes acquisition of Wilmington Trust's Loan Portfolio CMA's growth includes acquisition of Sterling Bank's Loan Portfolio Prior Year Quarter4Q10-4Q11 Linked Quarter3Q11-4Q11 51 |
| Total Commercial Loans 52 |
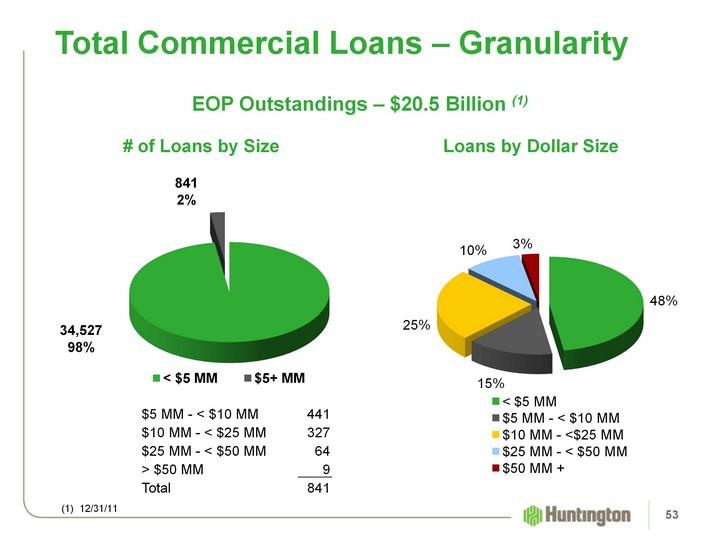
| (CHART) Total Commercial Loans - Granularity EOP Outstandings - $20.5 Billion (1) (CHART) 841 2% 34,52798% (1) 12/31/11 Loans by Dollar Size # of Loans by Size $5 MM - < $10 MM 441$10 MM - < $25 MM 327$25 MM - < $50 MM 64> $50 MM 9Total 841 53 |
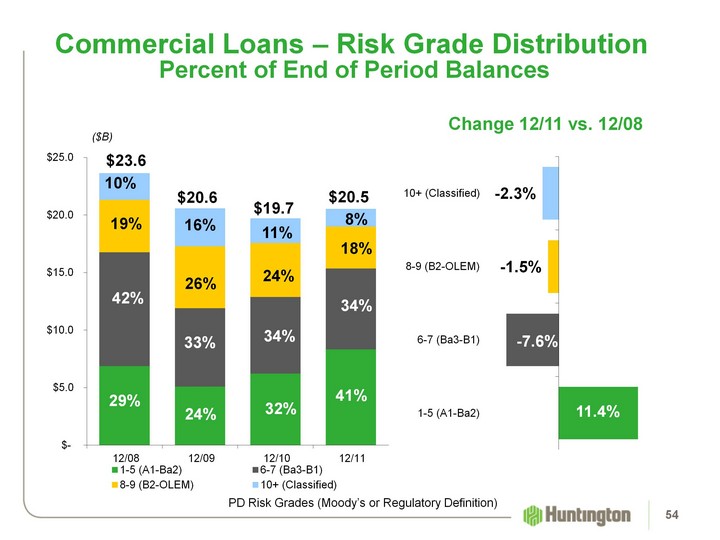
| (CHART) Commercial Loans - Risk Grade Distribution PD Risk Grades (Moody's or Regulatory Definition) Percent of End of Period Balances ($B) $23.6 $20.6 19% 16% 10% 42% 29% 11% $19.7 15% 8% $20.5 54 26% 33% 24% 24% 34% 32% 18% 34% 41% (CHART) Change 12/11 vs. 12/08 |
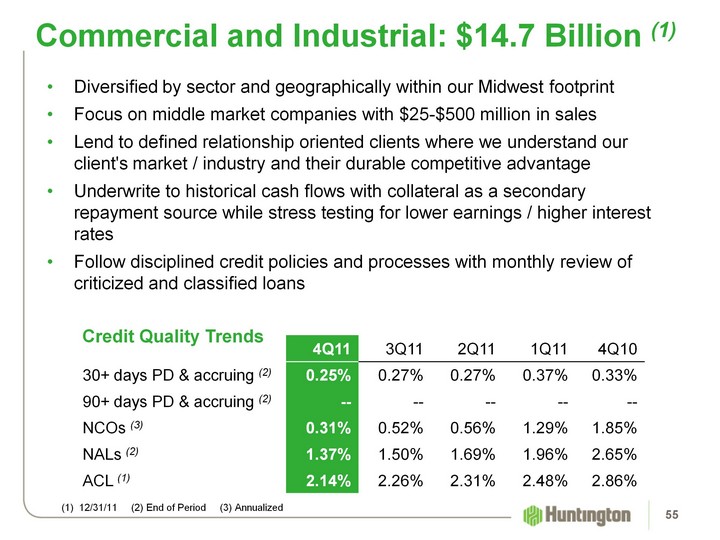
| Diversified by sector and geographically within our Midwest footprintFocus on middle market companies with $25-$500 million in salesLend to defined relationship oriented clients where we understand our client's market / industry and their durable competitive advantageUnderwrite to historical cash flows with collateral as a secondary repayment source while stress testing for lower earnings / higher interest ratesFollow disciplined credit policies and processes with monthly review of criticized and classified loans Credit Quality Trends Commercial and Industrial: $14.7 Billion (1) (1) 12/31/11 (2) End of Period (3) Annualized 4Q11 3Q11 2Q11 1Q11 4Q10 30+ days PD & accruing (2) 0.25% 0.27% 0.27% 0.37% 0.33% 90+ days PD & accruing (2) -- -- -- -- -- NCOs (3) 0.31% 0.52% 0.56% 1.29% 1.85% NALs (2) 1.37% 1.50% 1.69% 1.96% 2.65% ACL (1) 2.14% 2.26% 2.31% 2.48% 2.86% 55 |
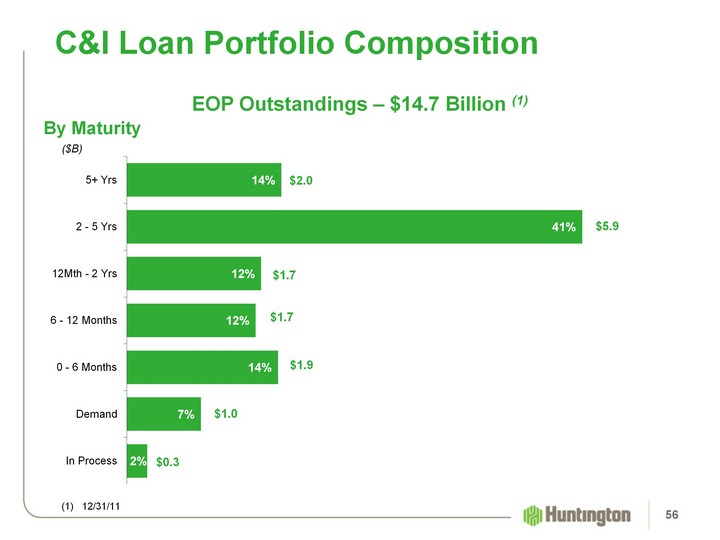
| (CHART) C&I Loan Portfolio Composition ($B) EOP Outstandings - $14.7 Billion (1) (1) 12/31/11 By Maturity $2.0 $5.9 $1.7 $1.7 $1.9 $1.0 $0.3 56 |
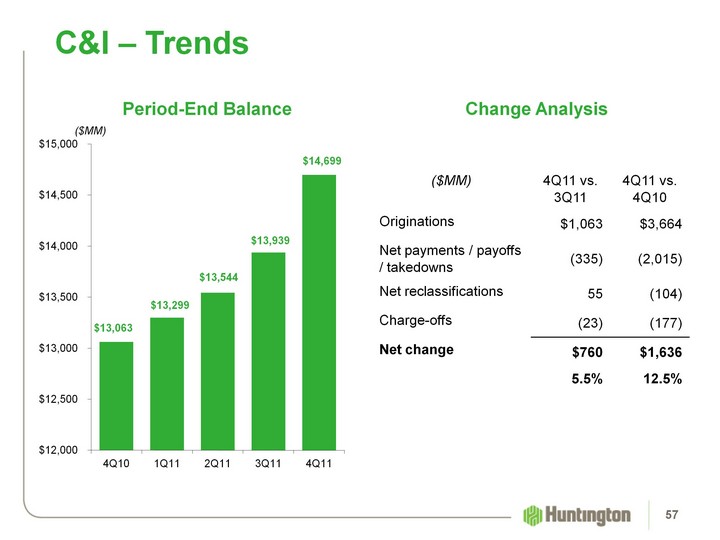
| (CHART) C&I - Trends ($MM) Change Analysis Period-End Balance ($MM) 4Q11 vs. 3Q11 4Q11 vs. 4Q10 Originations $1,063 $3,664 Net payments / payoffs / takedowns (335) (2,015) Net reclassifications 55 (104) Charge-offs (23) (177) Net change $760 $1,636 5.5% 12.5% 57 |
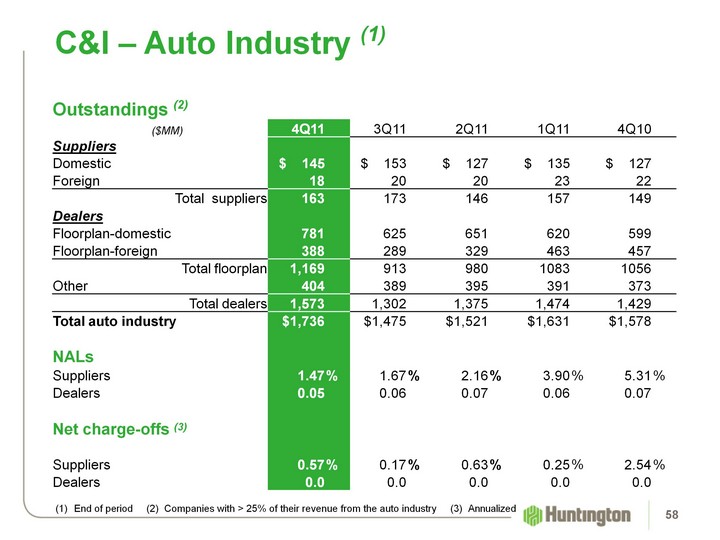
| C&I - Auto Industry (1) Outstandings (2) ($MM) 4Q11 3Q11 2Q11 1Q11 4Q10 Suppliers Domestic $ 145 $ 153 $ 127 $ 135 $ 127 Foreign 18 20 20 23 22 Total suppliers 163 173 146 157 149 Dealers Floorplan-domestic 781 625 651 620 599 Floorplan-foreign 388 289 329 463 457 Total floorplan 1,169 913 980 1083 1056 Other 404 389 395 391 373 Total dealers 1,573 1,302 1,375 1,474 1,429 Total auto industry $1,736 $1,475 $1,521 $1,631 $1,578 NALs Suppliers 1.47 % 1.67 % 2.16 % 3.90 % 5.31 % Dealers 0.05 0.06 0.07 0.06 0.07 Net charge-offs (3) Suppliers 0.57 % 0.17 % 0.63 % 0.25 %% 2.54 % Dealers 0.0 0.0 0.0 0.0 0.0 (1) End of period (2) Companies with > 25% of their revenue from the auto industry (3) Annualized 58 |
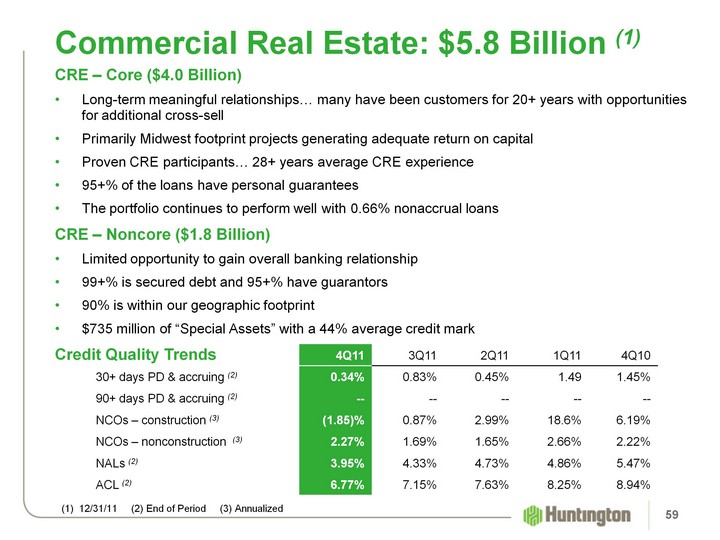
| Commercial Real Estate: $5.8 Billion (1) CRE - Core ($4.0 Billion)Long-term meaningful relationships... many have been customers for 20+ years with opportunities for additional cross-sellPrimarily Midwest footprint projects generating adequate return on capitalProven CRE participants... 28+ years average CRE experience95+% of the loans have personal guaranteesThe portfolio continues to perform well with 0.66% nonaccrual loansCRE - Noncore ($1.8 Billion)Limited opportunity to gain overall banking relationship99+% is secured debt and 95+% have guarantors90% is within our geographic footprint$735 million of "Special Assets" with a 44% average credit markCredit Quality Trends 4Q11 3Q11 2Q11 1Q11 4Q10 30+ days PD & accruing (2) 0.34% 0.83% 0.45% 1.49 1.45% 90+ days PD & accruing (2) -- -- -- -- -- NCOs - construction (3) (1.85)% 0.87% 2.99% 18.6% 6.19% NCOs - nonconstruction (3) 2.27% 1.69% 1.65% 2.66% 2.22% NALs (2) 3.95% 4.33% 4.73% 4.86% 5.47% ACL (2) 6.77% 7.15% 7.63% 8.25% 8.94% 59 (1) 12/31/11 (2) End of Period (3) Annualized |
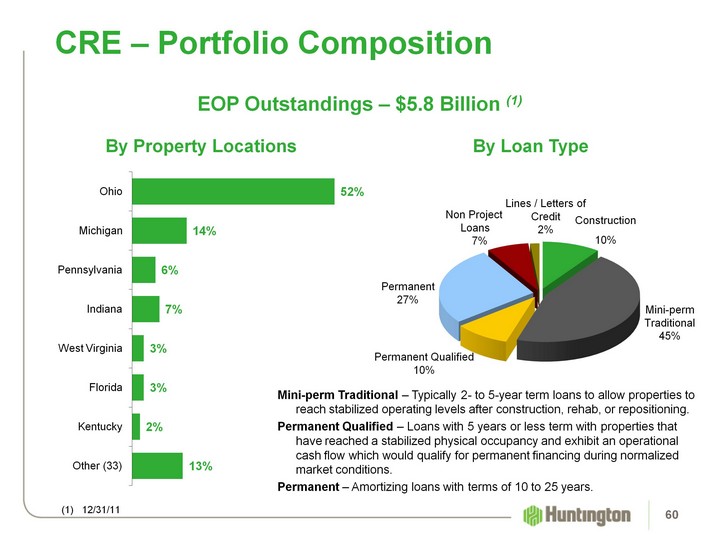
| (CHART) CRE - Portfolio Composition Permanent 27% Mini-perm Traditional45% Construction 10% Non Project Loans 7% (CHART) Lines / Letters of Credit2% (1) 12/31/11 Permanent Qualified10% Mini-perm Traditional - Typically 2- to 5-year term loans to allow properties to reach stabilized operating levels after construction, rehab, or repositioning.Permanent Qualified - Loans with 5 years or less term with properties that have reached a stabilized physical occupancy and exhibit an operational cash flow which would qualify for permanent financing during normalized market conditions.Permanent - Amortizing loans with terms of 10 to 25 years. EOP Outstandings - $5.8 Billion (1) By Loan Type By Property Locations 60 |
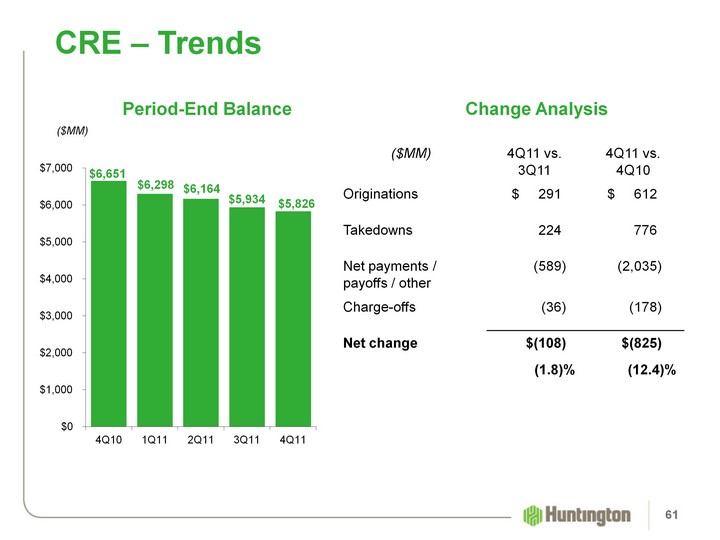
| (CHART) CRE - Trends ($MM) Change Analysis Period-End Balance ($MM) 4Q11 vs. 3Q11 4Q11 vs. 4Q10 Originations $ 291 $ 612 Takedowns 224 776 Net payments / payoffs / other (589) (2,035) Charge-offs (36) (178) Net change $(108) $(825) (1.8)% (12.4)% 61 |
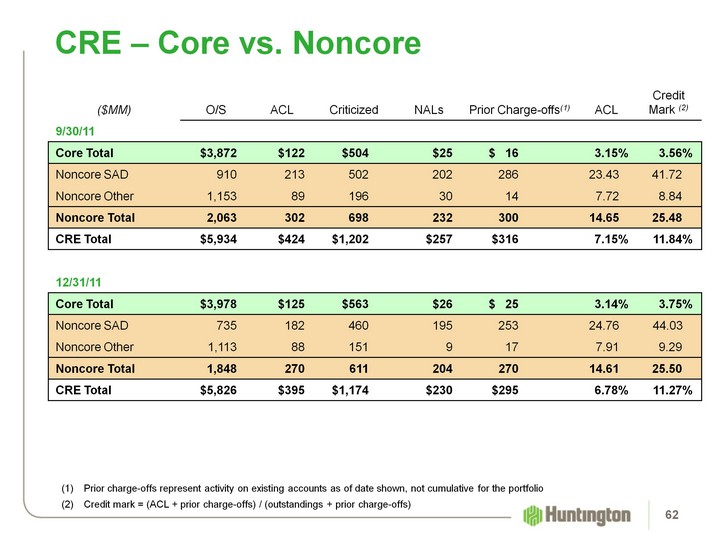
| CRE - Core vs. Noncore ($MM) O/S ACL Criticized NALs Prior Charge-offs(1) ACL Credit Mark (2) 9/30/11 Core Total $3,872 $122 $504 $25 $ 16 3.15% 3.56% Noncore SAD 910 213 502 202 286 23.43 41.72 Noncore Other 1,153 89 196 30 14 7.72 8.84 Noncore Total 2,063 302 698 232 300 14.65 25.48 CRE Total $5,934 $424 $1,202 $257 $316 7.15% 11.84% 12/31/11 Core Total $3,978 $125 $563 $26 $ 25 3.14% 3.75% Noncore SAD 735 182 460 195 253 24.76 44.03 Noncore Other 1,113 88 151 9 17 7.91 9.29 Noncore Total 1,848 270 611 204 270 14.61 25.50 CRE Total $5,826 $395 $1,174 $230 $295 6.78% 11.27% (1) Prior charge-offs represent activity on existing accounts as of date shown, not cumulative for the portfolio(2) Credit mark = (ACL + prior charge-offs) / (outstandings + prior charge-offs) 62 |
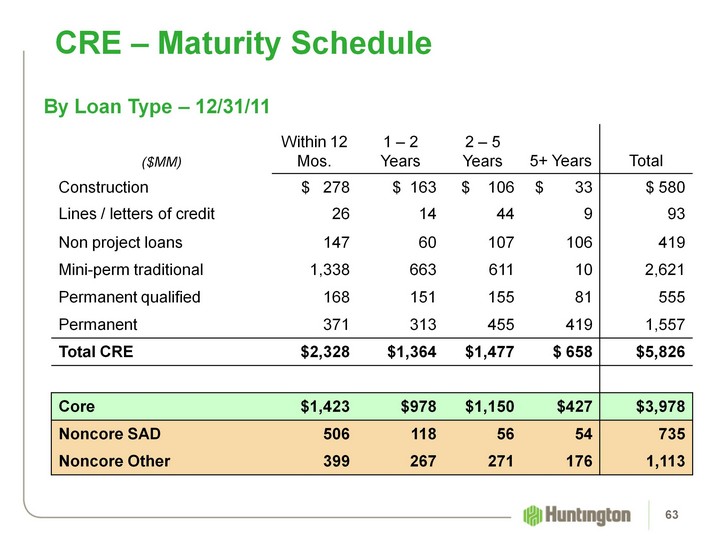
| CRE - Maturity Schedule By Loan Type - 12/31/11 ($MM) Within 12 Mos. 1 - 2 Years 2 - 5 Years 5+ Years Total Construction $ 278 $ 163 $ 106 $ 33 $ 580 Lines / letters of credit 26 14 44 9 93 Non project loans 147 60 107 106 419 Mini-perm traditional 1,338 663 611 10 2,621 Permanent qualified 168 151 155 81 555 Permanent 371 313 455 419 1,557 Total CRE $2,328 $1,364 $1,477 $ 658 $5,826 Core $1,423 $978 $1,150 $427 $3,978 Noncore SAD 506 118 56 54 735 Noncore Other 399 267 271 176 1,113 63 |

| Total Consumer Loans and Leases 64 |
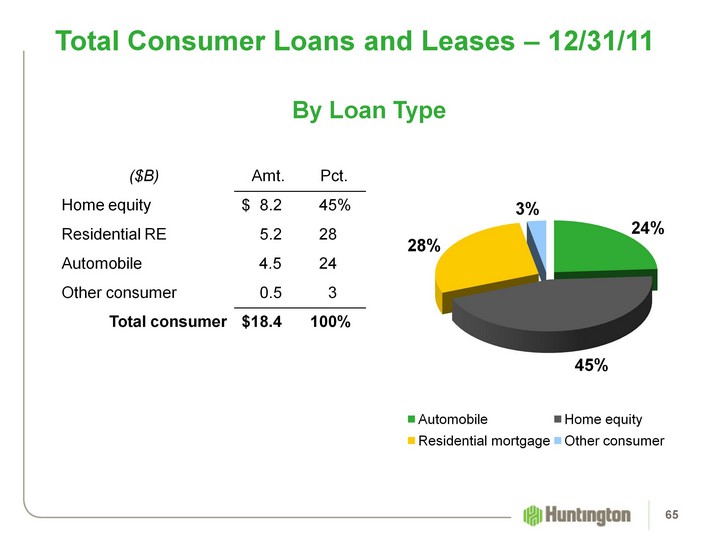
| Total Consumer Loans and Leases - 12/31/11 ($B) Amt. Pct. Home equity $ 8.2 45% Residential RE 5.2 28 Automobile 4.5 24 Other consumer 0.5 3 Total consumer $18.4 100% (CHART) By Loan Type 65 |
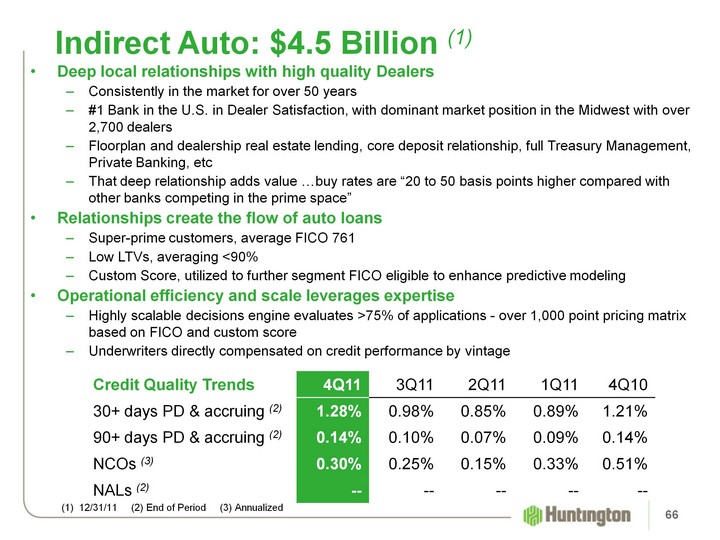
| Deep local relationships with high quality DealersConsistently in the market for over 50 years#1 Bank in the U.S. in Dealer Satisfaction, with dominant market position in the Midwest with over 2,700 dealersFloorplan and dealership real estate lending, core deposit relationship, full Treasury Management, Private Banking, etcThat deep relationship adds value ...buy rates are "20 to 50 basis points higher compared with other banks competing in the prime space"Relationships create the flow of auto loansSuper-prime customers, average FICO 761Low LTVs, averaging <90%Custom Score, utilized to further segment FICO eligible to enhance predictive modelingOperational efficiency and scale leverages expertiseHighly scalable decisions engine evaluates >75% of applications - over 1,000 point pricing matrix based on FICO and custom scoreUnderwriters directly compensated on credit performance by vintage Indirect Auto: $4.5 Billion (1) Credit Quality Trends 4Q11 3Q11 2Q11 1Q11 4Q10 30+ days PD & accruing (2) 1.28% 0.98% 0.85% 0.89% 1.21% 90+ days PD & accruing (2) 0.14% 0.10% 0.07% 0.09% 0.14% NCOs (3) 0.30% 0.25% 0.15% 0.33% 0.51% NALs (2) -- -- -- -- -- 66 (1) 12/31/11 (2) End of Period (3) Annualized |
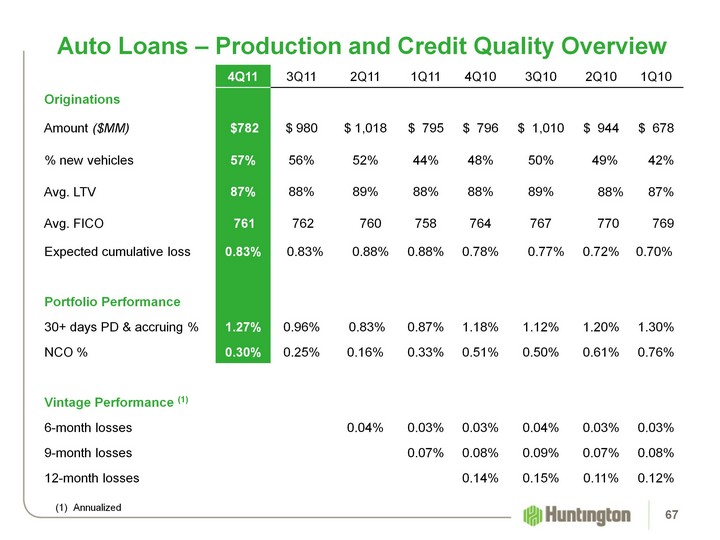
| Auto Loans - Production and Credit Quality Overview Auto Loans - Production and Credit Quality Overview (1) Annualized 67 |
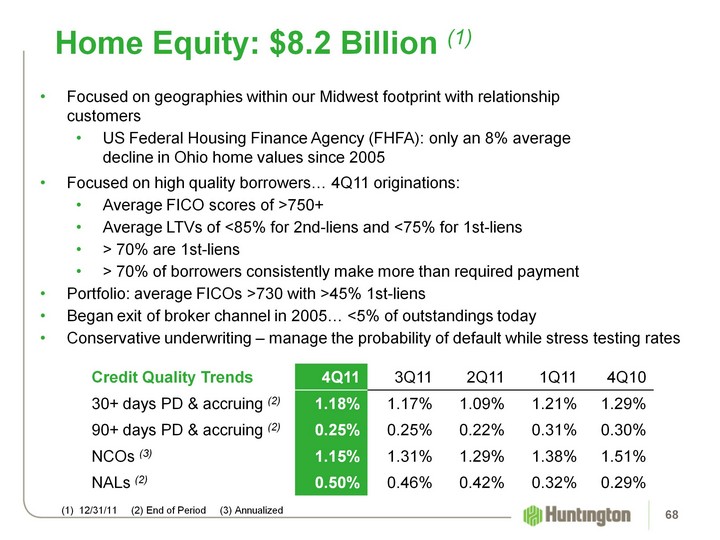
| Home Equity: $8.2 Billion (1) Focused on geographies within our Midwest footprint with relationship customersUS Federal Housing Finance Agency (FHFA): only an 8% average decline in Ohio home values since 2005 Credit Quality Trends 4Q11 3Q11 2Q11 1Q11 4Q10 30+ days PD & accruing (2) 1.18% 1.17% 1.09% 1.21% 1.29% 90+ days PD & accruing (2) 0.25% 0.25% 0.22% 0.31% 0.30% NCOs (3) 1.15% 1.31% 1.29% 1.38% 1.51% NALs (2) 0.50% 0.46% 0.42% 0.32% 0.29% 68 (1) 12/31/11 (2) End of Period (3) Annualized Focused on high quality borrowers... 4Q11 originations:Average FICO scores of >750+ Average LTVs of <85% for 2nd-liens and <75% for 1st-liens> 70% are 1st-liens> 70% of borrowers consistently make more than required paymentPortfolio: average FICOs >730 with >45% 1st-liensBegan exit of broker channel in 2005... <5% of outstandings todayConservative underwriting - manage the probability of default while stress testing rates |
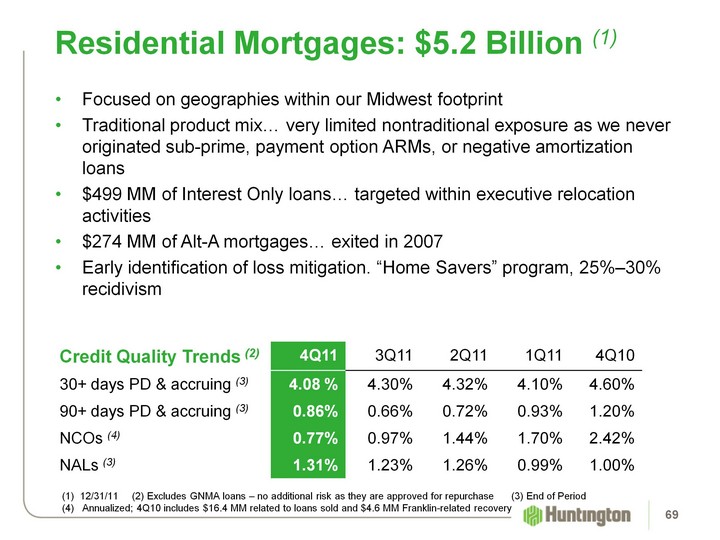
| Focused on geographies within our Midwest footprintTraditional product mix... very limited nontraditional exposure as we never originated sub-prime, payment option ARMs, or negative amortization loans$499 MM of Interest Only loans... targeted within executive relocation activities$274 MM of Alt-A mortgages... exited in 2007Early identification of loss mitigation. "Home Savers" program, 25%-30% recidivism Credit Quality Trends (2) 4Q11 3Q11 2Q11 1Q11 4Q10 30+ days PD & accruing (3) 4.08 % 4.30% 4.32% 4.10% 4.60% 90+ days PD & accruing (3) 0.86% 0.66% 0.72% 0.93% 1.20% NCOs (4) 0.77% 0.97% 1.44% 1.70% 2.42% NALs (3) 1.31% 1.23% 1.26% 0.99% 1.00% Residential Mortgages: $5.2 Billion (1) 69 12/31/11 (2) Excludes GNMA loans - no additional risk as they are approved for repurchase (3) End of Period (4) Annualized; 4Q10 includes $16.4 MM related to loans sold and $4.6 MM Franklin-related recovery |
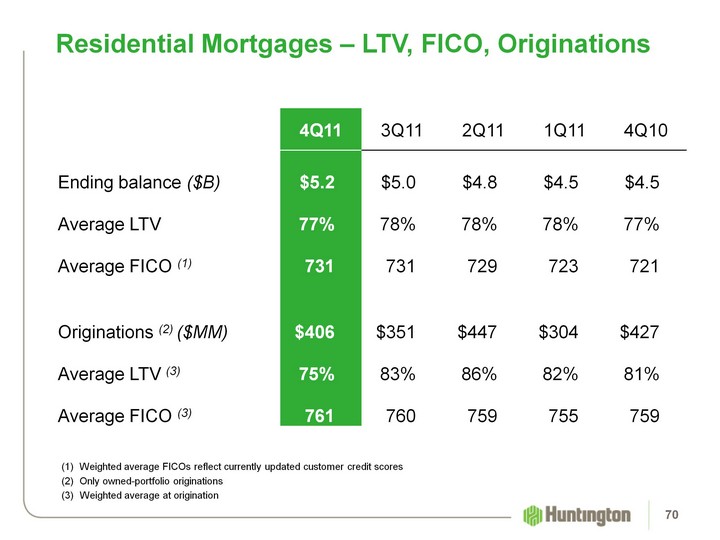
| Residential Mortgages - LTV, FICO, Originations (1) Weighted average FICOs reflect currently updated customer credit scores(2) Only owned-portfolio originationsWeighted average at origination 4Q11 3Q11 2Q11 1Q11 4Q10 Ending balance ($B) $5.2 $5.0 $4.8 $4.5 $4.5 Average LTV 77% 78% 78% 78% 77% Average FICO (1) 731 731 729 723 721 Originations (2) ($MM) $406 $351 $447 $304 $427 Average LTV (3) 75% 83% 86% 82% 81% Average FICO (3) 761 760 759 755 759 70 |
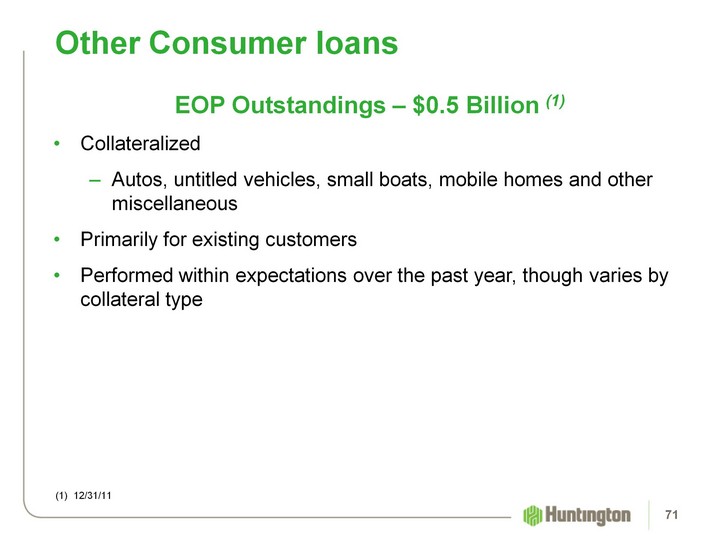
| Other Consumer loans EOP Outstandings - $0.5 Billion (1)CollateralizedAutos, untitled vehicles, small boats, mobile homes and other miscellaneousPrimarily for existing customersPerformed within expectations over the past year, though varies by collateral type (1) 12/31/11 71 |

| Credit Quality Review 72 |
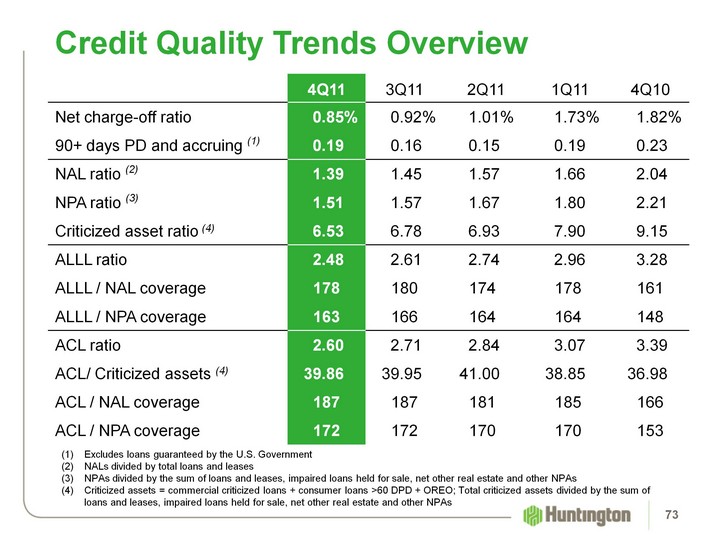
| Credit Quality Trends Overview Credit Quality Trends Overview Excludes loans guaranteed by the U.S. Government NALs divided by total loans and leases(3) NPAs divided by the sum of loans and leases, impaired loans held for sale, net other real estate and other NPAs(4) Criticized assets = commercial criticized loans + consumer loans >60 DPD + OREO; Total criticized assets divided by the sum of loans and leases, impaired loans held for sale, net other real estate and other NPAs 73 |
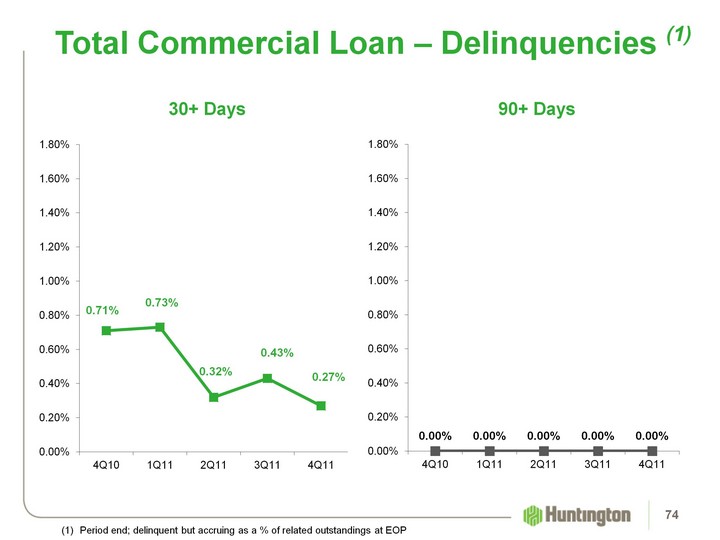
| Total Commercial Loan - Delinquencies (1) (CHART) (CHART) (1) Period end; delinquent but accruing as a % of related outstandings at EOP 90+ Days 30+ Days 74 |
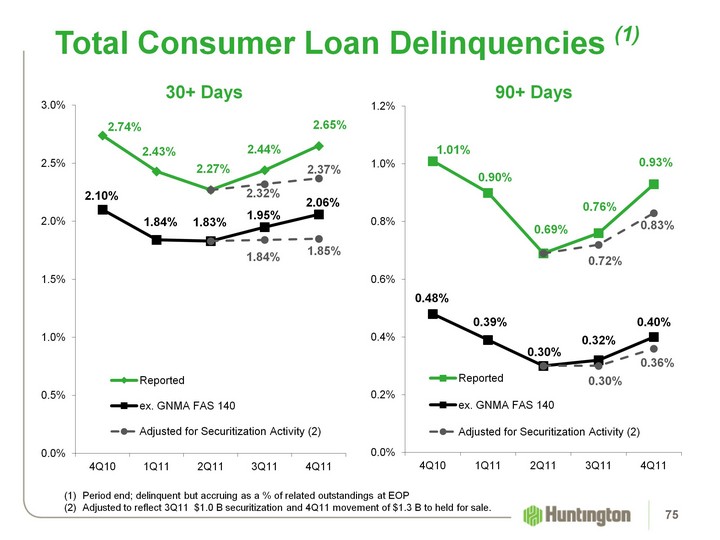
| (CHART) Total Consumer Loan Delinquencies (1) (CHART) 90+ Days 30+ Days Period end; delinquent but accruing as a % of related outstandings at EOPAdjusted to reflect 3Q11 $1.0 B securitization and 4Q11 movement of $1.3 B to held for sale. 75 |
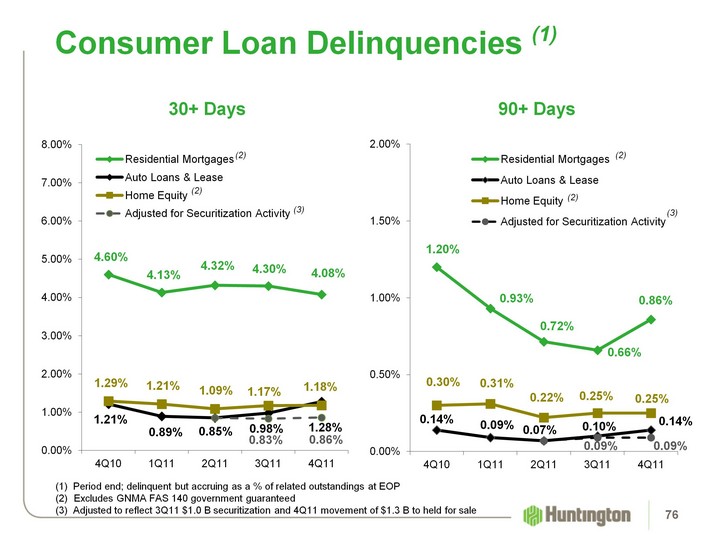
| Consumer Loan Delinquencies (1) (CHART) (1) Period end; delinquent but accruing as a % of related outstandings at EOPExcludes GNMA FAS 140 government guaranteed(3) Adjusted to reflect 3Q11 $1.0 B securitization and 4Q11 movement of $1.3 B to held for sale (CHART) (2) (2) (2) (2) 90+ Days 30+ Days 76 (3) (3) |
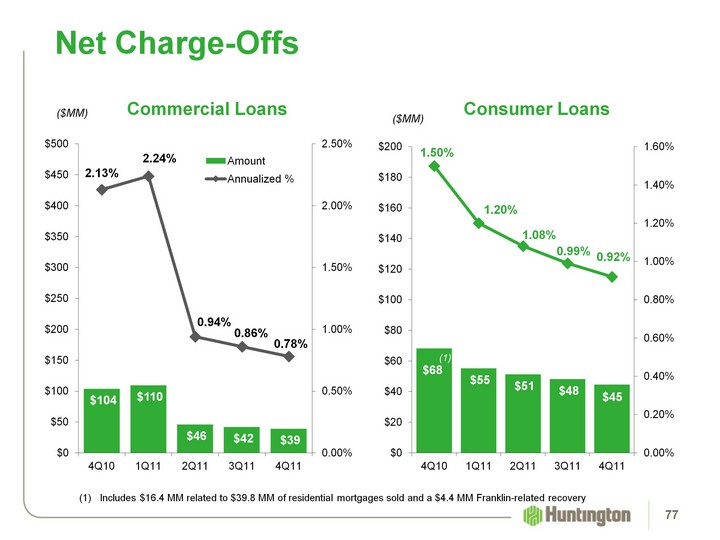
| (CHART) Net Charge-Offs ($MM) ($MM) Consumer Loans Commercial Loans (2) (CHART) (1) Includes $16.4 MM related to $39.8 MM of residential mortgages sold and a $4.4 MM Franklin-related recovery (1) 77 |
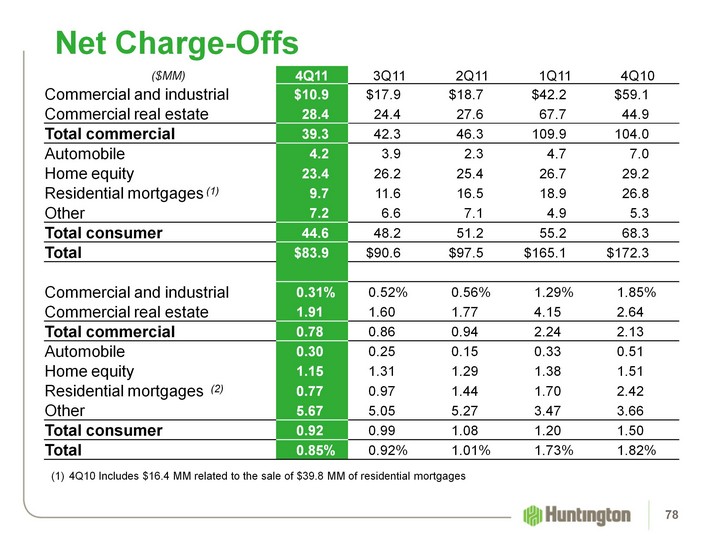
| Net Charge-Offs ($MM) 4Q11 3Q11 2Q11 1Q11 4Q10 Commercial and industrial $10.9 $17.9 $18.7 $42.2 $59.1 Commercial real estate 28.4 24.4 27.6 67.7 44.9 Total commercial 39.3 42.3 46.3 109.9 104.0 Automobile 4.2 3.9 2.3 4.7 7.0 Home equity 23.4 26.2 25.4 26.7 29.2 Residential mortgages (1) 9.7 11.6 16.5 18.9 26.8 Other 7.2 6.6 7.1 4.9 5.3 Total consumer 44.6 48.2 51.2 55.2 68.3 Total $83.9 $90.6 $97.5 $165.1 $172.3 Commercial and industrial 0.31% 0.52% 0.56% 1.29% 1.85% Commercial real estate 1.91 1.60 1.77 4.15 2.64 Total commercial 0.78 0.86 0.94 2.24 2.13 Automobile 0.30 0.25 0.15 0.33 0.51 Home equity 1.15 1.31 1.29 1.38 1.51 Residential mortgages (2) 0.77 0.97 1.44 1.70 2.42 Other 5.67 5.05 5.27 3.47 3.66 Total consumer 0.92 0.99 1.08 1.20 1.50 Total 0.85% 0.92% 1.01% 1.73% 1.82% 4Q10 Includes $16.4 MM related to the sale of $39.8 MM of residential mortgages 78 |
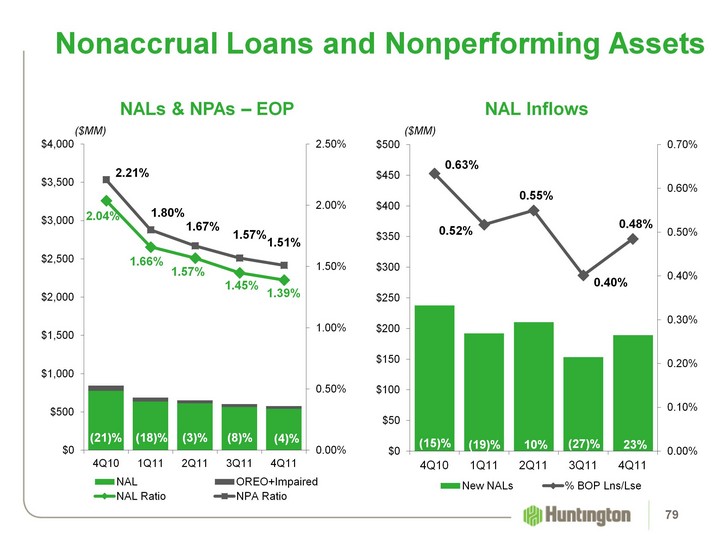
| (CHART) Nonaccrual Loans and Nonperforming Assets ($MM) (CHART) ($MM) (19)% (3)% (21)% (18)% (15)% NAL Inflows NALs & NPAs - EOP (8)% 10% (4)% 23% (27)% 79 |
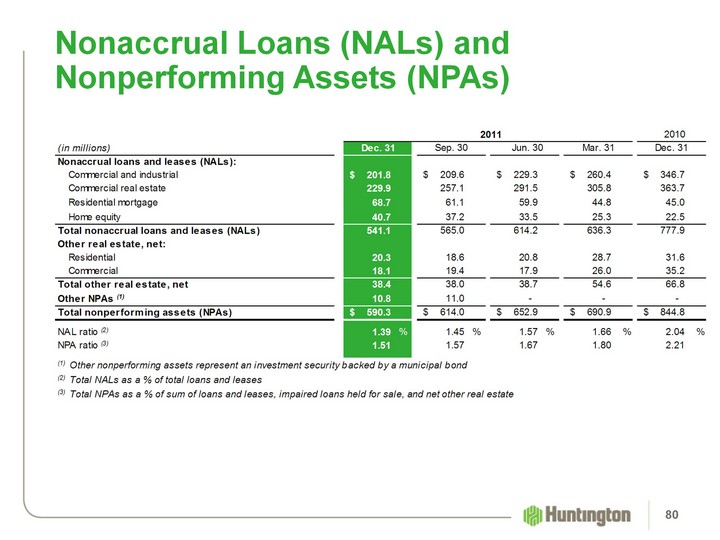
| Nonaccrual Loans (NALs) and Nonperforming Assets (NPAs) 80 |
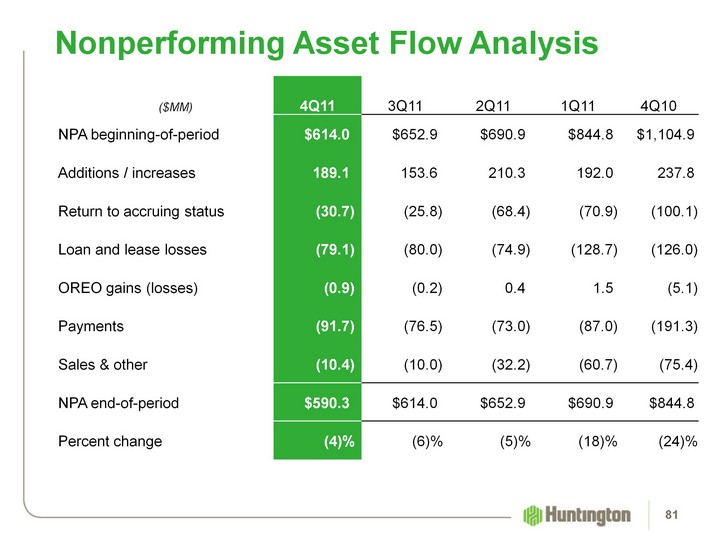
| ($MM) 4Q11 3Q11 2Q11 1Q11 4Q10 NPA beginning-of-period $614.0 $652.9 $690.9 $844.8 $1,104.9 Additions / increases 189.1 153.6 210.3 192.0 237.8 Return to accruing status (30.7) (25.8) (68.4) (70.9) (100.1) Loan and lease losses (79.1) (80.0) (74.9) (128.7) (126.0) OREO gains (losses) (0.9) (0.2) 0.4 1.5 (5.1) Payments (91.7) (76.5) (73.0) (87.0) (191.3) Sales & other (10.4) (10.0) (32.2) (60.7) (75.4) NPA end-of-period $590.3 $614.0 $652.9 $690.9 $844.8 Percent change (4)% (6)% (5)% (18)% (24)% Nonperforming Asset Flow Analysis 81 |
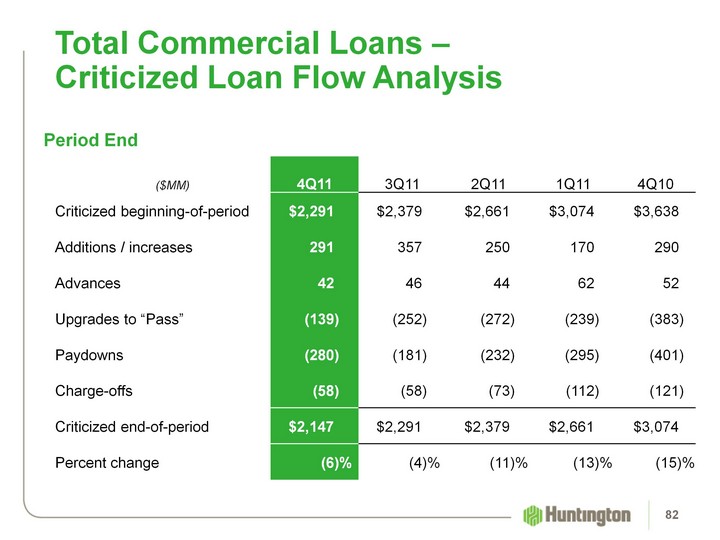
| ($MM) 4Q11 3Q11 2Q11 1Q11 4Q10 Criticized beginning-of-period $2,291 $2,379 $2,661 $3,074 $3,638 Additions / increases 291 357 250 170 290 Advances 42 46 44 62 52 Upgrades to "Pass" (139) (252) (272) (239) (383) Paydowns (280) (181) (232) (295) (401) Charge-offs (58) (58) (73) (112) (121) Criticized end-of-period $2,147 $2,291 $2,379 $2,661 $3,074 Percent change (6)% (4)% (11)% (13)% (15)% Total Commercial Loans - Criticized Loan Flow Analysis Period End 82 |
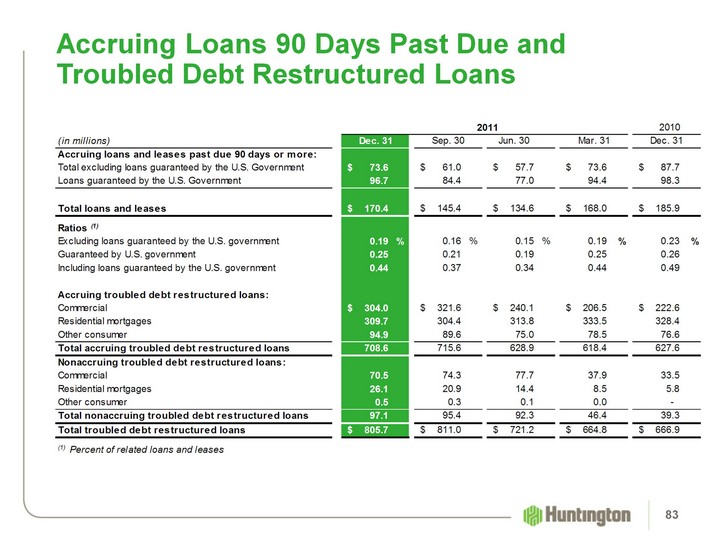
| Accruing Loans 90 Days Past Due and Troubled Debt Restructured Loans 83 |
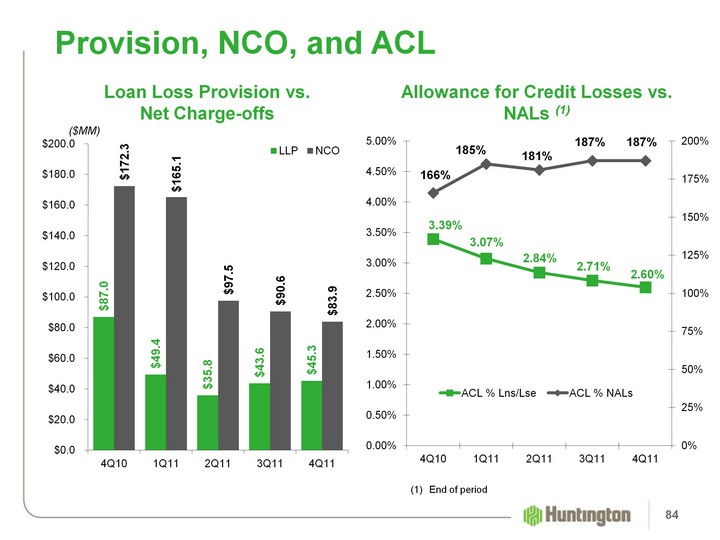
| (CHART) (CHART) Provision, NCO, and ACL ($MM) (1) End of period Allowance for Credit Losses vs.NALs (1) Loan Loss Provision vs.Net Charge-offs 84 |
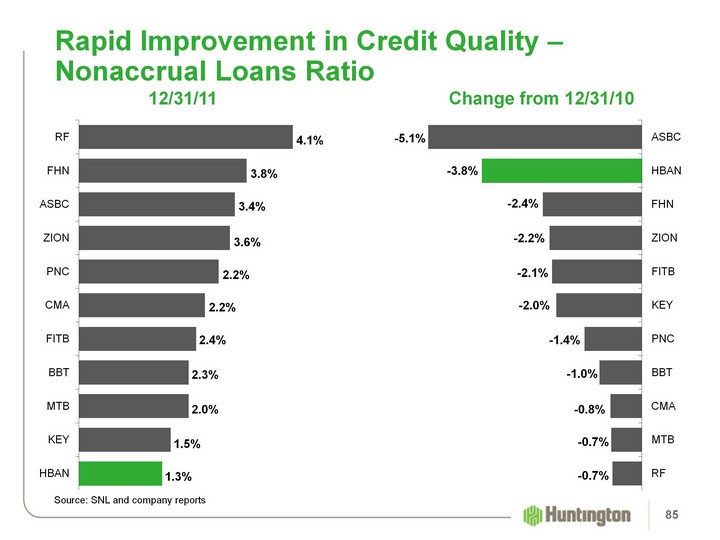
| Rapid Improvement in Credit Quality - Nonaccrual Loans Ratio 12/31/11 Change from 12/31/10 (CHART) Source: SNL and company reports (CHART) 85 |
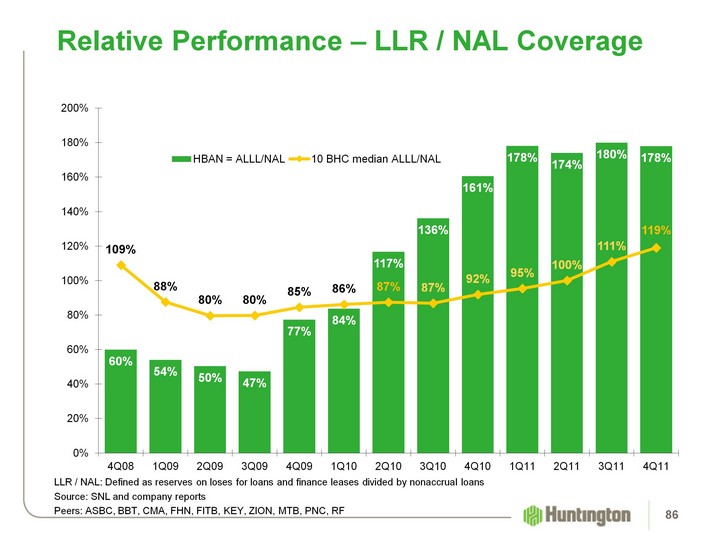
| (CHART) Relative Performance - LLR / NAL Coverage LLR / NAL: Defined as reserves on loses for loans and finance leases divided by nonaccrual loansSource: SNL and company reportsPeers: ASBC, BBT, CMA, FHN, FITB, KEY, ZION, MTB, PNC, RF 86 |
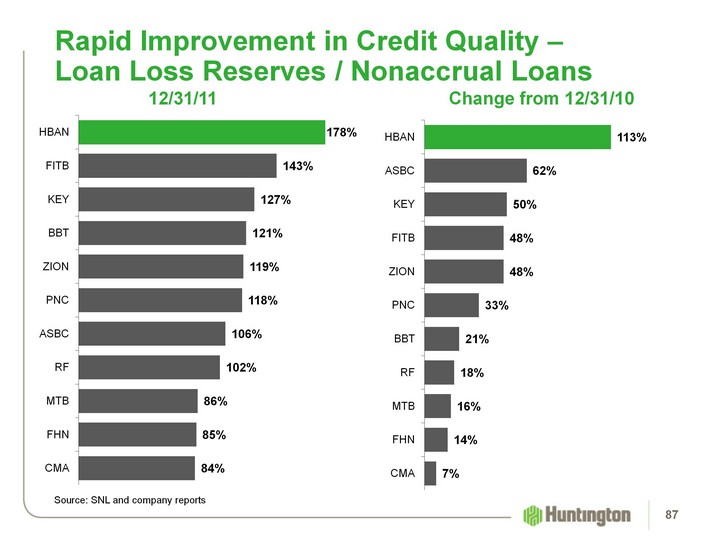
| Rapid Improvement in Credit Quality - Loan Loss Reserves / Nonaccrual Loans (CHART) (CHART) Source: SNL and company reports 12/31/11 Change from 12/31/10 87 |
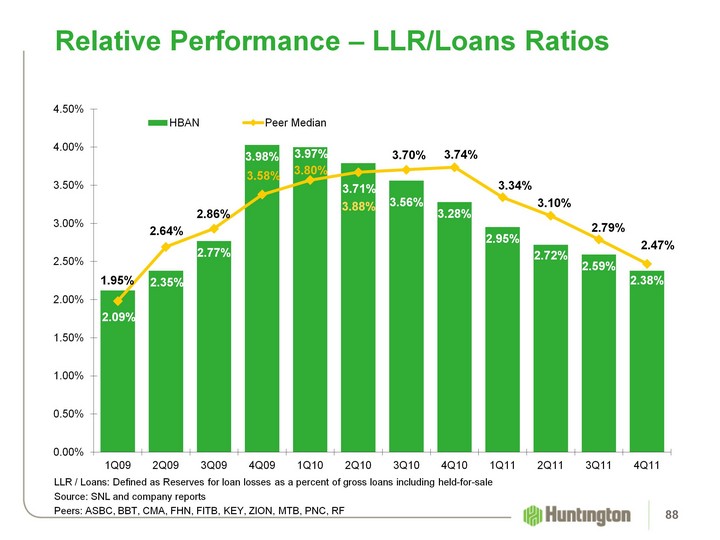
| (CHART) Relative Performance - LLR/Loans Ratios 88 LLR / Loans: Defined as Reserves for loan losses as a percent of gross loans including held-for-saleSource: SNL and company reportsPeers: ASBC, BBT, CMA, FHN, FITB, KEY, ZION, MTB, PNC, RF |

| Deposits and Other Funding 89 |
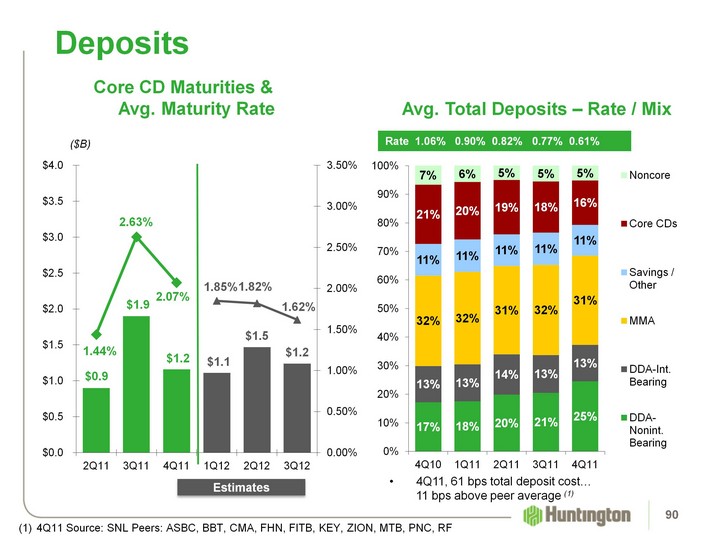
| (CHART) (CHART) Deposits ($B) Avg. Total Deposits - Rate / Mix Core CD Maturities & Avg. Maturity Rate Rate 1.06% 0.90% 0.82% 0.77% 0.61% Estimates 90 4Q11, 61 bps total deposit cost... 11 bps above peer average (1) 4Q11 Source: SNL Peers: ASBC, BBT, CMA, FHN, FITB, KEY, ZION, MTB, PNC, RF |
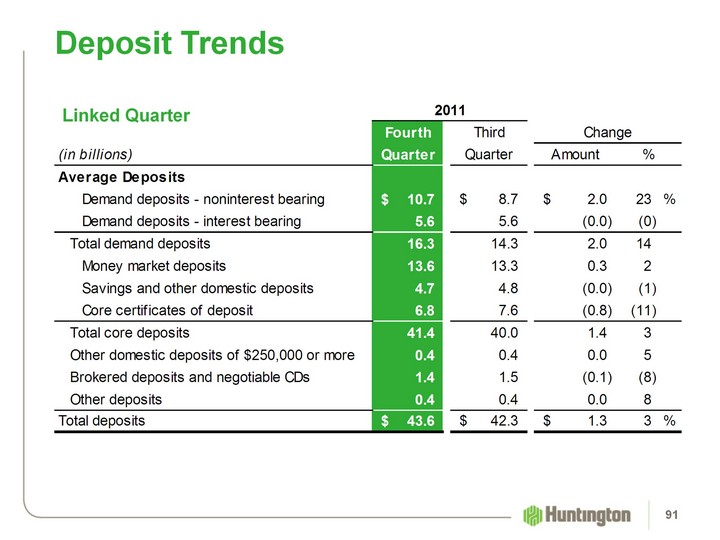
| Deposit Trends Linked Quarter 91 |
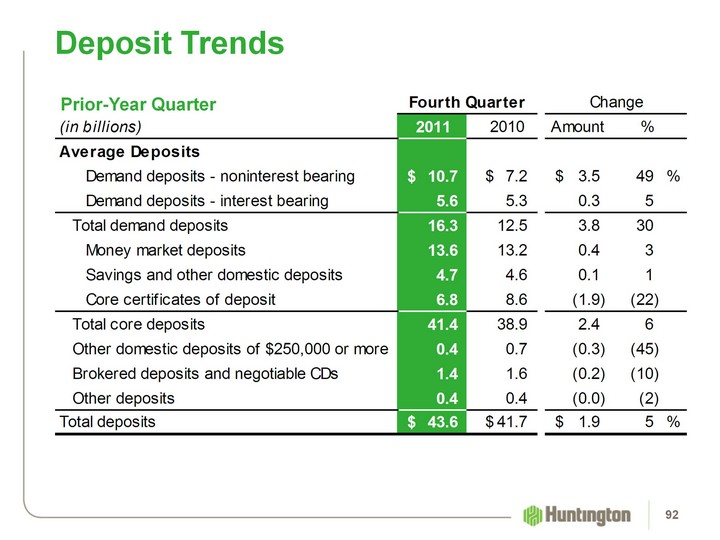
| Deposit Trends Prior-Year Quarter 92 |
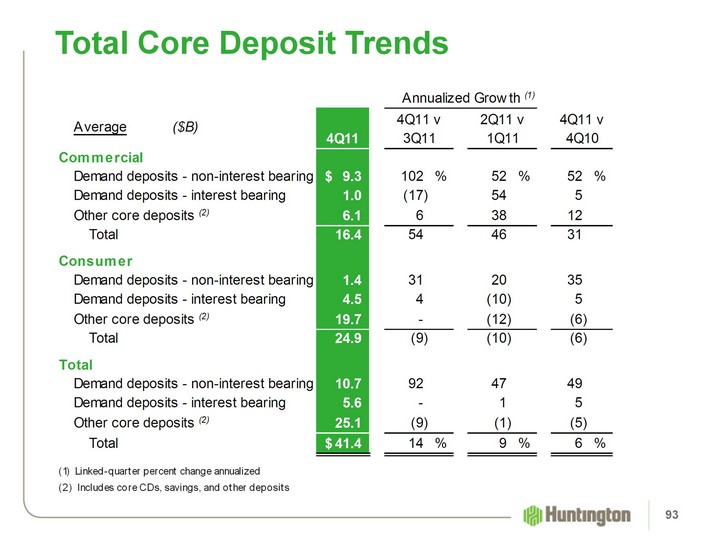
| Total Core Deposit Trends 93 |
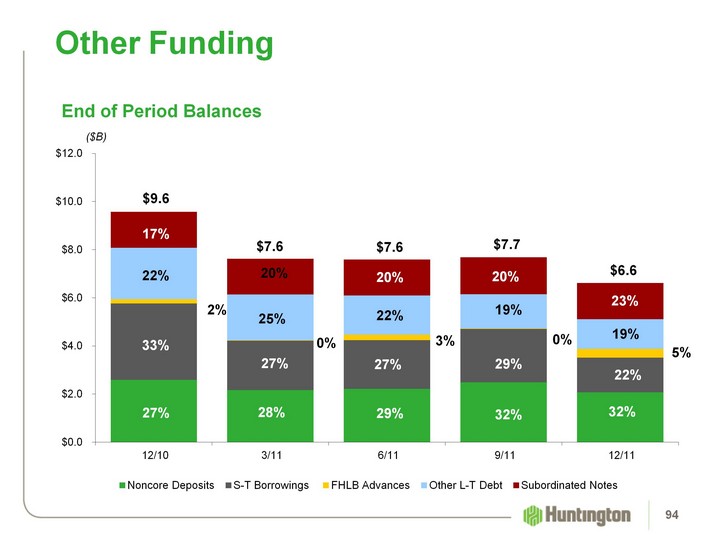
| (CHART) Other Funding End of Period Balances ($B) 22% 25% 2% 27% 17% $6.6 23% 0% 19% 32% 22% $9.6 20% 33% 0% 27% 29% 94 5% |

| Capital 95 |
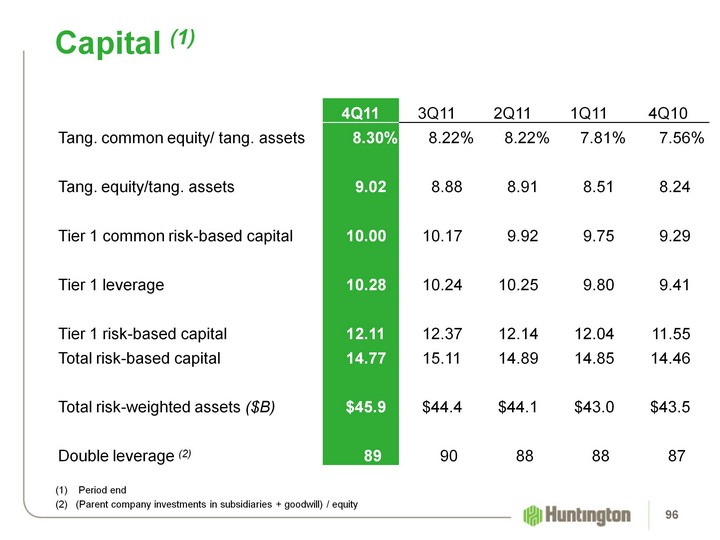
| 4Q11 3Q11 2Q11 1Q11 4Q10 Tang. common equity/ tang. assets 8.30% 8.22% 8.22% 7.81% 7.56% Tang. equity/tang. assets 9.02 8.88 8.91 8.51 8.24 Tier 1 common risk-based capital 10.00 10.17 9.92 9.75 9.29 Tier 1 leverage 10.28 10.24 10.25 9.80 9.41 Tier 1 risk-based capital 12.11 12.37 12.14 12.04 11.55 Total risk-based capital 14.77 15.11 14.89 14.85 14.46 Total risk-weighted assets ($B) $45.9 $44.4 $44.1 $43.0 $43.5 Double leverage (2) 89 90 88 88 87 Capital (1) (1) Period end (2) (Parent company investments in subsidiaries + goodwill) / equity 96 |
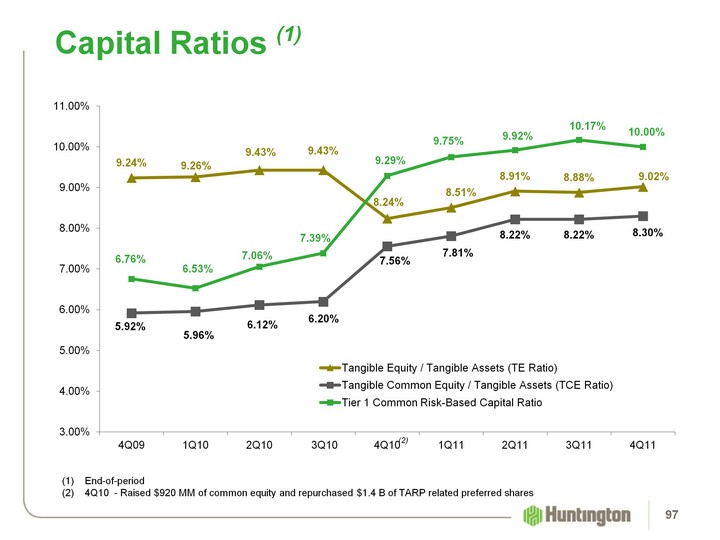
| (CHART) Capital Ratios (1) End-of-period4Q10 - Raised $920 MM of common equity and repurchased $1.4 B of TARP related preferred shares (2) 97 |
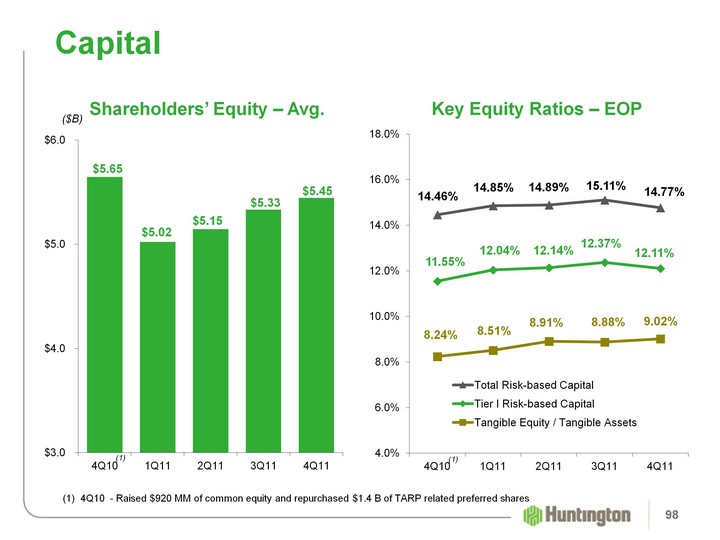
| (CHART) Shareholders' Equity - Avg. (CHART) Capital Key Equity Ratios - EOP ($B) 98 4Q10 - Raised $920 MM of common equity and repurchased $1.4 B of TARP related preferred shares |
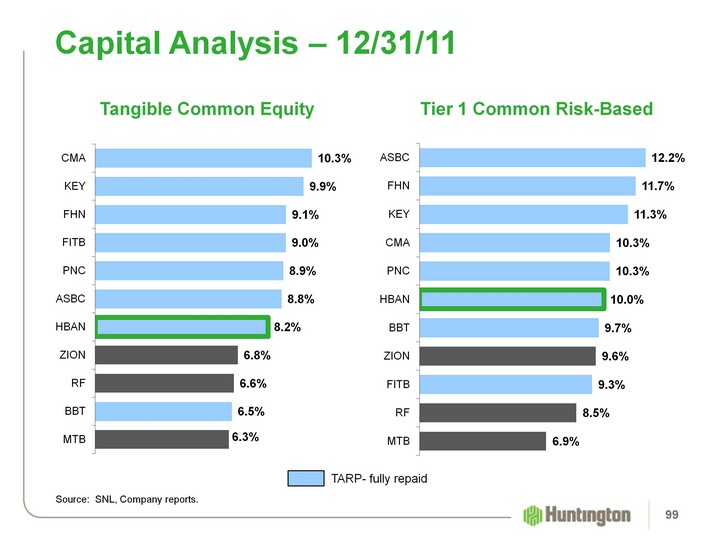
| (CHART) Capital Analysis - 12/31/11 (CHART) Source: SNL, Company reports. Tier 1 Common Risk-Based Tangible Common Equity TARP- fully repaid 99 |

| Franchise and Leadership 100 |
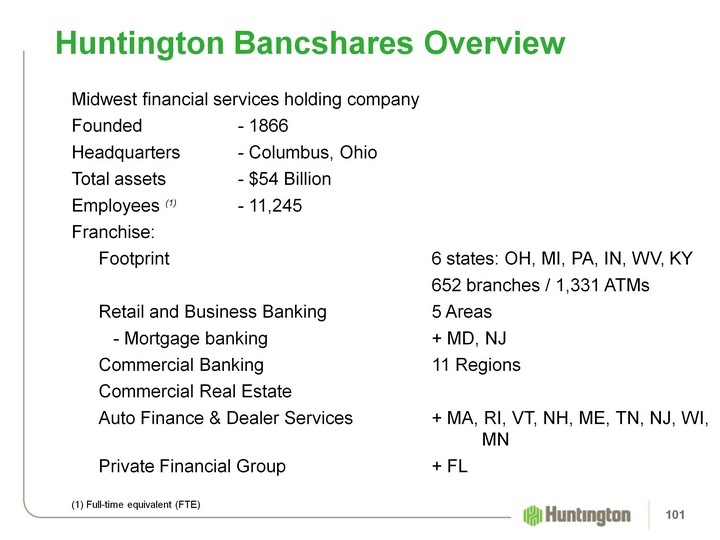
| Huntington Bancshares Overview Midwest financial services holding companyFounded - 1866Headquarters - Columbus, OhioTotal assets - $54 Billion Employees (1) - 11,245Franchise: Footprint 6 states: OH, MI, PA, IN, WV, KY 652 branches / 1,331 ATMs Retail and Business Banking 5 Areas - Mortgage banking + MD, NJ Commercial Banking 11 Regions Commercial Real Estate Auto Finance & Dealer Services + MA, RI, VT, NH, ME, TN, NJ, WI, MN Private Financial Group + FL (1) Full-time equivalent (FTE) 101 |
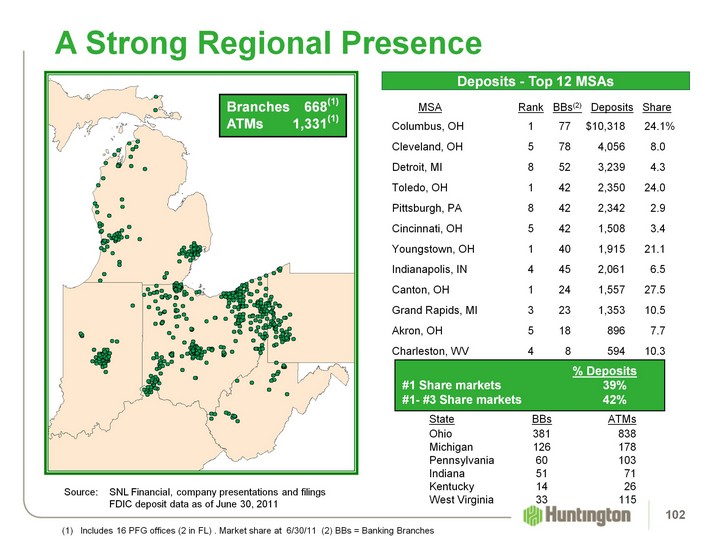
| A Strong Regional Presence Source: SNL Financial, company presentations and filings FDIC deposit data as of June 30, 2011 Deposits - Top 12 MSAs MSA Rank BBs(2) Deposits ShareColumbus, OH 1 77 $10,318 24.1%Cleveland, OH 5 78 4,056 8.0Detroit, MI 8 52 3,239 4.3Toledo, OH 1 42 2,350 24.0Pittsburgh, PA 8 42 2,342 2.9Cincinnati, OH 5 42 1,508 3.4Youngstown, OH 1 40 1,915 21.1Indianapolis, IN 4 45 2,061 6.5Canton, OH 1 24 1,557 27.5Grand Rapids, MI 3 23 1,353 10.5Akron, OH 5 18 896 7.7Charleston, WV 4 8 594 10.3 % Deposits#1 Share markets 39% #1- #3 Share markets 42% 102 Includes 16 PFG offices (2 in FL) . Market share at 6/30/11 (2) BBs = Banking Branches Branches 668(1)ATMs 1,331(1) State BBs ATMs Ohio 381 838 Michigan 126 178 Pennsylvania 60 103 Indiana 51 71 Kentucky 14 26 West Virginia 33 115 |
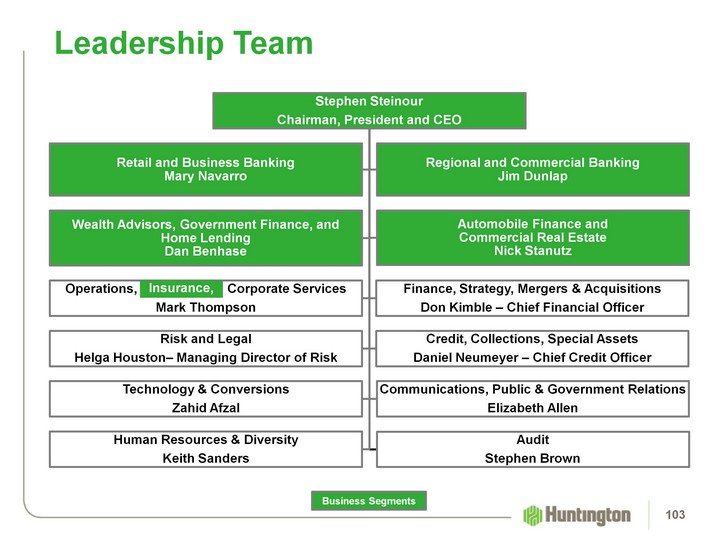
| Leadership Team Leadership Team Business Segments Insurance, 103 |
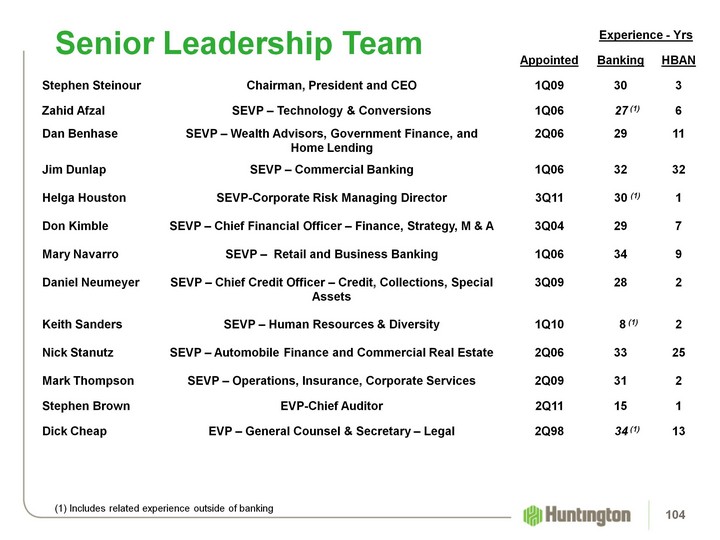
| Senior Leadership Team (1) Includes related experience outside of banking 104 |

| Business Segment Overview 105 |
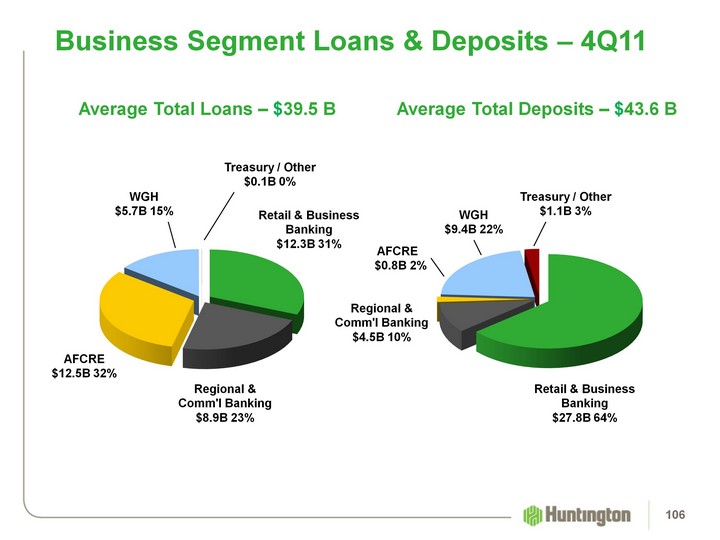
| Business Segment Loans & Deposits - 4Q11 Average Total Deposits - $43.6 B Average Total Loans - $39.5 B (CHART) (CHART) AFCRE $12.5B 32% Retail & Business Banking $12.3B 31% Treasury / Other $0.1B 0% Regional & Comm'l Banking $8.9B 23% WGH $5.7B 15% AFCRE $0.8B 2% Treasury / Other $1.1B 3% Retail & Business Banking $27.8B 64% Regional & Comm'l Banking $4.5B 10% WGH $9.4B 22% 106 |
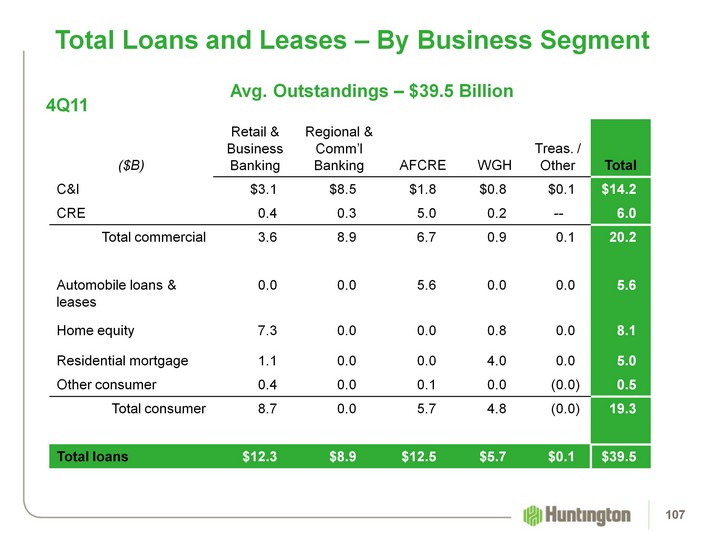
| Total Loans and Leases - By Business Segment Total Loans and Leases - By Business Segment Avg. Outstandings - $39.5 Billion 4Q11 107 |
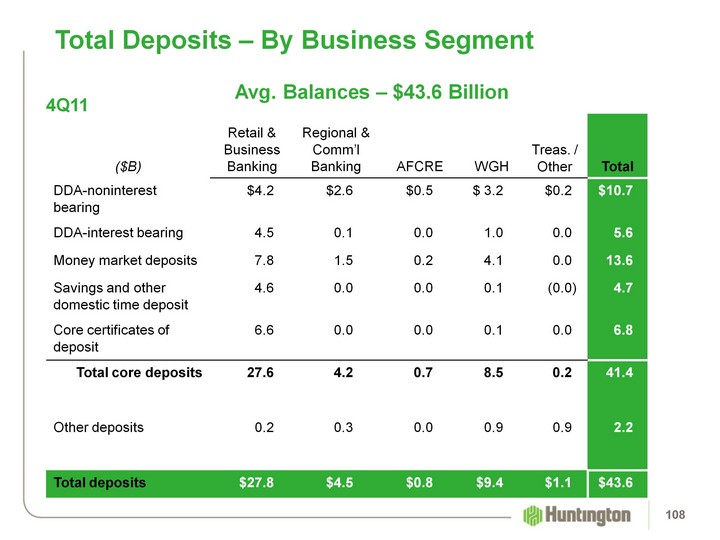
| Total Deposits - By Business Segment Total Deposits - By Business Segment Avg. Balances - $43.6 Billion 4Q11 108 |
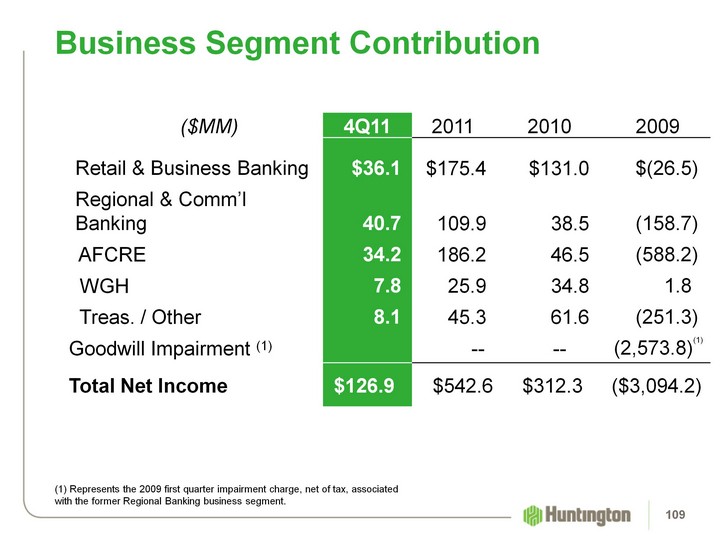
| Business Segment Contribution ($MM) 4Q11 2011 2010 2009 Retail & Business Banking $36.1 $175.4 $131.0 $(26.5) Regional & Comm'l Banking 40.7 109.9 38.5 (158.7) AFCRE 34.2 186.2 46.5 (588.2) WGH 7.8 25.9 34.8 1.8 Treas. / Other 8.1 45.3 61.6 (251.3) Goodwill Impairment (1) -- -- (2,573.8)(1) Total Net Income $126.9 $542.6 $312.3 ($3,094.2) (1) Represents the 2009 first quarter impairment charge, net of tax, associated with the former Regional Banking business segment. 109 |
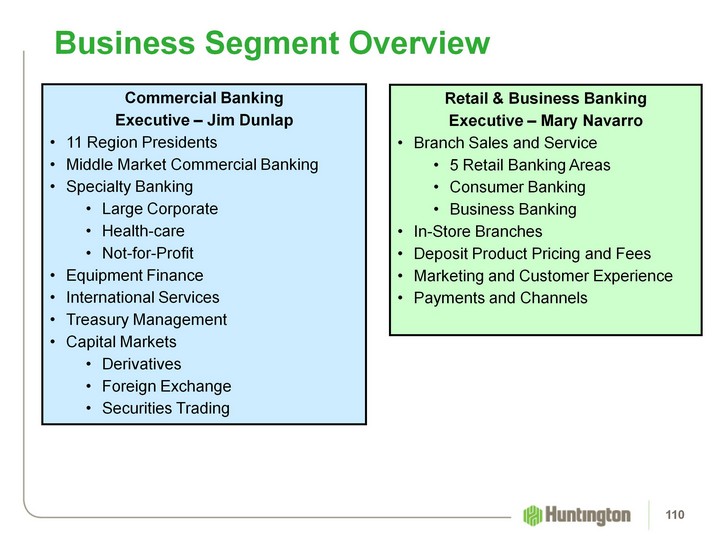
| Business Segment Overview Commercial BankingExecutive - Jim Dunlap11 Region PresidentsMiddle Market Commercial BankingSpecialty BankingLarge CorporateHealth-careNot-for-ProfitEquipment FinanceInternational ServicesTreasury ManagementCapital MarketsDerivativesForeign ExchangeSecurities Trading Retail & Business BankingExecutive - Mary NavarroBranch Sales and Service5 Retail Banking AreasConsumer BankingBusiness BankingIn-Store BranchesDeposit Product Pricing and FeesMarketing and Customer ExperiencePayments and Channels 110 |
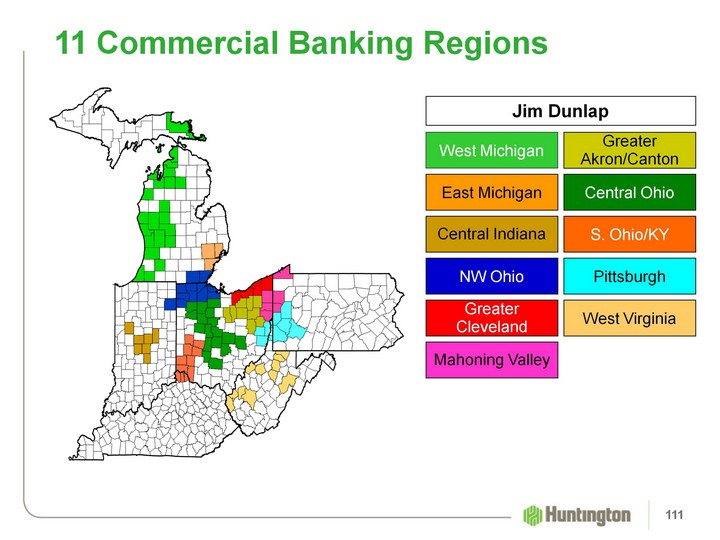
| 11 Commercial Banking Regions GreaterAkron/Canton Mahoning Valley Central Ohio NW Ohio S. Ohio/KY GreaterCleveland Central Indiana West Michigan East Michigan West Virginia Pittsburgh Jim Dunlap 111 |
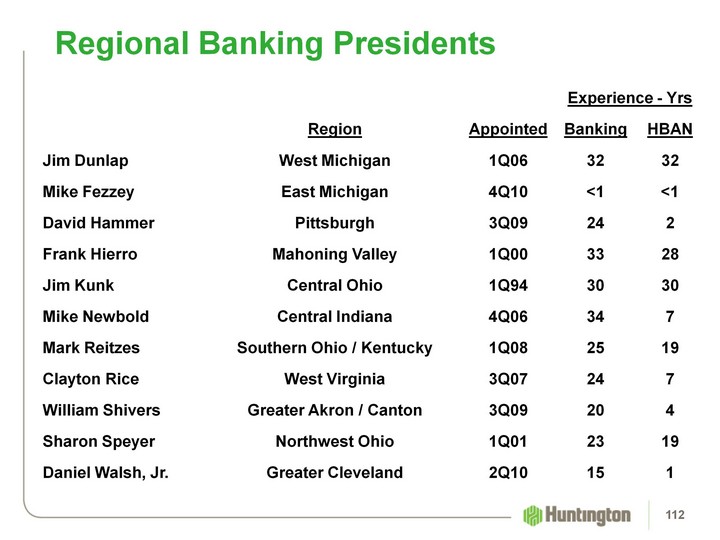
| Regional Banking Presidents 112 |
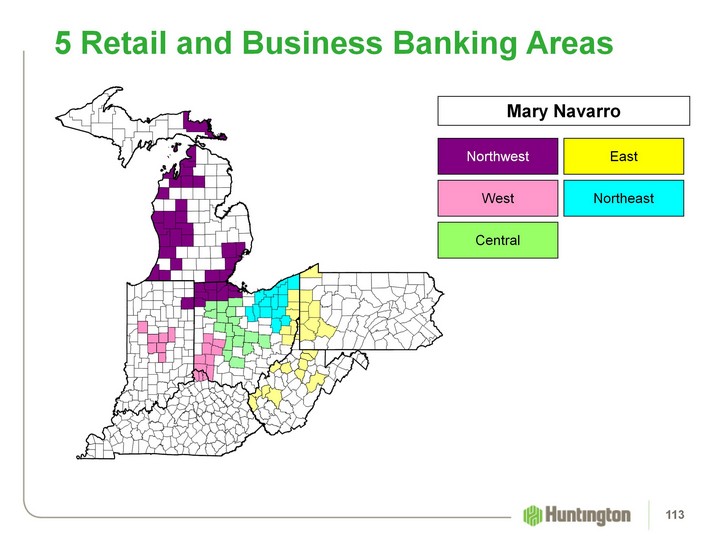
| 5 Retail and Business Banking Areas Central Northwest West Northeast East Mary Navarro 113 |
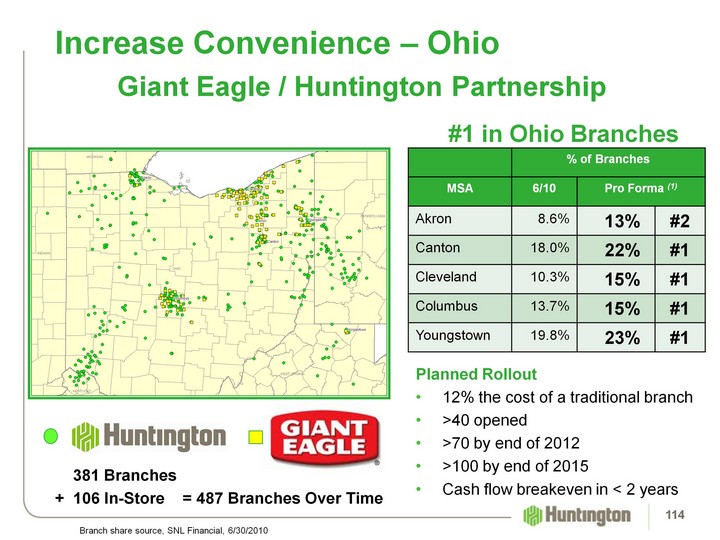
| #1 in Ohio BranchesPlanned Rollout12% the cost of a traditional branch>40 opened>70 by end of 2012>100 by end of 2015Cash flow breakeven in < 2 years Increase Convenience - Ohio Branch share source, SNL Financial, 6/30/2010 % of Branches % of Branches % of Branches MSA 6/10 Pro Forma (1) Pro Forma (1) Akron 8.6% 13% #2 Canton 18.0% 22% #1 Cleveland 10.3% 15% #1 Columbus 13.7% 15% #1 Youngstown 19.8% 23% #1 381 Branches + 106 In-Store = 487 Branches Over Time Giant Eagle / Huntington Partnership 114 114 |
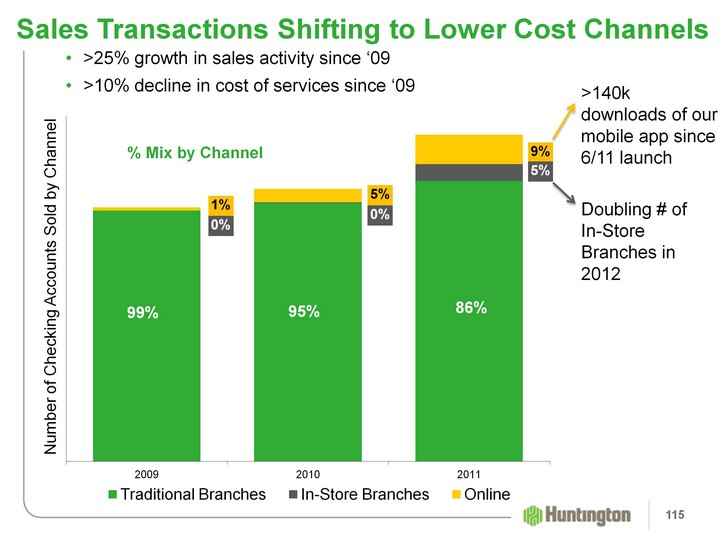
| Sales Transactions Shifting to Lower Cost Channels >25% growth in sales activity since '09>10% decline in cost of services since '09 115 (CHART) (CHART) % Mix by Channel >140k downloads of our mobile app since 6/11 launch Doubling # of In-Store Branches in 2012 Number of Checking Accounts Sold by Channel |
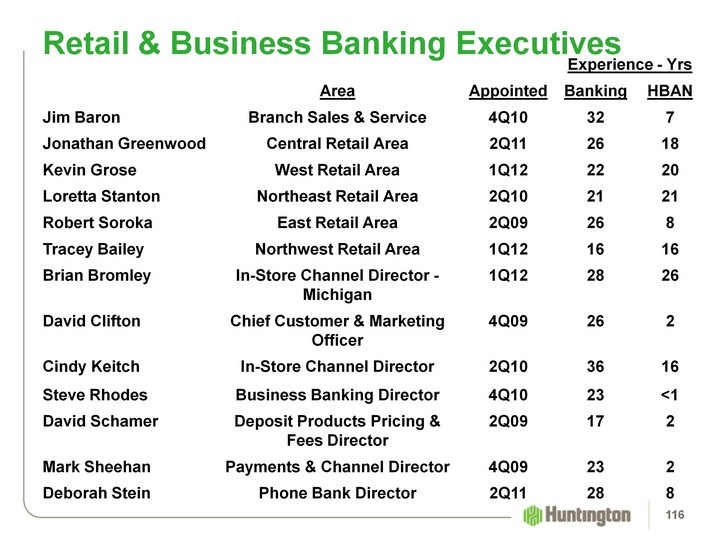
| Retail & Business Banking Executives 116 |
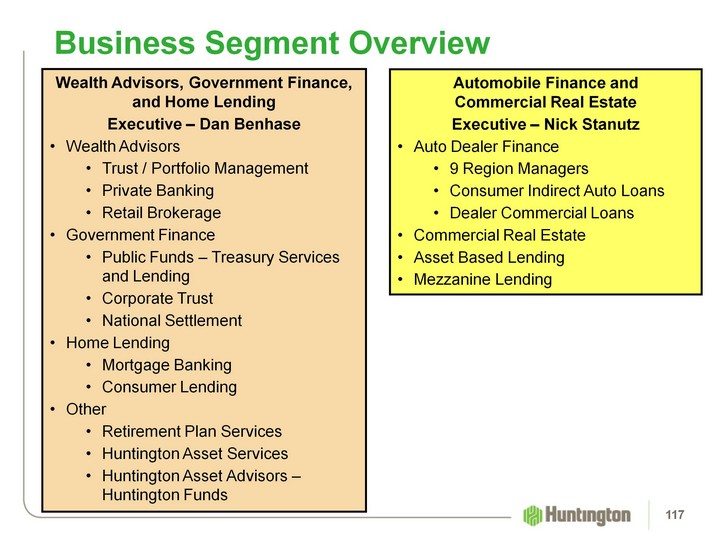
| Business Segment Overview Wealth Advisors, Government Finance, and Home Lending Executive - Dan BenhaseWealth AdvisorsTrust / Portfolio ManagementPrivate BankingRetail BrokerageGovernment FinancePublic Funds - Treasury Services and LendingCorporate TrustNational SettlementHome LendingMortgage BankingConsumer LendingOtherRetirement Plan ServicesHuntington Asset ServicesHuntington Asset Advisors - Huntington Funds Automobile Finance and Commercial Real Estate Executive - Nick StanutzAuto Dealer Finance9 Region ManagersConsumer Indirect Auto Loans Dealer Commercial LoansCommercial Real EstateAsset Based LendingMezzanine Lending 117 |

| Safe Harbor Disclosures 118 |
| Use of non-GAAP financial measuresThis document may contain GAAP financial measures and non-GAAP financial measures where management believes it to be helpful in understanding Huntington's results of operations or financial position. Where non-GAAP financial measures are used, the comparable GAAP financial measure, as well as the reconciliation to the comparable GAAP financial measure, can be found in this document, the 2011 Fourth Quarter Performance Discussion and Quarterly Financial Review supplements, the 2011 fourth quarter earnings press release, or the Form 8-K related to this document, all of which can be found on Huntington's website at www.huntington-ir.com.Pre-Tax, Pre-Provision IncomeOne non-GAAP performance metric that Management believes is useful in analyzing underlying performance trends is pre-tax, pre-provision income. This is the level of earnings adjusted to exclude the impact of:provision expense, which is excluded because its absolute level is elevated and volatile in times of economic stress;available-for-sale and other securities gains/losses, which are excluded because in times of economic stress securities market valuations may also become particularly volatile;amortization of intangibles expense, which is excluded because return on tangible common equity is a key metric used by Management to gauge performance trends; and certain items identified by Management to be outside of ordinary banking activities, and/or by items that, while they may be associated with ordinary banking activities, are so unusually large that their outsized impact is believed by Management at the time to be infrequent or short-term in nature, which Management believes may distort the company's underlying performance trends.Annualized dataCertain returns, yields, performance ratios, or quarterly growth rates are presented on an "annualized" basis. This is done for analytical and decision-making purposes to better discern underlying performance trends when compared to full year or year-over-year amounts. For example, loan and deposit growth rates, as well as net charge-off percentages, are most often expressed in terms of an annual rate like 8%. As such, a 2% growth rate for a quarter would represent an annualized 8% growth rate. Basis of Presentation 119 |
| Significant ItemsFrom time to time, revenue, expenses, or taxes are impacted by items judged by Management to be outside of ordinary banking activities and/or by items that, while they may be associated with ordinary banking activities, are so unusually large that their outsized impact is believed by Management at that time to be infrequent or short term in nature. We refer to such items as "Significant Items". Most often, these Significant Items result from factors originating outside the company - e.g., regulatory actions/assessments, windfall gains, changes in accounting principles, one-time tax assessments/refunds, litigation actions, etc. In other cases they may result from Management decisions associated with significant corporate actions out of the ordinary course of business - e.g., merger/restructuring charges, recapitalization actions, goodwill impairment, etc. Even though certain revenue and expense items are naturally subject to more volatility than others due to changes in market and economic environment conditions, as a general rule volatility alone does not define a Significant Item. For example, changes in the provision for credit losses, gains/losses from investment activities, asset valuation write downs, etc., reflect ordinary banking activities and are, therefore, typically excluded from consideration as a Significant Item.Management believes the disclosure of "Significant Items" in current and prior period results aids analysts/investors in better understanding corporate performance and trends so that they can ascertain which of such items, if any, they may wish to include/exclude from their analysis of the company's performance- i.e., within the context of determining how that performance differed from their expectations, as well as how, if at all, to adjust their estimates of future performance accordingly. To this end, Management has adopted a practice of listing "Significant Items" in its external disclosure documents (e.g., earnings press releases, quarterly performance discussions, investor presentations, Forms 10-Q and 10 K)."Significant Items" for any particular period are not intended to be a complete list of items that may materially impact current or future period performance. A number of items could materially impact these periods, including those described in Huntington's 2010 Annual Report on Form 10-K and other factors described from time to time in Huntington's other filings with the Securities and Exchange Commission. Basis of Presentation 120 |
| Fully-taxable equivalent interest income and net interest marginIncome from tax-exempt earning assets is increased by an amount equivalent to the taxes that would have been paid if this income had been taxable at statutory rates. This adjustment puts all earning assets, most notably tax-exempt municipal securities and certain lease assets, on a common basis that facilitates comparison of results to results of competitors.RoundingPlease note that columns of data in the presentation may not add due to rounding.Earnings per share equivalent dataSignificant income or expense items may be expressed on a per common share basis. This is done for analytical and decision-making purposes to better discern underlying trends in total corporate earnings per share performance excluding the impact of such items. Investors may also find this information helpful in their evaluation of the company's financial performance against published earnings per share mean estimate amounts, which typically exclude the impact of Significant Items. Earnings per share equivalents are usually calculated by applying a 35% effective tax rate to a pre- tax amount to derive an after-tax amount, which is divided by the average shares outstanding during the respective reporting period. Occasionally, when the item involves special tax treatment, the after-tax amount is disclosed separately, with this then being the amount used to calculate the earnings per share equivalent. Basis of Presentation 121 |
| This document contains certain forward-looking statements, including certain plans, expectations, goals, projections, and statements, which are subject to numerous assumptions, risks, and uncertainties. Forward-looking statements may be identified by words such as expect, anticipate, believe, intend, estimate, plan, target, goal, or similar expressions, or future or conditional verbs such as will, may, might, should, would, could, or similar variations.While there is no assurance that any list of risks and uncertainties or risk factors is complete, below are certain factors which could cause actual results to differ materially from those contained or implied in the forward-looking statements: (1) worsening of credit quality performance due to a number of factors such as the underlying value of the collateral could prove less valuable than otherwise assumed and assumed cash flows may be worse than expected; (2) changes in economic conditions, including impacts from the continuing economic uncertainty in the US, the European Union, and other areas; (3) movements in interest rates; (4) competitive pressures on product pricing and services; (5) success, impact, and timing of our business strategies, including market acceptance of any new products or services introduced to implement our "Fair Play" banking philosophy; (6) changes in accounting policies and principles and the accuracy of our assumptions and estimates used to prepare our financial statements; (7) extended disruption of vital infrastructure; (8) the final outcome of significant litigation; (9) the nature, extent, timing and results of governmental actions, examinations, reviews and reforms including those related to the Dodd-Frank Wall Street Reform and Consumer Protection Act, as well as future regulations which will be adopted by the relevant regulatory agencies, including the Consumer Financial Protection Bureau (CFPB), to implement the Act's provisions; and (10) the outcome of judicial and regulatory decisions regarding practices in the residential mortgage industry, including among other things the processes followed for foreclosing residential mortgages. Additional factors that could cause results to differ materially from those described above can be found in Huntington's 2010 Annual Report on Form 10-K, and documents subsequently filed by Huntington with the Securities and Exchange Commission. All forward-looking statements included in this document are based on information available at the time of the release. Huntington assumes no obligation to update any forward-looking statement. Forward Looking Statements 122 |