EX-99.1
Published on May 4, 2007

| Analyst Handout May 2, 2007 |

| Basis of Presentation Use of non-GAAP financial measures This presentation contains GAAP financial measures and non-GAAP financial measures where management believes it to be helpful in understanding Huntington's results of operations or financial position. Where non-GAAP financial measures are used, the comparable GAAP financial measure, as well as the reconciliation to the comparable GAAP financial measure, can be found in the current quarter earnings press release, this presentation, or in the Quarterly Financial Review supplement to the current Earnings Press Release, which can be found on Huntington's website at huntington-ir.com. Significant Items Certain components of the Income Statement are naturally subject to more volatility than others. As a result, analysts/investors may view such items differently in their assessment of performance compared with their expectations and/or any implications resulting from them on their assessment of future performance trends. It is a general practice of analysts/investors to try and determine their perception of what "underlying" or "core" earnings performance is in any given reporting period, as this typically forms the basis for their estimation of performance in future periods. Therefore, Management believes the disclosure of certain "Significant Items" in current and prior period results aids analysts/investors in better understanding corporate performance so that they can ascertain for themselves what, if any, items they may wish to included/exclude from their analysis of performance; i.e., within the context of determining how that performance differed from their expectations, as well as how, if at all, to adjust their estimates of future performance accordingly. Use of Huntington and Sky Financial Merger pro forma data This presentation contains Pro Forma financial measures where management believes it to be helpful in understanding how the proposed merger with Sky Financial Group will impact Huntington's results of operations or financial position. The data represent actual reported information as of September 30, 2006 for both organizations, combined arithmetically, with no adjustments for purchase accounting made, unless otherwise noted. The data for Sky Financial Group also include Union Federal Bank reported information on a similar pro forma basis, as this transaction was completed by Sky Financial Group subsequent to September 30, 2006. Annualized data Certain returns, yields, performance ratios, or growth rates for a quarter are "annualized" in this presentation to represent an annual time period. This is done for analytical and decision-making purposes to better discern underlying performance trends when compared to full-year or year-over-year amounts. For example, loan growth rates are most often expressed in terms of an annual rate like 8%. As such, a 2% growth rate for a quarter would represent an annualized 8% growth rate. Fully taxable equivalent interest income and net interest margin Income from tax-exempt earnings assets is increased by an amount equivalent to the taxes that would have been paid if this income had been taxable at statutory rates. This adjustment puts all earning assets, most notably tax-exempt municipal securities and certain lease assets, on a common basis that facilitates comparison of results to results of competitors. Rounding Please note that columns of data in the following slides may not add due to rounding. |

| Basis of Presentation Estimating the Impact on Balance Sheet and Income Statement Results Due to the Unizan Merger The merger with Unizan Financial Corp. (Unizan) was completed on March 1, 2006. At the time of acquisition, Unizan had assets of $2.5 billion, including $1.6 billion of loans, and core deposits of $1.5 billion. When comparing post-merger period results to pre-merger periods, the term "merger-adjusted" refers to amounts and percentage changes that represent reported results adjusted to exclude the impact of the merger. The term "merger-related" refers to amounts and percentage changes representing the impact attributable to the merger. "Merger costs" represent expenses associated with merger integration activities. Management believes these distinctions are helpful in better discerning underlying growth rates and in analyzing performance trends compared to prior periods. The following methodology has been implemented to estimate the approximate effect of the Unizan merger used to determine "merger-adjusted" and "merger-related" impacts. Balance Sheet Items: For loans and leases, as well as core deposits, balances as of the acquisition date are pro-rated to the post-merger period being used in the comparison. For example, to estimate the impact on 2006 first quarter average balances, one-third of the closing date balance was used as those balances were in reported results for only one month of the quarter. Full quarter and year-to-date estimated impacts were developed using this same pro-rata methodology. This methodology assumes acquired balances will remain constant over time. Income Statement Items: For income statement line items, Unizan's actual full year results for 2005 were used for pro-rating the impact on post-merger periods. For example, to estimate the 2006 first quarter impact of the merger on personnel costs, one-twelfth of Unizan's full-year 2005 personnel costs was used. Full quarter and year-to-date estimated impacts were developed using this same pro-rata methodology. This results in an approximate impact since the methodology does not adjust for any unusual items or seasonal factors in Unizan 2005 reported results or synergies realized since the merger date. The one exception to this methodology relates to the amortization of intangibles expense where the actual post-merger amount was used. Earnings per share equivalent data Significant and/or one-time income or expense items may be expressed on a per common share basis. This is done for analytical and decision-making purposes to better discern underlying trends in total corporate earnings per share performance excluding the impact of such items. Investors may also find this information helpful in their evaluation of the company's financial performance against published earnings per share consensus amounts, which typically exclude the impact of significant and/or one-time items. Earnings per share equivalents are usually calculated by applying a 35% effective tax rate to a pre-tax amount to derive an after-tax amount which is divided by the average shares outstanding during the respective reporting period. Occasionally, when the item involves special tax treatment, the after-tax amount is separately disclosed, with this then being the amount used to calculate the earnings per share equivalent. NM or nm Percent changes of 100% or more are shown as "nm" or "not meaningful". Such large percent changes typically reflect the impact of one-time items within the measured periods. Since the primary purpose of showing a percent change is for discerning underlying performance trends, such large percent changes are "not meaningful" for this purpose. |

| Forward Looking Statements This presentation contains certain forward-looking statements, including certain plans, expectations, goals, and projections, and including statements about the benefits of the merger between Huntington and Sky Financial, which are subject to numerous assumptions, risks, and uncertainties. Actual results could differ materially from those contained or implied by such statements for a variety of factors including: the businesses of Huntington and Sky Financial may not be integrated successfully or such integration may take longer to accomplish than expected; the expected cost savings and any revenue synergies from the merger may not be fully realized within the expected timeframes; disruption from the merger may make it more difficult to maintain relationships with clients, associates, or suppliers; the required governmental approvals of the merger may not be obtained on the proposed terms and schedule; Huntington and/or Sky Financial's stockholders may not approve the merger; changes in economic conditions; movements in interest rates; competitive pressures on product pricing and services; success and timing of other business strategies; the nature, extent, and timing of governmental actions and reforms; and extended disruption of vital infrastructure; and other factors described in Huntington's 2006 Annual Report on Form 10-K, Sky Financial's 2006 Annual Report on Form 10-K, and documents subsequently filed by Huntington and Sky Financial with the Securities and Exchange Commission. All forward-looking statements are based on information available at the time of the release. Neither Huntington nor Sky Financial assumes any obligation to update any forward-looking statement. |

| Additional Information About the Huntington and Sky Financial Group Merger and Where to Find It In connection with the proposed merger of Huntington Bancshares Incorporated and Sky Financial Group, Huntington and Sky Financial will be filing relevant documents concerning the transaction with the Securities and Exchange Commission. On April 19, 2007, Huntington filed Amendment No. 2 to the registration statement on Form S-4 with the Securities and Exchange Commission, which includes a proxy statement/prospectus. Stockholders will be able to obtain a free copy of the proxy statement/prospectus, as well as other filings containing information about Huntington and Sky Financial, at the Securities and Exchange Commission's internet site (http://www.sec.gov). Copies of the proxy statement/prospectus and the filings with the Securities and Exchange Commission that will be incorporated by reference in the proxy statement/prospectus can also be obtained, without charge, by directing a request to Huntington, Huntington Center, 41 South High Street, Columbus, Ohio 43287, Attention: Investor Relations, 614-480-4060, or Sky Financial, 221 South Church Street, Bowling Green, Ohio, 43402. The final proxy statement/prospectus will be mailed to stockholders of Huntington and Sky Financial. Stockholders are urged to read the proxy statement/prospectus, and other relevant documents filed with the Securities and Exchange Commission regarding the proposed transaction when they become available, because they will contain important information. The directors and executive officers of Huntington and Sky Financial and other persons may be deemed to be participants in the solicitation of proxies in respect of the proposed merger. Information regarding Huntington's directors and executive officers is available in its proxy statement included in the registration statement filed with the SEC by Huntington on April 19, 2007. Information regarding Sky Financial's directors and executive officers is available in its proxy statement filed with the SEC by Sky Financial on February 23, 2006. Other information regarding the participants in the proxy solicitation and a description of their direct and indirect interests, by security holdings or otherwise, will be contained in the proxy statement/prospectus and other relevant materials to be filed with the SEC when they become available. |
| Contents 2007 First quarter highlights 2007 First quarter financial review Credit quality review Appendix |

| First Quarter Highlights |
| 2007 First Quarter Highlights Reported earnings were $0.40 per common share Negatives included: Equity investment and litigation losses MSR mark-to-market valuation net loss Declines in residential real estate and home equity loans Underlying earnings were consistent with our expectations Positives included: Higher net interest margin Strong growth in middle market C&I loans and small business loans Growth in core deposits Strong growth in mortgage banking, trust, and brokerage and insurance income Decline in expenses Lower net charge-offs Good growth in automobile loans |
| 2007 First Quarter Highlights Credit quality performance was mixed: Higher NPAs Higher provision for credit losses which exceeded net charge-offs by $11.3 million Lower net charge-offs Sky Financial Group merger integration preparation proceeding as planned |

| Financial Review |
| 1Q07 Earnings Summary After-tax EPS Net income $95.7 MM $0.40 Significant Items Favorable/(Unfavorable) Earnings (1) EPS (2) Equity investment losses $ (8.5) MM $ (0.02) MSR mark-to-market net of hedge-related trading activity (2.0) (0.01) Litigation losses (1.9) (0.01) (1) Pre-tax (2) After tax |
| 2007 First Quarter Overview Financial Performance vs. 4Q06 $0.40 EPS... includes negative impacts from loss on equity investments ($0.02), negative net MSR mark-to-market net of hedge-related trading activity ($0.01), and litigation losses ($0.01) 3.36% net interest margin, up 8 basis points 5% annualized growth in average total commercial loans 7% annualized decline in average total consumer loans 12% annualized decline in average residential mortgages 5% annualized decline in average home equity loans 4% annualized decline in average total automobile loans and leases 2% annualized growth in average total core deposits 0.28% net charge-off ratio, down 7 basis points 1.08% allowance for loan and lease losses, up 4 basis points 7% increase in NPAs with 56% of total NPAs representing residential real estate assets and assets guaranteed by the US Government 0.79% period end non-performing asset ratio, up 5 basis points 7.06% period-end tangible common equity ratio, up from 6.87% |
| Quarterly Performance Highlights 1Q07 4Q06 3Q06 2Q06 1Q06 EPS $0.40 $0.37 $0.65 $0.46 $0.45 ROA 1.11% 0.98% 1.75% 1.25% 1.26% ROE 12.9% 11.3% 21.0% 14.9% 15.5% Return on tangible equity (1) 16.5% 14.5% 27.1% 19.3% 18.0% ICG (2) 4.4% 3.7% 12.9% 6.8% 6.9% Net interest margin 3.36% 3.28% 3.22% 3.34% 3.32% Efficiency ratio 59.2% 63.3% 57.8% 58.1% 58.3% Loan & lease growth (3) (1)% --% 2% 20% 8% Core deposit growth (4) 2 % (1)% 1% 23% 15% Net charge-offs annualized 0.28% 0.35% 0.32% 0.21% 0.39% NPA ratio (5) 0.79% 0.74% 0.65% 0.65% 0.59% ALLL/loans & leases (5) 1.08% 1.04% 1.06% 1.09% 1.09% ACL/loans & leases (5) 1.23% 1.19% 1.21% 1.24% 1.24% Tang. equity/assets (5) 7.06% 6.87% 7.13% 6.46% 6.97% Tang. com. equity/risk weighted assets (5) 7.69%e 7.65% 7.97% 7.29% 7.80% (1) = Net Income less expense for amortization of intangibles divided by average tangible shareholder equity (shareholder equity - intangible assets) (2) = ROE x (1-(dividend declared per share/earnings per share)) (3) Average linked quarter growth rate annualized; impacted by loan sales (4) Average linked quarter growth rate annualized (5) Period end e = estimate |
| Net Interest Income & Margin Trends (1) Net Interest Income (FTE) Amount 1Q04 225.708 2Q04 225.482 3Q04 229.922 4Q04 238.215 3.7 1Q05 238.059 2Q05 244.861 3Q05 245.371 4Q05 247.513 1Q06 247.516 2Q06 266.179 3Q06 259.403 4Q06 262.104 1Q07 259.602 ($MM) (1) Fully taxable equivalent basis Net Interest Margin (FTE) 1Q04 0.0336 2Q04 0.0329 3Q04 0.033 4Q04 0.0338 0.0332 1Q05 0.0331 2Q05 0.0336 3Q05 0.0331 4Q05 0.0334 1Q06 0.0332 2Q06 0.0334 3Q06 0.0322 4Q06 0.0328 1Q07 0.0336 +5% YOY 1Q vs. 4Q NIM Change Day count 4 bp Earning asset mix change 2 Other funding mix change 2 Total change 8 bp |
| Loan & Lease Asset Trends Average ($B) Annualized Growth (1) 1Q07 v 4Q06 v 1Q07 v 1Q07 4Q06 3Q06 1Q06 Total commercial $12.5 5 9 12 % Auto loans (2) 2.2 20 6 11 Auto direct financing leases 1.7 (30) (28) (24) Home equity 4.9 (5) (5) 2 Residential real estate (2) 4.5 (12) (10) 4 Other consumer 0.4 (7) -- (6) Total consumer 13.7 (7) (8) -- Total loans and leases $26.2 (1) % -- % 5 % Total earning assets $31.3 (5) % (4) % 4 % (1) Linked quarter percent change annualized (2) Impacted by loan sales |
| Core Deposit Trends Average ($B) Annualized Growth (1) 1Q07 v 4Q06 v 1Q07 v 1Q07 4Q06 3Q06 1Q06 Commercial Demand deposits - non-int. bearing $ 2.7 (14) % 9 % 1 % Demand deposits - int. bearing 0.5 59 (1) 39 Other core deposits (2) 3.7 2 (4) 17 Total 6.9 (1) 1 11 Consumer Demand deposits - non-int. bearing 0.8 24 4 9 Demand deposits - int. bearing 1.9 15 11 15 Other core deposits (2) 10.0 (1) (5) 2 Total 12.7 3 (2) 4 Total Demand deposits - non-int. bearing 3.5 (6) 8 3 Demand deposits - int. bearing 2.3 24 9 19 Other core deposits (2) 13.8 -- (5) 5 Total $19.7 2 % (1) % 6 % (1) Linked quarter percent change annualized (2) Includes core CDs, savings, and other deposits |
| ($MM) Better or (Worse) vs. 1Q07 4Q06 (1) 1Q06 Deposit service charges $ 44.8 $ (3.8) (8) % 9 % Other service charges 13.2 (0.6) (4) 15 Total service charges 58.0 (4.4) (7) 10 Trust services 25.9 2.4 10 22 Brokerage / insurance 16.1 1.5 10 6 Bank owned life insurance 10.9 0.0 0 6 Mortgage banking 9.4 3.2 52 (29) Gain on sale of auto loans 1.1 (0.1) (9) nm Other (2) 23.8 (14.0) (37) (49) Sub-total 145.1 (11.3) (7) (9) Securities gains (losses) 0.1 15.9 nm nm Total reported $145.2 $ 4.6 3 % (9) % (1) Linked quarter percentage growth is not annualized (2) Other income includes primarily other commercial fees, investment banking fees, automobile and other lease-related fee income, and equity investment income/losses Non-interest Income |
| ($MM) Better or (Worse) vs. 1Q07 4Q06 (1) 1Q06 Personnel costs $134.6 $ 3.3 2 % (2) % Net occupancy 19.9 (2.6) (15) (11) Outside services 21.8 (1.1) (5) (10) Equipment 18.2 (0.1) - - (10) Professional services 6.5 2.5 28 (21) Marketing 7.7 (1.5) (24) (5) Telecommunications 4.1 0.5 11 15 Printing and supplies 3.2 0.4 10 (6) Amortization of intangibles 2.5 0.5 16 nm Other (2) 23.4 23.9 51 24 Total reported $242.1 $ 25.7 10 % (2) % (1) Linked quarter percentage growth is not annualized (2) Other expense includes insurance, travel, postage, operational losses, contributions, operating lease & misc. fees and commissions Non-interest Expense |
| 1Q03 2Q03 3Q03 4Q03 1Q04 2Q04 3Q04 4Q04 1Q05 2Q05 3Q05 4Q05 1Q06 2Q06 3Q06 4Q06 1Q07 Efficiency Ratio - Reported 0.663 0.625 0.6 0.671 0.651 0.623 0.663 0.664 0.637 0.618 0.574 0.57 0.583 0.581 0.578 0.633 0.592 Efficiency Ratio - Adjusted 0.579 0.555 0.513 0.58 0.597 0.565 0.595 0.575 0.607 0.586 0.559 0.561 0.57 0.567 0.567 0.589 0.59 Efficiency Ratio Trends (1) Reported revenue and expenses adjusted for automobile operating lease expense and other items affecting comparability. See Operating Leverage & Efficiency Trend slide in the Appendix for a complete reconciliation between GAAP and adjusted revenue and expenses. (1) |
| 6.25% - 6.50% TCE Ratio Target LLR/NPL ratio 2Q02 3Q02 4Q02 1Q03 2Q03 3Q03 4Q03 1Q04 2Q04 3Q04 4Q04 1Q05 2Q05 3Q05 4Q05 1Q06 2Q06 3Q06 4Q06 1Q07 Tang. Common Equity / Risk-Weighted Assets 0.0771 0.0729 0.071 0.0723 0.0724 0.0731 0.076 0.0764 0.0783 0.0786 0.0784 0.0805 0.0819 0.0791 0.078 0.0729 0.0797 0.0765 0.0769 Tang. Common Equity / Assets 0.0816 0.0764 0.0722 0.07 0.0706 0.0677 0.0679 0.0697 0.0695 0.0711 0.0718 0.0742 0.0736 0.0739 0.0719 0.0697 0.0646 0.0713 0.0687 0.0706 Capital Trends (1) End of period e = estimate e |
| Credit Quality Trends Overview 1Q07 4Q06 3Q06 2Q06 1Q06 NPA ratio 0.79% 0.74% 0.65% 0.65% 0.59% Net charge-off ratio 0.28 0.35 0.32 0.21 0.39 90+ days past due 0.27 0.23 0.24 0.19 0.20 Consumer 0.44 0.40 0.41 0.30 0.36 Middle-market C&I 0.01 -- 0.01 -- 0.02 Middle-market CRE 0.23 0.04 0.06 0.12 -- Small bus. C&I & CRE 0.03 0.06 0.04 0.03 -- ALLL ratio 1.08 1.04 1.06 1.09 1.09 NPA coverage ratio 137 141 164 168 183 NPL coverage ratio 180 189 217 213 209 |
| % Lns + OREO 1Q02 2Q02 3Q02 0.012 4Q02 0.0074 1Q03 0.0074 2Q03 0.007 3Q03 0.0065 4Q03 0.0041 1Q04 0.0043 2Q04 0.0034 3Q04 0.0036 4Q04 0.0046 1Q05 0.003 2Q05 0.004 3Q05 0.0042 4Q05 0.0048 1Q06 0.0059 2Q06 0.0065 3Q06 0.0065 4Q06 0.0074 1Q07 0.0079 Non-guaranteed commercial Non-guaranteed residential real estate Guaranteed by U.S. Govt (SBA & GNMA) 2Q03 113.019 20.703 3Q03 119.021 18.056 4Q03 70.29 17.096 1Q04 69.988 21.706 2Q04 51.323 23.373 3Q04 50.176 30.3 4Q04 79.146 29.422 1Q05 38.637 30.402 4.264 2Q05 58.883 32.643 5.892 3Q05 58.699 36.289 6.812 4Q05 67.284 42.547 7.324 1Q06 75.994 60.635 18.256 2Q06 80.961 59.397 30.71 3Q06 69.982 67.554 33.676 4Q06 80.232 79.53 33.858 1Q07 95.444 80 28.748 Non-performing Assets Trends ($MM) $206.7 $90.0 44% $88.0 42% $154.9 $60.6 39% $76.0 49% $30.7 18% $59.4 35% $81.0 47% $171.1 $33.7 20% $67.6 39% $70.0 41% $171.2 56% $33.9 18% $193.6 $79.5 41% $80.2 41% $28.7 14% |
| Net Charge-off Ratios (1) 1Q07 4Q06 3Q06 2Q06 1Q06 Middle-market C&I --% (0.12)% 0.12% (0.04)% 0.53% Middle-market CRE 0.04 0.41 0.06 0.14 -- Small business C&I & CRE 0.34 0.75 0.74 0.43 0.73 Total commercial 0.08 0.22 0.23 0.12 0.38 Auto loans 0.52 0.46 0.34 0.23 0.60 Auto leases 0.52 0.62 0.47 0.34 0.63 Home equity 0.49 0.47 0.53 0.38 0.37 Residential RE 0.17 0.19 0.07 0.06 0.07 Other direct 2.56 2.63 2.54 1.89 1.72 Total consumer 0.46 0.46 0.40 0.30 0.40 Total 0.28% 0.35% 0.32% 0.21% 0.39% (1) Annualized |
| Allowance for Loan & Lease Losses (ALLL) Amount Percent 1Q02 2Q02 3Q02 371.033 0.0208 4Q02 336.648 0.0181 1Q03 303.636 0.0161 2Q03 307.667 0.0161 3Q03 336.398 0.0159 4Q03 299.7 0.0142 1Q04 295.377 0.0139 2Q04 286.935 0.0132 3Q04 282.65 0.0125 4Q04 271.211 0.0115 1Q05 264.39 0.0109 2Q05 254.784 0.0104 3Q05 253.943 0.0104 4Q05 268 0.011 1Q06 283.839 0.0109 2Q06 287.517 0.0109 3Q06 280.153 0.0106 4Q06 272.068 0.0104 1Q07 282.976 0.0108 ($MM) ALLL Reserve Components 1Q07 4Q06 3Q06 2Q06 1Q06 Transaction 0.89% 0.86% 0.86% 0.89% 0.88% Economic 0.19 0.18 0.20 0.20 0.21 Total 1.08% 1.04% 1.06% 1.09% 1.09% |
| ($MM) 1Q07 4Q06 3Q06 2Q06 1Q06 Allowance for loan and lease losses (ALLL) $283.0 $272.1 $280.2 $287.5 $283.8 Allowance for unfunded loan commitments and LOCs (AULC) 40.5 40.2 39.3 38.9 39.3 Total allowance for credit losses (ACL) $323.5 $312.2 $319.5 $326.4 $323.1 ALLL as % of total loans and leases 1.08% 1.04% 1.06% 1.09% 1.09% total NPAs 137 141 164 168 183 total NPLs 180 189 217 213 209 ACL as % of total loans and leases 1.23% 1.19% 1.21% 1.24% 1.24% total NPAs 157 161 187 191 209 total NPLs 206 217 247 241 238 non-guaranteed commercial NPAs 360 389 456 403 425 (1) End of period Allowances for Credit Losses (ACL) (1) |
| Current portfolio (2) - $945 Million Vertical construction $643 MM 68 % Land under development 122 13 Land held for development 180 19 No geographic concentration within footprint markets NCO ratio: 1Q07: 0.08% 12 month trailing: 0.62% NPA ratio of 1.41% (2) Risk of loss reduced due to specific review of underwriting standards and client selection in 2005 Market observations General slowdown in the market reflecting declining prices and excess inventory Smaller developers showing signs of deterioration, manifested in higher monitored credit balances Spring and summer sales season will determine potential losses (1) Includes middle-market CRE and small business CRE loans (2) 3/31/07 CRE - Single Family Builders (1) |
| Residential Lending Review First Mortgages Current portfolio (1) - $4.5 Billion Focused on prime borrowers No sub-prime lending No option ARM structures No negative amortization loans Focused Alt-A program... $660 MM outstanding / 13% of residential portfolio / 11% of 2006 production Limited interest only exposure... $800 MM outstanding / 17% of residential portfolio / 10% of 2006 production Portfolio management and underwriting consistent with regulatory expectations All applications centrally underwritten Reduced broker origination channel volume beginning early 2005 Significantly reduced interest only volume beginning 2006, with specific credit requirements Implemented more conservative underwriting for Alt-A in late 2005 (1) 1Q07 average balances |
| Residential Lending Review Home Equity Lending Current portfolio (1) - $4.9 Billion Focused on prime borrowers Since 2004 increased average FICO at origination from 720 to 740 and percentage of originations below 640 decreased from 10% to 3% Three origination channels (prior 12 months) Banking offices 80% Huntington Call Center 13% Broker relationships 7% All applications centrally underwritten Broker applications decisioned separately with higher property valuation requirements and more conservative credit criteria Cross sold with first mortgage originations Primary product offers up to 89.9% loan to value (LTV) Portfolio LTV of 80% No product offering in excess of 100% LTV Debt/Income (D/I) policy of 45% (1) 1Q07 average balances |
| Residential Lending Origination Trends ($ in millions) 1Q07 2006 2005 2004 2003 First Mortgages Originations (1) $180 $1,075 $1,278 $1,752 $1,464 Alt-A % of originations 8% 16% 20% 22% 8% Avg. FICO (2) 720 732 720 723 710 Avg. LTV (2) 73% 72% 74% 73% 72% Home Equity Lines Originations (1) $351 $1,137 $1,330 $1,741 $1,577 Avg. FICO (2) 748 738 730 721 723 Avg. LTV (2) 75% 76% 80% 81% 80% Home Equity Loans Originations (1) $211 $547 $571 $511 $410 Avg. FICO (2) 742 731 718 710 702 Avg. LTV (2) 66% 66% 65% 65% 68% Originated loans still outstanding At origination |
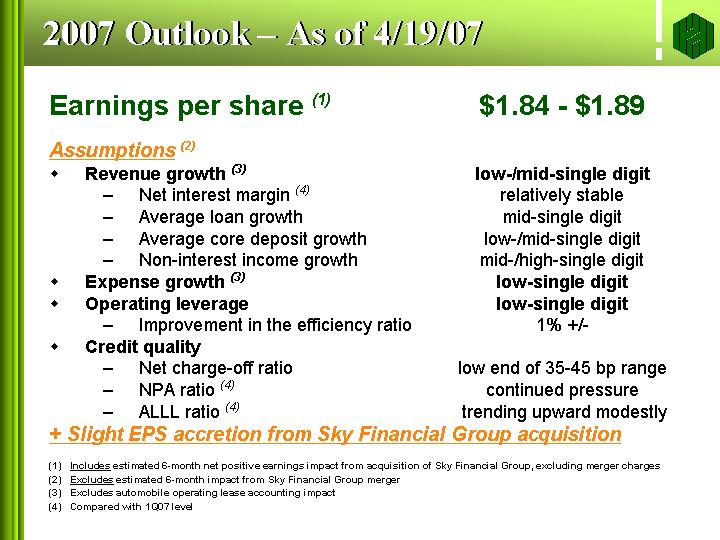
| 2007 Outlook - As of 4/19/07 Earnings per share (1) $1.84 - $1.89 Assumptions (2) Revenue growth (3) low-/mid-single digit Net interest margin (4) relatively stable Average loan growth mid-single digit Average core deposit growth low-/mid-single digit Non-interest income growth mid-/high-single digit Expense growth (3) low-single digit Operating leverage low-single digit Improvement in the efficiency ratio 1% +/- Credit quality Net charge-off ratio low end of 35-45 bp range NPA ratio (4) continued pressure ALLL ratio (4) trending upward modestly + Slight EPS accretion from Sky Financial Group acquisition (1) Includes estimated 6-month net positive earnings impact from acquisition of Sky Financial Group, excluding merger charges (2) Excludes estimated 6-month impact from Sky Financial Group merger (3) Excludes automobile operating lease accounting impact (4) Compared with 1Q07 level |

| The Local Bank With National Resources |

| Appendix |
| Appendix Franchise 34 Strategy, organization & history 40 Financial overview 54 2006 Highlights 55 Significant items impacting earnings performance comparisons 59 Income statement 62 Net income & EPS 63 Net interest income & margin 65 Non-interest income 73 Non-interest expense 78 Operating leverage 79 ROA, ROE, ICG 81 Investment securities 82 Loans and leases 85 Credit composition 87 Commercial & industrial 89 Commercial real estate 97 Loans and leases (cont'd) Consumer loans 101 Auto loans and leases 103 Non-auto consumer trends 106 Home equity and residential mortgages 107 Other consumer 112 Deposits & other funding 113 Total deposit trends 114 Core deposit trends 117 Other funding 121 Capital 122 Credit quality review 128 Nonperforming assets 129 Charge-offs 131 Delinquencies 133 ALLL, AULC, ACL 134 Estimated impact of Unizan merger 137 Lines of Business 142 Regional Banking 145 Dealer Sales 175 Private Financial & Capital Markets Group 190 |

| Franchise |
| Huntington Bancshares Overview - 3/31/07 Midwest financial services holding company Founded - 1866 Headquarters - Columbus, Ohio Total assets - $35 billion Employees (1) - 7,863 Franchise: Regional Banking 5 States / 8 Regions - Retail & Commercial Banking 371 Offices / 1,004 ATMs Dealer Sales 5 States + AZ, FL, GA, NC, NJ, PA, SC, TN Private Financial Group 5 States / 6 offices (2) FL / 4 offices (3) Mortgage Banking (4) 5 States + MD, NJ (1) Full-time equivalent (FTE) (2) Dedicated shared office with Regional Banking (3) Includes 2 full-service offices + 2 trust offices (4) Part of Regional Banking |
| The Huntington Franchise - 3/31/07 Focus on the Midwest (1) Total Deposits $21.9 B (2) 1Q07 Central Ohio 0.23 N. Ohio 0.17 W. Michigan 0.13 E. Michigan 0.11 S. Ohio/KY 0.11 E. Ohio 0.08 W. Virginia 0.07 Indiana 0.038 PF & CM Group 0.05 Mortg & Eq Leases 0.008 Dealer 0.003 23% 17% 7% Offices 108 ATMs 224 Detroit 3% Grand Rapids 10% NW MI 16% CWest MI 12% Offices 200 ATMs 569 Akron 4% Canton 15% Cincinnati 4% Cleveland 4% Columbus 28% Dayton 5% New Phil.- Dover 31% Toledo 11% Zanesville 35% Offices 26 ATMs 73 Indianapolis 3% Offices 12 ATMs 34 Offices 25 ATMs 104 Charleston 9% Morgantown 21% 13% 11% *% (2) Excluding Treasury * Less than 1% (1) Excludes 4 PFG offices in FL; Market share at 6/30/06 and includes Unizan 11% 1% 8% 4% 5% Offices 371 ATMs 1,004 |
| Franchise Pro-forma Including Impact of Pending Merger of Sky Financial Group |
| A Stronger Regional Presence Source: SNL Financial, company presentations and filings. FDIC deposit data as of June 30, 2006; excludes the impact of any banking office closings HBAN SKY Pro Forma Deposits - Top 11 MSAs MSA Rank BOs Deposits Share Columbus 1 81 $8,625 28.1% Cleveland 5 78 3,330 5.2 Indianapolis 3 63 2,624 10.6 Detroit 8 42 2,297 2.6 Toledo 1 56 2,258 24.9 Pittsburgh 7 46 1,845 3.0 Youngstown 1 40 1,777 21.5 Cincinnati 5 37 1,546 3.8 E. Liverpool-Salem 1 15 1,261 57.9 Canton-Massillon 1 28 1,238 24.3 Grand Rapids 3 23 1,216 10.3 BOs = Banking offices Cleveland Columbus Indianapolis Toledo |
| Pro Forma Deposit Market Share (1) Pro Forma Sky Financial Huntington ($MM) Rank BOs Deposits Share Rank BOs Deposits Share Rank BOs Deposits Share Ohio 4 228 $16,278 7.8% 7 221 $8,620 4.1% 3 449 $24,898 11.9% Michigan 9 119 5,143 3.4 93 5 125 0.1 9 124 5,268 3.5 Indiana 23 25 798 0.9 9 44 2,016 2.3 5 69 2,815 3.2 Pennsylvania -- -- -- -- 17 66 2,552 1.1 17 66 2,552 1.1 West Virginia 6 31 1,549 6.2 61 3 76 0.3 6 34 1,625 6.6 Kentucky 28 14 444 0.7 -- -- -- -- 28 14 444 0.7 Columbus 1 67 $8,302 27.0% 15 14 $ 323 1.1% 1 81 $8,625 28.1% Cleveland 8 47 2,370 3.7 13 31 960 1.5 5 78 3,330 5.2 Indianapolis 9 19 617 2.5 4 44 2,007 8.0 3 63 2,624 10.6 Detroit 8 42 2,297 2.6 -- -- -- -- 8 42 2,297 2.6 Toledo 4 20 969 10.7 3 36 1,289 14.2 1 56 2,258 24.9 Pittsburgh -- -- -- -- 7 46 1,845 3.0 7 46 1,845 3.0 Youngstown -- -- -- -- 1 40 1,777 21.5 1 40 1,777 21.5 Cincinnati 5 36 1,532 3.8 75 1 14 0.0 5 37 1,546 3.8 E. Liverpool-Salem -- -- -- -- 1 15 1,261 57.9 1 15 1,261 57.9 Canton-Massillon 2 16 783 15.4 6 12 455 8.9 1 28 1,238 24.3 Grand Rapids 3 23 1,216 10.3 -- -- -- -- 3 23 1,216 10.3 Akron 8 13 447 4.2 9 15 427 4.0 6 28 874 8.2 Dayton 6 11 468 4.6 11 4 129 1.3 6 15 597 5.9 (1) June 2006 FDIC data; excludes impact of any banking office closings BOs = Banking offices |

| Strategy, Organization and History |

| The Huntington Template Market Positioning Local Bank with National Resources Local execution within corporate standards Local discretion with performance accountability Focus on Ohio, Michigan, West Virginia, Indiana and neighboring markets Focus on middle-market commercial, small business, consumer, high-wealth, and auto dealership clients Value Proposition "Simply the Best" service |
| Our Formula for Growing Earnings Formula: Stable net interest margin + Modest loan growth + Modest deposit growth + Good growth in selected fee income activities + Controlled expense growth + Stable credit quality = Reasonable earnings growth Augmented by: Market consolidation benefits Disciplined capital management "A well-conceived, well-executed plan in a low growth market... is better than an ill-conceived, poorly executed plan in a high growth market" |

| Growth Opportunities Affinity Banking... Buckeye / Blue Jackets banking Huntington for Schools Leverage online banking capabilities New offices in growth markets... 8 in 2006 Improve customer loyalty through improved service experience Micro marketing... 3 mile radius focus Exploit growing business segments... Healthcare in West Michigan Centers of Expertise... equipment leasing and SBA lending Wealth management |
| M&A Philosophy Huntington is positioned to participate in further Midwest consolidation Considerations Build market share in existing markets Enter new markets with high market shares Enrich our deposit mix... higher relative DDA Similar business model / focus on service excellence Retain local management Similar core values / culture Revenue opportunities... new / leveraging product and service capabilities Leverage technology expertise Adds to shareholder value from the start |
| M&A Discipline The value of synergies must exceed the premium paid to the seller First year GAAP accretion for Huntington Excludes one time merger charges Includes impact of intangible amortization Significant GAAP accretion for second year and beyond Long-term incremental accretion of 10%+ Must have significant long-term benefit Use of Realistic Cost Savings Targets within footprint Ability to leverage existing Huntington infrastructure |
| Organization National Resources BUSINESSES Commercial Retail Private Financial Dealer Sales Mortgage Capital Markets Huntington Investment Co. CORPORATE SUPPORT Legal Finance Operations and Technology Human Resources Risk Management Credit Administration Southern Ohio/KY West Michigan Central Ohio Northern Ohio Indiana East Michigan West Virginia The Local Bank REGIONS Eastern Ohio |
| Organization Organization |

| Senior Leadership Team Experience-Yrs Position Appointed Banking HBAN Tom Hoaglin Chairman, President and CEO 1Q01 33 5 Dick Cheap General Counsel and Secretary 2Q98 8 8 Dan Benhase SEVP-Pvt. Fin'l & Cap.Mkts. 2Q00 25 6 Mary Navarro SEVP-Regional Banking Group Pres. 2Q06 30 4 Nick Stanutz SEVP-Dealer Sales 2Q99 28 20 Melinda Ackerman EVP-Human Resources 1Q05 31 (1) 1 Willie Dolloff EVP-Operations/Technology 2Q00 33 32 Dick Witherow EVP-Chief Credit Officer 4Q06 32 5 Don Kimble EVP-CFO 3Q04 19 2 Jim Nelson EVP-Chief Risk Officer 4Q04 20 1 Eric Sutphin EVP-Chief Auditor 3Q04 18 2 Mike Prescott Regional Banking Group President 2Q06 19 11 Jim Dunlap Regional Banking Group President 2Q06 27 27 (1) Outside of banking |
| Brief History 1866 - P. W. Huntington & Company opened - Pelatiah Webster Huntington, President 1878 - Bank moved headquarters to 17 S. High Street 1905 - Incorporated as The Huntington National Bank of Columbus 1923 - Construction of the main branch at 17 S. High Street begun 1966 - Huntington Bancshares Incorporated bank holding company formed as a Maryland corporation... The parent of The Huntington National Bank 1983 - Huntington shares listed on NASDAQ 2001 - Strategic restructuring launched 2004 - Record EPS 2005 - Record EPS 2006 - Record EPS - Announced proposed acquisition of Sky Financial Group |
| Major Milestones - 2001 - 2003 2001 1Q - Hoaglin appointed CEO 2Q - Completed strategic review - Launched major restructuring initiative 3Q - 400 share employee option grant - Announced SunTrust to purchase Florida banking operations - Announced 20% dividend decrease 2002 1Q - Launched CSS/ARGO banking office teller technology upgrade - Closed Florida sale to SunTrust - Initiated 22 million share repurchase program - Acquired Haberer Investment Advisor - Launched online banking upgrade 3Q - Sold J. Rolfe Davis Insurance Agency - Restructured Huntington Merchant Services LLC - Acquired LeaseNet Group Inc. - 300 share employee option grant 4Q - Completed CSS/ARGO teller system installation - Sold $47 mm of NPAs 2003 1Q - Initiated 8 million share repurchase program - Sold $556 mm of auto loans 2Q - Announced formal SEC investigation and DFL/OL restatement - Increased dividend 9.4% - Sold $570 mm of auto loans 3Q - Adopt FIN 46 - Restatement for prospective adoption of deferral accounting and other changes - Sold Martinsburg, WV banking offices 4Q - Restatement for retroactive application of deferral accounting - Sold $1,020 mm of auto loans - Sold $43 mm of NPAs - Extinguished $250 mm of L-T debt - Launched ESS platform system technology release #1 |
| Major Milestones - 2004 2004 1Q - Announced merger with Unizan Financial Corp. - Sold $868 mm of auto loans 2Q - Announced 14.3% increase in the common stock dividend - Federal Reserve extends review period for Unizan merger - Sold $512 mm of auto loans - Transferred $102 mm of auto loans to held for sale - Initiated 7.5 million share repurchase program 3Q - Announced negotiations with SEC to resolve formal investigation - Kimble appointed Chief Financial Officer - Sutphin appointed Chief Auditor - Sold $153 mm of auto loans 4Q - Nelson appointed Chief Risk Officer - Announced expected Federal Reserve Bank of Cleveland (FRBC) and OCC formal supervisory agreements - Announced withdrawal of pending Unizan Financial Corp. merger application with the Federal Reserve and negotiations for a one-year extension of the Unizan merger agreement - Rating agency actions (see Capital Issues slide) - Announced extension to Unizan merger agreement - Completed ESS platform system technology release #1 installation |
| Major Milestones - 2005 2005 1Q - Announced Federal Reserve (FRB) and OCC formal written supervisory agreements - Ackerman appointed Human Resources - Kelsheimer appointed President of Northern Ohio region 2Q - Announced resolution of SEC formal investigation - Reactivated 7.5 million share repurchase program - Launched business banking on-line - Announced agreement to add 99 ATMs in Walgreen stores 3Q - Received national excellence awards from Greenwich Associates 4Q - Announced termination of OCC formal written supervisory agreement - Announced 15 million share repurchase program - Re-filed Unizan application - Agreements for additional ATMs; Walgreen (33) and Cardtronics (77) |
| Major Milestones - 2006 2006 1Q - Announced 16.3% increase in common stock dividend - Completed merger with Unizan Financial Corp. - James Dunlap, Mary Navarro, and Michael Prescott named Regional Banking Group Presidents 2Q - Successfully completed Unizan conversion on April 24, 2006... converted 110,000 consumer and business accounts - Announced termination of FRB formal written supervisory agreement 4Q - Acquired Unified Fund Services, Inc. - Witherow appointed Chief Credit Officer - Cross appointed Senior Lender - Smith appointed President of Eastern Michigan region - Announced merger of Sky Financial Group |

| Financial Overview |

| 2006 Highlights |
| 2006 Earnings Summary After-tax EPS Net income $461.2 MM $1.92 Significant Items Favorable/(Unfavorable) Earnings (1) EPS (2) Reduction to federal income tax expense (2) $84.5 MM $ 0.35 Equity investment gains 7.4 0.02 MSR FAS 156 accounting change 5.1 0.01 Gain on sale of MasterCard(r) stock 3.3 0.01 Balance sheet restructuring (77.7) (0.21) Huntington Foundation contribution (10.0) (0.03) Automobile lease residual value losses (5.5) (0.01) Severance and consolidation expenses (4.8) (0.01) Unizan merger costs (3.7) (0.01) Adjustment for equity method investments (3.2) (0.01) Adjustment to defer home equity annual fees (2.3) (0.01) (1) Pre-tax unless otherwise noted (2) After tax |
| Performance Highlights 2006 2005 2004 2003 2002 EPS $1.92 $1.77 $1.71 $1.61 $1.33 ROA 1.31% 1.26% 1.27% 1.29% 1.24% ROE 15.7% 16.0% 16.8% 17.0% 14.5% ICG (1) 7.5% 8.4% 9.4% 9.9% 7.5% Net interest margin 3.29% 3.33% 3.33% 3.49% 3.62% Efficiency ratio 59.4% 60.0% 65.0% 63.9% 65.6% Loan & lease growth (2) 7% 10% 11% 15% (4)% Core deposit growth (3) 10% 6% 4% 1% (14)% Net charge-offs annualized 0.32% 0.33% 0.35% 0.81% 1.13% NPA ratio (4) 0.74% 0.48% 0.46% 0.41% 0.74% ALLL/loans & leases (4) 1.04% 1.10% 1.15% 1.42% 1.62% ACL/loans & leases (4) 1.19% 1.25% 1.29% 1.59% 1.81% Tang. equity/assets (4) 6.87% 7.19% 7.18% 6.79% 7.22% Tang. com. equity/risk weighted assets (4) 7.65% 7.91% 7.86% 7.31% 7.29% (1) = ROE x (1-(dividend declared per share/earnings per share)) (2) Average; impacted by automobile loans sales and 2002 by sale of Florida banking operations (3) Average; impacted in 2002 by sale of Florida banking operations; 2002 does not reflect the 3Q06 reclass of certain consumer CDs to core deposits (4) Period end |
| Operating Leverage - 2006 vs. 2005 ($MM) 2006 2005 Better or (Worse) Reported / GAAP Total revenue - FTE $1,596.3 $1,608.1 $(11.8) (1)% Non-interest expense 1,001.0 969.8 (31.2) (3) Operating leverage (4)% Efficiency ratio (1) 59.4% 60.0% Adjusted (2) Total revenue - FTE $1,636.0 $1,512.3 $123.7 8% Non-interest expense 937.7 873.9 (63.8) (7) Operating leverage 1% Efficiency ratio (1) 57.3% 57.8% (1) Non-interest expense less amortization of intangibles divided by adjusted total FTE revenue (2) Revenue and expenses adjusted for automobile operating lease expense and other items affecting comparability. See Operating Leverage & Efficiency Trend slide in the Appendix for a complete reconciliation between GAAP and adjusted revenue and expenses |
| Significant Items Impacting Earnings Performance Comparisons |
| Significant Items Impacting Financial Performance Comparisons Quarterly: 2007 & 2006 |
| Full Year: 2005 & 2006 Significant Items Impacting Financial Performance Comparisons |

| Income Statement |
| Amount 3Q02 88.015 4Q02 69.263 1Q03 91.73 2Q03 96.49 3Q03 90.912 13.3 4Q03 93.261 1Q04 104.173 2Q04 110.127 3Q04 93.506 4Q04 91.139 1Q05 96.519 2Q05 106.425 3Q05 108.574 4Q05 100.6 1Q06 104.456 2Q06 111.604 3Q06 110.3 47.1 4Q06 87.7 1Q07 95.7 Net Income and EPS Trends Net Income Amount 3Q02 0.36 4Q02 0.29 1Q03 0.39 2Q03 0.42 3Q03 0.39 0.06 4Q03 0.4 1Q04 0.45 2Q04 0.47 3Q04 0.4 4Q04 0.39 1Q05 0.41 2Q05 0.45 3Q05 0.47 4Q05 0.44 1Q06 0.45 2Q06 0.46 3Q06 0.46 0.19 4Q06 0.37 1Q07 0.4 Earnings Per Share ($MM) (8)% YOY (11)% YOY (1) Includes $47.1 million after tax ($0.19 per share) net positive impact due to reduction of federal income tax expense, partially offset by investment securities impairment (2) Includes $23.8 million after tax ($0.09 per share) net negative impact due to completing the balance sheet restructuring begun after the end of 3Q06, a contribution to the Huntington Foundation, and other significant items. (1) $157.4 $0.65 (2) $87.7 (1) (2) $0.37 |
| Change B (W) vs. 4Q06 1Q06 ($MM) 1Q07 4Q06 1Q06 Amt. Amt. Pct. Net interest income $255.6 $258.0 $243.7 $(2.4) $11.9 5% Provision (29.4) (15.7) (19.5) (13.7) (9.9) (51) Non-interest income 145.2 140.6 159.5 4.6 (14.4) (9) Non-interest expense (242.1) (267.8) (238.4) 25.7 (3.7) (2) Pretax income 129.3 115.1 145.3 14.2 (16.0) (11) Net income $95.7 $87.7 $104.5 $8.0 $(8.7) (8)% EPS $0.40 $0.37 $0.45 $0.03 $(0.05) (11)% Quarterly Earnings |
| Net Interest Income & Margin Trends (1) Net Interest Margin (FTE) 1Q04 225.708 0.0336 2Q04 225.482 0.0329 3Q04 229.922 0.033 4Q04 241.915 0.0338 1Q05 238.059 0.0331 2Q05 244.861 0.0336 3Q05 245.371 0.0331 4Q05 247.513 0.0334 1Q06 247.516 0.0332 2Q06 266.179 0.0334 3Q06 259.403 0.0322 4Q06 262.104 0.0328 1Q07 259.6 0.0336 ($MM) (1) Fully taxable equivalent basis |
| Commercial Loan Spread Trends (1) 6/04 7/04 8/04 9/04 10/04 11/04 12/04 1/05 2/05 3/05 4/05 5/05 6/05 7/05 8/05 9/05 10/05 11/05 12/05 1/06 2/06 3/06 4/06 5/06 6/06 7/06 8/06 9/06 10/06 11/06 12/06 1/07 2/07 3/07 C&I 0.0218 0.0218 0.0234 0.0247 0.0237 0.0232 0.0234 0.0238 0.0225 0.0223 0.0222 0.022 0.0215 0.0204 0.0212 0.0212 0.0211 0.0209 0.021 0.0222 0.0225 0.0224 0.0213 0.0209 0.0201 0.0203 0.0203 0.0213 0.0211 0.0216 0.021 0.021 0.0201 0.0206 Commercial Real Estate 0.0251 0.0231 0.0233 0.0236 0.0255 0.0248 0.0238 0.0225 0.0232 0.0229 0.0231 0.0228 0.0227 0.0223 0.0225 0.0219 0.0209 0.0203 0.0205 0.0206 0.0199 0.0189 0.0175 0.0187 0.0191 0.022 0.0211 0.0212 0.019 0.0181 0.0174 0.0185 0.0206 0.0202 Indirect 0.0337 0.0328 0.0332 0.0351 0.0349 0.0338 0.0312 0.0296 0.0288 0.0283 0.0281 0.0286 0.0294 0.0287 0.027 0.0273 0.028 0.0287 0.0282 0.0288 0.0294 0.0294 0.0284 0.0279 0.0275 0.0278 Home Equity 0.0287 0.028 0.0275 0.0271 0.0277 0.0277 0.0273 0.0272 0.0268 0.027 0.0269 0.0268 0.0268 0.026 0.0262 0.026 0.0265 0.026 0.0254 0.0245 0.0245 0.0219 0.0216 0.0197 0.0209 0.0199 Res R/E 0.0167 0.0164 0.0162 0.0134 0.0136 0.0141 0.0147 0.0148 0.0147 0.0151 0.0156 0.0155 0.0149 0.0147 0.015 0.0144 0.0135 0.0124 0.0121 0.0115 0.0113 0.0109 0.0079 0.0072 0.0067 0.0086 New Volume - Last 24 Months (1) 3 month rolling average |
| Consumer Loan Spread Trends (1) 6/04 7/04 8/04 9/04 10/04 11/04 12/04 1/05 2/05 3/05 4/05 5/05 6/05 7/05 8/05 9/05 10/05 11/05 12/05 1/06 2/06 3/06 4/06 5/06 6/06 7/06 8/06 9/06 10/06 11/06 12/06 1/07 2/07 3/07 C&I 0.0218 0.0218 0.0234 0.0247 0.0237 0.0232 0.0234 0.0238 0.0225 0.0223 0.0222 0.022 0.0215 0.0204 0.0212 0.0212 0.0211 0.0209 0.021 0.0222 0.0225 0.0224 0.0213 0.0209 0.0201 0.0203 Commercial Real Estate 0.0251 0.0231 0.0233 0.0236 0.0255 0.0248 0.0238 0.0225 0.0232 0.0229 0.0231 0.0228 0.0227 0.0223 0.0225 0.0219 0.0209 0.0203 0.0205 0.0206 0.0199 0.0189 0.0175 0.0187 0.0191 0.022 Indirect Auto 0.0337 0.0328 0.0332 0.0351 0.0349 0.0338 0.0312 0.0296 0.0288 0.0283 0.0281 0.0286 0.0294 0.0287 0.027 0.0273 0.028 0.0287 0.0282 0.0288 0.0294 0.0294 0.0284 0.0279 0.0275 0.0278 0.0289 0.0308 0.0329 0.0338 0.0338 0.0331 0.0331 0.0334 Home Equity 0.0287 0.028 0.0275 0.0271 0.0277 0.0277 0.0273 0.0272 0.0268 0.027 0.0269 0.0268 0.0268 0.026 0.0262 0.026 0.0265 0.026 0.0254 0.0245 0.0245 0.0219 0.0216 0.0197 0.0209 0.0198 0.0214 0.0232 0.025 0.0254 0.0251 0.0249 0.0241 0.0233 Res R/E 0.0167 0.0164 0.0162 0.0134 0.0136 0.0141 0.0147 0.0148 0.0147 0.0151 0.0156 0.0155 0.0149 0.0147 0.015 0.0144 0.0135 0.0124 0.0121 0.0115 0.0113 0.0109 0.0079 0.0072 0.0067 0.0085 0.0083 0.0083 0.0086 0.0085 0.0086 0.0086 0.0088 0.0091 New Volume - Last 24 Months (1) 3 month rolling average |
| 6/04 7/04 8/04 9/04 10/04 11/04 12/04 1/05 2/05 3/05 4/05 5/05 6/05 7/05 8/05 9/05 10/05 11/05 12/05 1/06 2/06 3/06 4/06 5/06 6/06 7/06 8/06 9/06 10/06 11/06 12/06 1/07 2/07 3/07 C&I 0.0218 0.0218 0.0234 0.0247 0.0237 0.0232 0.0234 0.0238 0.0225 0.0223 0.0222 0.022 0.0215 0.0204 0.0212 0.0212 0.0211 0.0209 0.021 0.0222 0.0225 0.0224 0.0213 0.0209 0.0201 0.0203 Commercial 0.022 0.0213 0.0207 0.0197 0.02 0.02 0.0206 0.0218 0.0223 0.0243 0.0259 0.0283 0.0272 0.0267 0.0248 0.0267 0.0276 0.0282 0.0299 0.0285 0.028 0.0275 0.0281 0.0306 0.0301 0.0311 0.0286 0.0275 0.027 0.0287 0.0302 0.029 0.0283 0.027 Consumer 0.0225 0.0229 0.0241 0.0216 0.0218 0.0221 0.023 0.0245 0.0269 0.0276 0.028 0.0276 0.0266 0.0268 0.0272 0.0294 0.0289 0.0298 0.0313 0.0306 0.0303 0.0305 0.031 0.0307 0.0307 0.0321 0.0327 0.0329 0.034 0.0341 0.0325 0.0298 0.0301 0.0303 Deposit Spread Trends (1) New Volume - Last 24 Months (1) 3 month rolling average |
| Managing Interest Rate Risk Net Interest Income at Risk = Interest Rate Risk + Business Risk Interest Rate Risk The exposure of income (short-term interest rate risk) and economic values (long-term interest rate risk) to changes in market interest rates Business Risk Examples: Loan volumes fall below expectations Deposit pricing competition that shrinks margins These examples cause net interest income volatility and should not be confused as hedgable interest rate risk |
| Managing Interest Rate Risk Philosophy Strong and relatively stable net interest margin Maintain long-term perspective... avoid speculating on the short- term movement in interest rates Policy metrics to manage interest rate risk include: Net interest income at risk simulation model - S-T interest rate risk Economic Value of Equity at risk (EVE) - L-T interest rate risk Operate within established guidelines Net interest income at risk over 12-month horizon limited to (4)% EVE risk limited to (12)% L-T bias to be modestly liability sensitive Natural business flows typically asset sensitive Current positioning to be relatively insensitive to declining interest rates |
| Net Interest Income at Risk Forward Curve +2%, -2%, & -1% Gradual Change in Rates Managing Interest Rate Risk (1) 2% Rate Rise 2% Rate Fall 1% Rate Fall 2Q01 -0.021 3Q01 -0.017 4Q01 -0.012 1Q02 -0.016 2Q02 -0.013 3Q02 -0.005 4Q02 -0.007 -0.002 1Q03 -0.006 -0.001 2Q03 -0.008 -0.001 3Q03 -0.01 -0.003 4Q03 -0.005 -0.003 1Q04 -0.003 -0.005 2Q04 -0.001 -0.003 3Q04 0.005 -0.005 4Q04 0.002 -0.005 1Q05 0.01 -0.018 -0.008 2Q05 0.007 -0.024 -0.008 3Q05 0.007 -0.017 -0.006 4Q05 0.003 -0.013 -0.005 1Q06 0.003 -0.015 -0.005 2Q06 -0.008 0.021 0.02 3Q06 -0.009 0.003 0.001 4Q06 -0.004 0 0 1Q07* 0.006 -0.005 0 All leases treated on direct financing lease basis * 1Q07 data as of 2/28/07 |
| Managing Interest Rate Risk Modeled Exposure Net Interest Income at Risk (S-T measure) (1) bp change (200) bp (100) bp +100 bp +200 bp 2/28/07 (0.5)% 0.0% 0.4% 0.6)% 12/31/06 0.0 0.0 (0.2) (0.4) 9/30/06 0.3 0.1 (0.3) (0.9) 6/30/06 2.1 2.0 (0.5) (0.8) 3/31/06 (1.5) (0.5) 0.2 0.3 Economic Value of Equity at Risk (L-T measure) (2) bp change (200) bp (100) bp +100 bp +200 bp 2/28/07 (0.4)% 0.9% (4.5)% (10.6)% 12/31/06 0.5 1.4 (4.7) (11.3) 9/30/06 0.9 1.5 (4.4) (9.9) 6/30/06 2.9 3.1 (5.4) (11.1) 3/31/06 0.6 1.3 (3.2) (7.4) (1) Estimated impact on annualized net interest income over the next 12-month period assuming a gradual change in rates over the next 12-month period above and beyond any rate change already implied in the current yield curve. Estimated impact on the value of assets and liabilities assuming an immediate and parallel shift in the current yield curve. |
| Non-interest Income Trends NII xcld Op. Lse Inc. 3Q02 138.438 4Q02 122.596 1Q03 134.731 2Q03 148.377 3Q03 155.144 4Q03 141.203 1Q04 138.821 2Q04 139.749 3Q04 126.063 4Q04 128.534 1Q05 122.282 2Q05 119.279 3Q05 132.918 4Q05 124.788 1Q06 142.486 2Q06 150.876 3Q06 89.33 4Q06 135.262 1Q07 142.289 NII xcld. Auto Oper. Lease. Inc. Auto Operating Lease Income ($MM) Oper. Lease Inc. 3Q02 160.164 4Q02 149.259 1Q03 138.193 2Q03 128.574 3Q03 117.624 4Q03 105.3 1Q04 88.818 2Q04 78.379 3Q04 63.828 4Q04 54.406 1Q05 45.768 2Q05 36.891 3Q05 27.822 4Q05 22.534 1Q06 17.048 2Q06 12.143 3Q06 8.58 4Q06 5.344 1Q07 2.888 ($MM) 0% YOY (83)% YOY (1) (1) Includes $57.5 million pre-tax negative impact due to investment securities impairment |
| 3Q04 4Q04 1Q05 2Q05 3Q05 4Q05 1Q06 2Q06 3Q06 4Q06 1Q07 HBAN 43.935 41.747 39.418 41.516 44.8 42.083 41.2 47.225 48.718 48.548 44.8 Deposit Service Charges ($MM) 4Q05 1Q06 2Q06 3Q06 4Q06 1Q07 Debit Card 8.473 8.461 9.533 9.376 9.994 9.7 ATM & Other 3.015 3.048 3.539 3.614 3.789 3.5 Other Service Charges (1) ($MM) (1) Includes check card and ATM fees +9% YOY +15% YOY +14% YOY $11.5 $13.1 Deposit and Other Service Charges $13.0 $13.8 $13.2 |
| 3Q04 4Q04 1Q05 2Q05 3Q05 4Q05 1Q06 2Q06 3Q06 4Q06 1Q07 HBAN 17.064 17.315 18.196 19.113 19.7 20.425 21.3 22.676 22.49 23.5 25.9 Trust Services ($MM) 3Q04 4Q04 1Q05 2Q05 3Q05 4Q05 1Q06 2Q06 3Q06 4Q06 1Q07 HBAN 13.2 12.879 13.026 13.544 13.9 13.101 15.2 14.345 14.697 14.6 16.1 Brokerage/Insurance ($MM) +22% YOY +6% YOY Trust and Brokerage / Insurance Income |
| ($MM) 1Q07 4Q06 3Q06 2Q06 1Q06 Origination & secondary marketing $4.9 $ 4.1 $ 3.1 $ 7.1 $ 4.0 Servicing fees 6.8 6.7 6.1 6.0 5.9 Amortz. capitalized servicing (3.6) (3.8) (4.5) (3.3) (3.5) Other mtg. banking income 3.2 1.8 3.9 2.3 2.2 Sub-total 11.4 8.7 8.6 12.1 8.6 MSR recovery (1) (1.1) (1.9) (10.7) 8.3 9.2 Net trading gains (losses) (2) (0.9) (0.6) 10.7 (6.7) (4.6) Total $ 9.4 $ 6.2 $ 8.5 $ 13.6 $ 13.2 Investor servicing portfolio (3) $ 8.5 B $ 8.3 B $ 8.0 B $ 7.7 B $ 7.6 B Weighted average coupon 5.88% 5.85% 5.83% 5.76% 5.71% Originations $ 0.6 B $ 0.7 B $ 0.7 B $ 0.8 B $ 0.6 B Mortgage servicing rights $134.8 MM $131.1 MM $129.3 MM $136.2 MM $123.3 MM MSR % of investor servicing portfolio 1.59% 1.59% 1.62% 1.76% 1.63% (1) Reflects the adoption of SFAS No. 156 effective 1Q06, which records MSRs at fair value. Prior periods reflect temporary impairment or recovery, based on accounting for MSRs at lower of cost or market. (2) Related to MSR hedging and included in other non-interest income (3) End of period Mortgage Banking Income |
| Auto Loan Sales 2007 1Q07 2Q07 3Q07 4Q07 Amount $141 MM Gain on sale $1.1 MM Total auto exposure (1) 14.8 % 2006 1Q06 2Q06 3Q06 4Q06 Amount $170 MM $218 MM $185 MM $137 MM Gain on sale $0.4 MM $0.5 MM $0.9 MM $1.3 MM Total auto exposure (1) 16.5 % 15.8 % 15.4 % 15.0 % (1) End of period; Auto loans and leases + operating lease assets + securitized auto loans / total loans and leases + operating lease assets + securitized auto loans |
| Non-interest Expense Trends NIE xcld Op Lse Exp 3Q02 193.753 4Q02 208.562 1Q03 203.891 2Q03 194.094 3Q03 207.048 4Q03 231.856 1Q04 214.988 2Q04 219.865 3Q04 219.03 4Q04 233.28 1Q05 221.128 2Q05 220.254 3Q05 211.415 4Q05 213.172 1Q06 225.744 2Q06 243.701 3Q06 236.442 4Q06 263.821 1Q07 240.041 NIE xcld. Auto Op. Lse. Exp. Auto Operating Lease Expense ($MM) Oper. Lease Exp. 3Q02 125.743 4Q02 120.747 1Q03 111.588 2Q03 102.939 3Q03 93.134 4Q03 85.6 1Q04 70.666 2Q04 62.288 3Q04 54.393 4Q04 47.734 1Q05 37.149 2Q05 27.882 3Q05 21.637 4Q05 17.183 1Q06 12.671 2Q06 8.658 3Q06 5.988 4Q06 3.969 1Q07 2.031 ($MM) +6% YOY (84)% YOY |
| 2006 - 2007 Quarterly Operating Leverage & Efficiency Ratio Trends |
| 2005 - 2006 Annual Operating Leverage & Efficiency Ratio Trends |
| ROE, ROA & ICG Trends Return on Avg. Common Equity Internal Capital Generation Rate (1) Return on Tangible Equity 2Q02 3Q02 0.158 0.088 4Q02 0.127 0.057 1Q03 0.172 0.101 2Q03 0.18 0.111 3Q03 0.185 0.102 4Q03 0.166 0.093 1Q04 0.184 0.112 2Q04 0.191 0.12 3Q04 0.154 0.077 4Q04 0.146 0.071 1Q05 0.155 0.079 2Q05 0.163 0.085 3Q05 0.165 0.09 4Q05 0.155 0.079 1Q06 0.155 0.069 0.18 2Q06 0.149 0.068 0.193 3Q06 0.21 0.129 0.271 4Q06 0.113 0.037 0.145 1Q07 0.129 0.044 0.165 (1) ICG = ROE x (1-(dividend declared per share/earnings per share)) (2) Includes net positive impact due to reduction of federal income tax expense, partially offset by investment securities impairment Return on Avg. Common Equity Internal Capital Generation Rate (1) Return on Avg. Assets 2Q02 3Q02 0.158 0.088 0.0135 4Q02 0.127 0.057 0.0102 1Q03 0.172 0.101 0.0136 2Q03 0.18 0.111 0.0138 3Q03 0.185 0.102 0.0138 4Q03 0.166 0.093 0.0122 1Q04 0.184 0.112 0.0136 2Q04 0.191 0.12 0.0141 3Q04 0.154 0.077 0.0118 4Q04 0.146 0.071 0.0113 1Q05 0.155 0.079 0.012 2Q05 0.163 0.085 0.0131 3Q05 0.0132 4Q05 0.0122 1Q06 0.0126 2Q06 0.0125 3Q06 0.0175 4Q06 0.0098 1Q07 0.0111 (2) (2) |

| Investment Securities |
| Investment Securities Investment Securities 4Q05 4290 0.0496 1Q06 4686 0.0523 2Q06 5050 0.0551 3Q06 4945 0.0564 4Q06 4386 0.0613 1Q07 4186 0.0621 Investment Securities 4Q05 0.146 1Q06 0.155 2Q06 0.158 3Q06 0.155 4Q06 0.138 1Q07 0.134 Average Balances % of Average Earning Assets ($MM) Year-over-Year % Change (11)% Duration (yrs) 2.8 3.0 3.3 3.2 3.2 |
| Available for Sale Securities Mix Mortgage Backed Agency Asset Backed Muni's Treasuries Other 12/31/03 0.448 0.234 0.13 0.088 0.061 0.039 12/31/04 0.337 0.228 0.283 0.098 0.005 0.049 12/30/05 0.3695 0.0732 0.3952 0.1204 0.0043 0.0374 6/30/06 0.3811 0.064 0.3861 0.1115 0.0037 0.0536 9/30/06 0.455 0.0718 0.3025 0.1274 0.0042 0.0432 12/31/06 0.429 0.034 0.362 0.136 0.001 0.038 3/31/07 0.476 0.04 0.273 0.156 0.001 0.054 12/31/04 $4.2 B 2.8 Years 31% / 69% (1) 12/31/05 $4.5 B 2.8 Years 33% / 67% (1) 12/31/06 $4.4 B 3.2 Years 14% / 86% (1) (1) Variable rate / Fixed rate; ARMs > 1 year classified as fixed rate 3/31/07 $3.7 B 3.2 Years 10% / 90% (1) |

| Loans and Leases |
| Loans and Leases by Business Segment Average ($B) Annualized Growth (1) 1Q07 v 4Q06 v 1Q07 v 1Q07 4Q06 3Q06 1Q06 Central Ohio $ 3.6 (4) % (1) % 14 % No. Ohio 2.6 3 (3) 6 So. Ohio / Kentucky 2.2 2 (4) 4 E. Ohio 1.3 (9) (21) 47 W. Michigan 2.4 -- 5 3 E. Michigan 1.6 4 6 5 West Virginia 1.1 (3) 11 15 Indiana 1.0 (13) 19 (6) Mortgage & equip. leasing group 3.6 (6) -- 3 Regional Banking 19.4 (2) -- 8 Dealer Sales (2) 4.9 -- (5) (5) Pvt. Fin'l & Cap. Mkts. Group 1.8 2 6 7 Total $26.2 (1)% -- % 5 % (1) Linked quarter percent change annualized (2) Impacted by automobile loans sales |
| Credit Composition - 3/31/07 By Type ($B) Amt Pct Middle-market C&I $ 6.2 24 % Middle-market CRE 4.0 15 Small business C&I/CRE 2.5 9 Total commercial 12.6 48 Auto loans 2.3 9 Auto direct fin. leases 1.6 6 Home equity 4.9 19 Residential real estate 4.4 17 Other consumer 0.4 2 Total consumer 13.6 52 Total loans & leases $ 26.3 100 % Total auto exposure $3.9 15 % By Region or LOB Central OH 0.136 Northern OH 0.1 W. Michigan 0.092 S. Ohio/KY 0.084 Eastern Ohio 0.05 E. Michigan 0.063 W. Virginia 0.042 Indiana 0.037 Mortg & Eq Lse 0.137 Dealer Sales Consumer 0.15 Dealer Sales Commercial 0.036 PF & CM Group 0.07 Treasury / Other 0 |
| 12/31/06 12/31/05 12/31/04 12/31/03 12/31/02 ($B) Amt Pct Amt Pct Amt Pct Amt Pct Amt Pct Middle-market C&I $ 6.0 23% $ 5.1 21% $ 4.7 19% $ 4.4 20% $ 4.8 22% Middle-market CRE 4.0 15 3.5 14 3.5 14 3.2 14 2.9 13 Small business C&I & CRE 2.4 9 2.2 9 2.1 9 1.9 8 1.7 8 Total commercial 12.4 47 10.8 44 10.3 43 9.5 42 9.3 43 Auto loans (1) 2.1 8 2.0 8 1.9 8 3.0 13 3.0 14 Auto direct fin. leases 1.8 7 2.3 9 2.4 10 1.9 9 0.9 4 Home equity 4.9 19 4.8 19 4.6 19 3.7 17 3.2 15 Residential real estate 4.5 17 4.2 17 3.8 16 2.5 11 1.7 8 Other consumer 0.4 2 0.4 1 0.5 2 0.4 2 0.4 2 Total consumer 13.8 53 13.6 55 13.3 55 11.6 52 9.3 42 Total loans & leases 26.2 100 24.5 99 23.6 98 21.1 94 18.6 85 Auto operating leases -- -- 0.2 1 0.6 2 1.3 6 2.2 10 Auto loans securitized (1) -- -- -- -- -- -- 0.0 -- 1.1 5 Total credit exp. $26.2 100% $24.7 100% $24.1 100% $22.4 100% $21.9 100% Total auto exposure (2) $3.9 15% $4.5 18% $ 5.0 21% $ 6.2 28% $7.2 33% (1) Reflects 7/1/03 adoption of FIN 46; $1.0 billion of securitized auto loans added back to balance sheet in 3Q03 (2) As % of total loans and leases+auto operating leases+auto loans securitized Credit Exposure Composition |
| Total Commercial Loans - 3/31/07 $12.6 B By Industry Sector Services 0.2246 Manufacturing 0.1209 F.I.R.E. 0.3619 Retail Trade 0.1167 Construction 0.0581 Wholesale Trade 0.0494 Trans./Comm. 0.0358 Agriculture 0.0111 Energy 0.0169 Public Admin & other 0.0031 |
| < $5 MM 0.5857 $5 MM - < $10 MM 0.1761 $10 MM - <$25 MM 0.1856 $25 MM - < $50 MM 0.0483 $50 MM + 0.0044 < $5 MM 24275 $5+ MM 499 $5 MM - < $10 MM 323 $10 MM - < $25 MM 155 $25 MM - < $50 MM 20 > $50 MM 1 Total 499 Total Commercial Loans - 3/31/07 # of Loans By Size 499 2.0% Loans By $ Size 59% < 1% $12.6 Billion 17% 18% 24,275 98.0% 5% |
| Commercial Loans (1) Middle-market C&I Middle-market CRE Small Business C&I/CRE 1Q04 4.44 3.149 1.974 2Q04 4.555 3.191 2.018 3Q04 4.298 3.427 2.081 4Q04 4.503 3.429 2.136 1Q05 4.71 3.525 2.183 2Q05 4.901 3.583 2.23 3Q05 4.708 3.642 2.251 4Q05 4.95 3.6 2.23 1Q06 5.174 3.921 2.035 2Q06 5.512 4.093 2.351 3Q06 5.651 3.974 2.413 4Q06 5.882 4.01 2.421 1Q07 6.07 3.923 2.466 ($B) (1) Quarterly averages (2) Annualized 17% - --% 21% Year-over-Year % Change 13% (9)% 7% Linked-quarter % Change (2) |
| Average ($B) Annualized Growth (2) 1Q07 v 4Q06 v 1Q07 v 1Q07 4Q06 3Q06 1Q06 Central Ohio $ 2.4 (2) % 5 % 20 % No. Ohio 1.7 9 1 12 So. Ohio / Kentucky 1.4 8 (1) 5 E. Ohio 0.7 (9) (12) 41 W. Michigan 1.4 6 11 7 E. Michigan 1.2 9 10 7 West Virginia 0.8 (2) 15 20 Indiana 0.6 (15) 39 (6) Mortgage & equip. leasing group 0.6 32 48 29 Regional Banking 10.7 4 8 13 Dealer Sales 0.9 15 22 2 Pvt. Fin'l & Cap. Mkts. Group 0.8 7 7 8 Total $12.5 5 % 9 % 12 % (1) Includes middle market C&I, middle market CRE and small business C&I and CRE (2) Linked quarter percent change annualized Total Commercial Loans by Business Segment (1) |
| Middle-market Loans 3Q04 4Q04 1Q05 2Q05 3Q05 4Q05 1Q06 2Q06 3Q06 4Q06 1Q07 HBAN 3427 3429 3525 3583 3642 3598 3921 4093 3974 4010 3923 Middle-market CRE (Average $MM) 3Q04 4Q04 1Q05 2Q05 3Q05 4Q05 1Q06 2Q06 3Q06 4Q06 1Q07 HBAN 4298 4503 4710 4901 4708 4946 5174 5512 5651 5882 6070 Middle-market C&I (Average $MM) +17% YOY - --% YOY |
| Middle-market C & I Lending Current portfolio (1) - $6.1 Billion Highly competitive, but growth opportunities exist in the marketplace. Huntington differentiates itself by: Seeking measured growth - we will not sacrifice credit quality and profitability for rapid short-term growth. Understanding the markets in which we operate Identifying high potential relationships, and then leveraging our value proposition. (1) 1Q07 average balances; Middle-market C&I, excludes small business |
| Outstandings (2) ($MM) 1Q07 4Q06 3Q06 2Q06 1Q06 Loans to suppliers $184 $180 $209 $207 $216 Dealer floorplan 661 631 568 623 648 Dealer non-floorplan 229 250 246 233 241 Total $1,074 $1,061 $1,023 $1,064 $1,105 NPLs Amount $5.1 $2.1 $4.7 $14.7 $16.8 Percent 0.48 % 0.20 % 0.46 % 1.38 % 1.52 % Net charge-offs Amount $0.1 $-- $0.4 $0.1 $0.0 Percent (3) .05 % -- % 0.14 % 0.02 % NA (1) Period end (2) Companies with >25% of their revenue from the auto industry (3) Annualized C&I Loans to Auto Industry (1) |
| Shared National Credits Reduced Shared National Credit Exposure 40% reduction in outstandings from peak Commitments Outstandings 1Q01 2.86 1.17 2Q01 3.18 1.467 3Q01 3.22 1.462 4Q01 2.99 1.093 1Q02 2.6 0.993 2Q02 2.58 0.998 3Q02 2.65 1.038 4Q02 2.66 1.009 1Q03 2.49 1.01 2Q03 2.37 0.838 3Q03 2.299 0.807 4Q03 2.175 0.716 1Q04 2.106 0.71 2Q04 2.104 0.725 3Q04 2.077 0.667 4Q04 2 0.664 1Q05 2.032 0.662 2Q05 1.982 0.677 3Q05 1.94 0.7 4Q05 1.978 0.783 1Q06 2 0.8 2Q06 2 0.8 3Q06 2.017 0.89 4Q06 1.98 0.78 1Q07 2.001 0.8 |
| Commercial Real Estate Loans - 3/31/07 Construction Mini-Perm Permanent Lines fo Credit 0.221 0.286 0.293 0.199 Central Ohio Northern Ohio S. Ohio/KY E. Ohio W. MI E. MI WV ID FL 0.22 0.179 0.153 0.064 0.109 0.16 0.041 0.069 0.004 S. Ohio/KY 15% Central Ohio 22% W. Michigan 11% E. Michigan 16% W. Virginia 4% Indiana 7% N. Ohio 18% Permanent 29% Mini-perm 29% Construction 22% Florida *% * = less than 1% (1) Includes $0.6 B small business CRE Lines of Credit 20% E. Ohio 6% $4.5 Billion (1) |
| Retail Single Family Industrial Office Multi Family Lines of Credit Raw Land Land Development Health Care Recreational Condo Construction Hotel Other 0.191 0.161 0.104 0.127 0.096 0.131 0.004 0.016 0.019 0.031 0.046 0.036 0.039 Commercial Real Estate Loans - 3/31/07 Retail Properties Industrial & Warehouse Office Multi-family Hotel Single-family Development Health Care Recreational Raw Land (1) Includes $0.6 B small business CRE Unsecured Lines to Real Estate Companies Other Condominium Construction $4.5 Billion (1) Raw Land <1% Land Development |
| Commercial Real Estate Lending Current portfolio (1) - $2.8 Billion Currently viewed by many in the industry as the next credit 'pressure point' Some residential developers, particularly small to mid-sized entities will be at risk given the current market dynamics Huntington differentiates itself by: CRE lending groups in the Metro Markets (80% of A&D lending is located in metro markets) Focusing on top tier developers in each market we 'know our customers' via our CRE dedicated teams Underwriting construction projects to secondary market standards Granular portfolio (1) 1Q07 average balances; Middle-market CRE, excludes small business |
| Construction Real Estate Lending Current portfolio (1) - $1.2 Billion A Good Business Short-term portfolio - 2-4 year average life More favorable risk-reward than permanent commercial real estate loans Recurring fee income given revolving nature of the portfolio Originated and managed by dedicated, experienced teams Approval through separate, specialized credit officers and dedicated process Conservative Underwriting Standards Secured, recourse, guaranteed debt provides three repayment sources LTV, debt service coverage, property types, and locations all underwritten to secondary market standards to enhance loan repayment Projects concentrated in major metro markets to enhance repayment through secondary loan market Customers within Huntington's footprint Enforced standard pre-leasing requirements for office, retail and industrial property types to reduce market risk exposure Primary customer is 1st and 2nd tier developers (1) 1Q07 average balances; Middle-market, excludes small business |
| Consumer Loans & Leases - 3/31/07 By Type ($B) Amt Pct Auto loans $2.3 17 % Auto direct fin. leases 1.6 12 Home equity * 4.9 36 Residential real estate 4.4 32 Other consumer 0.4 3 Total consumer $13.6 100 Auto operating leases -- <1 Total $13.6 100 % * Home equity lines $3.1 Home equity loans 1.8 Auto loans 0.16 Auto direct. fin. leases 0.12 Home equity 0.36 Residential real estate 0.33 Other consumer 0.03 Auto oper. lease assets 0.004 * = <1% |
| Average ($B) Annualized Growth (2) 1Q07 v 4Q06 v 1Q07 v 1Q07 4Q06 3Q06 1Q06 Central Ohio $ 1.2 (7) % (11) % 4 % No. Ohio 0.9 (8) (8) (5) So. Ohio / Kentucky 0.8 (8) (8) 3 E. Ohio 0.6 (9) (10) 55 W. Michigan 1.0 (8) (2) (2) E. Michigan 0.5 (7) (3) (1) West Virginia 0.3 (3) 3 5 Indiana 0.3 (8) (10) (6) Mortgage & equip. leasing group 3.0 (13) (8) (2) Regional Banking 8.7 (9) (9) 2 Dealer Sales (3) 4.0 (3) (9) (6) Pvt. Fin'l & Cap. Mkts. Group 1.0 (3) 5 7 Total $13.7 (7) % (8) % 0 % (1) Includes residential mortgages, home equity loans/lines, auto loans/leases, and other consumer (2) Linked quarter percent change annualized (3) Impacted by automobile loans sales Total Consumer Loans by Business Segment (1) |
| Auto Loans & Leases (1) Auto Direct Finance Leases Auto Operating Leases 3Q02 0.461 2.597 4Q02 0.759 2.328 1Q03 1.006 2.076 2Q03 1.306 1.802 3Q03 1.59 1.565 4Q03 1.802 1.355 1Q04 1.99 1.17 2Q04 2.139 0.97 3Q04 2.25 0.79 4Q04 2.388 0.64 1Q05 2.461 0.51 2Q05 2.468 0.39 3Q05 2.424 0.29 4Q05 2.34 0.22 1Q06 2.221 0.16 2Q06 2.1 0.11 3Q06 1.976 0.07 4Q06 1.838 0.04 1Q07 1.698 0.023 Auto loans Securitized loans 2Q02 3Q02 2.764 1.15 4Q02 2.94 1.12 1Q03 3.079 1.09 2Q03 2.83 1.08 3Q03 3.594 0.05 4Q03 3.529 0.04 1Q04 3.041 0.03 2Q04 2.337 3Q04 1.857 4Q04 1.913 1Q05 2.008 2Q05 2.069 3Q05 2.078 4Q05 2.02 1Q06 1.99 2Q06 2.04 3Q06 2.079 4Q06 2.111 1Q07 2.215 ($B) ($B) (1) Quarterly averages Auto Loans Auto Leases $1.99 $2.21 $1.72 11% YOY (24)% YOY $2.38 $2.21 $2.04 $2.08 $2.04 $2.11 $1.88 |
| Indirect Auto Lending Current portfolio (1) - $3.9 Billion Highly competitive with relatively low barriers to entry Huntington differentiates itself by: Consistency of strategy and commitment to service Commitment to service quality for the full dealer relationship Fully automated origination and booking system Robust data modeling capabilities (1) 1Q07 average balances; Includes retail automobile loans and leases |
| Indirect Auto Loan Production ($MM) 3Q04 4Q04 1Q05 2Q05 3Q05 4Q05 1Q06 2Q06 3Q06 4Q06 1Q07 Auto Loans Production $361 $306 $367 $356 $469 $301 $416 $467 $458 $379 $447 % new vehicles 47% 44% 48% 57% 65% 53% 47% 49% 50% 48% 47% Avg. LTV 94% 92% 93% 92% 88% 92% 94% 96% 96% 96% 97% Auto Direct Finance Leases Production $268 $270 $191 $158 $119 $95 $74 $109 $92 $70 $68 % new vehicles 99% 99% 99% 98% 99% 99% 97% 97% 96% 97% 97% Avg. residual 42% 44% 43% 42% 40% 43% 42% 41% 41% 42% 42% Avg. LTV 101% 101% 103% 103% 103% 103% 103% 101% 101% 102% 101% |
| Non-auto Consumer Loans (1) Home Equity Loans/Lines Residential Mortgages Other 1Q04 3.833 2.674 0.402 2Q04 4.145 2.986 0.397 3Q04 4.408 3.484 0.39 4Q04 4.585 3.695 0.383 1Q05 4.676 3.919 0.374 2Q05 4.75 4.08 0.377 3Q05 4.801 4.157 0.387 4Q05 4.781 4.17 0.393 1Q06 4.833 4.31 0.447 2Q06 5.029 4.63 0.448 3Q06 5.041 4.748 0.43 4Q06 4.973 4.635 0.43 1Q07 4.913 4.496 0.422 ($B) (1) Quarterly averages (2) Annualized 2% 4% (6)% Year-over-Year % Change (5)% (12)% (7)% Linked-quarter % Change (2) |
| Residential Real Estate Loans 1Q03 2Q03 3Q03 4Q03 1Q04 2Q04 3Q04 4Q04 1Q05 2Q05 3Q05 4Q05 1Q06 2Q06 3Q06 4Q06 1Q07 HBAN 3194 3313 3448 3640 3833 4145 4408 4585 4676 4750 4801 4781 4833 5029 5041 4973 4913 Home Equity Loans/Lines (Average $MM) (5) Quarterly Growth Rate - Annualized % 1Q03 2Q03 3Q03 4Q03 1Q04 2Q04 3Q04 4Q04 1Q05 2Q05 3Q05 4Q05 1Q06 2Q06 3Q06 4Q06 1Q07 HBAN 1819 1870 2075 2501 2674 2986 3484 3695 3919 4080 4157 4165 4306 4629 4748 4635 4496 Residential Mortgages (Average $MM) (12) Quarterly Growth Rate - Annualized % 4 14 +2% YOY +4% YOY 16 30 1 10 (5) (10) |
| Home Equity Production ($MM) 3Q04 4Q04 1Q05 2Q05 3Q05 4Q05 1Q06 2Q06 3Q06 4Q06 1Q07 Loans (1) Production $81 $74 $88 $148 $125 $140 $154 $186 $164 $114 $211 Avg. LTV 66% 63% 61% 60% 60% 58% 59% 64% 65% 68% 66% Lines (2) Production $534 $472 $406 $467 $422 $337 $329 $435 $321 $254 $351 Avg. LTV 80% 81% 80% 79% 79% 78% 75% 75% 75% 76% 75% (1) Primarily fixed rate (2) Primarily variable rate |
| Retail Broker 3/05 3781 1033 4/05 3754 1119 5/05 3770 1116 6/05 3803 1114 7/05 3814 1108 8/05 3820 1099 9/05 3825 1092 10/05 3821 1082 11/05 3816 1067 12/05 3824 1046 1/06 3828 1033 2/06 3831 1016 3/06 3828 994 4/06 4241 981 5/06 4245 962 6/06 4255 949 7/06 4264 934 8/06 4257 918 9/06 4235 920 10/06 4215 900 11/06 4195 882 12/06 4177 867 1/07 4166 854 2/07 4183 832 3/07 4215 807 ($MM) (1) Period end (2) Includes Unizan Broker Retail (2) Home Equity Loans & Lines by Channel (1) |
| Residential Lending Environment Housing appreciation, low interest rates, and new product structures fueled significant lending opportunities through 2004 OFHEO national annual appreciation rates of 13%+ and in excess of 25% on the coasts Significantly more modest growth in Huntington's core markets of approximately 3.5% through 2005 The impact to credit of the initial rate increases was partially masked by the new structures Significant speculative purchase activity on the coasts and certain other markets |
| Residential Lending Environment The last 18 months have been substantially more difficult National appreciation rate of 10% as of 2Q06 3.5% for Huntington markets Home equity line run-off as a result of rising rates Movement to fixed rate home equity loans General slowdown in the housing market with home inventory at record levels New home sales specifically impacting the builders Increasing delinquencies across the industry Bankruptcies and foreclosures have shown significant increases, particularly in the Midwest markets, though Huntington's performance is significantly better Ohio foreclosure rate... FDIC = 3.5% / HBAN = <1% |
| Other Consumer Current portfolio (1) - $0.4 billion 96% collateralized autos, untitled vehicles, small boats, mobile homes and other miscellaneous Primarily for existing customers Performed within expectations over the past year though varies by collateral type (1) 1Q07 average balances |

| Deposits and Other Funding |
| Deposit Trends Average ($B) Annualized Growth (1) 1Q07 v 4Q06 v 1Q07 v 1Q07 4Q06 3Q06 1Q06 Demand - non-interest bearing $ 3.5 (6) % 8 % 3 % Demand - interest bearing 2.3 23 2 19 Money market deposits 5.5 (4) (10) (7) Savings & other domestic 2.8 (3) (10) (9) Core CDs 5.5 6 3 24 Total core deposits 19.7 2 (1) 6 Other deposits (2) 4.8 (26) 13 6 Total deposits $24.5 (4) % 2 % 6 % (1) Linked quarter percent change annualized (2) Includes other domestic time >$100K, brokered deposits and negotiated CDs, and deposits in foreign offices |
| Total Deposits Demand, Savings & Other Core CDs Non-core 1Q03 12.008 3.415 1.986 2Q03 12.623 3.245 2.028 3Q03 13.24 2.97 2.351 4Q03 13.052 2.84 2.853 1Q04 13.08 2.664 2.979 2Q04 13.83 2.669 2.805 3Q04 14.096 2.691 2.84 4Q04 14.454 2.733 3.124 1Q05 14.556 2.809 4.098 2Q05 14.258 3.067 4.584 3Q05 14.04 3.557 4.619 4Q05 13.92 3.891 4.627 1Q06 14.09 4.389 4.546 2Q06 14.48 5.083 4.823 3Q06 14.29 5.334 4.969 4Q06 14.196 5.38 5.132 1Q07 14.195 5.455 4.801 ($B) (1) Quarterly averages Year-over-Year % Change 1% 24% 6% |
| Average ($B) Annualized Growth (1) 1Q07 v 4Q06 v 1Q07 v 1Q07 4Q06 3Q06 1Q06 Central Ohio $ 4.8 2 % 2 % 5 % No. Ohio 3.6 4 (2) 1 So. Ohio / Kentucky 2.3 10 7 11 E. Ohio 1.7 (11) (4) 70 W. Michigan 2.8 (4) (11) -- E. Michigan 2.4 10 10 8 West Virginia 1.5 3 6 4 Indiana 0.9 (22) 47 17 Mortgage & equip. leasing group 0.2 (43) 28 8 Regional Banking 20.2 1 3 8 Dealer Sales 0.1 (36) (20) (12) Pvt. Fin'l & Cap. Mkts. Group 1.1 (9) 9 -- Treasury / Other 3.0 (32) (5) (4) Total $24.5 (4) % 2 % 6 % (1) Linked quarter percent change annualized Deposits by Business Segment |
| Core Deposits 3Q04 4Q04 1Q05 2Q05 3Q05 4Q05 1Q06 2Q06 3Q06 4Q06 1Q07 HBAN 3276 3401 3314 3352 3406 3444 3436 3594 3509 3580 3530 Non-interest Bearing 3Q04 4Q04 1Q05 2Q05 3Q05 4Q05 1Q06 2Q06 3Q06 4Q06 1Q07 HBAN 13511 13786 14051 13974 14191 14371 15046 15967 16115 15996 16120 Other Core Deposits (Average $MM) (Average $MM) +3% YOY +7% YOY |
| Average ($B) Annualized Growth (1) 1Q07 v 4Q06 v 1Q07 v 1Q07 4Q06 3Q06 1Q06 Central Ohio $ 4.6 3 % 2 % 4 % No. Ohio 3.4 5 (4) -- So. Ohio / Kentucky 2.2 10 5 11 E. Ohio 1.6 (8) (1) 71 W. Michigan 2.4 (6) (11) -- E. Michigan 1.9 4 -- -- West Virginia 1.5 4 2 3 Indiana 0.7 22 (7) 8 Mortgage & equip. leasing group 0.2 (41) 26 9 Regional Banking 18.5 2 (1) 7 Dealer Sales 0.0 (33) (18) (13) Pvt. Fin'l & Cap. Mkts. Group 1.1 (11) 3 (3) Total $19.6 2 % (1) % 6 % (1) Linked quarter percent change annualized Core Deposits by Business Segment |

| Average ($B) Annualized Growth (1) 1Q07 v 4Q06 v 1Q07 v 1Q07 4Q06 3Q06 1Q06 Central Ohio $ 1.9 4 % 6 % 8 % No. Ohio 1.2 7 (9) -- So. Ohio / Kentucky 0.7 26 28 22 E. Ohio 0.5 (35) (10) nm W. Michigan 0.9 (18) (21) 3 E. Michigan 0.5 13 10 9 West Virginia 0.3 2 15 8 Indiana 0.2 63 (6) 6 Mortgage & equip. leasing group 0.2 (41) 26 9 Regional Banking 6.5 2 1 12 Dealer Sales 0.0 (34) (19) (13) Pvt. Fin'l & Cap. Mkts. Group 0.4 (30) 6 6 Total $6.9 (1) % 1 % 11 % (1) Linked quarter percent change annualized Commercial Core Deposits by Business Segment |
| Average ($B) Annualized Growth (1) 1Q07 v 4Q06 v 1Q07 v 1Q07 4Q06 3Q06 1Q06 Central Ohio $ 2.8 2 % (2) % 2 % No. Ohio 2.3 4 (1) -- So. Ohio / Kentucky 1.5 2 (5) 6 E. Ohio 1.1 4 3 59 W. Michigan 1.5 1 (5) (1) E. Michigan 1.3 1 (4) (3) West Virginia 1.2 4 (2) 2 Indiana 0.5 5 (7) -- Mortgage & equip. leasing group -- 27 5 (88) Regional Banking 12.1 3 (2) 5 Dealer Sales -- (14) nm 32 Pvt. Fin'l & Cap. Mkts. Group 0.6 3 1 (9) Total $12.7 3 % (2) % 4 % (1) Linked quarter percent change annualized Consumer Core Deposits by Business Segment |
| Other Funding - 3/31/07 Non-core Deposits - $4.6 B 0.42 S-T Borrowings - 1.6 B 0.15 FHLB Advances - $1.2 B 0.11 Other L-T Debt - $2.2 B 0.2 Subordinated Notes - $1.3 B 0.12 $10.9 Billion |

| Capital |
| Capital ($B) 1Q07 4Q06 3Q06 2Q06 1Q06 Total risk-weighted assets $31.5e $31.2 $31.3 $31.6 $31.3 Tier 1 leverage 8.24%e 8.00% 7.99% 7.62% 8.53% Tier 1 risk-based capital 8.97e 8.93 8.95 8.45 8.94 Total risk-based capital 12.80e 12.79 12.81 12.29 12.91 Tangible equity/assets 7.06 6.87 7.13 6.46 6.97 Tangible equity/risk wghtd assets 7.69e 7.65 7.97 7.29 7.80 Double leverage (2) 93 92 96 95 93 (1) Period end (2) (Parent company investments in subsidiaries + goodwill) / equity e = estimated as of 3/31/07 |
| Capital Trends Shareholders' Equity (1) Key Equity Ratios (2) (1) Quarterly averages (2) End of period e = estimated as of 3/31/07 Tier I Regulatory Total Capital Regulatory Tang. Equity / Assets Tang. Equity / Risk Weighted Assets 3Q02 0.0881 0.1178 0.0764 4Q02 0.0834 0.1125 0.0722 1Q03 0.0816 0.1104 0.07 2Q03 0.0832 0.1111 0.0706 0.0723 3Q03 0.084 0.1119 0.0677 0.0724 4Q03 0.0853 0.1195 0.0679 0.0731 1Q04 0.0874 0.1213 0.0697 0.076 2Q04 0.0898 0.1256 0.0695 0.0764 3Q04 0.091 0.1253 0.0711 0.0783 4Q04 0.0908 0.1248 0.0718 0.0786 1Q05 0.0904 0.1233 0.0742 0.0784 2Q05 0.0918 0.1239 0.0736 0.0805 3Q05 0.0942 0.127 0.0739 0.0819 4Q05 0.0913 0.1242 0.0719 0.0791 1Q06 0.0894 0.1291 0.0697 0.078 2Q06 0.0845 0.1229 0.0646 0.0729 3Q06 0.0895 0.1281 0.0713 0.0797 4Q06 0.0893 0.1279 0.0687 0.0765 1Q07 0.0897 0.128 0.0706 0.0769 Shareholders' Equity 3Q02 2.214 4Q02 2.163 1Q03 2.166 2Q03 2.151 3Q03 2.239 4Q03 2.228 1Q04 2.278 2Q04 2.323 3Q04 2.412 4Q04 2.481 1Q05 2.527 2Q05 2.619 3Q05 2.611 4Q05 2.57 1Q06 2.73 2Q06 2.995 3Q06 2.97 4Q06 3.084 1Q07 3.014 ($B) Year-over-Year % Change 10% (Average $B) e e e |
| Regulatory Capital Trends (1) LLR/NPL ratio 2Q02 3Q02 4Q02 1Q03 2Q03 3Q03 4Q03 1Q04 2Q04 3Q04 4Q04 1Q05 2Q05 3Q05 4Q05 1Q06 2Q06 3Q06 4Q06 1Q07 Total risk-based 0.1246 0.1178 0.1122 0.11 0.1111 0.1119 0.1195 0.1238 0.1256 0.1253 0.1248 0.1233 0.1239 0.127 0.1242 0.1291 0.1229 0.1281 0.1279 0.128 Tier 1 risk-based 0.0942 0.0882 0.0832 0.0813 0.0832 0.084 0.0853 0.0874 0.0898 0.091 0.0908 0.0904 0.0918 0.0942 0.0913 0.0894 0.0845 0.0895 0.0893 0.0897 End of period e = estimated as of 3/31/07 Huntington Bancshares Incorporated e e |
| Share Repurchases Authorization Repurchased Cumulative Date Shares Quarter Shares Value Shares Value 2/2002 22.0 MM 19.4 MM $374 MM 19.4 MM $374 MM 1/2003 8.0 4.1 77 23.5 451 4/2004 7.5 4.4 109 27.9 560 1Q05 -- 2Q05 1.8 3Q05 2.6 10/2005 15.0 10.0 236 37.9 796 4Q05 5.2 1Q06 4.8 4/2006 15.0 11.2 265 49.1 1,061 2Q06 8.1 Includes 6.0 MM accelerated shares repurchased on 5/24/06 3Q06 -- 4Q06 3.1 1Q07 -- |
| Current Ratings Senior Subordinated Com'l Paper / Notes Notes Short-term Outlook Huntington Bancshares Moody's 2/8/05 A3 Baa1 P-2 Stable S&P 4/6/05 BBB+ BBB A-2 Stable Fitch 10/3/05 A A- F1 Stable The Huntington National Bank Moody's 2/8/05 A2 A3 P-1 Stable S&P 4/6/05 A- BBB+ A-2 Stable Fitch 10/3/05 A A- F1 Stable |

| Credit Quality |
| Non-performing Assets by Sector ($MM) 3/31/07 3/31/06 $ # $ # Commercial NPL Size >$5 $ -- 0 $ 8.1 1 $2-<$5 23.8 9 10.6 3 <$2 81.6 73.5 Total NPL $105.4 $92.5 OREO 3.1 1.9 Residential RE and Home Equity NPL 51.9 43.2 OREO 46.3 17.5 Total NPAs $206.7 $154.9 Res. RE + Res. OREO 0.4 Commercial OREO 0.0075 Services 0.16 Manufacturing 0.073 F.I.R.E. 0.16 Home Equity Retail 0.049 Home Equity 0.076 Transportation 0.015 Construction 0.028 Wholesale Trade 0.012 Energy 0.002 Agriculture/Other 0.005 Other 0.003 $206.7 MM @ 3/31/07 |
| Non-performing Asset Flow Analysis Period End $(MM) 1Q07 4Q06 3Q06 2Q06 1Q06 NPA beginning of period $193.6 $171.2 $171.1 $154.9 $117.2 New 51.6 60.3 55.5 52.5 53.8 Acquired -- -- -- -- 33.8 Return to accruing status (6.2) (5.7) (11.9) (12.1) (14.3) Loan and lease losses (9.1) (11.9) (14.1) (6.8) (13.3) Payments (18.1) (16.7) (16.7) (12.9) (13.2) Sales (5.2) (3.6) (12.6) (4.5) (9.1) NPA end of period $206.7 $193.6 $171.2 $171.1 $154.9 |
| Middle market C&I 20 - 30 bp Middle market CRE 15 - 25 bp Small business C&I / CRE 50 - 60 bp Auto loans 65 - 75 bp Auto direct finance leases 50 - 60 bp Home equity loans/lines 40 - 50 bp Residential loans 15 +/- bp Total portfolio (1) 35 - 45 bp Long-term Net Charge-off Targets (1) Established 4Q04 |
| Net Charge-offs ($MM) 1Q07 4Q06 3Q06 2Q06 1Q06 Middle-market C&I $ -- $(1.8) $1.7 $(0.5) $6.9 Middle-market CRE 0.4 4.1 0.6 1.4 -- Small business C&I & CRE 2.1 4.5 4.5 2.5 3.7 Total commercial 2.5 6.8 6.8 3.4 10.6 Auto loans 2.9 2.4 1.8 1.2 3.0 Auto leases 2.2 2.9 2.3 1.8 3.5 Home equity 6.0 5.8 6.7 4.8 4.5 Residential RE 1.9 2.2 0.9 0.7 0.7 Other direct 2.7 2.8 2.7 2.1 1.9 Total consumer 15.6 16.2 14.4 10.5 13.7 Total $18.1 $23.0 $21.2 $ 14.0 $ 24.2 |
| 90+ Days Delinquencies Total (C&I + Com'l RE + Consumer) Middle-market C&I Middle-market CRE Small business C&I & CRE 2Q01 3Q01 4Q01 1Q02 2Q02 3Q02 4Q02 1Q03 2Q03 3Q03 4Q03 1Q04 2Q04 3Q04 4Q04 1Q05 2Q05 0.0009 0.001 0.0007 0.0009 3Q05 0.0005 0.001 0 0.0003 4Q05 0.0003 0.0007 0 0.0002 1Q06 0.0001 0.0002 0 0 2Q06 0.0004 0 0.0012 0.0003 3Q06 0.0003 4Q06 0.0003 1Q07 0.0008 (1) Delinquent but accruing as a % of related outstandings at EOP Consumer Commercial 1Q02 2Q02 3Q02 4Q02 1Q03 2Q03 3Q03 4Q03 1Q04 2Q04 3Q04 4Q04 1Q05 2Q05 0.0032 3Q05 0.0033 4Q05 0.0038 1Q06 0.0036 2Q06 0.003 3Q06 0.0041 4Q06 0.004 1Q07 0.0044 |
| Allowances for Credit Losses Methodology Methodology Allowance for loan and lease loses (ALLL) has two components: Transaction reserve which includes: An estimate of loss based on characteristics of each commercial and consumer loan, lease, or loan commitment, and An estimate of loss based on a review of each impaired loan >$500,000 Economic reserve - quantitatively reflects expected changes in credit losses due to changes in economic environment and is determined based on a variety of economic factors and indices correlated to the historic performance of the loan portfolio Current economic factors and indices Real Consumer Spending Consumer Confidence ISM Manufacturing Index Non-Agriculture Job Creation in our core states (OH, MI, WV and IN) Allowance for unfunded loan commitments and letters of credit (AULC) Reported as a liability Determined using the same ALLL transactions and economic reserve methodology AULC is reduced and the ALLL is are funded Allowances for credit losses (ACL) Sum of ALLL and AULC with both available to absorb credit losses |
| Allowance for Loan & Lease Losses (ALLL) Reconciliation of Change in ALLL ($MM) 1Q07 4Q06 3Q06 ALLL beginning of period $272.1 $280.2 $287.5 Transaction reserve increase (decrease) Commercial loans 8.2 (3.0) (5.6) Consumer loans 1.2 (0.7) (0.7) Total transaction reserve 9.4 (3.7) (6.3) Economic reserve increase (decrease) 1.5 (4.4) (1.1) ALLL ending of period $283.0 $272.1 $280.2 |
| Allowance for Credit Losses (ACL) Reconciliation of Change in Provision for Credit Losses ($MM) 1Q07 4Q06 Change B(W) Gross charge-offs $27.8 $32.8 $ 5.0 Recoveries (9.7) (9.9) (0.2) Net charge-offs 18.1 23.0 4.9 Transaction reserve increase (decrease) 9.4 (3.7) (-.-) Economic reserve increase (decrease) 1.5 (4.4) -.- Loan and lease loss provision 29.0 14.9 (14.1) AULC provision 0.4 0.9 0.5 Total provision for credit losses $29.4 $15.7 $(13.7) |
| Estimated Impact of Unizan Merger |
| Estimated Impact of Unizan Merger 1Q07 vs. 1Q06 |
| Estimated Impact of Unizan Merger 1Q07 vs. 1Q06 |
| Estimated Impact of Unizan Merger 1Q07 vs. 4Q06 |
| Estimated Impact of Unizan Merger 1Q07 vs. 4Q06 |

| Lines of Business |
| Regional Banking 0.839 Dealer sales 0.002 PFG 0.048 Treasury / Other 0.111 Regional Banking $20.6 B 84% Dealer Sales $0.1 B <1% PF & CMG $1.2 B 5% Total Deposits $24.6 B Regional Banking 0.742 Dealer sales 0.187 PFG 0.071 Treasuy / Other 0 Total Credit Exposure $26.3 B Regional Banking $19.5 B 74% Dealer Sales $4.9 B 19% PF & CMG $1.9 B 7% Treasury / Other $2.7 B 11% Line of Business Assets & Deposits - 3/31/07 |
| Line of Business Earnings Contribution - 1Q07 ($MM) 1Q07 Pct 1Q06 Amt Chg Amt Regional Banking $ 83.0 (2)% $84.8 Dealer Sales 12.5 (14) 14.5 Private Financial and Capital Markets Group 11.8 (37) 18.6 Treasury/Other (11.5) 14 (13.4) Total $95.7 (8)% $104.5 Regional Banking 0.87 Dealer Sales 0.13 Pvt Finl & Cap Mkts 0.12 Treasury/Other -0.12 |

| Regional Banking |
| Regional Banking - Operating Income Consumer Banking 41 Commercial Banking 36 Business Banking 21 Mortgage 2 1Q07 C. Ohio 30 N. Ohio 18 S. Ohio 11 E. Ohio 6 W. Virginia 8 Indiana 5 E. Michigan 9 W. Michigan 13 Commercial Banking 36% Consumer Banking 41% Mortgage 2% Business Banking 21% C. Ohio 30% N. Ohio 18% S. Ohio 11% E. Ohio 6% W. Virginia 8% Indiana 5% E. Michigan 9% W. Michigan 13% |
| Regional Banking Organization Tom Hoaglin Chairman, President & CEO Regional Banking Group President J. Dunlap Regional Banking Group President M. Navarro Regional Banking Group President M. Prescott Central Ohio J. Kunk Business Banking Segment J. Rosen West Michigan J. Dunlap East Michigan R. Smith * Northern Ohio J. Kelsheimer S. Ohio/Kentucky M. Prescott West Virginia M. Comer Indiana C. Keitch Eastern Ohio J. Nicholson Consumer Segment J. Baron Corporate Marketing K. Ravenda Commercial Segment M. Marberger Retail Sales & Service J. Greenwood Revenue Enhancement T. O'Hara Acquisition Integration M. Baughman Distribution L. Murray ..com & Retail/Comm'l Tech. T. Scholten Customer Service Center N. Raines Training & Communications D. Weiss Operations L. Ladd * Replaces B. Nyberg who retires 3/07 Equipment Finance / Leasenet R. Allanson |
| Experience - Yrs Region Appointed Banking HBAN Jim Kunk (1) Central Ohio 1Q94 25 25 Jim Dunlap (2) West Michigan 3Q01 27 27 Rebecca Smith East Michigan 1Q07 30 <1 Jerry Kelsheimer Northern Ohio 1Q05 18 10 Michael Prescott (2) Southern Ohio / KY 2Q01 19 11 Cindy Keitch Indiana 3Q03 32 12 Michael Comer West Virginia 1Q04 25 3 Jim Nicholson Eastern Ohio 1Q06 17 1 (1) Reports to Mary Navarro (2) Regional Banking Group President; reports to Tom Hoaglin Regional Banking Presidents |
| Consumer Banking - What's Working "Simply the Best" service culture is working De novo office results are very good... performing better than expected on operating income New technology enhancement and expansion is improving sales & service execution Households are continuing to grow and product penetration is improving People continue to be focused and accountable for results Incentive plans aligned with financial results Training aligned with Retail Partners Commitment to coaching has improved sales execution Q1 year-over-year sales have improved 17.1% in DDA and 18.3% in Consumer Loans Improvement in online banking penetration Launched on-line account opening process late in 4Q06 Expenses have been managed lower |
| Retail Banking Service Score Improvement 2003 2004 2005 Banking offices Teller 83.8% 84.9% 86.0% Platform 89.7 89.9 91.1 Mortgage 83.3 86.3 88.0 Telephone banking 77.9 74.8 81.8 |
| Recent Service Ranking Small Business Banking Winner of three Greenwich excellence awards National award - Overall Customer Satisfaction National award - Branch Service Performance Midwest Regional award - Overall Customer Satisfaction Ranked above major competitors by Greenwich (1) in overall customer satisfaction... branch service... in-person solicitations... client loyalty... business internet Middle Market Banking "Above average" by Greenwich (2) in overall satisfaction... relationship manager performance... cross-sell solicitation... credit services performance... cash management products & services... internet & telephone service (1) June 2005 syndicated research study (2) June 2005 proprietary research study compared with normative averages from other surveys |
| Retail Banking Growth Office Results 19 offices opened since 12/31/04 15 de novo 4 relocations 86% of planned deposits achieved (de novo) 62% of planned loans achieved (de novo) 139% of planned operating income achieved (de novo) First 12-month performance $11 MM in average deposits $2.4 MM in average loans |
| Satisfaction is Good 2H99 1H00 2H00 1H01 2H01 1H02 1H03 2H05 HNB 0.63 0.66 0.64 0.67 0.66 0.73 0.77 0.8 Major Banks 0.68 0.66 0.69 0.68 0.72 0.67 0.71 0.73 Others 0.81 0.82 0.83 0.86 0.85 0.85 0.84 0.88 63% 80% (1) GfK NOP 2005 customer satisfaction study of consumer banking customers (Q) Overall, how satisfied are you with [Primary Bank]? Please use a scale of "1" to "10" where "1" means "extremely dissatisfied" and "10" means "extremely satisfied". Improved customer satisfaction (1) % Rating a 8, 9, or 10 |
| In Fact...Best in Class (1) GfK NOP 2005 customer satisfaction study of consumer banking customers (Q) Overall, how satisfied are you with [Primary Bank]? Please use a scale of "1" to "10" where "1" means "extremely dissatisfied" and "10" means "extremely satisfied". Chase 0.68 Key Bank 0.69 Fifth Third 0.69 Charter One 0.72 US Bank 0.73 National City 0.75 Huntington 0.8 Best in class customer satisfaction (1) % Rating a 8, 9, or 10 |
| Primary % Switching % Chase 0.11 0.11 Key Bank 0.03 0.04 Fifth Third 0.12 0.15 Charter One 0.06 0.04 US Bank 0.04 0.03 National City 0.12 0.12 Huntington 0.05 0.09 Retail Banking Improving reputation (1) (1) GfK NOP 2005 customer satisfaction study of consumer banking customers (Q) Primary = Which institution (bank, credit union, S&L, insurance co., brokerage firm) do you consider to be your main or primary financial institution? % = % that named this institution. Switching = If you had to change primary institutions, to which financial institution would you be most likely to move? % = % that named this institution. Switching preference share vs. primary share 0% +1% +3% (2)% (1)% 0% +4% Differential |
| 3Q03 4Q03 1Q04 2Q04 3Q04 4Q04 1Q05 2Q05 3Q05 4Q05 1Q06 2Q06 3Q06 4Q06 1Q07 1 0.513 0.504 0.492 0.476 0.457 0.445 0.421 0.419 0.41 0.402 0.394 0.406 0.401 0.393 0.386 2-3 0.394 0.4 0.4 0.409 0.418 0.424 0.43 0.441 0.447 0.448 0.45 0.443 0.443 0.448 0.451 4+ 0.093 0.096 0.108 0.116 0.124 0.131 0.149 0.14 0.142 0.15 0.156 0.151 0.156 0.159 0.163 Retail Banking 3Q03 4Q03 1Q04 2Q04 3Q04 4Q04 1Q05 2Q05 3Q05 4Q05 1Q06 2Q06 3Q06 4Q06 1Q07 1 0.252 0.25 0.25 0.249 0.245 0.242 0.255 0.25 0.244 0.24 0.225 0.23 0.224 0.22 0.212 2-3 0.444 0.441 0.433 0.427 0.418 0.41 0.414 0.41 0.407 0.405 0.395 0.395 0.396 0.396 0.396 4+ 0.304 0.309 0.317 0.324 0.337 0.348 0.331 0.341 0.349 0.355 0.38 0.375 0.38 0.384 0.392 # of Consumer Services # of Small Business Services Increased product penetration (1) (1) Periods prior to 2Q06 exclude Unizan |
| Retail Banking 1Q03 2Q03 3Q03 4Q03 1Q04 2Q04 3Q04 4Q04 1Q05 2Q05 3Q05 4Q05 1Q06 2Q06 3Q06 4Q06 1Q07 492.2 493.2 492.585 490.924 491.949 495.007 502.94 502.9 506.2 510.1 515.8 514.7 517.3 557.1 560.5 559.6 562.8 Consumer Households Small Business Relationships 1Q03 2Q03 3Q03 4Q03 1Q04 2Q04 3Q04 4Q04 1Q05 2Q05 3Q05 4Q05 1Q06 2Q06 3Q06 4Q06 1Q07 46.7 46.9 46.374 46.614 47.728 48.984 50.1 50.874 51.9 53 53.8 54 54.8 60.1 60.3 60.5 61.1 (000) (000) 9% 11% + 45.5 (2) + 6.3 (3) Growing DDA relationships (2) Unizan contributed 34.8 of the 45.5 increase (3) Unizan contributed 4.2 of the 6.3 increase |
| Retail Banking 1Q03 2Q03 3Q03 4Q03 1Q04 2Q04 3Q04 4Q04 1Q05 2Q05 3Q05 4Q05 1Q06 2Q06 3Q06 4Q06 1Q07 1.71 1.85 2.02 2.23 2.2 2.17 2.34 2.77 2.7 2.86 2.71 2.93 2.81 2.83 2.75 2.98 2.79 Consumers (1) Small Business (1) (1) Total cross sells on new relationships at 90 days 1Q03 2Q03 3Q03 4Q03 1Q04 2Q04 3Q04 4Q04 1Q05 2Q05 3Q05 4Q05 1Q06 2Q06 3Q06 4Q06 1Q07 1.76 1.83 1.9 1.96 2.05 2.23 2.22 2.33 2.29 2.56 2.28 2.23 2.16 2.32 2.28 2.3 2.32 (1)% 7% 90-day cross sell (1) Periods prior to 2Q06 exclude Unizan |

| Regional Banking - Tactics "Simply the Best" Customer Experience People - Associates Hiring the right people, training, leadership accountability, new recognition for top Personal Bankers and Banking Office Managers People - Customers Voice of customer research, marketing online capability Process Improvement & Quality Product simplification, process improvement to make sales easier, continuous improvement in service Sales & Service Execution Prioritize and clarify expectations, hold associates accountable, shared goals, improve sales and service training including outbound calling and cross-sell and better aligned incentive plans that include more accountability with a service component |

| The General Manager Program Objective Retain the best banking office managers and accelerate business growth Qualifying Criteria 2 years at banking office manager position Balance scorecard approach and leadership What Changes Incentive pay based on office balance growth and year-over-year profit growth New title and more authority Bank and community leadership Executive education opportunities Requires HBAN stock ownership Our Commitment 3 year program Stay at the same office |
| Retail Banking The General Manager Program GM Other (1) # of offices 50 274 Avg. net oper. inc. (2) 2006 $2.3MM $1.7MM 2 Year CAGR 18.4% 16.6% Avg. balances (3) 2006 $39MM $28MM 2 Year CAGR 5.2% 3.1% (1) Excludes new offices + Unizan offices (2) Before provision expense (3) Consumer & business checking + loans |
| Regional Banking Loan Growth (1) 4Q03 1Q04 2Q04 3Q04 4Q04 1Q05 2Q05 3Q05 4Q05 1Q06 2Q06 3Q06 4Q06 1Q07 2766 2809 2855 3085 3097 3184 3228 3291 3318 3674 3834 3712 3745 3647 4Q03 1Q04 2Q04 3Q04 4Q04 1Q05 2Q05 3Q05 4Q05 1Q06 2Q06 3Q06 4Q06 1Q07 C&I 3420 3314 3331 3142 3280 3429 3630 3567 3673 3781 4100 4300 4474 4629 Middle Market C&I Middle Market CRE ($MM) ($MM) Quarterly Growth Rates-Annualized Quarterly Growth Rates-Annualized 14% (10)% 12% 43% (1) Quarterly averages; Includes Retail Banking, Small Business, Corporate Banking and Mortgage Banking 34% 17% 20% (13)% 16% 4% |
| Regional Banking Loan Growth (1) 1Q05 2Q05 3Q05 4Q05 1Q06 2Q06 3Q06 4Q06 1Q07 4358 4427 4474 4454 4503 4691 4694 4628 4575 Home Equity Loans / Lines ($MM) 4Q03 1Q04 2Q04 3Q04 4Q04 1Q05 2Q05 3Q05 4Q05 1Q06 2Q06 3Q06 4Q06 1Q07 2002 2160 2474 2961 3169 3372 3509 3574 3581 3708 4016 4111 3984 3846 Residential Mortgages ($MM) Quarterly Growth Rates-Annualized Quarterly Growth Rates-Annualized 4% 14% (5)% (14)% Quarterly averages; Includes Retail Banking, Small Business, Corporate Banking and Mortgage Banking Quarterly average reflects pro-rata impact of loan sales: 9/06-$144MM; 12/06-$103MM; 3/07-$110MM 17% 33% - --% 9% (6)% (12)% (2) (2) |
| Regional Banking Deposit Growth (1) 4Q03 1Q04 2Q04 3Q04 4Q04 1Q05 2Q05 3Q05 4Q05 1Q06 2Q06 3Q06 4Q06 1Q07 15695 15560 16334 16714 17159 17546 17434 17716 18001 18676 19914 20057 20186 20221 Total Deposits ($MM) Year-over-Year % Change 8% 4Q03 1Q04 2Q04 3Q04 4Q04 1Q05 2Q05 3Q05 4Q05 1Q06 2Q06 3Q06 4Q06 1Q07 11827 11832 12645 12929 13248 13399 13085 12927 12832 13002 13297 13120 13080 13097 Total Deposits Xcld CDs Year-over-Year % Change 1% ($MM) (1) Quarterly averages; Includes Retail Banking, Small Business, Corporate Banking and Mortgage Banking |
| Retail Banking (1) 4Q03 1Q04 2Q04 3Q04 4Q04 1Q05 2Q05 3Q05 4Q05 1Q06 2Q06 3Q06 4Q06 1Q07 10933 10734 11029 11143 11312 11462 11554 11612 11691 12245 13131 12972 12931 12992 4Q03 1Q04 2Q04 3Q04 4Q04 1Q05 2Q05 3Q05 4Q05 1Q06 2Q06 3Q06 4Q06 1Q07 4051 4270 4595 4866 5035 5038 5133 5173 5163 5502 5984 5985 5864 5736 Total Loans Total Deposits ($MM) ($MM) Quarterly Growth Rates-Annualized (9)% 26% 6% Year-over-Year % Change (1) Quarterly averages 35% - --% (8)% |
| High Ranking of "huntington.com" 3/31/07 Active users 303,096 Retail household penetration 51% Monthly Activity New users 10,000+ Bills paid on-line 921,000+ 35% of active users 18% of retail household penetration Check/deposit images viewed 676,000+ Industry Leadership Keynote rankings - overall #6 Customer Respect Group - overall #8 - regional banks #5 - site usability #2 |
| Launched competitive, high-rate online account with streamlined opening process in late December. Continued Online Investment 3/31/07 New Accounts 1,700 Average Balance $20,000 Growth of new product is exceeding plans |
| Debit Card Usage and Trends 3/31/07 Consumer debit card penetration 75% Active users (1) 79% Average transactions per month 16 (1) 1+ signature transaction per month |
| Small Business Banking - What's Working Income growth Increased DDA households Strong commercial services fees and fee sharing Disciplined NIE spending patterns Enhanced regional delivery model Local decision-making and pricing flexibility SBA network of loan production offices BLC - Business Loan Center regional underwriting teams BRC - Business Resource Center dedicated answer-line for bankers Product and process management focus Strong core deposit product - Business Premier Checking Comprehensive cash management products and services OCP - On-site Check Processing services Business Economy "free" checking product enhancements Centralized pre-doc, doc prep and portfolio monitoring services Velocity System - integrated loan origination and underwriting Loan production and balance growth momentum |
| Small Business Banking - Strategy & Tactics Key strategic goals Increased DDA households and retention Improved business banker and office sales productivity and cross sell Increased treasury management products penetration Enhanced marketing plan and execution "Always On" continuous flow local advertising and direct mail programs Retention system that manages new customer contact stream Enhanced market intelligence systems and segmentation capabilities Sales tools and resource investments Business banker training academy and coaching program development Enhanced sales performance reporting system and dashboards Aligned productivity and revenue goals with incentive pay programs Business call center bankers and outbound calling programs Out of market SBA specialists and centralized underwriting Product and process enhancements Streamlined loan document preparation, underwriting and decision processes Competitive investment real estate pricing and promotion Simplified customer agreement for treasury management product set ups Business on-line payroll services offering |
| Small Business Banking (1) 4Q03 1Q04 2Q04 3Q04 4Q04 1Q05 2Q05 3Q05 4Q05 1Q06 2Q06 3Q06 4Q06 1Q07 1787 1861 1991 2047 2106 2005 2051 2152 2192 2145 2337 2432 2428 2367 4Q03 1Q04 2Q04 3Q04 4Q04 1Q05 2Q05 3Q05 4Q05 1Q06 2Q06 3Q06 4Q06 1Q07 1925 1973 2018 2081 2136 2183 2230 2251 2230 2035 2351 2413 2421 2466 Total Loans Total Deposits ($MM) ($MM) Quarterly Growth Rates-Annualized 7% 10% Year-over-Year % Change (1) Quarterly averages 62% 11% 1% |
| Mortgage Banking (1) 4Q03 1Q04 2Q04 3Q04 4Q04 1Q05 2Q05 3Q05 4Q05 1Q06 2Q06 3Q06 4Q06 1Q07 9061 9442 9786 10332 10755 10980 11240 11456 11582 11714 12612 12818 12953 13092 4Q03 1Q04 2Q04 3Q04 4Q04 1Q05 2Q05 3Q05 4Q05 1Q06 2Q06 3Q06 4Q06 1Q07 1600 1737 2031 2488 2698 2860 2951 3000 3007 2998 3022 3113 3050 2952 Total Loans (2) Servicing Portfolio (3) ($MM) ($MM) Quarterly Growth Rates-Annualized Quarterly Growth Rates-Annualized (13)% 4% (1)% 5% (3) Total servicing portfolio including loans serviced for others; Periods prior to 2Q06 exclude Unizan (1) Quarterly averages (2) Unizan mortgage loans in Retail Banking 3% 31 12% 7% (8)% 4% |
| Commercial Banking - What's Working Relationship growth Growth of Ideal Huntington Customers New Customer relationships continue to grow Revenue growth Commercial loans and deposits Cash management fees Capital markets products Service initiatives Greenwich results and new survey Spring 2007 Process improvements underway will have positive service impacts Investment in business New leadership Process Improvement team Technology Training Risk management Credit Non-credit Compliance |
| Momentum: Commercial Banking (1): 4Q03 1Q04 2Q04 3Q04 4Q04 1Q05 2Q05 3Q05 4Q05 1Q06 2Q06 3Q06 4Q06 1Q07 2809 2867 3094 3360 3567 3918 3639 3746 3927 4137 4270 4481 4645 4700 4Q03 1Q04 2Q04 3Q04 4Q04 1Q05 2Q05 3Q05 4Q05 1Q06 2Q06 3Q06 4Q06 1Q07 6199 6144 6205 6242 6378 6721 6981 7002 7124 7485 7954 8017 8209 8284 Total Loans Total Deposits ($MM) ($MM) Quarterly Growth Rates-Annualized 4% 20% 14% Year-over-Year % Change (1) Quarterly averages; 2Q06 impacted by Unizan merger 25% 3% 10% |

| Dealer Sales |
| Automobile Sales - # of Units 2000 2001 2002 2003 2004 2005 2006 1Q07 New 17.3 17.1 16.8 16.6 16.9 16.9 16.6 3.9 Used - Franchised Dealers 16.2 15.9 16.5 16.2 16 16.5 14.3 2.1 17.3 - All time high 16.6 14.3 Source: CNW Marketing / Research 16.2 (MM) 3.9 2.1 |
| Dealer Sales - A Significant Business A Huntington core business since the early 1950's Strong industry reputation Innovative Dependable 15% of total managed loans and operating leases (1) 500 associates 130 origination / sales 120 operations 40 customer service 210 collections 3,500 dealer relationships 13 states of origination 7 regional sales and underwriting centers (1) @ 3/31/07; excludes commercial floor plan loans |
| Dealer Sales Performance Consistent Returns and Profitability ($MM) 2003 2004 2005 2006 1Q07 Operating earnings $61.8 $64.6 $66.3 $59.9 $12.5 ROE (1) 14.0% 15.8% 18.7% 22.9% 26.4% (1) Based on allocation of capital existing in that reported period; e.g. 2006 = 4.9% |

| Dealer Sales - Business Model Tenure of staff / local market knowledge Local market presence - sales and underwriting Provider of core products - loan, lease, floor plan Focus on cross selling ancillary products and services - treasury, cash management, investments "Simply the Best" customer service |
| Dealer Sales - "Ideal" Dealership Full Relationship 30%+ retail penetration Commercial lending Treasury management / merchant services PFG and/or Retail Banking relationship(s) -or- Retail Primary Relationship 60%+ retail penetration High book to approval ratio May/may not have other banking relationships |
| Dealer Sales - Geographic Profile Loan & Lease Production ($MM) 1Q07 1Q06 % Chg Ohio $163 32% $158 32% 3% Florida 101 20 103 21 (2) Indiana 46 9 46 9 -- Kentucky 45 9 62 13 (27) Michigan 37 7 27 6 37 W.Virginia 25 5 31 6 (19) $417 82% $427 87% (2) Tennessee 25 5 29 6 (14) Arizona 22 4 8 2 nm Georgia 19 4 16 3 19 Pennsylvania 17 3 9 2 nm N. Carolina 7 1 1 -- nm New Jersey 7 1 -- -- nm S. Carolina 1 * -- -- nm Total $515 100% $490 100% 5% * = less than 1% Sales Offices / Underwriting Centers Sales Offices 7% 3% 9% 9% 5% 20% 4% 4% 1% <1% 5% 32% 1% |
| 2004 2005 2006 (2) HNB MARKETS GMAC 13.1 % 10.7 % 11.3 % Ford Motor Credit 9.0 8.6 10.0 Chrysler Financial 8.0 7.3 7.8 Total "Big 3" 30.1 26.6 29.1 American Honda 3.6 4.0 3.9 Toyota Financial 2.7 3.1 3.1 Nissan/ Infiniti 2.1 2.6 2.7 BMW North America 0.9 0.9 1.1 Volkswagen Credit 0.7 0.9 1.0 Sub-total imports 10.0 11.5 11.8 Total captives 40.1 % 38.1 % 40.9 % Huntington 2.6 % 2.1 % 2.2 % (1) Source: AutoCount (2) Information as of 12/31/06 except for Indiana which is as of 6/30/06 Dealer Sales - Market Share vs. Captives (1) |
| Dealer Sales - Market Share in Major Markets (1) 2005 2006(1) 2007(2) Rank (2) KENTUCKY Huntington 6.2 % 6.1 % N/A N/A Fifth Third 8.3 5.3 Chase 4.8 4.9 Wells Fargo 2.6 4.2 OHIO Chase 7.5 7.1 9.2 Huntington 3.9 4.5 5.7 #2 Fifth Third 6.3 3.9 4.0 Wells Fargo 1.9 3.6 2.4 WEST VIRGINIA BB&T 10.3 10.4 10.2 Huntington 6.8 6.2 7.2 #2 United Bank 5.8 5.3 6.6 Fifth Third 5.7 4.7 6.0 (1) Information for Indiana as of 6/30/06 Excluding captives and non-banks; source: AutoCount; Information as of 3/31/07, except for Ohio, which is as of 2/28/07. Information for Kentucky and Indiana is not available. |
| Dealer Sales - Market Share in Major Markets (1) 2005 2006(1) 2007(2) Rank (2) INDIANA Wells Fargo 2.6 % 4.7 % Fifth Third 4.0 3.5 Chase 3.8 3.5 Huntington 2.2 3.0 N/A N/A HNB Central IN 3.2 4.3 MICHIGAN Fifth Third 5.3 3.1 3.9 Chase 3.0 2.9 3.4 Wells Fargo 1.5 2.1 1.6 Huntington 1.3 1.3 1.6 #4 Harris Bank 1.3 1.2 1.3 FLORIDA SunTrust 5.0 4.5 4.7 Bank of America 4.2 2.7 3.1 Wells Fargo 2.1 3.7 2.4 Chase 2.1 2.3 2.6 Huntington 1.2 1.3 1.4 #7 (1) Information for Indiana as of 6/30/06 (2) Excluding captives and non-banks; source: AutoCount; Information as of 3/31/07, except for Ohio, which is as of 2/28/07. Information for Kentucky and Indiana is not available. |
| Loan Production - Held vs. Sold ($MM) Loans Loans Loans Auto Originated Sold (1) Held Exposure (2) 2002 $2,308 $-0- $2,308 33 % 2003 2,757 2,093 664 28 2004 1,587 1,500 87 21 2005 1,503 414 1,089 18 2006 1,717 691 1,026 15 1Q/07 447 138 309 15 $10,319 $4,836 $5,483 (1) All sales in 2005, 2006 and 2007 were under the flow sale arrangement which commenced 5/05 and ends 4/07 (2) Indirect auto loans and leases (including operating leases) as a % of total loans and leases |
| Dealer Sales - A Higher Return Mix Auto Loans (1) Sold Loans / Servicing Retained Auto Leases (2) Commercial Loans 4Q02 4069 0 3107 637 1Q03 4097 180 3101 708 2Q03 3757 688 3124 743 3Q03 3622 973 3155 690 4Q03 3566 1522 3158 751 1Q04 3079 1975 3154 845 2Q04 2349 2304 3116 891 3Q04 1853 2624 3041 800 4Q04 1909 2402 3026 823 1Q05 2008 2154 2990 941 2Q05 2069 1919 2877 959 3Q05 2061 1845 2628 690 4Q05 2016 1782 2553 755 1Q06 1968 1720 2380 849 2Q06 2042 1686 2200 872 3Q06 2077 1649 2044 793 4Q06 2109 1589 1878 837 1Q07 2214 1463 1721 868 Average Balances ($MM) $1,721 $2,214 $868 (1) Loans includes securitized loans (2) Leases includes direct financing and operating leases $1,463 20%+ ROE |
| Credit Quality - Net Charge-offs Loan-$ Loan-% Lease-$ Lease-% 1Q03 10623 0.0138 10939 0.0142 1Q04 13422 0.0177 8239 0.0104 1Q05 3216 0.0064 4938 0.0066 1Q06 2977 0.006 3542 0.006 1Q07 2833 0.0052 2000 0.0046 2Q03 7524 0.0106 10316 0.0133 2Q04 5604 0.0096 5844 0.0075 2Q05 1664 0.0032 2680 0.0037 2Q06 1172 0.0023 1537 0.0028 3Q03 10773 0.012 8865 0.0112 3Q04 5142 0.0111 6203 0.0082 3Q05 3895 0.0075 3958 0.0058 3Q06 1759 0.0034 1879 0.0037 4Q03 11346 0.0129 8897 0.0113 4Q04 4406 0.0092 4152 0.0055 4Q05 3213 0.0064 3739 0.0059 4Q06 2432 0.0046 2600 0.0055 ($MM) Note: Lease includes direct financing leases and operating lease assets (1) 1Q04 included $4.7 MM one time cumulative adjustment for treatment of repossessed vehicle damage insurance claims; $3.8 MM in loans and $0.9 MM in leases (1) |
| Dealer Sales - Industry Issues Domestic captives use interest rate subvention programs reducing available bank share Domestic captives higher focus on leasing programs with aggressive residual setting Lengthening of financing terms and the effect on negative equity in existing vehicles Increased competition... technology accelerates entry speed / operating efficiencies |
| Dealer Sales - Priorities Maximize product profitability Maintain pricing discipline at the expense of market share Maintain credit quality Market expansion within core footprint and increased penetration of existing low/median market share competitors Selected market expansion outside of core footprint Increased penetration of Huntington products and services at "high market share" dealerships Leverage existing infrastructure and recent investment in technological capabilities Evaluate emerging workflow technology to determine viability |

| Private Financial and Capital Markets Group |
| PFCMG - Profile 3/31/07 Assets under custody $ 41.4 Billion Assets under management (1) 12.6 Trust assets (1) $ 54.0 Huntington Funds assets $ 4.1 Brokerage assets $ 5.6 Corporate trust debt under administration $ 27.6 Total deposits $ 1.2 Total loans $ 1.9 Total revenue - YTD (2) $69.5 Million (1) Includes Huntington Funds and Haberer (2) Prior to fee sharing revenues; excludes corporate equity investment gains/(losses) |
| PFCMG - Results 1Q07 1Q06 % Chg Total revenue (1) $69.5 MM $64.6 MM 8 % Assets under management (2) $ 12.6 B $ 10.9 B 16 Huntington Funds 4.1 3.6 14 Trust assets 54.0 46.9 15 Retail brokerage assets 5.6 5.1 10 Total deposits - avg. 1.1 1.1 -- Total loans - avg. 1.8 1.7 7 (1) Prior to fee sharing revenues; excludes corporate equity investment gains/(losses): 1Q07: ($8.5MM); 1Q06: $1.4MM (2) Includes Huntington Funds and Haberer |
| Private Financial - Business Overview Asset Management / Investment Advisory Assets ($B) 3/31/07 12/31/06 3/31/06 Mngd Total Mngd Total Mngd Total Personal trust $6.7 $10.9 $6.6 $10.8 $5.6 $9.4 Huntington Funds 4.1 4.1 3.9 3.9 3.6 3.6 Institutional trust 0.9 32.0 0.9 31.0 1.1 28.7 Corporate trust -- 6.2 -- 6.0 -- 4.6 Haberer 0.8 0.8 0.8 0.8 0.7 0.7 $12.6 $54.0 $12.2 $52.4 $10.9 $46.8 |
| Private Financial - Business Overview ($MM) 1Q07 v 1Q07v Brokerage 1Q07 4Q06 1Q06 4Q06 (1) 1Q06 Mutual fund sales $ 61.5 $ 61.7 $ 38.8 -- % 58 % Annuity sales 127.2 113.0 147.2 13 (14) $188.7 $174.7 $186.0 8 % 1 % Private Banking (2) Deposits $1,094 $1,113 $1,114 (2) % (2) % Loans $1,622 $1,628 $1,570 -- % 3 % (1) Linked quarter percentage growth is not annualized (2) Average balances; excludes certain trust loan & deposit settlement account balances and Capital Markets Group |
| PFCMG - Revenue Contribution (1) Trust 25.2 Private Banking 14.4 Investments 15.8 Capital Markets 10.4 Insurance 3.7 Trust / Asset Management $25.2 / 36% Private Banking $14.4 / 21% Investments $15.8 / 23% Capital Markets $10.4 / 15% Insurance $3.7 / 5% 1Q07 ($MM) 1) Prior to fee sharing revenues; excludes corporate equity investment gains/(losses) |
| PFCMG - Formula For Winning Market Presence Unified Delivery Products & Services Service Plan Acquisition PFCMG Growth |
| PFCMG - Market Presence Growing "In Market"... Adding Growth Markets... Indianapolis Dayton St. Petersburg Orlando Palm Beach |
| PFCMG - Unique Delivery Business Line Investment Brokerage Insurance Services Retirement 401(k)/Invstmnt Management Personal Trust/Invstmnt Management Dealer Sales Regional Banking Private Bank Clients Unified Sales Force Huntington Investment Company model is used to deliver all PFCMG products when selling through the Bank portal |
| PFCMG - Expanding Distinctive Products/Services 2000 - - Huntington Investment Advisor - - Huntington Asset Management Account - - Huntington Director - - Huntington Access Annuity 2001 - - Dividend Capture Fund - - International Equity Fund - - Mid Corp America Fund - - New Economy Fund - - Rotating Markets Fund 2002 - - Huntington 401 (K) - - Situs Fund - - Huntington Director Outlook - - Huntington Hartford Leaders Outlook - - Haberer Registered Investment Advisor 2003 - - Property and Casualty Insurance 2004 - - Huntington All Star Select - - Huntington Consulting Services - - Macro 100 Fund 2005 - - Options Return Portfolio 2006 - - Portfolio Select - - Unified Fund Services |
| 2Q02 3Q02 4Q02 1Q03 2Q03 3Q03 4Q03 1Q04 2Q04 3Q04 4Q04 1Q05 2Q05 3Q05 4Q05 1Q06 2Q06 3Q06 4Q06 1Q07 483.7 431.3 454.1 432.2 468.9 476.8 521 543 554 565 598 604.5 610.2 630.5 642.4 654.2 759.6 770 802 810 PFCMG - Growing Through Acquisition ($MM) Assets Under Management 4 Year CAGR 17% |
| PFCMG - Fee Based Revenue (1) Revenue 1Q07 v ($MM) 1Q07 4Q06 1Q06 Trust fees $ 25.8 10 % 22% Retail investment sales 11.3 20 5 Inst. investment sales (2) 0.5 (15) nm Insurance revenue 3.9 (9) 44 Brokerage & insurance $ 15.7 10 % 16% (1) Prior to revenue shared with Regional Banking and securities gains Includes fixed income commissions of $0.5 MM in 1Q07 and $0.6 MM recorded as other income in 1Q06 Trust Fees Retail Invst Sales Ins. Revenue 1Q04 16.3 11.7 2.936 2Q04 16.7 10 2.782 3Q04 17 9.4 2.648 4Q04 17.294 8.6 3.467 1Q05 18.2 9.5 2.729 2Q05 19.1 9.2 3.1 3Q05 19.7 9.3 3.4 4Q05 20.4 9 2.8 1Q06 21.2 10.8 2.7 2Q06 22.6 10.6 2.8 3Q06 22.4 9.7 3.9 4Q06 23.4 9.4 4.3 1Q07 25.8 11.3 3.9 ($MM) Trends |
| PFCMG - Trust Income Growth (1) 1Q01 2Q01 3Q01 4Q01 1Q02 2Q02 3Q02 4Q02 1Q03 2Q03 3Q03 4Q03 1Q04 2Q04 3Q04 4Q04 1Q05 2Q05 3Q05 4Q05 1Q06 2Q06 3Q06 4Q06 1Q07 14.3 15.2 15.5 15.2 15.5 16.3 15 15.3 14.9 15.6 15.4 15.8 16.3 16.7 17 17.3 18.2 19.1 19.7 20.4 21.2 22.6 22.4 23.4 25.8 ($MM) (1) Prior to revenue shared with Regional Banking and securities gains 5 Year CAGR 11% |
| PFCMG - Trust Asset Growth (1) 2000 2001 2002 2003 2004 2005 2006 1Q07 Custody Assets 12.9 18 18.4 29.1 33.6 35.4 40.2 41.4 Managed Assets 9.3 9.7 8.5 8.9 9.8 10.8 12.2 12.6 ($B) 6 Year CAGR (2) 21% 5% End of Period Includes Haberer As of 12/31/2006 |
| PFCMG (1) 4Q03 1Q04 2Q04 3Q04 4Q04 1Q05 2Q05 3Q05 4Q05 1Q06 2Q06 3Q06 4Q06 1Q07 1128 1086 1064 1049 1111 1109 1150 1134 1161 1150 1144 1142 1169 1145 4Q03 1Q04 2Q04 3Q04 4Q04 1Q05 2Q05 3Q05 4Q05 1Q06 2Q06 3Q06 4Q06 1Q07 Private Financial 1407 1427 1349 1399 1444 1496 1517 1554 1573 1573 1592 1629 1635 1624 Capital Markets 134 138 137 149 150 152 156 153 165 184 205 223 Total Loans Total Deposits ($MM) ($MM) 2% Quarterly Growth Rates-Annualized - --% - --% Year-over-Year % Change (1) Quarterly averages $1,847 $1,726 $1,757 7% 13% $1,813 $1,840 6% |
| Private Financial (1) 4Q03 1Q04 2Q04 3Q04 4Q04 1Q05 2Q05 3Q05 4Q05 1Q06 2Q06 3Q06 4Q06 1Q07 45.2 46.1 46.2 46.9 49.3 50.4 52.4 54 4Q03 1Q04 2Q04 3Q04 4Q04 1Q05 2Q05 3Q05 4Q05 1Q06 2Q06 3Q06 4Q06 1Q07 8.9 9.2 9.3 9.6 9.8 10 10.3 10.8 10.8 10.9 12 11.9 12.2 12.6 Assets Under Management Trust Assets (2) ($B) ($B) 16% 15% Year-over-Year % Change Year-over-Year % Change (2) Includes Haberer assets (1) Period end |
| ($MM) 1Q07 v 1Q07 1Q06 1Q06 Mutual fund & annuity sales $188.7 $186.0 1% Private Financial - Investment Sales Success Annualized 2005 Industry (1) 1Q07 2006 Top HBAN HBAN Average Quartile Sales penetration (2) 4.9% 4.8% 3.2% 3.9% Revenue penetration (3) $3,475 $3,518 $1,651 $2,271 Profit penetration (4) $847 $1,146 $ 429 $ 615 (1) Ken Kehrer & Associates survey (2) Sales (dollars invested) of mutual funds and annuities (annualized) divided by bank's retail deposits (3) Investment program revenue (annualized) per million of the bank's retail deposits (4) Contribution of investment program to pretax profit (annualized) per million of the bank's retail deposits. Contribution is difference between program revenue and program expenses |

| Huntington Funds - 3/31/07 Lipper 3 Year rankings New Economy (trust class) Top 12% Situs Small Cap Fund (trust class) Top 6% Rotating Markets (trust class) Top 8% Mortgage Fund (trust class) Top 14% Morningstar overall "5 Star" rating Mortgage Fund (F/I) New Economy Fund (Equity) Situs Small Cap Fund (Equity) Morningstar "4 Star" rating International Equity Fund (Equity) Barron's 2006 Top 100 Fund Managers / Best in Class Randy Bateman - Situs fund |
| Mutual Fund Performance - Returns (YOY % Change) 1Q06 2Q06 3Q06 4Q06 1Q07 S&P 500 +12 +9 +11 +16 +12 Dow Jones +8 +11 +11 +19 +11 "5 Star" Rating (1) Situs Small Cap (Equity) +26 +16 +2 +11 +9 New Economy (Equity) +22 +14 +4 +9 +6 Mortgage Fund (F/I) +4 +1 +5 +6 +7 "4 Star" Rating (1) International Equity (Equity) +28 +27 +19 +27 +16 Other Rotating Markets (Equity) +18 +13 +13 +20 +12 Dividend Capture (Equity) +10 +6 +11 +16 +12 Income Equity (Equity) +7 +4 +9 +11 +9 Growth (Equity) +7 +2 +5 +8 +6 Mid Corp America (Equity) +17 +7 +3 +8 +8 (1) At March 31, 2007 |