EX-99.3 PRESENTATION MATERIALS
Published on July 22, 2003
Exhibit 99.3

| 2003 Second Quarter Earnings Review July 17, 2003 |

| Basis of Presentation All prior period data reflect the restatement announced July 17, 2003. Use of non-GAAP financial measures This presentation contains GAAP financial measures and non-GAAP financial measures where management believes it to be helpful in understanding Huntington's results of operations or financial position. Where non-GAAP financial measures are used, the comparable GAAP financial measure, as well as the reconciliation to the comparable GAAP financial measure, can be found in this presentation or in the Quarterly Financial Review supplement to the Second Quarter 2003 Earnings Press Release, which can be found on Huntington's website at www.huntington-ir.com. Annualized data Certain returns, yields, performance ratios, or growth rates for a quarter are "annualized" in this presentation to represent an annual time period. This is done for analytical purposes to better discern for decision making purposes underlying performance trends when compared to full-year or year-over-year amounts. For example, loan growth rates are most often expressed in terms of an annual rate like 8%. As such, a 2% growth rate for a quarter would represent an annualized 8% growth rate. Fully taxable equivalent interest income and net interest margin Income from tax-exempt earnings assets is increased by an amount equivalent to the taxes that would have been paid if this income had been taxable at statutory rates. This adjustment puts all earning assets, most notably tax-exempt municipal securities and certain lease assets, on a common basis that facilitates comparison of results to results of competitors. Earnings per share equivalent data Significant one-time income or expense items may be expressed on a per common share basis. This is done for analytical purposes to better discern underlying trends in total corporate earnings per share performance excluding the impact of such items. Management does this for performance analysis and decision making. Investors also find this information helpful in their evaluation of the company's financial performance against published earnings per share consensus amounts, which typically exclude the impact of significant one- time items. Earnings per share equivalents are usually calculated by applying a 35% effective tax rate to a pre-tax amount to derive an after-tax amount which is divided by the average shares outstanding during the respective reporting period. Occasionally, when the item involves special tax treatment, the after-tax amount is separately disclosed, with this then being the amount used to calculate the earnings per share equivalent. Rounding Please note that columns of data in the following slides may not add due to rounding. NM or nm Percent changes of 100% or more are shown as "nm" or "not meaningful". Such large percent changes typically reflect the impact of one-time items within the measured periods. Since the primary purpose of showing a percent change is for discerning underlying performance trends, such large percent changes are "not meaningful" for this purpose. |
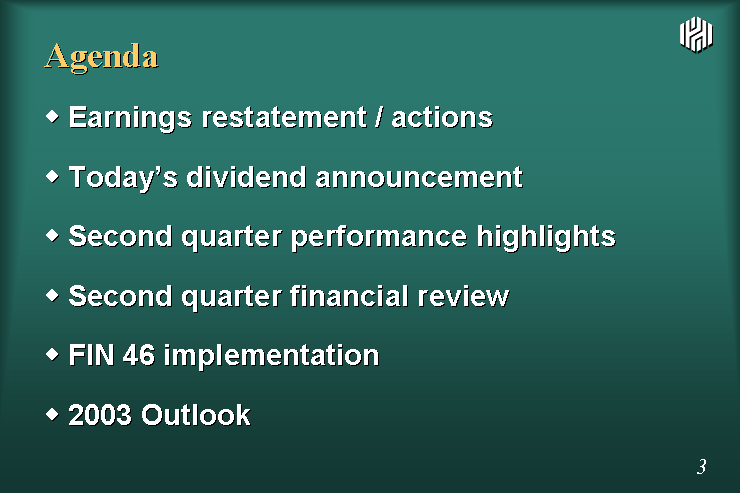
| Agenda Earnings restatement / actions Today's dividend announcement Second quarter performance highlights Second quarter financial review FIN 46 implementation 2003 Outlook |
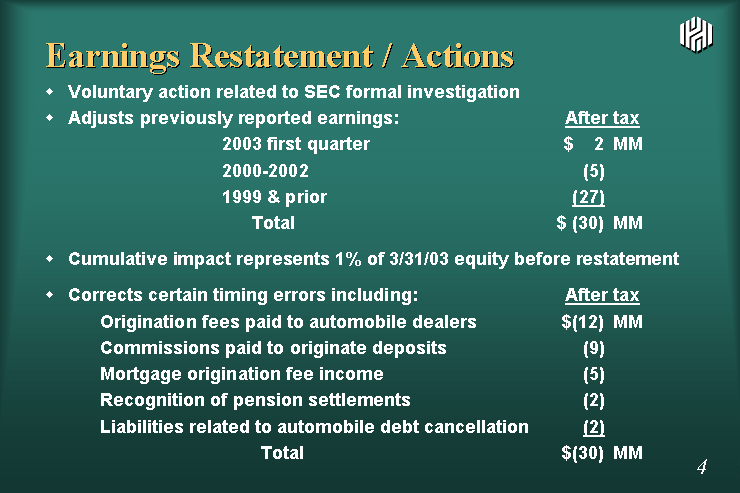
| Earnings Restatement / Actions Voluntary action related to SEC formal investigation Adjusts previously reported earnings: After tax 2003 first quarter $ 2 MM 2000-2002 (5) 1999 & prior (27) Total $ (30) MM Cumulative impact represents 1% of 3/31/03 equity before restatement Corrects certain timing errors including: After tax Origination fees paid to automobile dealers $(12) MM Commissions paid to originate deposits (9) Mortgage origination fee income (5) Recognition of pension settlements (2) Liabilities related to automobile debt cancellation (2) Total $(30) MM |
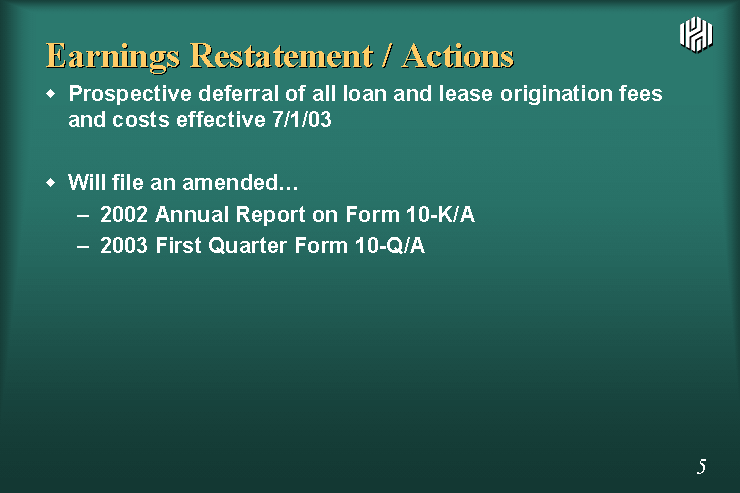
| Earnings Restatement / Actions Prospective deferral of all loan and lease origination fees and costs effective 7/1/03 Will file an amended... 2002 Annual Report on Form 10-K/A 2003 First Quarter Form 10-Q/A |

| Dividend Announcement |
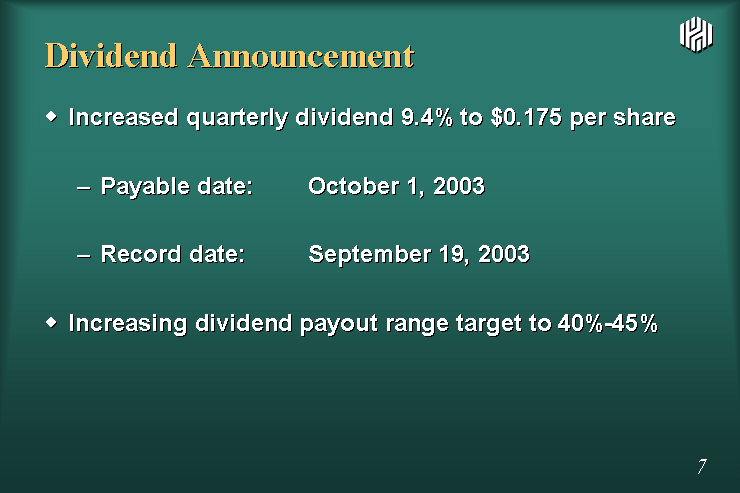
| Dividend Announcement Increased quarterly dividend 9.4% to $0.175 per share Payable date: October 1, 2003 Record date: September 19, 2003 Increasing dividend payout range target to 40%-45% |

| Dividend Policy Consideration Positive progress in improving financial performance and prospects Strong capital position Improved internal capital generation to 9%+ |

| Second Quarter Performance Highlights |
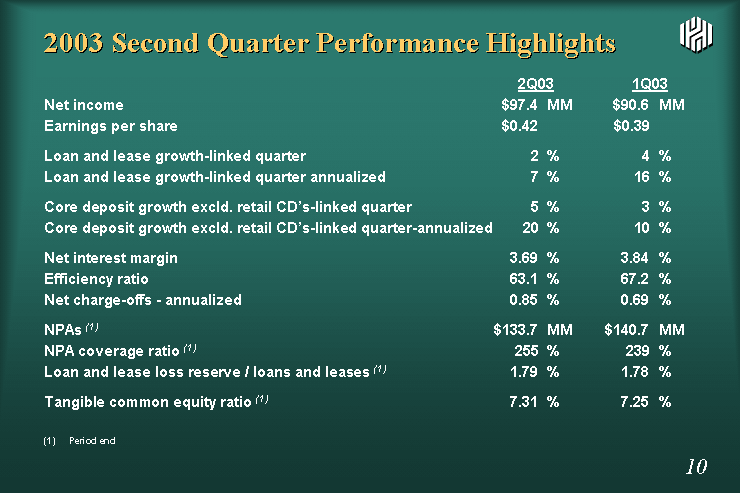
| 2003 Second Quarter Performance Highlights 2Q03 1Q03 Net income $97.4 MM $90.6 MM Earnings per share $0.42 $0.39 Loan and lease growth-linked quarter 2 % 4 % Loan and lease growth-linked quarter annualized 7 % 16 % Core deposit growth excld. retail CD's-linked quarter 5 % 3 % Core deposit growth excld. retail CD's-linked quarter-annualized 20 % 10 % Net interest margin 3.69 % 3.84 % Efficiency ratio 63.1 % 67.2 % Net charge-offs - annualized 0.85 % 0.69 % NPAs (1) $133.7 MM $140.7 MM NPA coverage ratio (1) 255 % 239 % Loan and lease loss reserve / loans and leases (1) 1.79 % 1.78 % Tangible common equity ratio (1) 7.31 % 7.25 % (1) Period end |

| Financial Review |
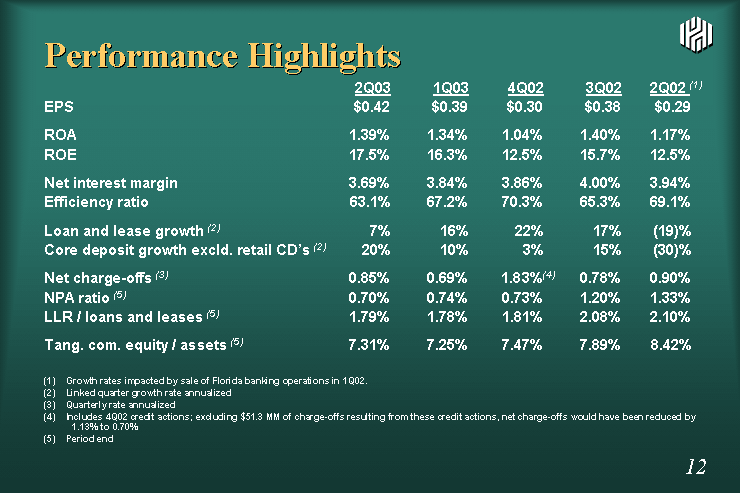
| 2Q03 1Q03 4Q02 3Q02 2Q02 (1) EPS $0.42 $0.39 $0.30 $0.38 $0.29 ROA 1.39% 1.34% 1.04% 1.40% 1.17% ROE 17.5% 16.3% 12.5% 15.7% 12.5% Net interest margin 3.69% 3.84% 3.86% 4.00% 3.94% Efficiency ratio 63.1% 67.2% 70.3% 65.3% 69.1% Loan and lease growth (2) 7% 16% 22% 17% (19)% Core deposit growth excld. retail CD's (2) 20% 10% 3% 15% (30)% Net charge-offs (3) 0.85% 0.69% 1.83%(4) 0.78% 0.90% NPA ratio (5) 0.70% 0.74% 0.73% 1.20% 1.33% LLR / loans and leases (5) 1.79% 1.78% 1.81% 2.08% 2.10% Tang. com. equity / assets (5) 7.31% 7.25% 7.47% 7.89% 8.42% (1) Growth rates impacted by sale of Florida banking operations in 1Q02. (2) Linked quarter growth rate annualized (3) Quarterly rate annualized (4) Includes 4Q02 credit actions; excluding $51.3 MM of charge-offs resulting from these credit actions, net charge-offs would have been reduced by 1.13% to 0.70% (5) Period end Performance Highlights |
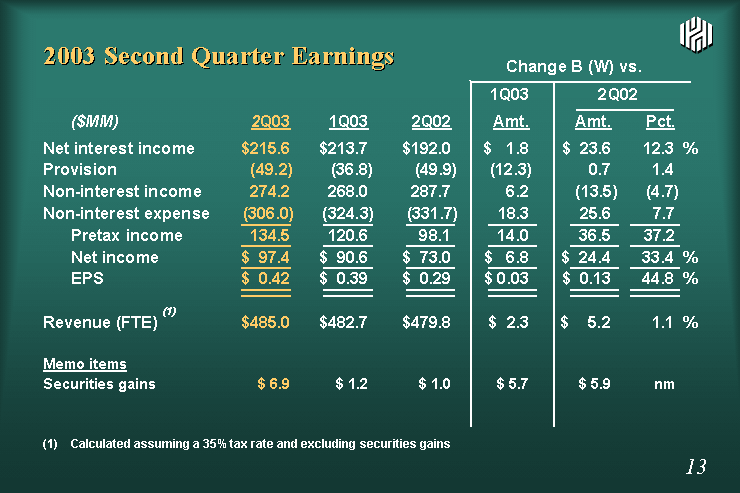
| 2003 Second Quarter Earnings Change B (W) vs. 1Q03 2Q02 ($MM) 2Q03 1Q03 2Q02 Amt. Amt. Pct. Net interest income $215.6 $213.7 $192.0 $ 1.8 $ 23.6 12.3 % Provision (49.2) (36.8) (49.9) (12.3) 0.7 1.4 Non-interest income 274.2 268.0 287.7 6.2 (13.5) (4.7) Non-interest expense (306.0) (324.3) (331.7) 18.3 25.6 7.7 Pretax income 134.5 120.6 98.1 14.0 36.5 37.2 Net income $ 97.4 $ 90.6 $ 73.0 $ 6.8 $ 24.4 33.4 % EPS $ 0.42 $ 0.39 $ 0.29 $ 0.03 $ 0.13 44.8 % Revenue (FTE) (1) $485.0 $482.7 $479.8 $ 2.3 $ 5.2 1.1 % Memo items Securities gains $ 6.9 $ 1.2 $ 1.0 $ 5.7 $ 5.9 nm (1) Calculated assuming a 35% tax rate and excluding securities gains |

| Performance Trends Net Income Amount 1Q02 0.37 2Q02 0.29 3Q02 0.38 4Q02 0.3 1Q03 0.39 2Q03 0.42 Earnings Per Share Amount 1Q02 93.1 2Q02 73.011 3Q02 90.723 4Q02 70.623 1Q03 90.576 2Q03 97.387 ($MM) |
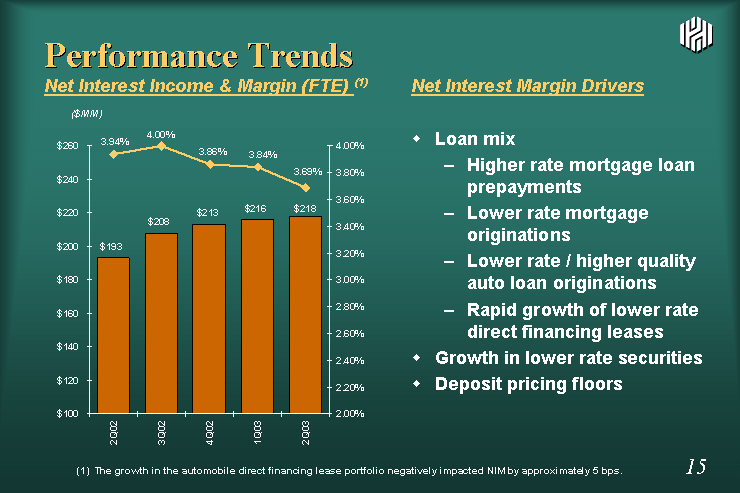
| Performance Trends Net Interest Income & Margin (FTE) (1) Net Interest Margin Drivers Loan mix Higher rate mortgage loan prepayments Lower rate mortgage originations Lower rate / higher quality auto loan originations Rapid growth of lower rate direct financing leases Growth in lower rate securities Deposit pricing floors Amount NIM 1Q02 185.6 0.0363 2Q02 193.065 0.0394 3Q02 207.562 0.04 4Q02 213.154 0.0386 1Q03 215.832 0.0384 2Q03 217.654 0.0369 ($MM) (1) The growth in the automobile direct financing lease portfolio negatively impacted NIM by approximately 5 bps. |
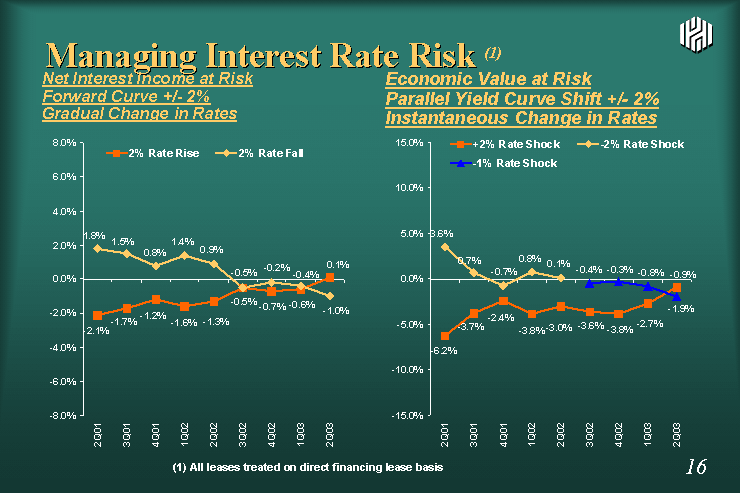
| Managing Interest Rate Risk (1) Net Interest Income at Risk Forward Curve +/- 2% Gradual Change in Rates Economic Value at Risk Parallel Yield Curve Shift +/- 2% Instantaneous Change in Rates 2% Rate Rise 2% Rate Fall 2Q01 -0.021 0.018 3Q01 -0.017 0.015 4Q01 -0.012 0.008 1Q02 -0.016 0.014 2Q02 -0.013 0.009 3Q02 -0.005 -0.005 4Q02 -0.007 -0.002 1Q03 -0.006 -0.004 2Q03 0.001 -0.01 +2% Rate Shock -2% Rate Shock -1% Rate Shock 2Q01 -0.062 0.036 3Q01 -0.037 0.007 4Q01 -0.024 -0.007 1Q02 -0.038 0.008 2Q02 -0.03 0.001 3Q02 -0.036 -0.004 4Q02 -0.038 -0.003 1Q03 -0.027 -0.008 2Q03 -0.009 -0.019 (1) All leases treated on direct financing lease basis |
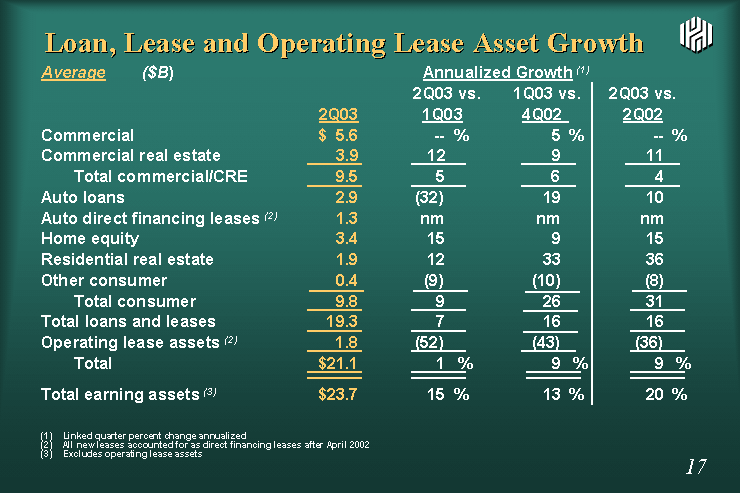
| Loan, Lease and Operating Lease Asset Growth Average ($B) Annualized Growth (1) 2Q03 vs. 1Q03 vs. 2Q03 vs. 2Q03 1Q03 4Q02 2Q02 Commercial $ 5.6 -- % 5 % -- % Commercial real estate 3.9 12 9 11 Total commercial/CRE 9.5 5 6 4 Auto loans 2.9 (32) 19 10 Auto direct financing leases (2) 1.3 nm nm nm Home equity 3.4 15 9 15 Residential real estate 1.9 12 33 36 Other consumer 0.4 (9) (10) (8) Total consumer 9.8 9 26 31 Total loans and leases 19.3 7 16 16 Operating lease assets (2) 1.8 (52) (43) (36) Total $21.1 1 % 9 % 9 % Total earning assets (3) $23.7 15 % 13 % 20 % (1) Linked quarter percent change annualized (2) All new leases accounted for as direct financing leases after April 2002 (3) Excludes operating lease assets |
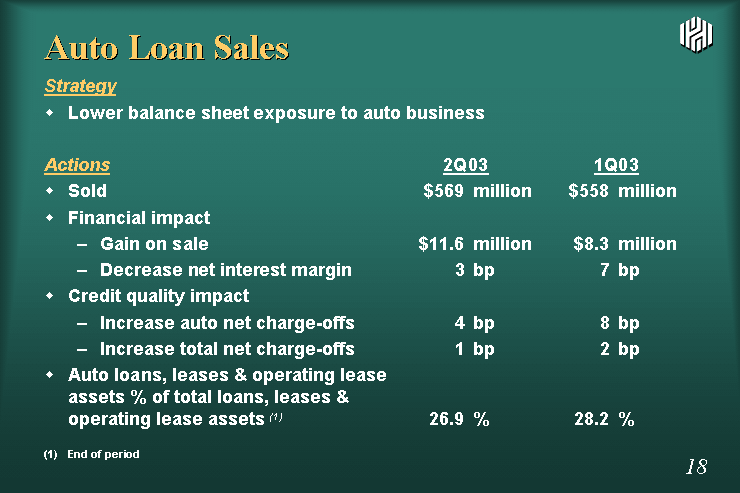
| Auto Loan Sales Strategy Lower balance sheet exposure to auto business Actions 2Q03 1Q03 Sold $569 million $558 million Financial impact Gain on sale $11.6 million $8.3 million Decrease net interest margin 3 bp 7 bp Credit quality impact Increase auto net charge-offs 4 bp 8 bp Increase total net charge-offs 1 bp 2 bp Auto loans, leases & operating lease assets % of total loans, leases & operating lease assets (1) 26.9 % 28.2 % (1) End of period |
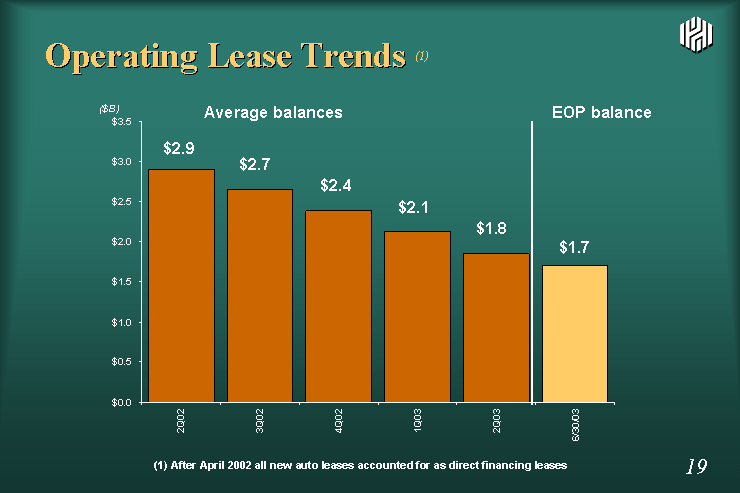
| Operating Lease Trends (1) Operating Leases 1Q02 3.041 2Q02 2.906 3Q02 2.657 4Q02 2.382 1Q03 2.126 2Q03 1.848 6/30/2003 1.7 ($B) (1) After April 2002 all new auto leases accounted for as direct financing leases Average balances EOP balance |
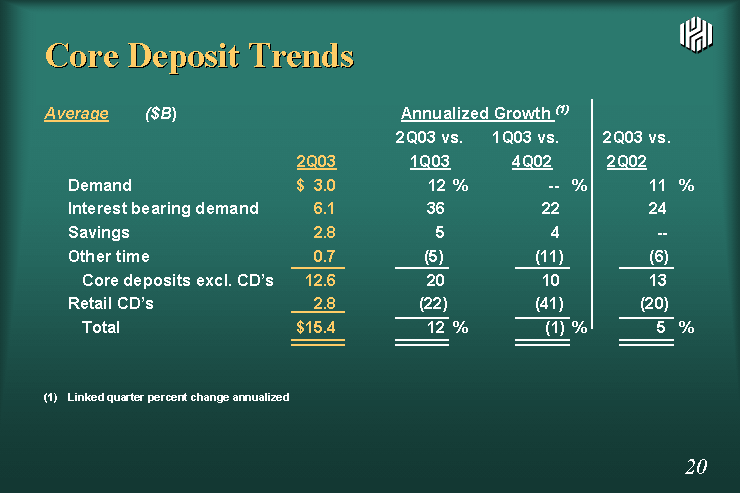
| Core Deposit Trends Average ($B) Annualized Growth (1) 2Q03 vs. 1Q03 vs. 2Q03 vs. 2Q03 1Q03 4Q02 2Q02 Demand $ 3.0 12 % -- % 11 % Interest bearing demand 6.1 36 22 24 Savings 2.8 5 4 -- Other time 0.7 (5) (11) (6) Core deposits excl. CD's 12.6 20 10 13 Retail CD's 2.8 (22) (41) (20) Total $15.4 12 % (1) % 5 % (1) Linked quarter percent change annualized |
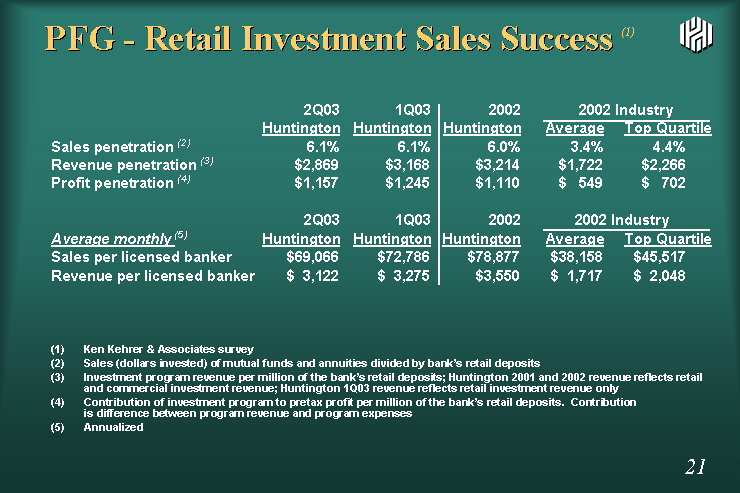
| PFG - Retail Investment Sales Success (1) 2Q03 1Q03 2002 2002 Industry Huntington Huntington Huntington Average Top Quartile Sales penetration (2) 6.1% 6.1% 6.0% 3.4% 4.4% Revenue penetration (3) $2,869 $3,168 $3,214 $1,722 $2,266 Profit penetration (4) $1,157 $1,245 $1,110 $ 549 $ 702 2Q03 1Q03 2002 2002 Industry Average monthly (5) Huntington Huntington Huntington Average Top Quartile Sales per licensed banker $69,066 $72,786 $78,877 $38,158 $45,517 Revenue per licensed banker $ 3,122 $ 3,275 $3,550 $ 1,717 $ 2,048 (1) Ken Kehrer & Associates survey (2) Sales (dollars invested) of mutual funds and annuities divided by bank's retail deposits (3) Investment program revenue per million of the bank's retail deposits; Huntington 2001 and 2002 revenue reflects retail and commercial investment revenue; Huntington 1Q03 revenue reflects retail investment revenue only (4) Contribution of investment program to pretax profit per million of the bank's retail deposits. Contribution is difference between program revenue and program expenses (5) Annualized |
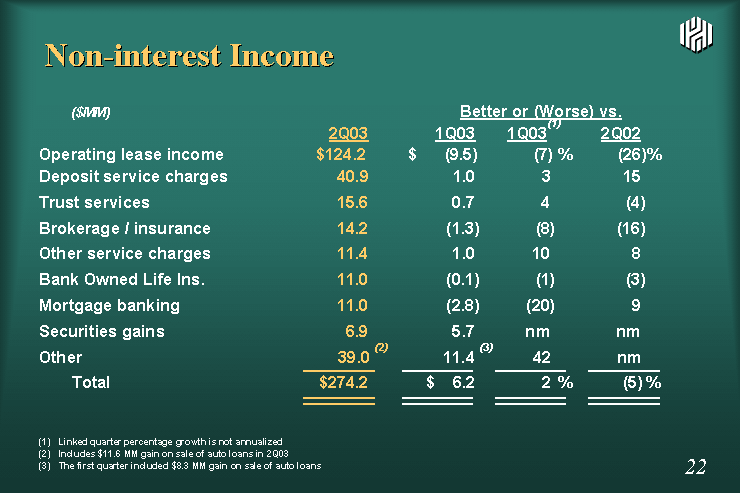
| Non-interest Income ($MM) Better or (Worse) vs. 2Q03 1Q03 1Q03(1) 2Q02 Operating lease income $124.2 $ (9.5) (7) % (26)% Deposit service charges 40.9 1.0 3 15 Trust services 15.6 0.7 4 (4) Brokerage / insurance 14.2 (1.3) (8) (16) Other service charges 11.4 1.0 10 8 Bank Owned Life Ins. 11.0 (0.1) (1) (3) Mortgage banking 11.0 (2.8) (20) 9 Securities gains 6.9 5.7 nm nm Other 39.0 (2) 11.4 (3) 42 nm Total $274.2 $ 6.2 2 % (5) % (1) Linked quarter percentage growth is not annualized (2) Includes $11.6 MM gain on sale of auto loans in 2Q03 (3) The first quarter included $8.3 MM gain on sale of auto loans |
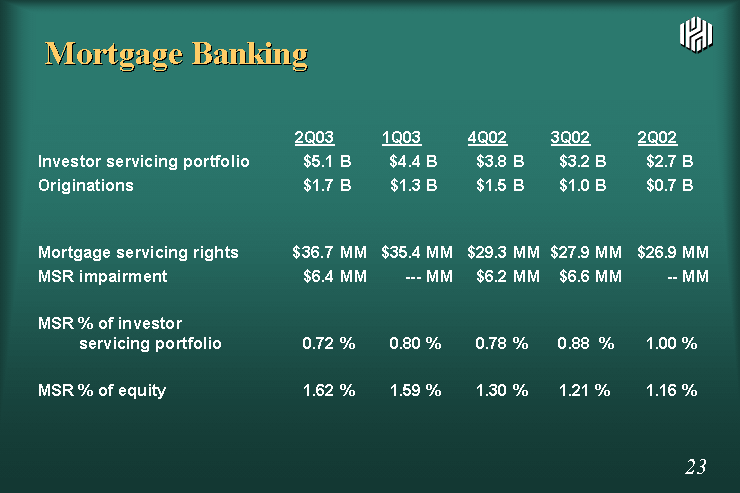
| Mortgage Banking 2Q03 1Q03 4Q02 3Q02 2Q02 Investor servicing portfolio $5.1 B $4.4 B $3.8 B $3.2 B $2.7 B Originations $1.7 B $1.3 B $1.5 B $1.0 B $0.7 B Mortgage servicing rights $36.7 MM $35.4 MM $29.3 MM $27.9 MM $26.9 MM MSR impairment $6.4 MM --- MM $6.2 MM $6.6 MM -- MM MSR % of investor servicing portfolio 0.72 % 0.80 % 0.78 % 0.88 % 1.00 % MSR % of equity 1.62 % 1.59 % 1.30 % 1.21 % 1.16 % |
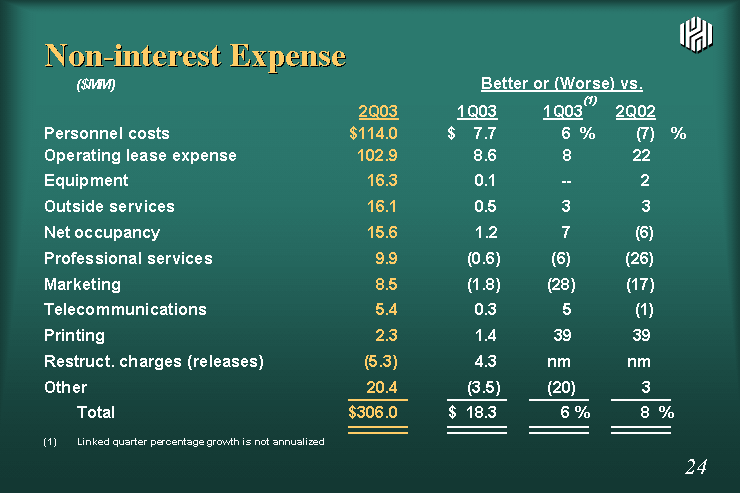
| Non-interest Expense ($MM) Better or (Worse) vs. 2Q03 1Q03 1Q03(1) 2Q02 Personnel costs $114.0 $ 7.7 6 % (7) % Operating lease expense 102.9 8.6 8 22 Equipment 16.3 0.1 -- 2 Outside services 16.1 0.5 3 3 Net occupancy 15.6 1.2 7 (6) Professional services 9.9 (0.6) (6) (26) Marketing 8.5 (1.8) (28) (17) Telecommunications 5.4 0.3 5 (1) Printing 2.3 1.4 39 39 Restruct. charges (releases) (5.3) 4.3 nm nm Other 20.4 (3.5) (20) 3 Total $306.0 $ 18.3 6 % 8 % (1) Linked quarter percentage growth is not annualized |
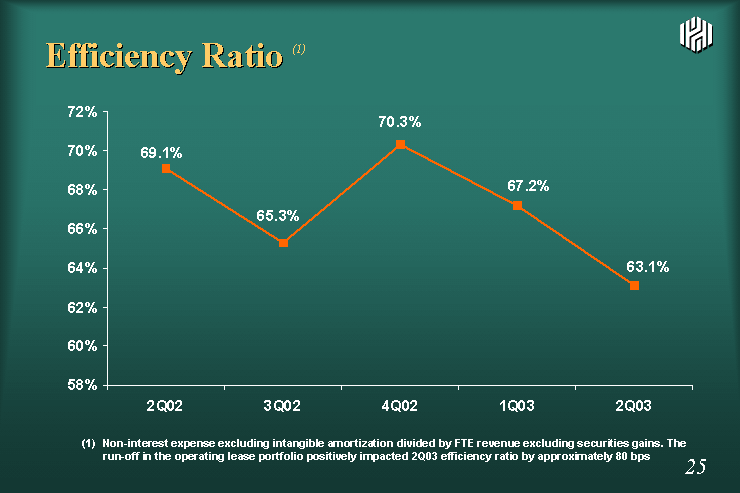
| Amount 1Q02 0.6087 2Q02 0.691 3Q02 0.653 4Q02 0.703 1Q03 0.672 2Q03 0.631 Efficiency Ratio (1) (1) Non-interest expense excluding intangible amortization divided by FTE revenue excluding securities gains. The run-off in the operating lease portfolio positively impacted 2Q03 efficiency ratio by approximately 80 bps |
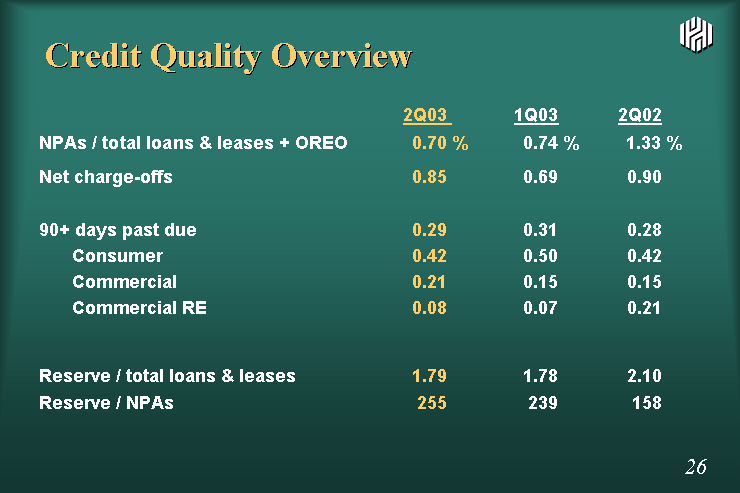
| Credit Quality Overview 2Q03 1Q03 2Q02 NPAs / total loans & leases + OREO 0.70 % 0.74 % 1.33 % Net charge-offs 0.85 0.69 0.90 90+ days past due 0.29 0.31 0.28 Consumer 0.42 0.50 0.42 Commercial 0.21 0.15 0.15 Commercial RE 0.08 0.07 0.21 Reserve / total loans & leases 1.79 1.78 2.10 Reserve / NPAs 255 239 158 |
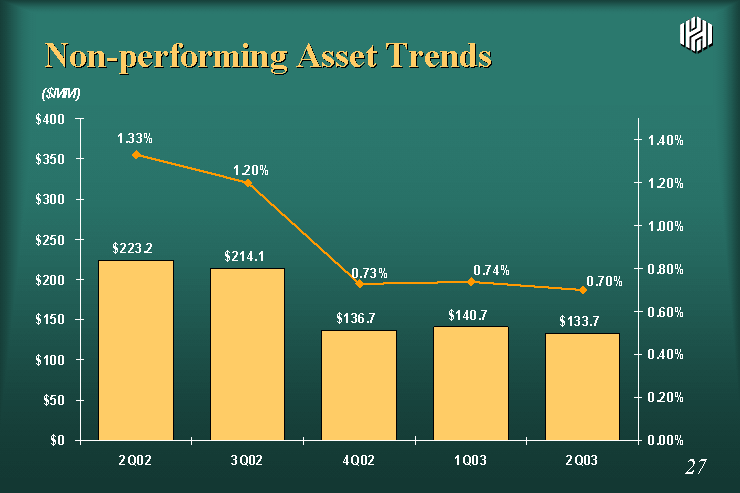
| % Lns + OREO 1Q02 225.53 0.0138 2Q02 223.237 0.0133 3Q02 214.1 0.012 4Q02 136.723 0.0073 1Q03 140.725 0.0074 2Q03 133.722 0.007 Non-performing Asset Trends ($MM) |
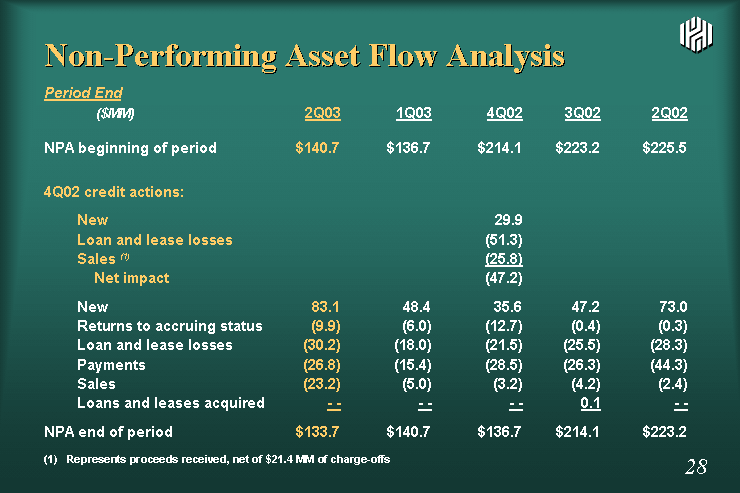
| Non-Performing Asset Flow Analysis Period End ($MM) 2Q03 1Q03 4Q02 3Q02 2Q02 NPA beginning of period $140.7 $136.7 $214.1 $223.2 $225.5 4Q02 credit actions: New 29.9 Loan and lease losses (51.3) Sales (1) (25.8) Net impact (47.2) New 83.1 48.4 35.6 47.2 73.0 Returns to accruing status (9.9) (6.0) (12.7) (0.4) (0.3) Loan and lease losses (30.2) (18.0) (21.5) (25.5) (28.3) Payments (26.8) (15.4) (28.5) (26.3) (44.3) Sales (23.2) (5.0) (3.2) (4.2) (2.4) Loans and leases acquired - - - - - - 0.1 - - NPA end of period $133.7 $140.7 $136.7 $214.1 $223.2 (1) Represents proceeds received, net of $21.4 MM of charge-offs |
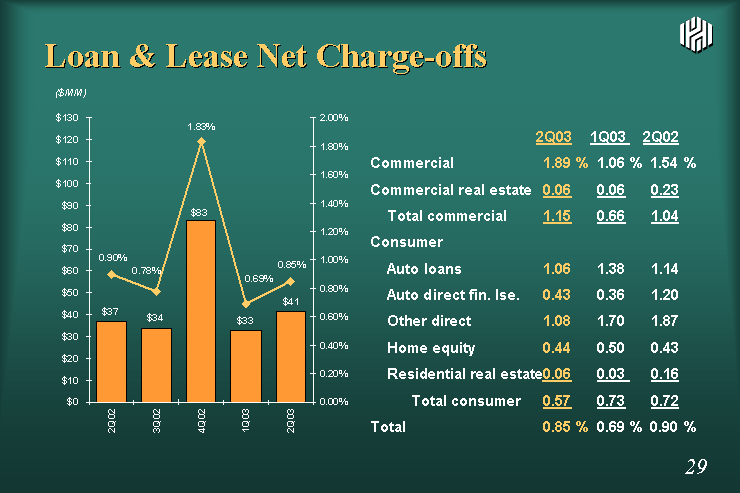
| Loan & Lease Net Charge-offs Amount Percent 1Q02 39.2 0.0092 2Q02 37 0.009 3Q02 33.8 0.0078 4Q02 83.1 0.0183 1Q03 32.8 0.0069 2Q03 41.1 0.0085 ($MM) 2Q03 1Q03 2Q02 Commercial 1.89 % 1.06 % 1.54 % Commercial real estate 0.06 0.06 0.23 Total commercial 1.15 0.66 1.04 Consumer Auto loans 1.06 1.38 1.14 Auto direct fin. lse. 0.43 0.36 1.20 Other direct 1.08 1.70 1.87 Home equity 0.44 0.50 0.43 Residential real estate 0.06 0.03 0.16 Total consumer 0.57 0.73 0.72 Total 0.85 % 0.69 % 0.90 % |
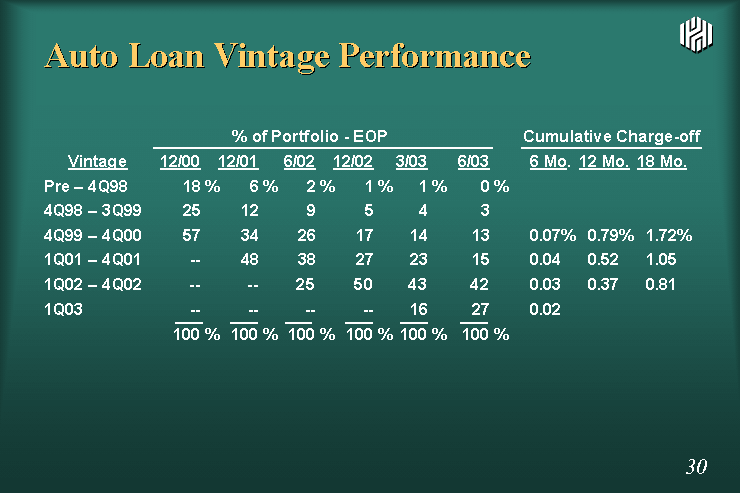
| Auto Loan Vintage Performance % of Portfolio - EOP Cumulative Charge-off Vintage 12/00 12/01 6/02 12/02 3/03 6/03 6 Mo. 12 Mo. 18 Mo. Pre - 4Q98 18 % 6 % 2 % 1 % 1 % 0 % 4Q98 - 3Q99 25 12 9 5 4 3 4Q99 - 4Q00 57 34 26 17 14 13 0.07% 0.79% 1.72% 1Q01 - 4Q01 -- 48 38 27 23 15 0.04 0.52 1.05 1Q02 - 4Q02 -- -- 25 50 43 42 0.03 0.37 0.81 1Q03 -- -- -- -- 16 27 0.02 100 % 100 % 100 % 100 % 100 % 100 % |
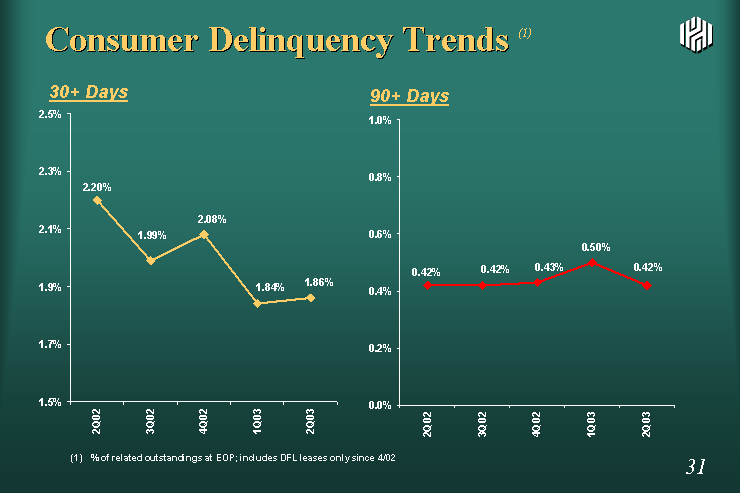
| Consumer Delinquency Trends (1) 30+ Days 1Q02 0.0233 2Q02 0.022 3Q02 0.0199 4Q02 0.0208 1Q03 0.0184 2Q03 0.0186 90+ Days 1Q02 0.0048 2Q02 0.0042 3Q02 0.0042 4Q02 0.0043 1Q03 0.005 2Q03 0.0042 (1) % of related outstandings at EOP; includes DFL leases only since 4/02 |
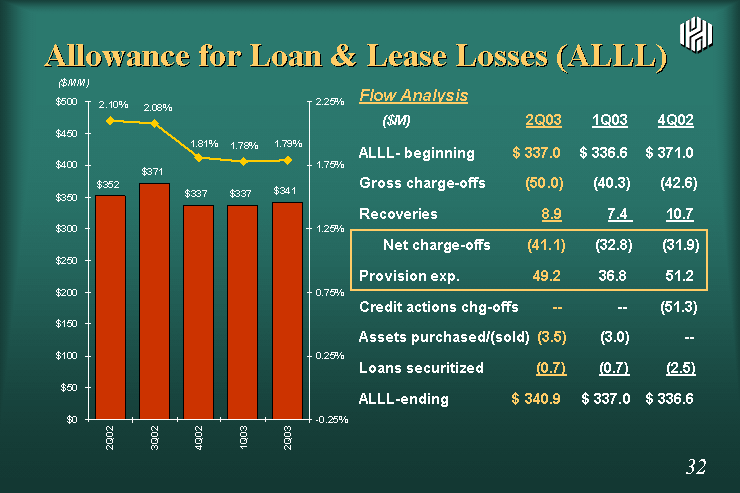
| Allowance for Loan & Lease Losses (ALLL) Flow Analysis ($M) 2Q03 1Q03 4Q02 ALLL- beginning $ 337.0 $ 336.6 $ 371.0 Gross charge-offs (50.0) (40.3) (42.6) Recoveries 8.9 7.4 10.7 Net charge-offs (41.1) (32.8) (31.9) Provision exp. 49.2 36.8 51.2 Credit actions chg-offs -- -- (51.3) Assets purchased/(sold) (3.5) (3.0) -- Loans securitized (0.7) (0.7) (2.5) ALLL-ending $ 340.9 $ 337.0 $ 336.6 Amount Percent 1Q02 340.9 0.0209 2Q02 351.7 0.021 3Q02 371 0.0208 4Q02 336.6 0.0181 1Q03 337 0.0178 2Q03 340.947 0.0179 ($MM) |
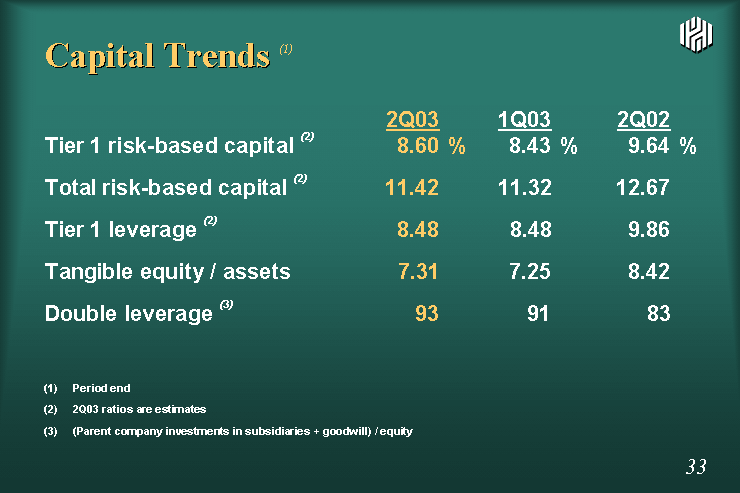
| Capital Trends (1) 2Q03 1Q03 2Q02 Tier 1 risk-based capital (2) 8.60 % 8.43 % 9.64 % Total risk-based capital (2) 11.42 11.32 12.67 Tier 1 leverage (2) 8.48 8.48 9.86 Tangible equity / assets 7.31 7.25 8.42 Double leverage (3) 93 91 83 (1) Period end (2) 2Q03 ratios are estimates (3) (Parent company investments in subsidiaries + goodwill) / equity |

| FIN 46 Implementation |
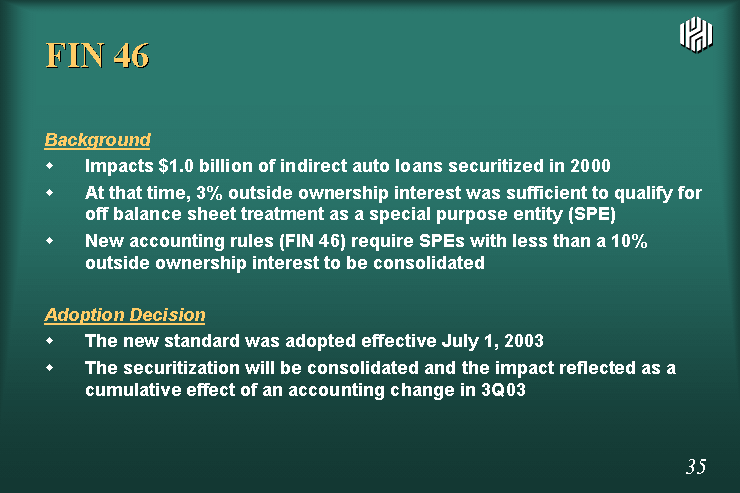
| FIN 46 Background Impacts $1.0 billion of indirect auto loans securitized in 2000 At that time, 3% outside ownership interest was sufficient to qualify for off balance sheet treatment as a special purpose entity (SPE) New accounting rules (FIN 46) require SPEs with less than a 10% outside ownership interest to be consolidated Adoption Decision The new standard was adopted effective July 1, 2003 The securitization will be consolidated and the impact reflected as a cumulative effect of an accounting change in 3Q03 |
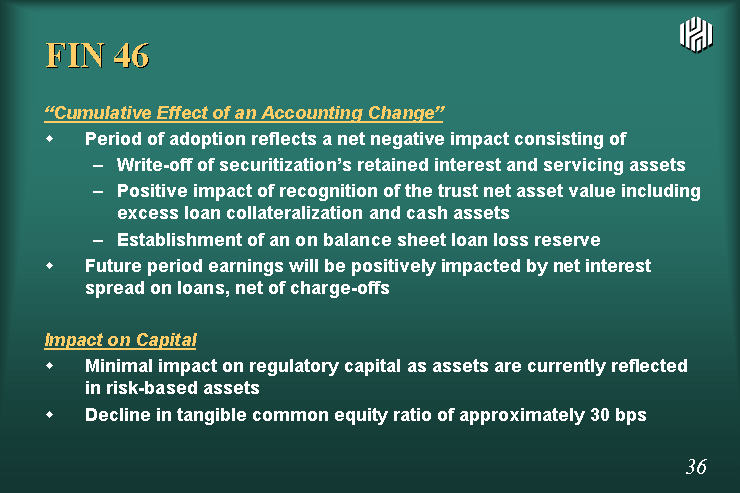
| FIN 46 "Cumulative Effect of an Accounting Change" Period of adoption reflects a net negative impact consisting of Write-off of securitization's retained interest and servicing assets Positive impact of recognition of the trust net asset value including excess loan collateralization and cash assets Establishment of an on balance sheet loan loss reserve Future period earnings will be positively impacted by net interest spread on loans, net of charge-offs Impact on Capital Minimal impact on regulatory capital as assets are currently reflected in risk-based assets Decline in tangible common equity ratio of approximately 30 bps |
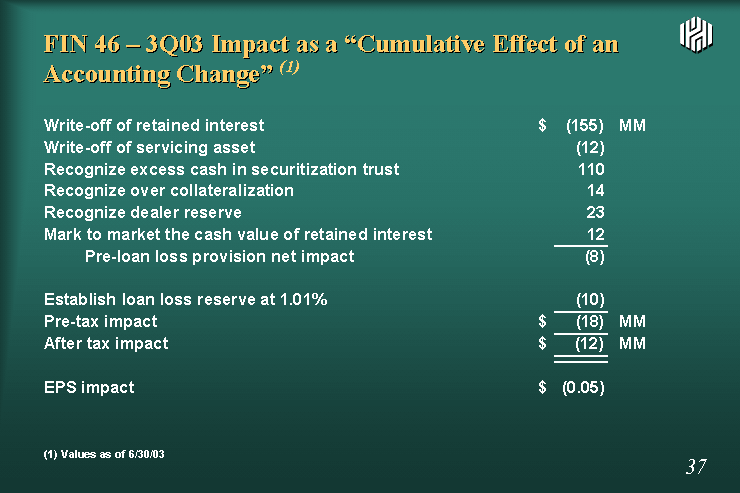
| FIN 46 - 3Q03 Impact as a "Cumulative Effect of an Accounting Change" (1) Write-off of retained interest $ (155) MM Write-off of servicing asset (12) Recognize excess cash in securitization trust 110 Recognize over collateralization 14 Recognize dealer reserve 23 Mark to market the cash value of retained interest 12 Pre-loan loss provision net impact (8) Establish loan loss reserve at 1.01% (10) Pre-tax impact $ (18) MM After tax impact $ (12) MM EPS impact $ (0.05) (1) Values as of 6/30/03 |

| 2003 Outlook |
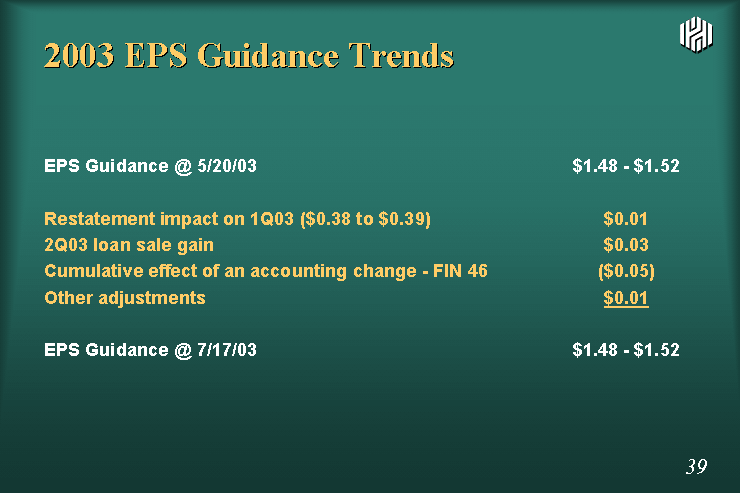
| 2003 EPS Guidance Trends EPS Guidance @ 5/20/03 $1.48 - $1.52 Restatement impact on 1Q03 ($0.38 to $0.39) $0.01 2Q03 loan sale gain $0.03 Cumulative effect of an accounting change - FIN 46 ($0.05) Other adjustments $0.01 EPS Guidance @ 7/17/03 $1.48 - $1.52 |

| PRIVATE SECURITIES LITIGATION REFORM ACT OF 1995 FORWARD LOOKING STATEMENT DISCLOSURE This presentation and discussion, including related questions and answers, may contain forward-looking statements, including certain plans, expectations, goals, and projections which are subject to numerous assumptions, risks, and uncertainties. A number of factors, including but not limited to those set forth under the heading "Business Risks" included in Item 1 of Huntington's Annual Report on Form 10-K/A for the year ended December 31, 2002, and other factors described from time to time in Huntington's other filings with the Securities and Exchange Commission, could cause actual conditions, events, or results to differ significantly from those described in the forward-looking statements. All forward-looking statements included in this discussion, including related questions and answers, are based on information available at the time of the discussion. Huntington assumes no obligation to update any forward-looking statement. |

| Appendix |
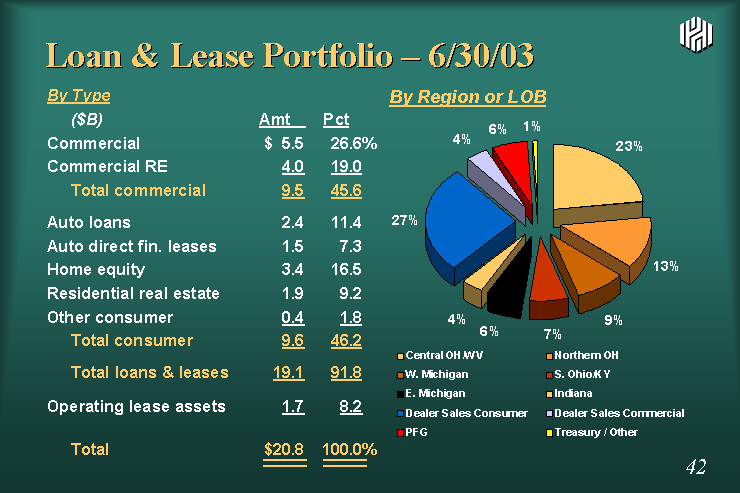
| Loan & Lease Portfolio - 6/30/03 By Type ($B) Amt Pct Commercial $ 5.5 26.6% Commercial RE 4.0 19.0 Total commercial 9.5 45.6 Auto loans 2.4 11.4 Auto direct fin. leases 1.5 7.3 Home equity 3.4 16.5 Residential real estate 1.9 9.2 Other consumer 0.4 1.8 Total consumer 9.6 46.2 Total loans & leases 19.1 91.8 Operating lease assets 1.7 8.2 Total $20.8 100.0% By Region or LOB 1Q03 Central OH/WV 0.23 Northern OH 0.13 W. Michigan 0.09 S. Ohio/KY 0.07 E. Michigan 0.06 Indiana 0.038 Dealer Sales Consumer 0.27 Dealer Sales Commercial 0.04 PFG 0.062 Treasury / Other 0.009 |
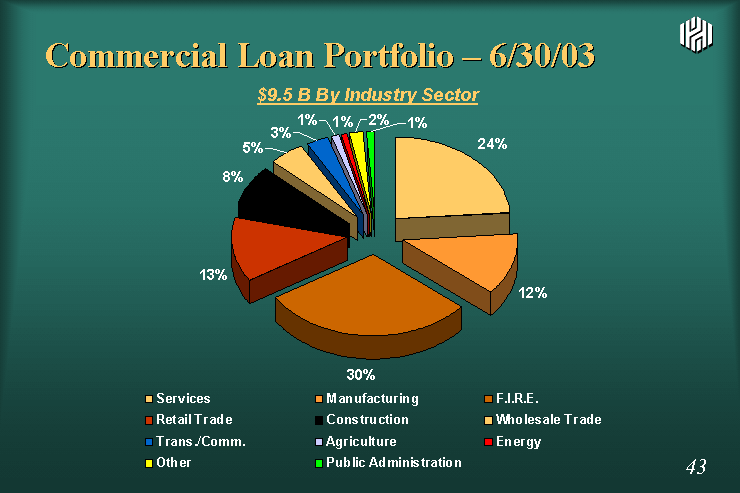
| Commercial Loan Portfolio - 6/30/03 $9.5 B By Industry Sector Services 0.24 Manufacturing 0.12 F.I.R.E. 0.3 Retail Trade 0.13 Construction 0.08 Wholesale Trade 0.05 Trans./Comm. 0.03 Agriculture 0.01 Energy 0.01 Other 0.02 Public Administration 0.01 |
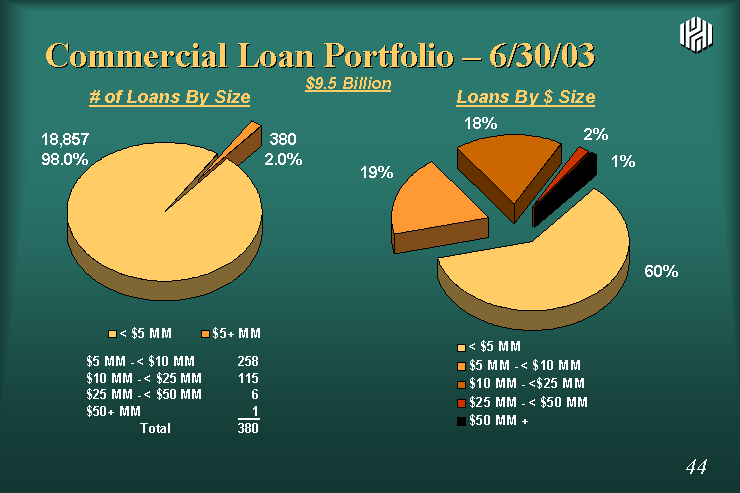
| < $5 MM 18785 $5+ MM 370 $5 MM - < $10 MM 258 $10 MM - < $25 MM 115 $25 MM - < $50 MM 6 $50+ MM 1 Total 380 < $5 MM 0.6 $5 MM - < $10 MM 0.19 $10 MM - <$25 MM 0.18 $25 MM - < $50 MM 0.02 $50 MM + 0.01 Commercial Loan Portfolio - 6/30/03 # of Loans By Size 18,857 98.0% 380 2.0% Loans By $ Size 60% 2% $9.5 Billion 19% 18% 1% |
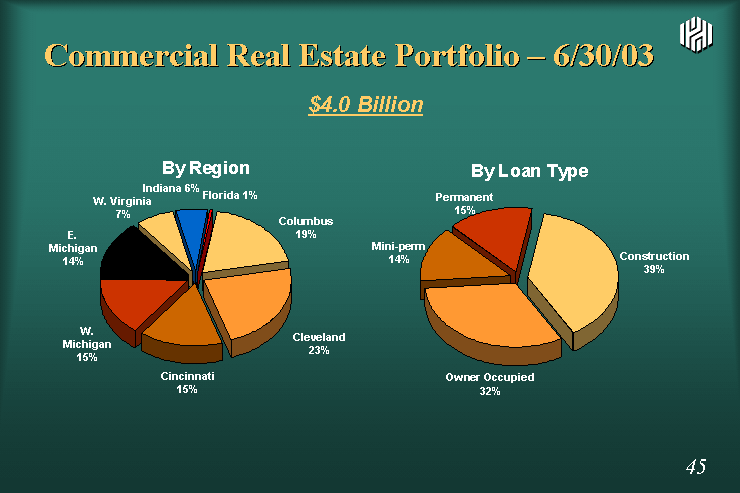
| Columbus Cleveland Cincinnati W. MI E. MI WV ID FL 0.191 0.23 0.154 0.15 0.14 0.07 0.058 0.006 Commercial Real Estate Portfolio - 6/30/03 Construction Owner Occupied Mini-Perm Permanent 0.389 0.32 0.14 0.152 Cincinnati 15% Columbus 19% W. Michigan 15% E. Michigan 14% W. Virginia 7% Indiana 6% Cleveland 23% Permanent 15% Mini-perm 14% Owner Occupied 32% Construction 39% $4.0 Billion Florida 1% |
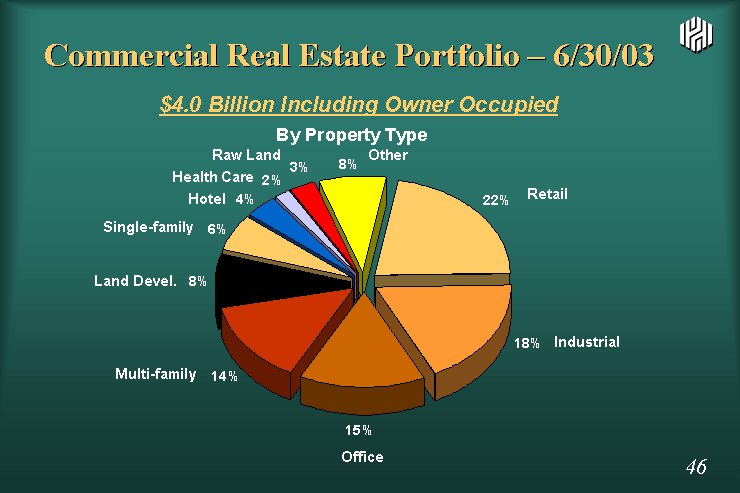
| Commercial Real Estate Portfolio - 6/30/03 Retail Industrial Office Multifamily Land Devel Single-family Hotel Health Care Raw Land Other 0.22 0.18 0.15 0.14 0.08 0.06 0.04 0.02 0.03 0.08 Retail Industrial Office Multi-family Land Devel. Hotel Single-family Health Care Other $4.0 Billion Including Owner Occupied Raw Land |
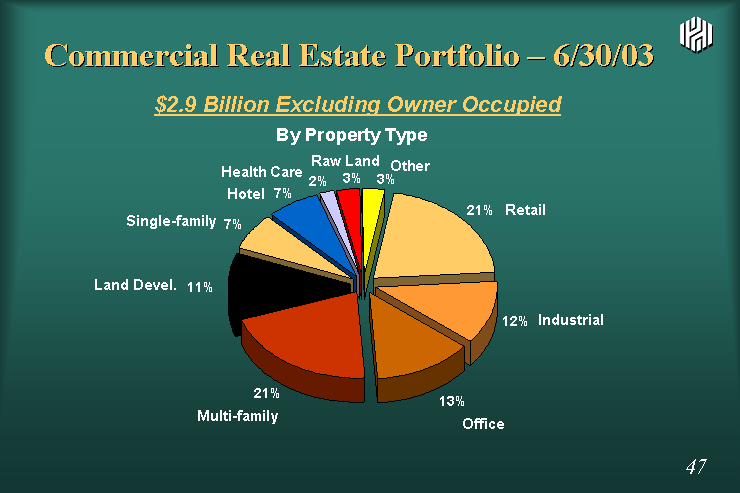
| Commercial Real Estate Portfolio - 6/30/03 Retail Industrial Office Multifamily Land Devel Single-family Hotel Health Care Raw Land Other 0.21 0.12 0.13 0.21 0.11 0.07 0.07 0.02 0.03 0.03 Retail Industrial Office Multi-family Land Devel. Hotel Single-family Health Care Other $2.9 Billion Excluding Owner Occupied Raw Land |
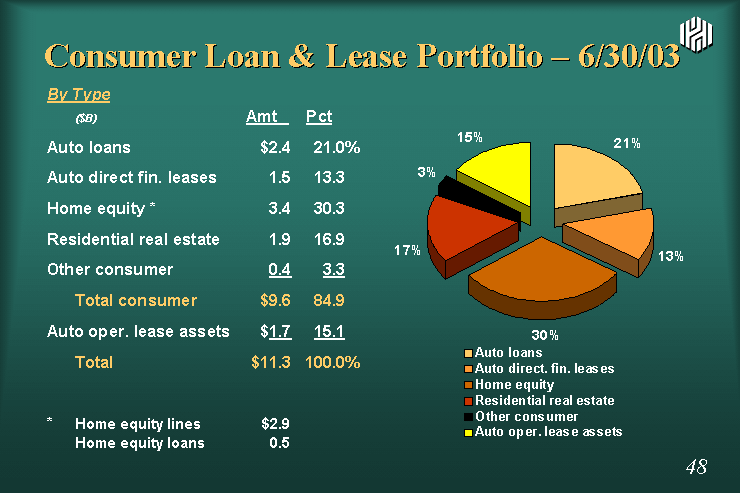
| Consumer Loan & Lease Portfolio - 6/30/03 By Type ($B) Amt Pct Auto loans $2.4 21.0% Auto direct fin. leases 1.5 13.3 Home equity * 3.4 30.3 Residential real estate 1.9 16.9 Other consumer 0.4 3.3 Total consumer $9.6 84.9 Auto oper. lease assets $1.7 15.1 Total $11.3 100.0% * Home equity lines $2.9 Home equity loans 0.5 1Q03 Auto loans 0.21 Auto direct. fin. leases 0.13 Home equity 0.3 Residential real estate 0.17 Other consumer 0.03 Auto oper. lease assets 0.15 |
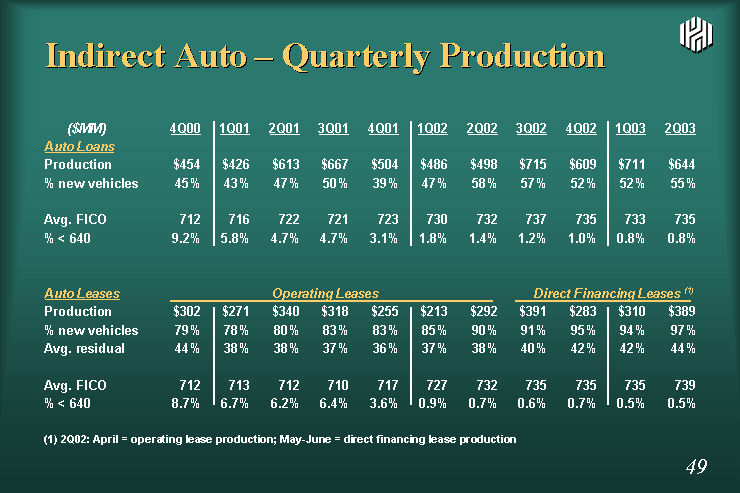
| Indirect Auto - Quarterly Production ($MM) 4Q00 1Q01 2Q01 3Q01 4Q01 1Q02 2Q02 3Q02 4Q02 1Q03 2Q03 Auto Loans Production $454 $426 $613 $667 $504 $486 $498 $715 $609 $711 $644 % new vehicles 45% 43% 47% 50% 39% 47% 58% 57% 52% 52% 55% Avg. FICO 712 716 722 721 723 730 732 737 735 733 735 % < 640 9.2% 5.8% 4.7% 4.7% 3.1% 1.8% 1.4% 1.2% 1.0% 0.8% 0.8% Auto Leases Operating Leases Direct Financing Leases (1) Production $302 $271 $340 $318 $255 $213 $292 $391 $283 $310 $389 % new vehicles 79% 78% 80% 83% 83% 85% 90% 91% 95% 94% 97% Avg. residual 44% 38% 38% 37% 36% 37% 38% 40% 42% 42% 44% Avg. FICO 712 713 712 710 717 727 732 735 735 735 739 % < 640 8.7% 6.7% 6.2% 6.4% 3.6% 0.9% 0.7% 0.6% 0.7% 0.5% 0.5% (1) 2Q02: April = operating lease production; May-June = direct financing lease production |
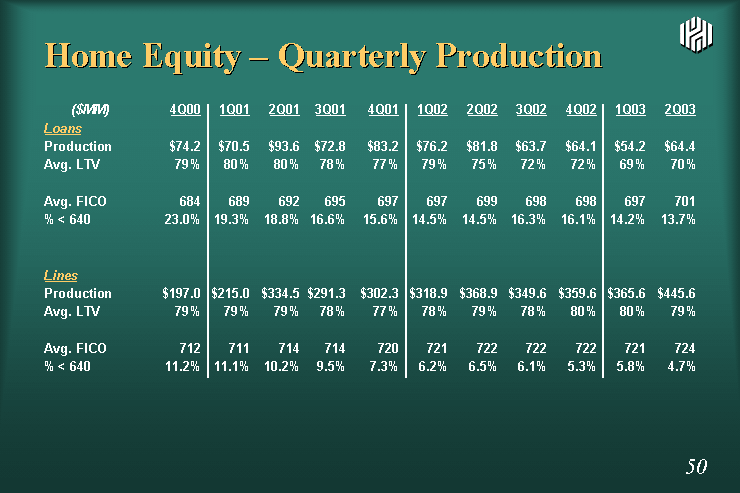
| Home Equity - Quarterly Production ($MM) 4Q00 1Q01 2Q01 3Q01 4Q01 1Q02 2Q02 3Q02 4Q02 1Q03 2Q03 Loans Production $74.2 $70.5 $93.6 $72.8 $83.2 $76.2 $81.8 $63.7 $64.1 $54.2 $64.4 Avg. LTV 79% 80% 80% 78% 77% 79% 75% 72% 72% 69% 70% Avg. FICO 684 689 692 695 697 697 699 698 698 697 701 % < 640 23.0% 19.3% 18.8% 16.6% 15.6% 14.5% 14.5% 16.3% 16.1% 14.2% 13.7% Lines Production $197.0 $215.0 $334.5 $291.3 $302.3 $318.9 $368.9 $349.6 $359.6 $365.6 $445.6 Avg. LTV 79% 79% 79% 78% 77% 78% 79% 78% 80% 80% 79% Avg. FICO 712 711 714 714 720 721 722 722 722 721 724 % < 640 11.2% 11.1% 10.2% 9.5% 7.3% 6.2% 6.5% 6.1% 5.3% 5.8% 4.7% |
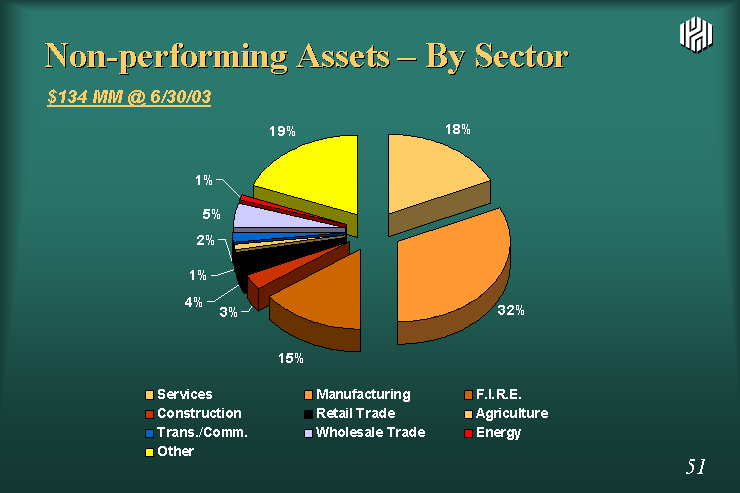
| Non-performing Assets - By Sector Services 0.18 Manufacturing 0.32 F.I.R.E. 0.15 Construction 0.03 Retail Trade 0.04 Agriculture 0.01 Trans./Comm. 0.02 Wholesale Trade 0.05 Energy 0.01 Other 0.19 $134 MM @ 6/30/03 |
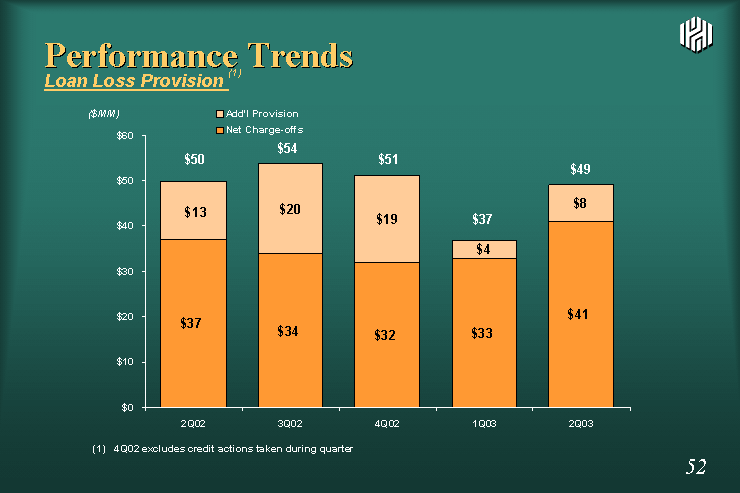
| Performance Trends Loan Loss Provision (1) (1) 4Q02 excludes credit actions taken during quarter Net Charge-offs Add'l Provision 1Q02 43 -4 2Q02 37 12.9 3Q02 33.8 20 4Q02 31.9 19.3 1Q03 33 3.9 2Q03 41.056 8.137 ($MM) $50 $54 $51 $37 $49 |
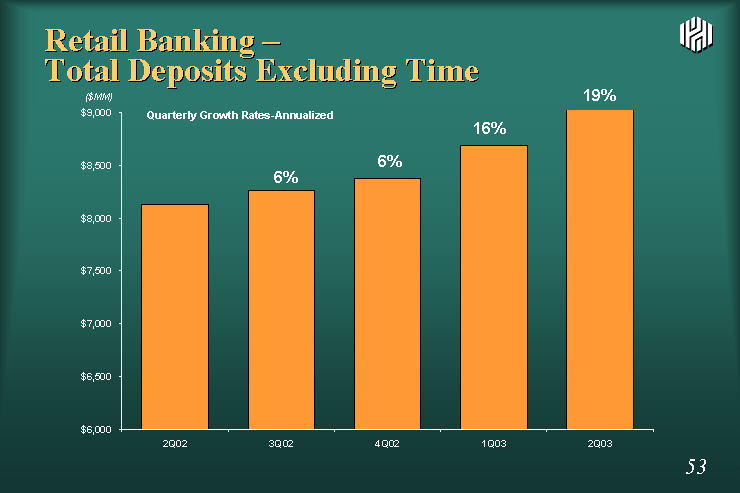
| Retail Banking - Total Deposits Excluding Time 1Q01 2Q01 3Q01 4Q01 1Q02 2Q02 3Q02 4Q02 1Q03 2Q03 Total corporate excluding MMA 7014 7179 7343 7576 7803 8131 8260 8374 8689 9108 6% ($MM) 6% Quarterly Growth Rates-Annualized 16% 19% |
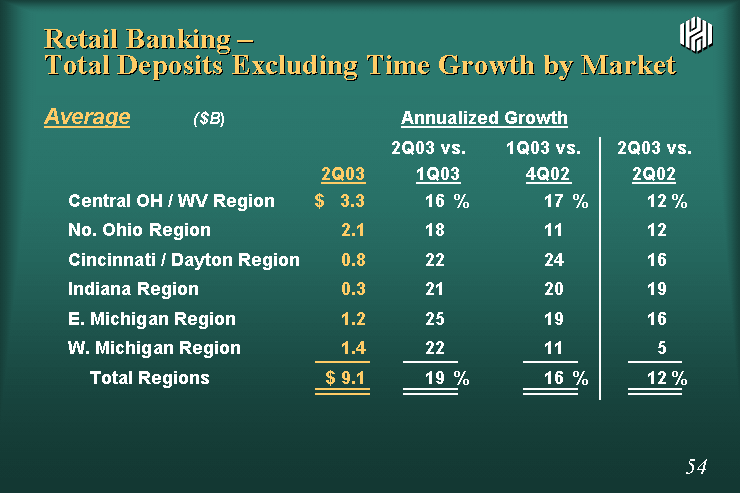
| Retail Banking - Total Deposits Excluding Time Growth by Market Average ($B) Annualized Growth 2Q03 vs. 1Q03 vs. 2Q03 vs. 2Q03 1Q03 4Q02 2Q02 Central OH / WV Region $ 3.3 16 % 17 % 12 % No. Ohio Region 2.1 18 11 12 Cincinnati / Dayton Region 0.8 22 24 16 Indiana Region 0.3 21 20 19 E. Michigan Region 1.2 25 19 16 W. Michigan Region 1.4 22 11 5 Total Regions $ 9.1 19 % 16 % 12 % |
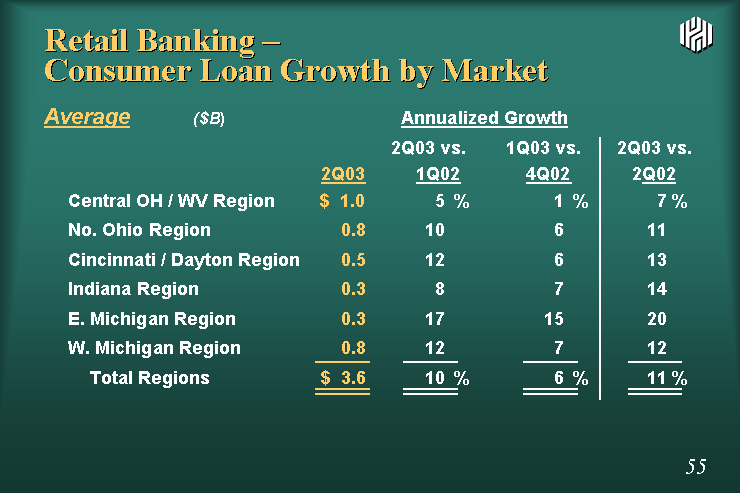
| Retail Banking - Consumer Loan Growth by Market Average ($B) Annualized Growth 2Q03 vs. 1Q03 vs. 2Q03 vs. 2Q03 1Q02 4Q02 2Q02 Central OH / WV Region $ 1.0 5 % 1 % 7 % No. Ohio Region 0.8 10 6 11 Cincinnati / Dayton Region 0.5 12 6 13 Indiana Region 0.3 8 7 14 E. Michigan Region 0.3 17 15 20 W. Michigan Region 0.8 12 7 12 Total Regions $ 3.6 10 % 6 % 11 % |
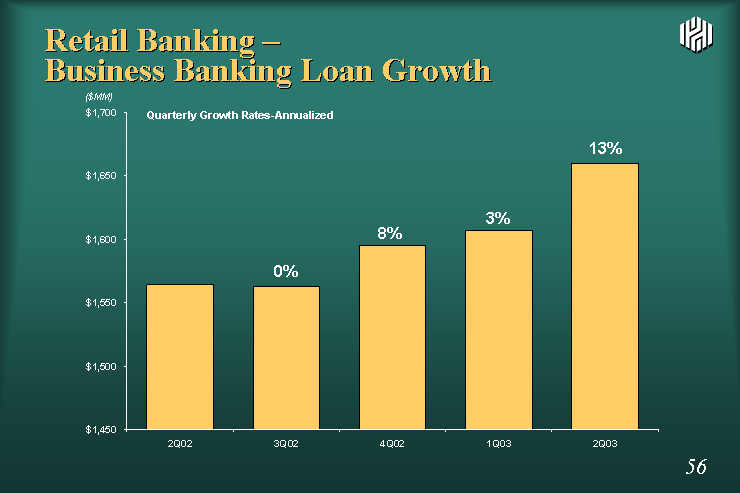
| Retail Banking - Business Banking Loan Growth 1Q01 2Q01 3Q01 4Q01 1Q02 2Q02 3Q02 4Q02 1Q03 2Q03 Total corporate excluding MMA 1537 1532 1509 1522 1552 1564 1563 1595 1607 1660 8% ($MM) 0% Quarterly Growth Rates-Annualized 3% 13% |
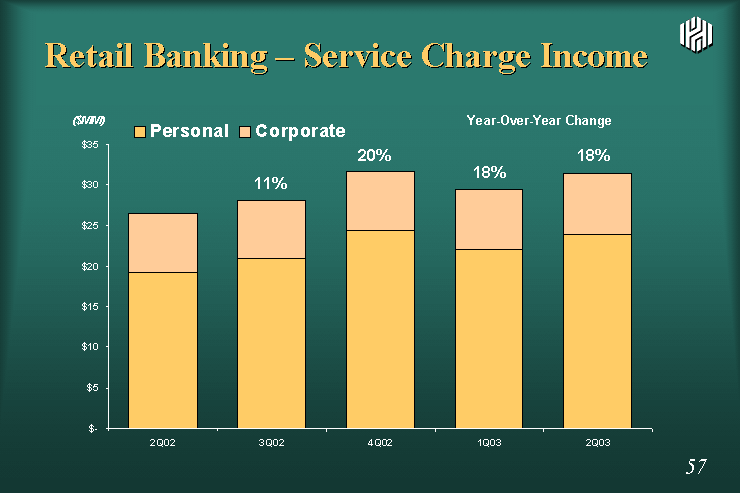
| Retail Banking - Service Charge Income 1Q01 2Q01 3Q01 4Q01 1Q02 2Q02 3Q02 4Q02 1Q03 2Q03 Personal 17.812 18.906 18.631 19.589 17.757 19.216 20.926 24.334 22.1 23.9 Corporate 6.318 6.569 6.775 6.793 7.128 7.269 7.155 7.255 7.3 7.5 20% ($MM) 11% Year-Over-Year Change 18% 18% |
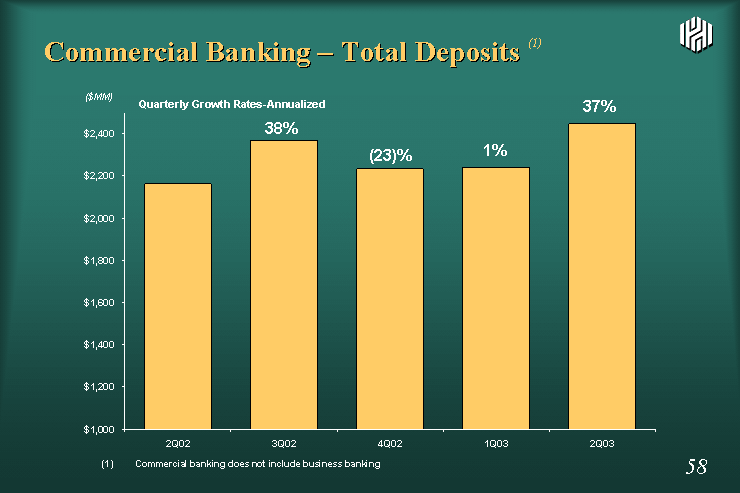
| Commercial Banking - Total Deposits (1) 2Q01 3Q01 4Q01 1Q02 2Q02 3Q02 4Q02 1Q03 2Q03 Total corporate excluding MMA 1850.3 1932.9 1941.6 1971.5 2163.2 2369.1 2235.2 2241.6 2446.92 (23)% ($MM) 38% Quarterly Growth Rates-Annualized 1% (1) Commercial banking does not include business banking 37% |
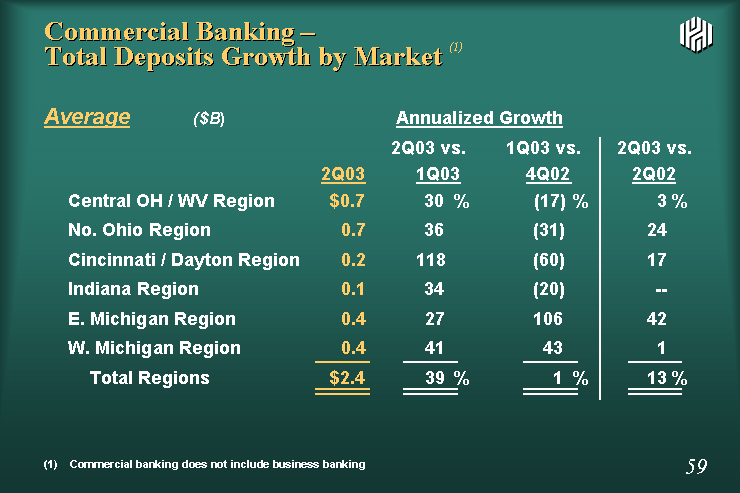
| Commercial Banking - Total Deposits Growth by Market (1) Average ($B) Annualized Growth 2Q03 vs. 1Q03 vs. 2Q03 vs. 2Q03 1Q03 4Q02 2Q02 Central OH / WV Region $0.7 30 % (17) % 3 % No. Ohio Region 0.7 36 (31) 24 Cincinnati / Dayton Region 0.2 118 (60) 17 Indiana Region 0.1 34 (20) -- E. Michigan Region 0.4 27 106 42 W. Michigan Region 0.4 41 43 1 Total Regions $2.4 39 % 1 % 13 % (1) Commercial banking does not include business banking |
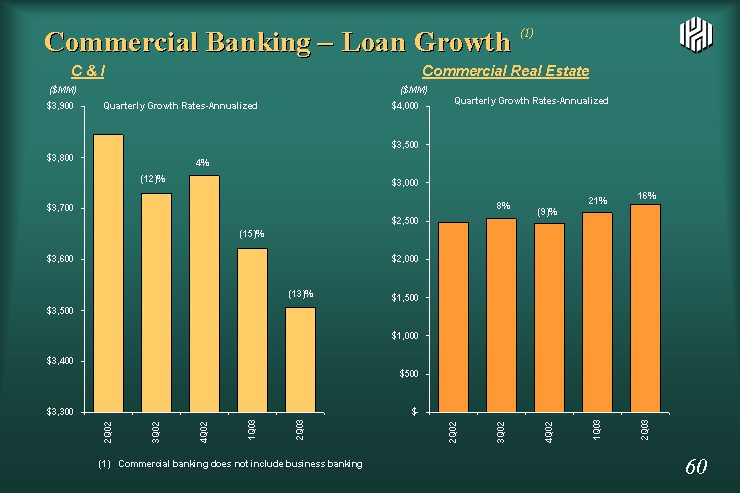
| 1Q01 2Q01 3Q01 4Q01 1Q02 2Q02 3Q02 4Q02 1Q03 2Q03 2216903957 2318488027 2403399725 2449714775 2480033613 2526890576 2471908987 2605663927 2713104825 Commercial Banking - Loan Growth (1) 2Q01 3Q01 4Q01 1Q02 2Q02 3Q02 4Q02 1Q03 2Q03 C&I 4130968773 4211823376 4120572245 3982184947 3843323332 3730010968 3763292794 3621503938 3506465237 C & I Commercial Real Estate Quarterly Growth Rates-Annualized Quarterly Growth Rates-Annualized ($MM) ($MM) (12)% 4% (15)% 8% (9)% 21% (1) Commercial banking does not include business banking (13)% 16% |
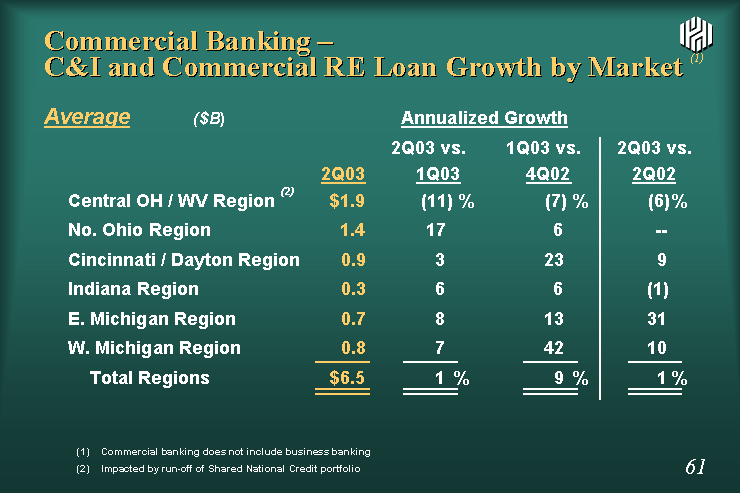
| Commercial Banking - C&I and Commercial RE Loan Growth by Market (1) Average ($B) Annualized Growth 2Q03 vs. 1Q03 vs. 2Q03 vs. 2Q03 1Q03 4Q02 2Q02 Central OH / WV Region (2) $1.9 (11) % (7) % (6) % No. Ohio Region 1.4 17 6 -- Cincinnati / Dayton Region 0.9 3 23 9 Indiana Region 0.3 6 6 (1) E. Michigan Region 0.7 8 13 31 W. Michigan Region 0.8 7 42 10 Total Regions $6.5 1 % 9 % 1 % (1) Commercial banking does not include business banking (2) Impacted by run-off of Shared National Credit portfolio |
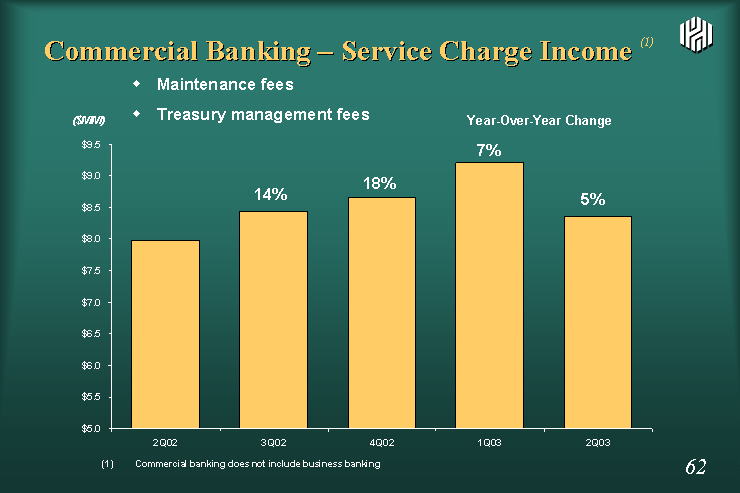
| 1Q01 2Q01 3Q01 4Q01 1Q02 2Q02 3Q02 4Q02 1Q03 2Q03 Svc Chgs 17.812 6458966 7403466 7360399 8582637 7977019 8432256 8659132 9209259 8350772 Commercial Banking - Service Charge Income (1) ($MM) Year-Over-Year Change 14% 18% 7% (1) Commercial banking does not include business banking Maintenance fees Treasury management fees 5% |
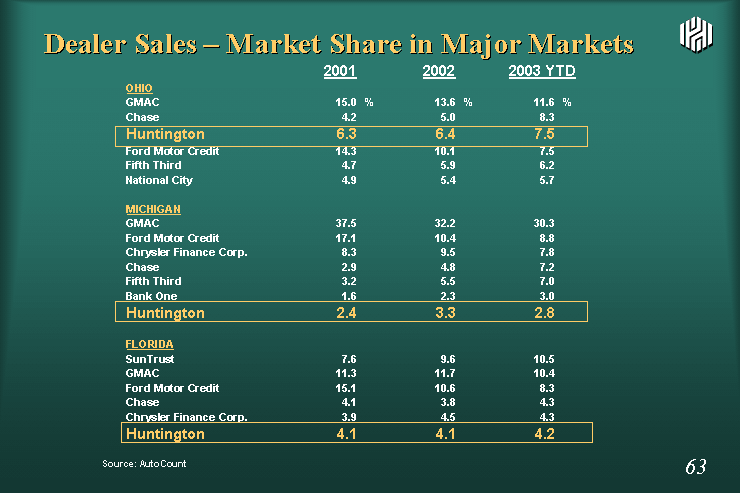
| Dealer Sales - Market Share in Major Markets 2001 2002 2003 YTD OHIO GMAC 15.0 % 13.6 % 11.6 % Chase 4.2 5.0 8.3 Huntington 6.3 6.4 7.5 Ford Motor Credit 14.3 10.1 7.5 Fifth Third 4.7 5.9 6.2 National City 4.9 5.4 5.7 MICHIGAN GMAC 37.5 32.2 30.3 Ford Motor Credit 17.1 10.4 8.8 Chrysler Finance Corp. 8.3 9.5 7.8 Chase 2.9 4.8 7.2 Fifth Third 3.2 5.5 7.0 Bank One 1.6 2.3 3.0 Huntington 2.4 3.3 2.8 FLORIDA SunTrust 7.6 9.6 10.5 GMAC 11.3 11.7 10.4 Ford Motor Credit 15.1 10.6 8.3 Chase 4.1 3.8 4.3 Chrysler Finance Corp. 3.9 4.5 4.3 Huntington 4.1 4.1 4.2 Source: AutoCount |

| Dealer Sales - Auto Industry Vehicle Sales (Number of Units) 2Q03 2Q02 % Change New and used vehicle sales* (retail) 16.7 MM 16.4 MM 1.8% Huntington vehicles financed 45,900 38,000 20.8% 2003 Full-year Industry Assumptions * New and used vehicle sales (retail) Flat @ New vehicle sales 16.0 to 16.5 MM Used vehicle sales 42.0 to 45.0 MM Huntington vehicles financed 2003 = 193,000 est 2002 = 168,000 2001 = 168,000 * Source: JD Powers and Wall Street Journal |
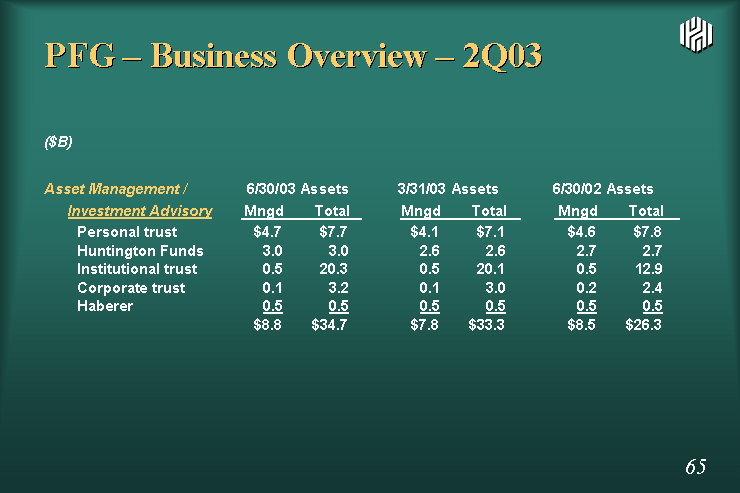
| PFG - Business Overview - 2Q03 ($B) Asset Management / 6/30/03 Assets 3/31/03 Assets 6/30/02 Assets Investment Advisory Mngd Total Mngd Total Mngd Total Personal trust $4.7 $7.7 $4.1 $7.1 $4.6 $7.8 Huntington Funds 3.0 3.0 2.6 2.6 2.7 2.7 Institutional trust 0.5 20.3 0.5 20.1 0.5 12.9 Corporate trust 0.1 3.2 0.1 3.0 0.2 2.4 Haberer 0.5 0.5 0.5 0.5 0.5 0.5 $8.8 $34.7 $7.8 $33.3 $8.5 $26.3 |
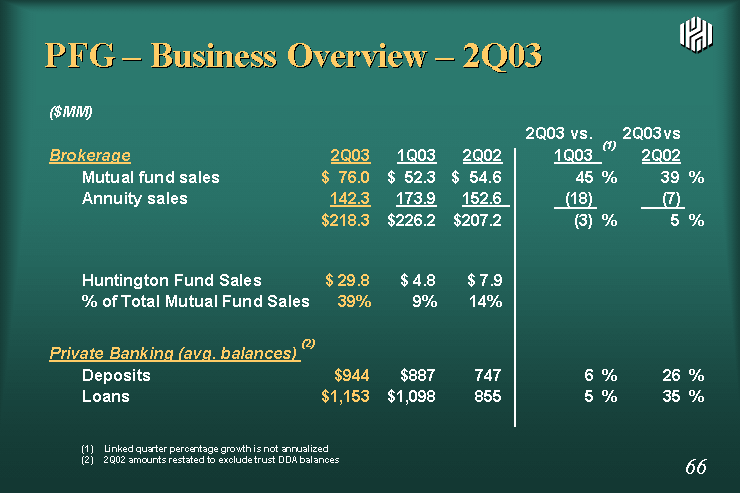
| PFG - Business Overview - 2Q03 ($MM) 2Q03 vs. 2Q03vs Brokerage 2Q03 1Q03 2Q02 1Q03 (1) 2Q02 Mutual fund sales $ 76.0 $ 52.3 $ 54.6 45 % 39 % Annuity sales 142.3 173.9 152.6 (18) (7) $218.3 $226.2 $207.2 (3) % 5 % Huntington Fund Sales $ 29.8 $ 4.8 $ 7.9 % of Total Mutual Fund Sales 39% 9% 14% Private Banking (avg. balances) (2) Deposits $944 $887 747 6 % 26 % Loans $1,153 $1,098 855 5 % 35 % (1) Linked quarter percentage growth is not annualized (2) 2Q02 amounts restated to exclude trust DDA balances |
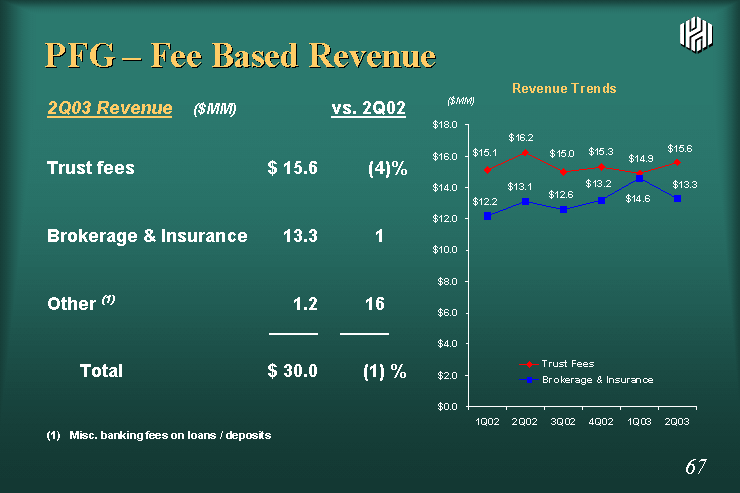
| 2Q03 Revenue ($MM) vs. 2Q02 Trust fees $ 15.6 (4)% Brokerage & Insurance 13.3 1 Other (1) 1.2 16 Total $ 30.0 (1) % (1) Misc. banking fees on loans / deposits PFG - Fee Based Revenue Trust Fees Brokerage & Insurance 1Q01 13.7 10.9 2Q01 14.4 11.1 3Q01 14.8 9.5 4Q01 14.7 12.7 1Q02 15.1 12.2 2Q02 16.2 13.1 3Q02 15 12.6 4Q02 15.3 13.2 1Q03 14.9 14.6 2Q03 15.6 13.3 ($MM) |
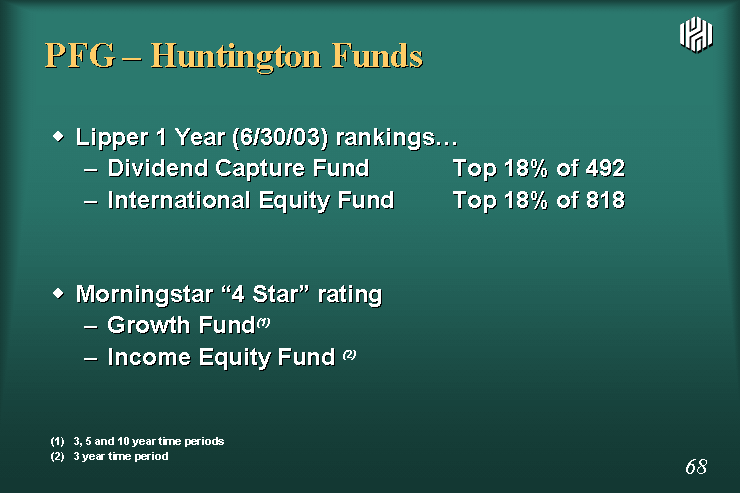
| PFG - Huntington Funds Lipper 1 Year (6/30/03) rankings... Dividend Capture Fund Top 18% of 492 International Equity Fund Top 18% of 818 Morningstar "4 Star" rating Growth Fund(1) Income Equity Fund (2) (1) 3, 5 and 10 year time periods (2) 3 year time period |
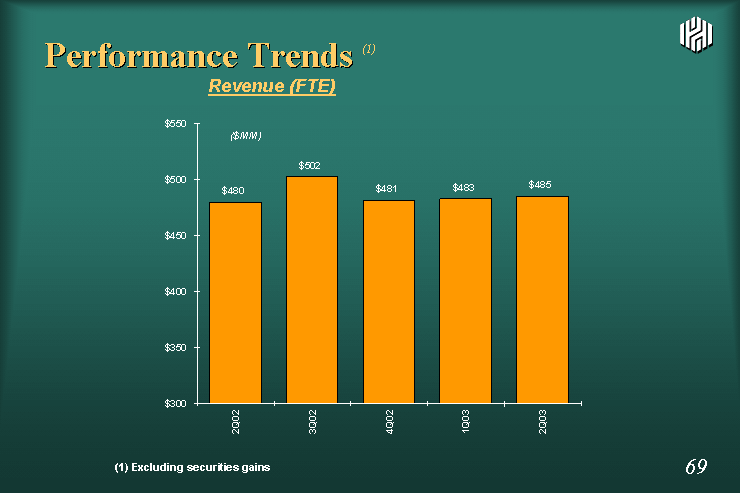
| Performance Trends (1) (1) Excluding securities gains Revenue (FTE) Amount 1Q02 488.9 2Q02 479.764 3Q02 502.134 4Q02 481.26 1Q03 482.665 2Q03 484.973 ($MM) |
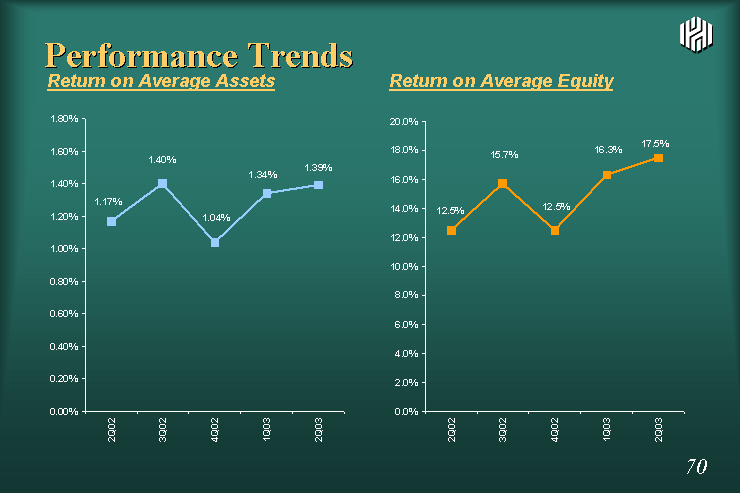
| Performance Trends Return on Average Assets Return on Average Equity Amount 1Q02 0.0142 2Q02 0.0117 3Q02 0.014 4Q02 0.0104 1Q03 0.0134 2Q03 0.0139 Return on Common Equity 1Q02 0.158 2Q02 0.125 3Q02 0.157 4Q02 0.125 1Q03 0.163 2Q03 0.175 |

| Share Repurchase Program February 2002 Authorization - 22 million shares Repurchased 19.4 million shares... $374 million Quarter YTD 1Q02 1.5 MM 1.5 MM 2Q02 7.3 8.8 3Q02 6.2 15.0 4Q02 4.2 19.2 1Q03 0.2 19.4 January 2003 Authorization - 8 million shares Repurchased 4.1 million shares... $77 million Quarter YTD 1Q03 4.1 MM 4.1 MM 2Q03 - - 4.1 |
