EXHIBIT 99.3
Published on January 24, 2003

| Fourth Quarter Earnings Review January 16, 2003 Exhibit 99.3 |

| Meeting Participants Tom Hoaglin Chairman, President and Chief Executive Officer Mike McMennamin Vice Chairman and Chief Financial Officer Jay Gould Sr. Vice President - Investor Relations |
| Basis of Presentation Operating Basis Reported results since the 2001 second quarter have been significantly impacted by a number of items, primarily related to the strategic restructuring announced in July 2001 and the subsequent sale of the Florida banking operations in the 2002 first quarter. In addition, reported 2002 first quarter results included Florida operations for only half the quarter versus a full quarter for each prior quarter. Also, the 2002 third quarter included a gain from the restructuring of the Merchant Services business. Therefore, to better understand underlying trends, the following slides and discussion are on an operating basis, unless otherwise noted, which excludes the effect of these items from all prior periods, including the impact of the Florida operations. Please refer to the schedules accompanying the 2002 fourth quarter earnings press release, as well as the 2002 fourth quarter Quarterly Financial Review for schedules reconciling reported earnings with operating earnings and additional schedules excluding the impact of the Florida operations. Rounding Please note that columns of data in the following slides may not add due to rounding. |
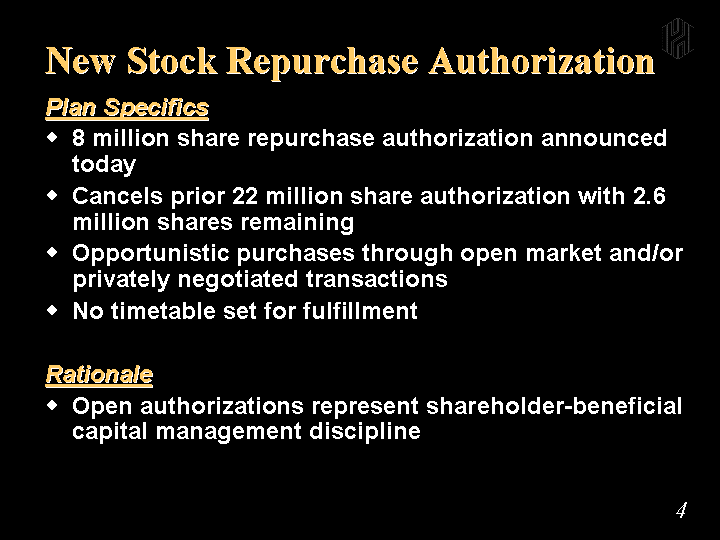
| New Stock Repurchase Authorization Plan Specifics 8 million share repurchase authorization announced today Cancels prior 22 million share authorization with 2.6 million shares remaining Opportunistic purchases through open market and/or privately negotiated transactions No timetable set for fulfillment Rationale Open authorizations represent shareholder-beneficial capital management discipline |
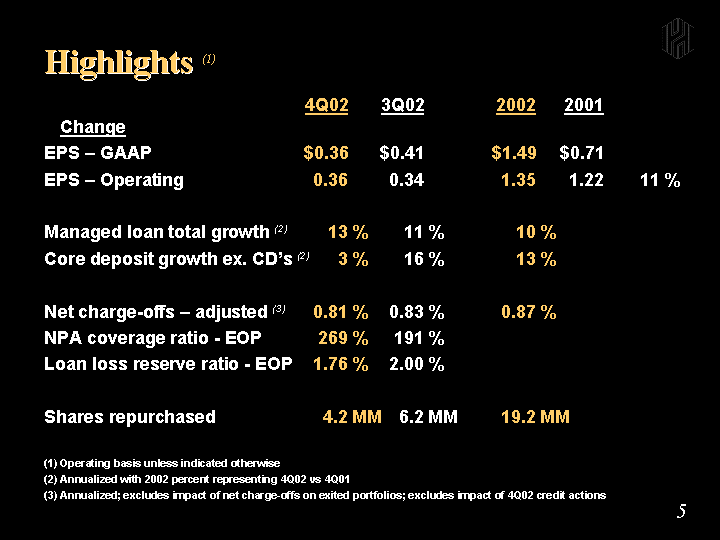
| Highlights (1) 4Q02 3Q02 2002 2001 Change EPS - GAAP $0.36 $0.41 $1.49 $0.71 EPS - Operating 0.36 0.34 1.35 1.22 11 % Managed loan total growth (2) 13 % 11 % 10 % Core deposit growth ex. CD's (2) 3 % 16 % 13 % Net charge-offs - adjusted (3) 0.81 % 0.83 % 0.87 % NPA coverage ratio - EOP 269 % 191 % Loan loss reserve ratio - EOP 1.76 % 2.00 % Shares repurchased 4.2 MM 6.2 MM 19.2 MM (1) Operating basis unless indicated otherwise (2) Annualized with 2002 percent representing 4Q02 vs 4Q01 (3) Annualized; excludes impact of net charge-offs on exited portfolios; excludes impact of 4Q02 credit actions |
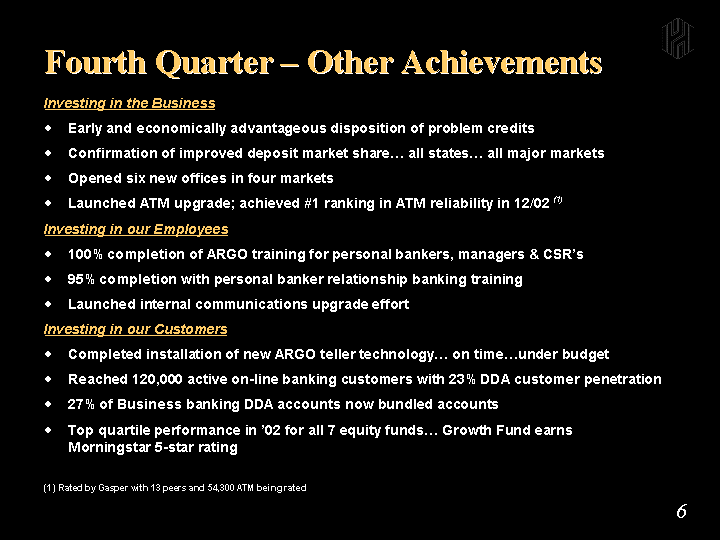
| Fourth Quarter - Other Achievements Investing in the Business Early and economically advantageous disposition of problem credits Confirmation of improved deposit market share... all states... all major markets Opened six new offices in four markets Launched ATM upgrade; achieved #1 ranking in ATM reliability in 12/02 (1) Investing in our Employees 100% completion of ARGO training for personal bankers, managers & 8 95% completion with personal banker relationship banking training Launched internal communications upgrade effort Investing in our Customers Completed installation of new ARGO teller technology... on time...under budget Reached 120,000 active on-line banking customers with 23% DDA customer penetration 27% of Business banking DDA accounts now bundled accounts Top quartile performance in '02 for all 7 equity funds... Growth Fund earns Morningstar 5-star rating (1) Rated by Gasper with 13 peers and 54,300 ATM being rated |
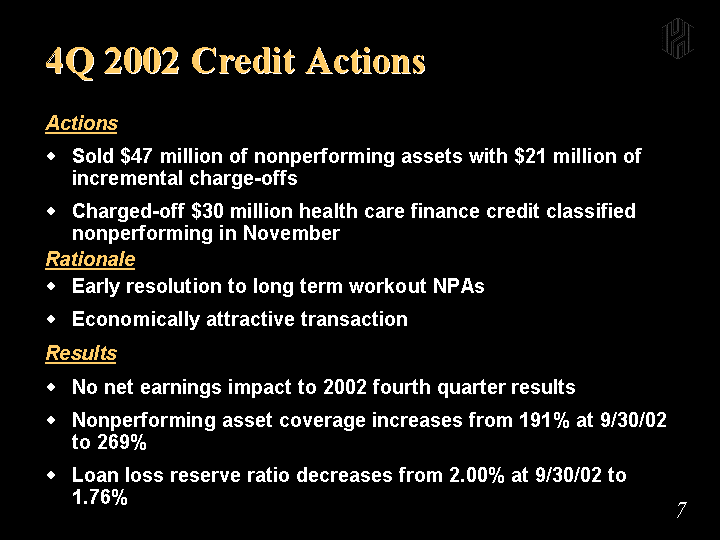
| 4Q 2002 Credit Actions Actions Sold $47 million of nonperforming assets with $21 million of incremental charge-offs Charged-off $30 million health care finance credit classified nonperforming in November Rationale Early resolution to long term workout NPAs Economically attractive transaction Results No net earnings impact to 2002 fourth quarter results Nonperforming asset coverage increases from 191% at 9/30/02 to 269% Loan loss reserve ratio decreases from 2.00% at 9/30/02 to 1.76% |

| Financial Performance |
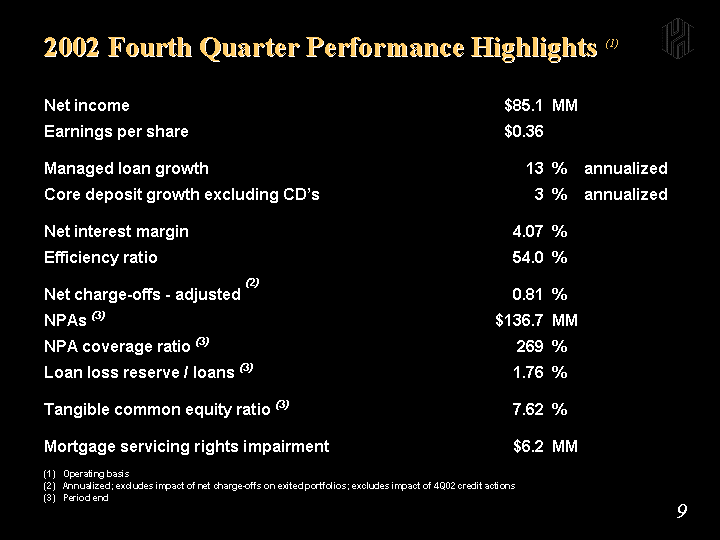
| 2002 Fourth Quarter Performance Highlights (1) Net income $85.1 MM Earnings per share $0.36 Managed loan growth 13 % annualized Core deposit growth excluding CD's 3 % annualized Net interest margin 4.07 % Efficiency ratio 54.0 % Net charge-offs - adjusted (2) 0.81 % NPAs (3) $136.7 MM NPA coverage ratio (3) 269 % Loan loss reserve / loans (3) 1.76 % Tangible common equity ratio (3) 7.62 % Mortgage servicing rights impairment $6.2 MM (1) Operating basis (2) Annualized; excludes impact of net charge-offs on exited portfolios; excludes impact of 4Q02 credit actions (3) Period end |
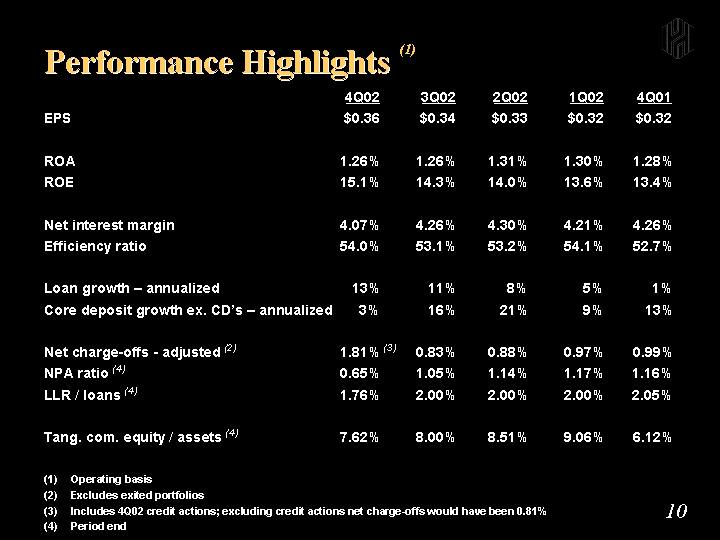
| Performance Highlights (1) 4Q02 3Q02 2Q02 1Q02 4 Q01 EPS $0.36 $0.34 $0.33 $0.32 $ 0.32 ROA 1.26% 1.26% 1.31% 1.30% 1 ..28% ROE 15.1% 14.3% 14.0% 13.6% 1 3.4% Net interest margin 4.07% 4.26% 4.30% 4.21% 4 ..26% Efficiency ratio 54.0% 53.1% 53.2% 54.1% 5 2.7% Loan growth - annualized 13% 11% 8% 5% 1 % Core deposit growth ex. CD's - annualized 3% 16% 21% 9% 1 3% Net charge-offs - adjusted (2) 1.81% (3) 0.83% 0.88% 0.97% 0.99% NPA ratio (4) 0.65% 1.05% 1.14% 1.17% 1 ..16% LLR / loans (4) 1.76% 2.00% 2.00% 2.00% 2 ..05% Tang. com. equity / assets (4) 7.62% 8.00% 8.51% 9.06% 6 ..12% (1) Operating basis (2) Excludes exited portfolios (3) Includes 4Q02 credit actions; excluding credit actions net charge-offs would have been 0.81% (4) Period end |
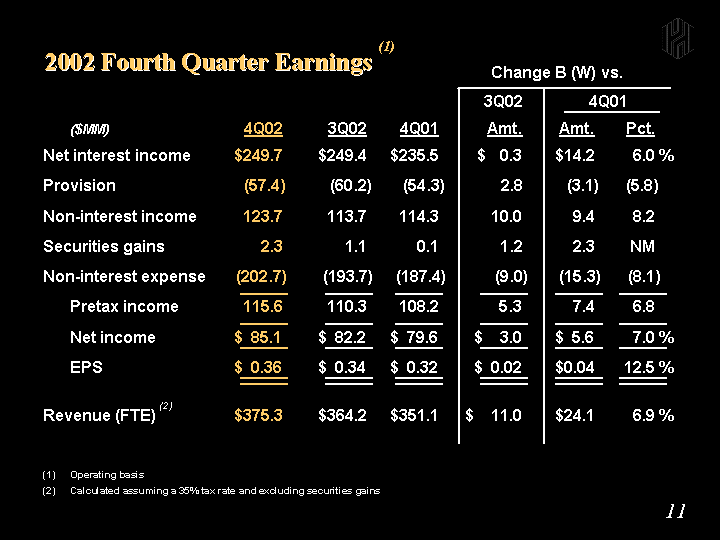
| 2002 Fourth Quarter Earnings (1) Change B (W) vs. 3Q02 4Q01 ($MM) 4Q02 3Q02 4Q01 Amt. Amt. P ct. Net interest income $249.7 $249.4 $235.5 $ 0.3 $14.2 6.0 % Provision (57.4) (60.2) (54.3) 2.8 (3.1) (5.8) Non-interest income 123.7 113.7 114.3 10.0 9.4 8.2 Securities gains 2.3 1.1 0.1 1.2 2.3 NM Non-interest expense (202.7) (193.7) (187.4) (9.0) (15.3) (8.1) Pretax income 115.6 110.3 108.2 5.3 7.4 6.8 Net income $ 85.1 $ 82.2 $ 79.6 $ 3.0 $ 5.6 7.0 % EPS $ 0.36 $ 0.34 $ 0.32 $ 0.02 $0.04 12.5 % Revenue (FTE) (2) $375.3 $364.2 $351.1 $ 11.0 $24.1 6.9 % (1) Operating basis (2) Calculated assuming a 35% tax rate and excluding securities gains |
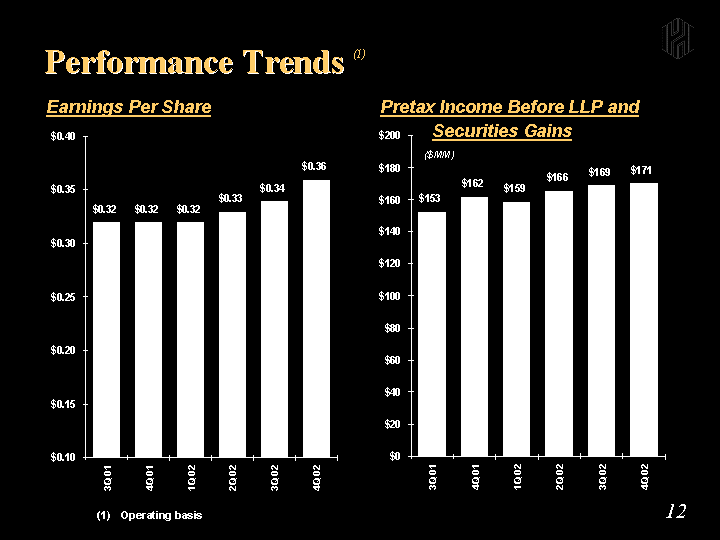
| Performance Trends (1) Earnings Per Share (1) Operating basis Amount 1Q00 0.42 2Q00 0.4 3Q00 0.33 4Q00 0.3 1Q01 0.28 2Q01 0.3 3Q01 0.32 4Q01 0.32 1Q02 0.32 2Q02 0.33 3Q02 0.34 4Q02 0.36 Pretax Income Before LLP and Securities Gains Amount 1Q00 141.516 2Q00 150.28 3Q00 132.557 4Q00 138.92 1Q01 125 2Q01 144 3Q01 153 4Q01 162 1Q02 159.044 2Q02 165.978 3Q02 169.385 4Q02 170.689 ($MM) |
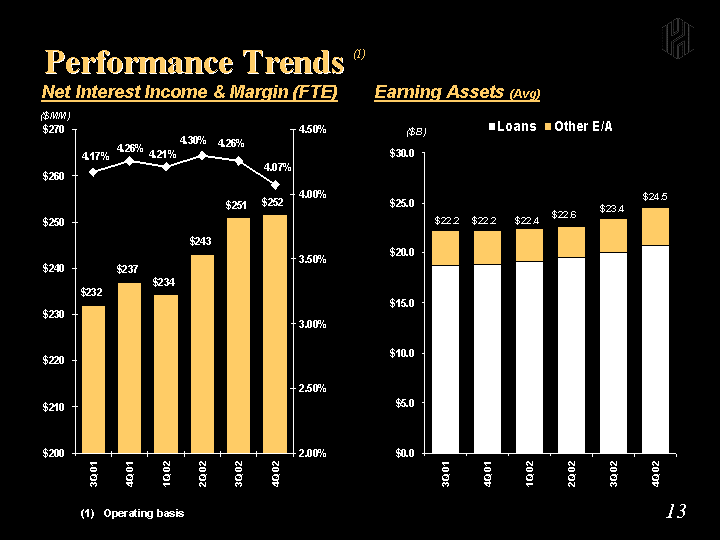
| Performance Trends (1) Net Interest Income & Margin (FTE) Earning Assets (Avg) Amount Percent 1Q00 243 0.0378 2Q00 235 0.0372 3Q00 238 0.0374 4Q00 235 0.037 1Q01 224 0.0399 2Q01 227 0.0403 3Q01 232 0.0417 4Q01 237 0.0426 1Q02 234.27 0.0421 2Q02 242.93 0.043 3Q02 251 0.0426 4Q02 251.571 0.0407 ($MM) Loans Other E/A 2Q01 18.526 4.126 3Q01 18.736 3.479 4Q01 18.807 3.369 1Q02 19.104 3.297 2Q02 19.53 3.108 3Q02 19.989 3.446 4Q02 20.673 3.856 $22.2 $22.4 $22.2 (1) Operating basis $22.6 $23.4 ($B) $24.5 |
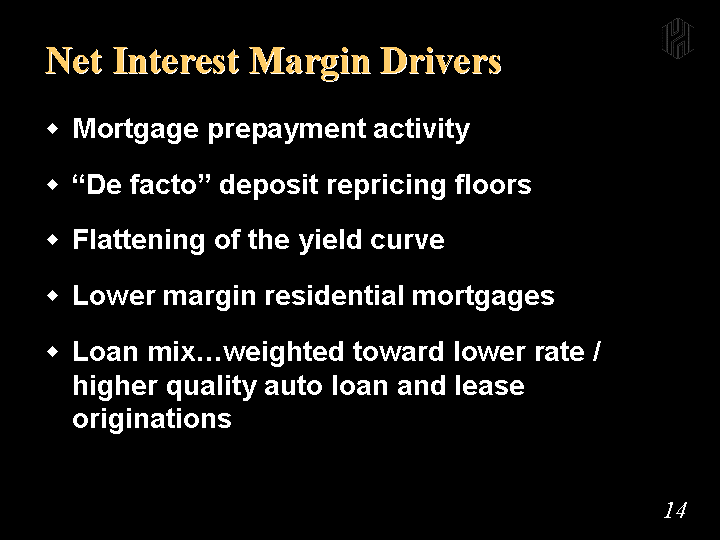
| Net Interest Margin Drivers Mortgage prepayment activity "De facto" deposit repricing floors Flattening of the yield curve Lower margin residential mortgages Loan mix...weighted toward lower rate / higher quality auto loan and lease originations |
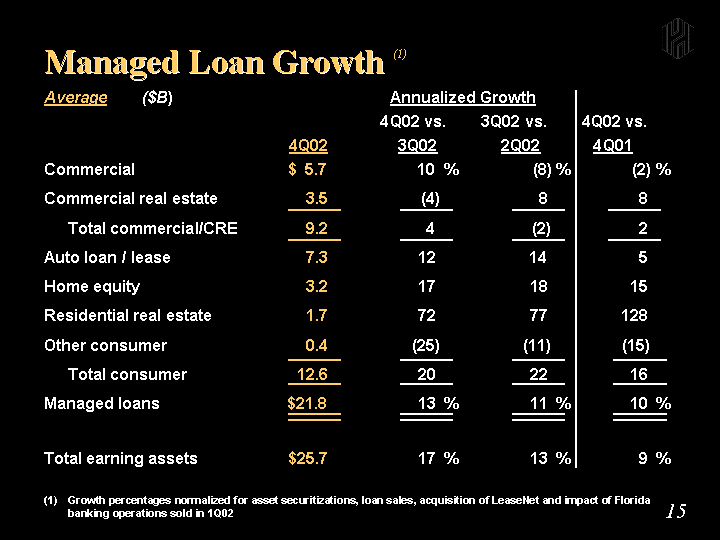
| Managed Loan Growth (1) Average ($B) Annualized Growth 4Q02 vs. 3Q02 vs. 4Q02 vs. 4Q02 3Q02 2Q02 4Q01 Commercial $ 5.7 10 % (8) % (2) % Commercial real estate 3.5 (4) 8 8 Total commercial/CRE 9.2 4 (2) 2 Auto loan / lease 7.3 12 14 5 Home equity 3.2 17 18 15 Residential real estate 1.7 72 77 128 Other consumer 0.4 (25) (11) (15) Total consumer 12.6 20 22 16 Managed loans $21.8 13 % 11 % 10 % Total earning assets $25.7 17 % 13 % 9 % (1) Growth percentages normalized for asset securitizations, loan sales, acquisition of LeaseNet and impact of Florida banking operations sold in 1Q02 |
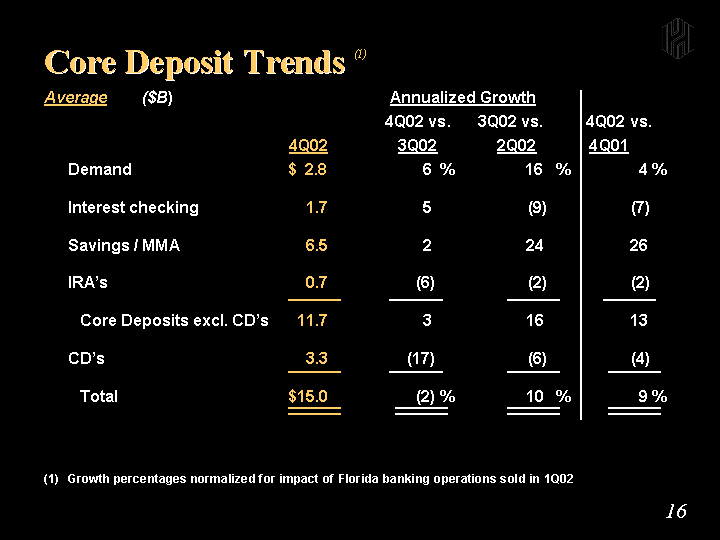
| Core Deposit Trends (1) Average ($B) Annualized Growth 4Q02 vs. 3Q02 vs. 4Q02 vs. 4Q02 3Q02 2Q02 4Q01 Demand $ 2.8 6 % 16 % 4 % Interest checking 1.7 5 (9) (7) Savings / MMA 6.5 2 24 26 IRA's 0.7 (6) (2) (2) Core Deposits excl. CD's 11.7 3 16 13 CD's 3.3 (17) (6) (4) Total $15.0 (2) % 10 % 9 % (1) Growth percentages normalized for impact of Florida banking operations sold in 1Q02 |
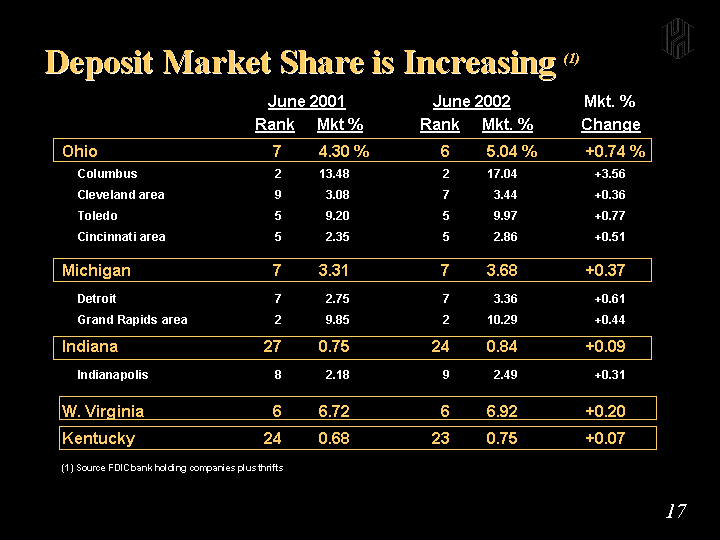
| Deposit Market Share is Increasing (1) June 2001 June 2002 Mkt. % Rank Mkt % Rank Mkt. % Change Ohio 7 4.30 % 6 5.04 % +0.74 % Columbus 2 13.48 2 17.04 +3.56 Cleveland area 9 3.08 7 3.44 +0.36 Toledo 5 9.20 5 9.97 +0.77 Cincinnati area 5 2.35 5 2.86 +0.51 Michigan 7 3.31 7 3.68 +0.37 Detroit 7 2.75 7 3.36 +0.61 Grand Rapids area 2 9.85 2 10.29 +0.44 Indiana 27 0.75 24 0.84 +0.09 Indianapolis 8 2.18 9 2.49 +0.31 W. Virginia 6 6.72 6 6.92 +0.20 Kentucky 24 0.68 23 0.75 +0.07 (1) Source FDIC bank holding companies plus thrifts |
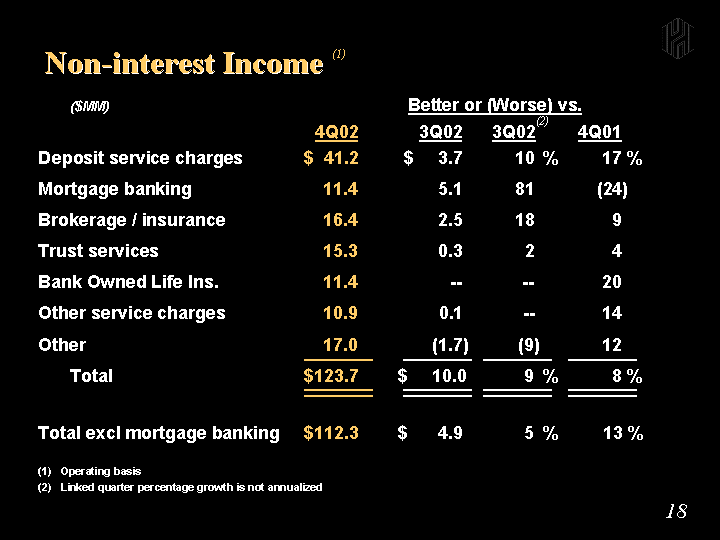
| Non-interest Income (1) ($MM) Better or (Worse) vs. 4Q02 3Q02 3Q02(2) 4Q01 Deposit service charges $ 41.2 $ 3.7 10 % 17 % Mortgage banking 11.4 5.1 81 (24) Brokerage / insurance 16.4 2.5 18 9 Trust services 15.3 0.3 2 4 Bank Owned Life Ins. 11.4 -- -- 20 Other service charges 10.9 0.1 -- 14 Other 17.0 (1.7) (9) 12 Total $123.7 $ 10.0 9 % 8 % Total excl mortgage banking $112.3 $ 4.9 5 % 13 % (1) Operating basis (2) Linked quarter percentage growth is not annualized |
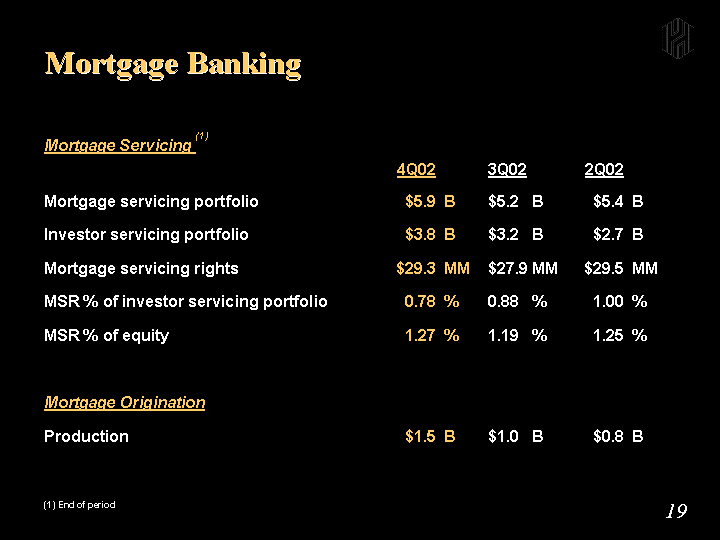
| Mortgage Banking Mortgage Servicing (1) 4Q02 3Q02 2Q 02 Mortgage servicing portfolio $5.9 B $5.2 B $5 ..4 B Investor servicing portfolio $3.8 B $3.2 B $2.7 B Mortgage servicing rights $29.3 MM $27.9 MM $29 ..5 MM MSR % of investor servicing portfolio 0.78 % 0.88 % 1.00 % MSR % of equity 1.27 % 1.19 % 1. 25 % Mortgage Origination Production $1.5 B $1.0 B $0 ..8 B (1) End of period |
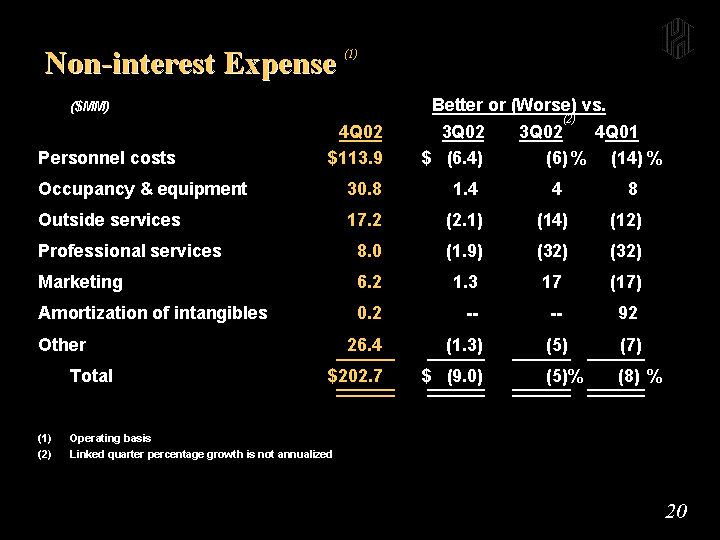
| Non-interest Expense (1) ($MM) Better or (Worse) vs. 4Q02 3Q02 3Q02(2) 4Q01 Personnel costs $113.9 $ (6.4) (6) % (14) % Occupancy & equipment 30.8 1.4 4 8 Outside services 17.2 (2.1) (14) (12) Professional services 8.0 (1.9) (32) (32) Marketing 6.2 1.3 17 (17) Amortization of intangibles 0.2 -- -- 92 Other 26.4 (1.3) (5) (7) Total $202.7 $ (9.0) (5)% (8) % (1) Operating basis (2) Linked quarter percentage growth is not annualized |
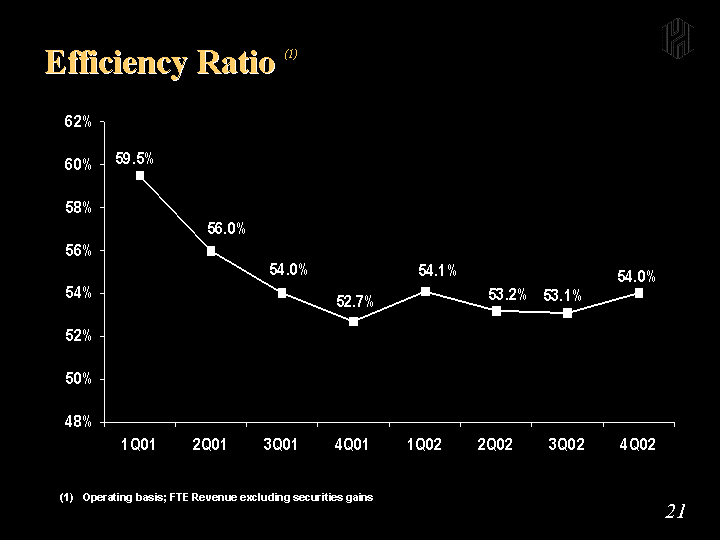
| Amount 1Q00 0.5393 2Q00 0.539 3Q00 0.5838 4Q00 0.5848 1Q01 0.595 2Q01 0.56 3Q01 0.54 4Q01 0.527 1Q02 0.541 2Q02 0.532 3Q02 0.531 4Q02 0.54 Efficiency Ratio (1) (1) Operating basis; FTE Revenue excluding securities gains |

| Credit Review |
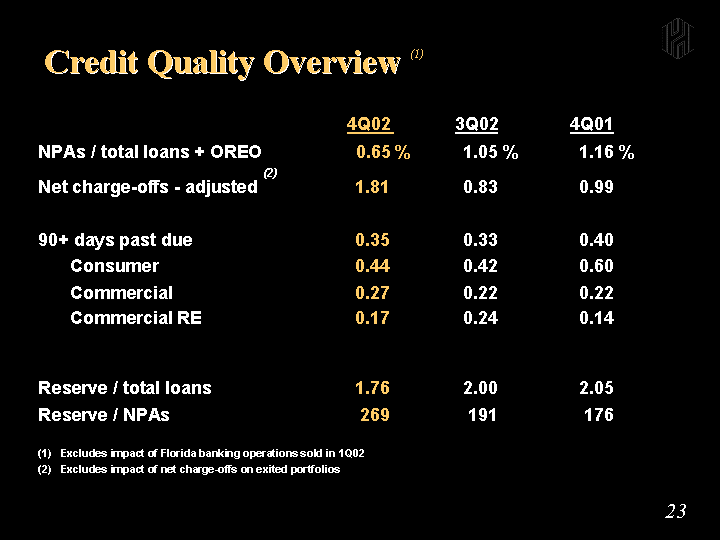
| Credit Quality Overview (1) 4Q02 3Q02 4Q01 NPAs / total loans + OREO 0.65 % 1.05 % 1.16 % Net charge-offs - adjusted (2) 1.81 0.83 0.99 90+ days past due 0.35 0.33 0.40 Consumer 0.44 0.42 0.60 Commercial 0.27 0.22 0.22 Commercial RE 0.17 0.24 0.14 Reserve / total loans 1.76 2.00 2.05 Reserve / NPAs 269 191 176 (1) Excludes impact of Florida banking operations sold in 1Q02 (2) Excludes impact of net charge-offs on exited portfolios |
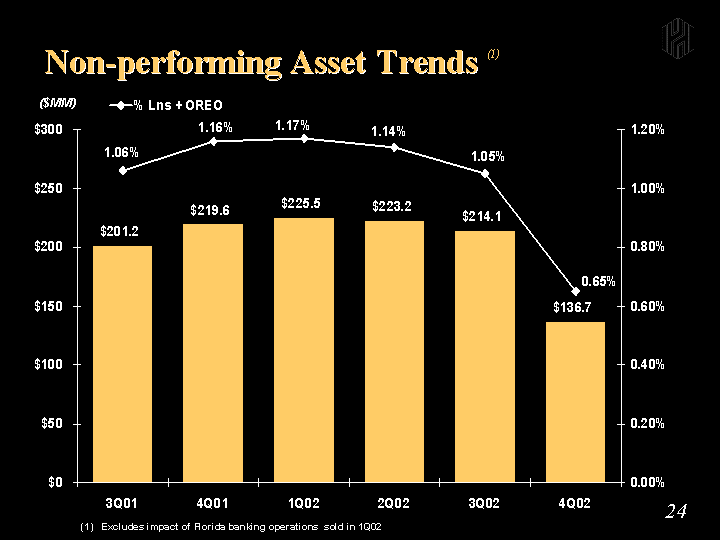
| % Lns + OREO 1Q01 117 0.0063 2Q01 156.9 0.0085 3Q01 201.163 0.0106 4Q01 219.646 0.0116 1Q02 225.53 0.0117 2Q02 223.237 0.0114 3Q02 214.1 0.0105 4Q02 136.723 0.0065 Non-performing Asset Trends (1) ($MM ) (1) Excludes impact of Florida banking operations sold in 1Q02 |
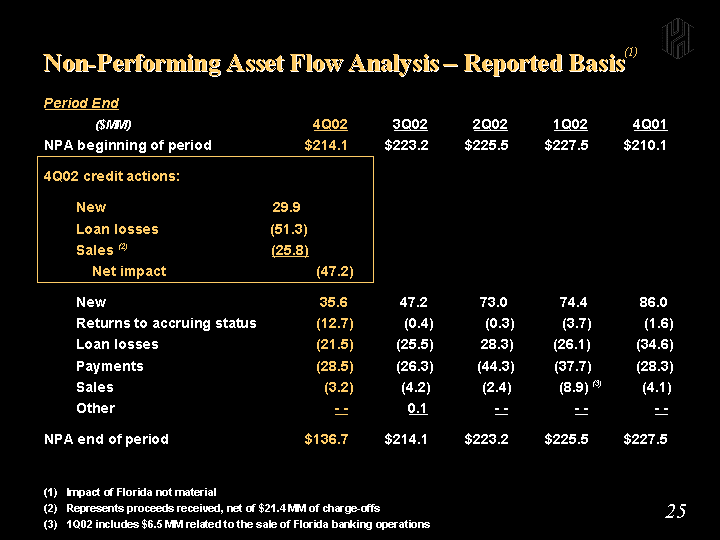
| Non-Performing Asset Flow Analysis - Reported Basis(1) Period End ($MM) 4Q02 3Q02 2Q02 1Q02 4Q01 NPA beginning of period $214.1 $223.2 $225.5 $227.5 $2 10.1 4Q02 credit actions: New 29.9 Loan losses (51.3) Sales (2) (25.8) Net impact (47.2) New 35.6 47.2 73.0 74.4 86.0 Returns to accruing status (12.7) (0.4) (0.3) (3.7) (1.6) Loan losses (21.5) (25.5) 28.3) (26.1) (34.6) Payments (28.5) (26.3) (44.3) (37.7) (28.3) Sales (3.2) (4.2) (2.4) (8.9) (3) (4.1) Other - - 0.1 - - - - - - NPA end of period $136.7 $214.1 $223.2 $225.5 $2 27.5 (1) Impact of Florida not material (2) Represents proceeds received, net of $21.4 MM of charge-offs (3) 1Q02 includes $6.5 MM related to the sale of Florida banking operations |
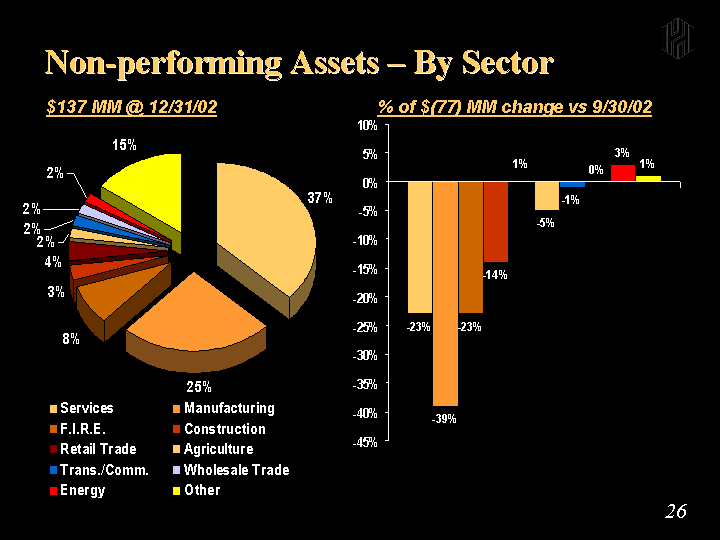
| Non-performing Assets - By Sector Services 0.37 Manufacturing 0.25 F.I.R.E. 0.08 Construction 0.03 Retail Trade 0.04 Agriculture 0.02 Trans./Comm. 0.02 Wholesale Trade 0.02 Energy 0.02 Other 0.15 $137 MM @ 12/31/02 % of $(77) MM change vs 9/30/02 |
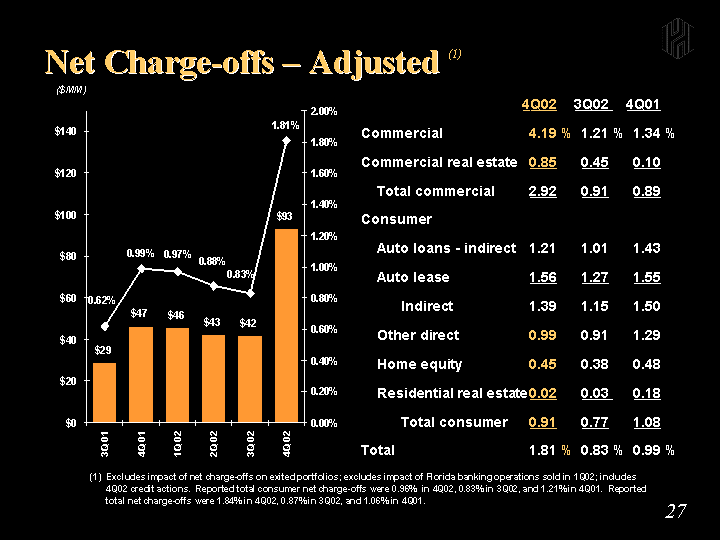
| Net Charge-offs - Adjusted (1) Amount Percent 1Q00 18.3 0.0035 2Q00 15.5 0.003 3Q00 23.8 0.0046 4Q00 25.4 0.005 1Q01 25.829 0.0057 2Q01 34.33 0.0074 3Q01 28.894 0.0062 4Q01 46.527 0.0099 1Q02 45.529 0.0097 2Q02 42.515 0.0088 3Q02 41.843 0.0083 4Q02 93.114 0.0181 ($MM) 4Q02 3Q02 4Q0 1 Commercial 4.19 % 1.21 % 1. 34 % Commercial real estate 0.85 0.45 0.10 Total commercial 2.92 0.91 0.89 Consumer Auto loans - indirect 1.21 1.01 1.43 Auto lease 1.56 1.27 1.55 Indirect 1.39 1.15 1.50 Other direct 0.99 0.91 1.29 Home equity 0.45 0.38 0.48 Residential real estate 0.02 0.03 0.18 Total consumer 0.91 0.77 1.08 Total 1.81 % 0.83 % 0. 99 % (1) Excludes impact of net charge-offs on exited portfolios; excludes impact of Florida banking operations sold in 1Q02; includes 4Q02 credit actions. Reported total consumer net charge-offs were 0.96% in 4Q02, 0.83% in 3Q02, and 1.21% in 4Q01. Reported total net charge-offs were 1.84% in 4Q02, 0.87% in 3Q02, and 1.06% in 4Q01. |
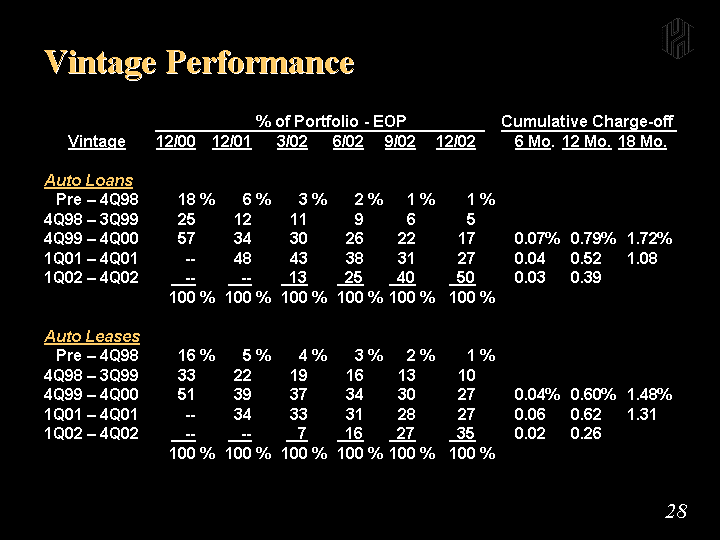
| Vintage Performance % of Portfolio - EOP Cumulative Charge-off Vintage 12/00 12/01 3/02 6/02 9/02 12/02 6 Mo. 12 Mo. 18 Mo. Auto Loans Pre - 4Q98 18 % 6 % 3 % 2 % 1 % 1 % 4Q98 - 3Q99 25 12 11 9 6 5 4Q99 - 4Q00 57 34 30 26 22 17 0.07% 0.79% 1.72% 1Q01 - 4Q01 -- 48 43 38 31 27 0.04 0.52 1.08 1Q02 - 4Q02 -- -- 13 25 40 50 0.03 0.39 100 % 100 % 100 % 100 % 100 % 100 % Auto Leases Pre - 4Q98 16 % 5 % 4 % 3 % 2 % 1 % 4Q98 - 3Q99 33 22 19 16 13 10 4Q99 - 4Q00 51 39 37 34 30 27 0.04% 0.60% 1.48% 1Q01 - 4Q01 -- 34 33 31 28 27 0.06 0.62 1.31 1Q02 - 4Q02 -- -- 7 16 27 35 0.02 0.26 100 % 100 % 100 % 100 % 100 % 100 % |
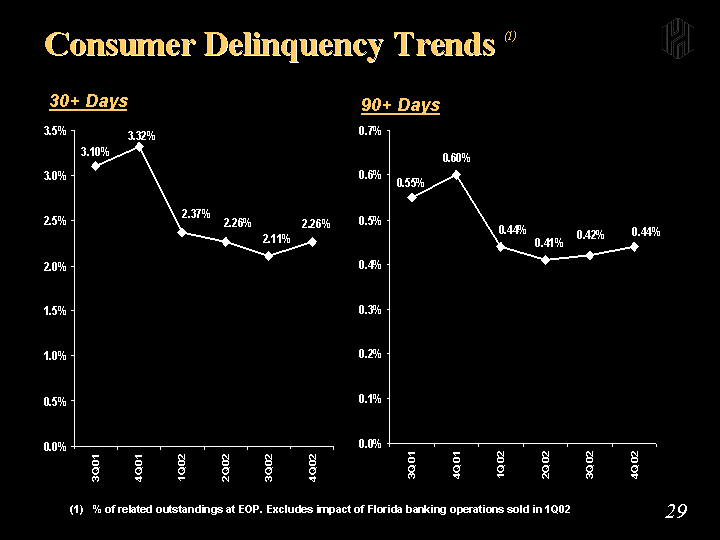
| Consumer Delinquency Trends (1) 30+ Days 1Q01 2Q01 0.0288 3Q01 0.031 4Q01 0.0332 1Q02 0.0237 2Q02 0.0226 3Q02 0.0211 4Q02 0.0226 90+ Days 1Q01 2Q01 0.0047 3Q01 0.0055 4Q01 0.006 1Q02 0.0044 2Q02 0.0041 3Q02 0.0042 4Q02 0.0044 (1) % of related outstandings at EOP. Excludes impact of Florida banking operations sold in 1Q02 |
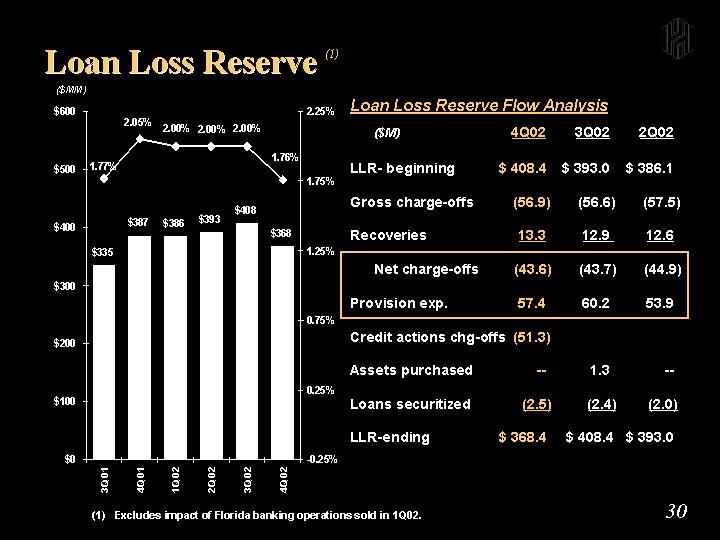
| Loan Loss Reserve (1) Loan Loss Reserve Flow Analysis ($M) 4Q02 3Q02 2Q02 LLR- beginning $ 408.4 $ 393.0 $ 386.1 Gross charge-offs (56.9) (56.6) (57.5) Recoveries 13.3 12.9 12.6 Net charge-offs (43.6) (43.7) (44.9) Provision exp. 57.4 60.2 53.9 Credit actions chg-offs (51.3) Assets purchased -- 1.3 -- Loans securitized (2.5) (2.4) (2.0) LLR-ending $ 368.4 $ 408.4 $ 393.0 Amount Percent 1Q01 276.116 0.0143 2Q01 326.495 0.0176 3Q01 334.827 0.0177 4Q01 386.956 0.0205 1Q02 386.053 0.02 2Q02 393.011 0.02 3Q02 408.378 0.02 4Q02 368.395 0.0176 ($MM) (1) Excludes impact of Florida banking operations sold in 1Q02. |
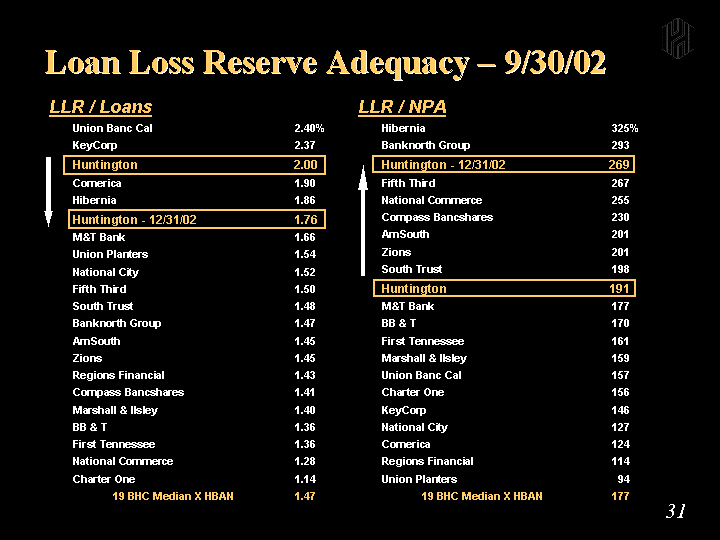
| Loan Loss Reserve Adequacy - 9/30/02 LLR / Loans Union Banc Cal 2.40% KeyCorp 2.37 Huntington 2.00 Comerica 1.90 Hibernia 1.86 Huntington - 12/31/02 1.76 M&T Bank 1.66 Union Planters 1.54 National City 1.52 Fifth Third 1.50 South Trust 1.48 Banknorth Group 1.47 AmSouth 1.45 Zions 1.45 Regions Financial 1.43 Compass Bancshares 1.41 Marshall & Ilsley 1.40 BB & T 1.36 First Tennessee 1.36 National Commerce 1.28 Charter One 1.14 19 BHC Median X HBAN 1.47 LLR / NPA Hibernia 325% Banknorth Group 293 Huntington - 12/31/02 269 Fifth Third 267 National Commerce 255 Compass Bancshares 230 AmSouth 201 Zions 201 South Trust 198 Huntington 191 M&T Bank 177 BB & T 170 First Tennessee 161 Marshall & Ilsley 159 Union Banc Cal 157 Charter One 156 KeyCorp 146 National City 127 Comerica 124 Regions Financial 114 Union Planters 94 19 BHC Median X HBAN 177 |

| Capital Review |
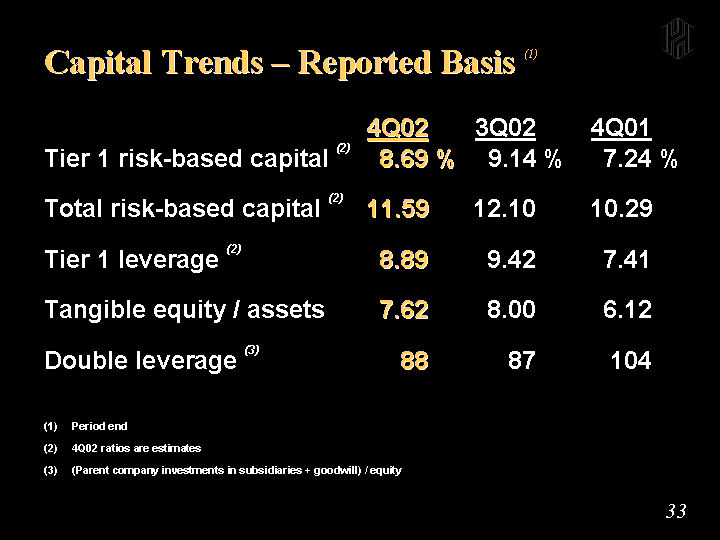
| Capital Trends - Reported Basis (1) 4Q02 3Q02 4 Q01 Tier 1 risk-based capital (2) 8.69 % 9.14 % 7.24 % Total risk-based capital (2) 11.59 12.10 10.29 Tier 1 leverage (2) 8.89 9.42 7.41 Tangible equity / assets 7.62 8.00 6.12 Double leverage (3) 88 87 104 (1) Period end (2) 4Q02 ratios are estimates (3) (Parent company investments in subsidiaries + goodwill) / equity |

| 2003 Outlook |
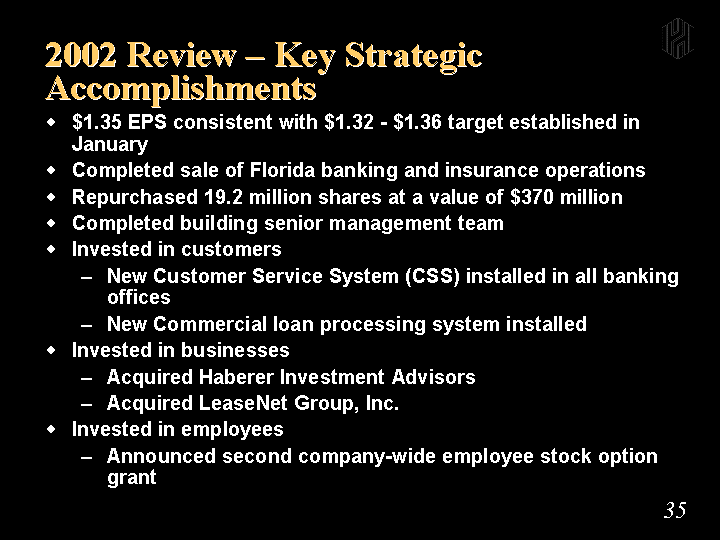
| 2002 Review - Key Strategic Accomplishments $1.35 EPS consistent with $1.32 - $1.36 target established in January Completed sale of Florida banking and insurance operations Repurchased 19.2 million shares at a value of $370 million Completed building senior management team Invested in customers New Customer Service System (CSS) installed in all banking offices New Commercial loan processing system installed Invested in businesses Acquired Haberer Investment Advisors Acquired LeaseNet Group, Inc. Invested in employees Announced second company-wide employee stock option grant |
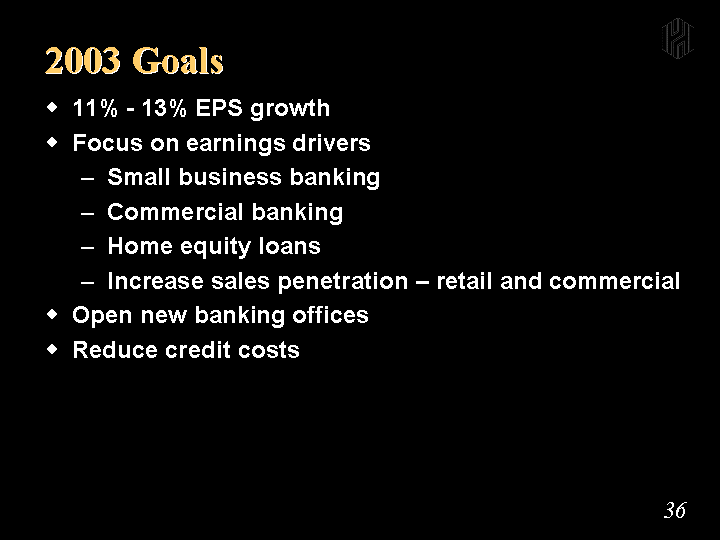
| 2003 Goals 11% - 13% EPS growth Focus on earnings drivers Small business banking Commercial banking Home equity loans Increase sales penetration - retail and commercial Open new banking offices Reduce credit costs |
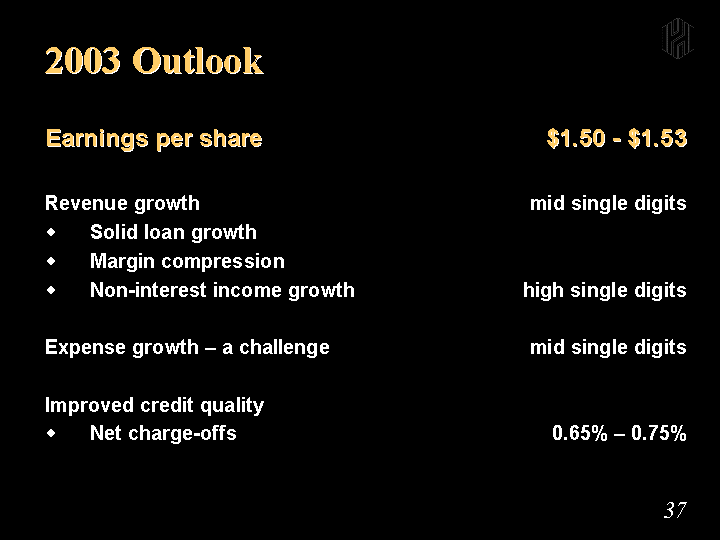
| 2003 Outlook Earnings per share $1.50 - $1.53 Revenue growth mid single digits Solid loan growth Margin compression Non-interest income growth high single digits Expense growth - a challenge mid single digits Improved credit quality Net charge-offs 0.65% - 0.75% |

| PRIVATE SECURITIES LITIGATION REFORM ACT OF 1995 FORWARD LOOKING STATEMENT DISCLOSURE This presentation and discussion, including related questions and answers, may contain forward-looking statements, including certain plans, expectations, goals, and projections which are subject to numerous assumptions, risks, and uncertainties. A number of factors, including but not limited to those set forth under the heading "Business Risks" included in Item 1 of Huntington's Annual Report on Form 10-K for the year ended December 31, 2001, and other factors described from time to time in Huntington's other filings with the Securities and Exchange Commission, could cause actual conditions, events, or results to differ significantly from those described in the forward-looking statements. All forward-looking statements included in this discussion, including related questions and answers, are based on information available at the time of the discussion. Huntington assumes no obligation to update any forward-looking statement. |

| Appendix |
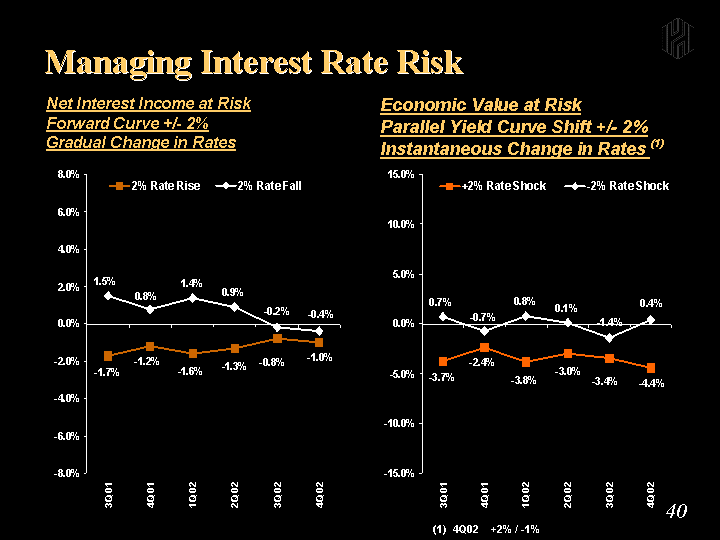
| Managing Interest Rate Risk Net Interest Income at Risk Forward Curve +/- 2% Gradual Change in Rates Economic Value at Risk Parallel Yield Curve Shift +/- 2% Instantaneous Change in Rates (1) 2% Rate Rise 2% Rate Fall 1Q00 -0.018 0.009 2Q00 -0.02 0.016 3Q00 -0.022 0.018 4Q00 -0.026 0.02 1Q01 -0.021 0.017 2Q01 -0.021 0.018 3Q01 -0.017 0.015 4Q01 -0.012 0.008 1Q02 -0.016 0.014 2Q02 -0.013 0.009 3Q02 -0.008 -0.002 4Q02 -0.01 -0.004 +2% Rate Shock -2% Rate Shock 3Q00 -0.092 0.053 4Q00 -0.088 0.046 1Q01 -0.057 0.033 2Q01 -0.062 0.036 3Q01 -0.037 0.007 4Q01 -0.024 -0.007 1Q02 -0.038 0.008 2Q02 -0.03 0.001 3Q02 -0.034 -0.014 4Q02 -0.044 0.004 (1) 4Q02 +2% / -1% |
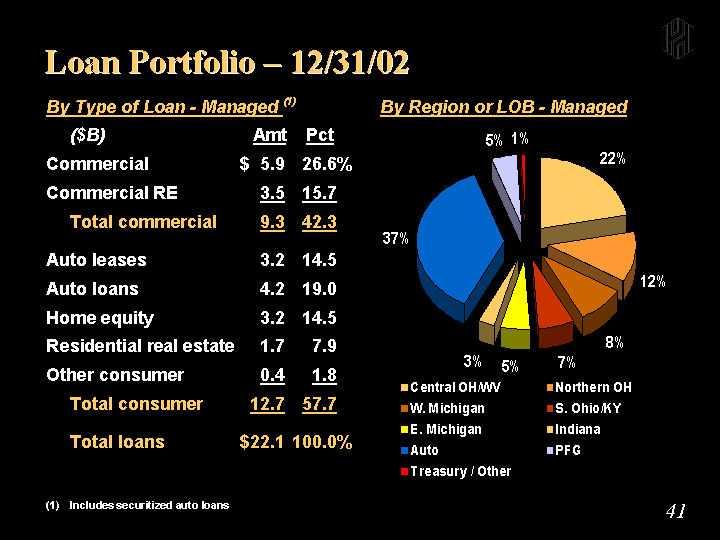
| Loan Portfolio - 12/31/02 By Type of Loan - Managed (1) ($B) Amt Pct Commercial $ 5.9 26.6% Commercial RE 3.5 15.7 Total commercial 9.3 42.3 Auto leases 3.2 14.5 Auto loans 4.2 19.0 Home equity 3.2 14.5 Residential real estate 1.7 7.9 Other consumer 0.4 1.8 Total consumer 12.7 57.7 Total loans $22.1 100. 0% (1) Includes securitized auto loans By Region or LOB - Managed 3Q01 Central OH/WV 0.219 Northern OH 0.118 W. Michigan 0.085 S. Ohio/KY 0.068 E. Michigan 0.054 Indiana 0.031 Auto 0.369 PFG 0.048 Treasury / Other 0.0086 |
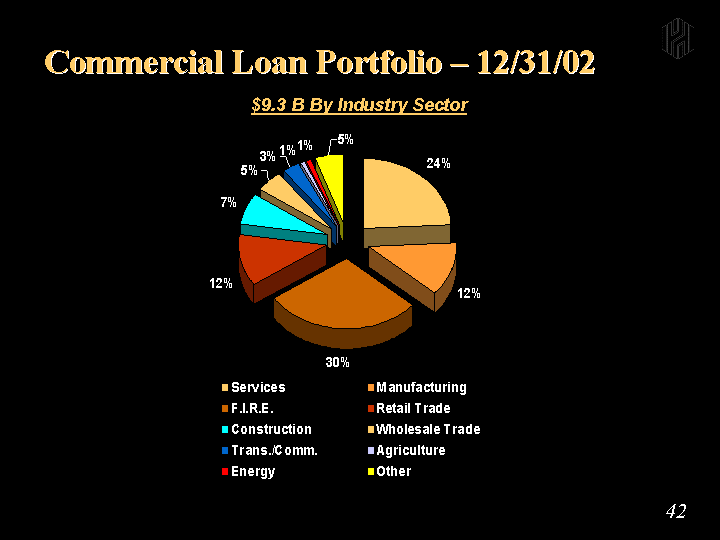
| Commercial Loan Portfolio - 12/31/02 $9.3 B By Industry Sector Services 0.24 Manufacturing 0.12 F.I.R.E. 0.29 Retail Trade 0.12 Construction 0.07 Wholesale Trade 0.05 Trans./Comm. 0.03 Agriculture 0.01 Energy 0.01 Other 0.0525 |
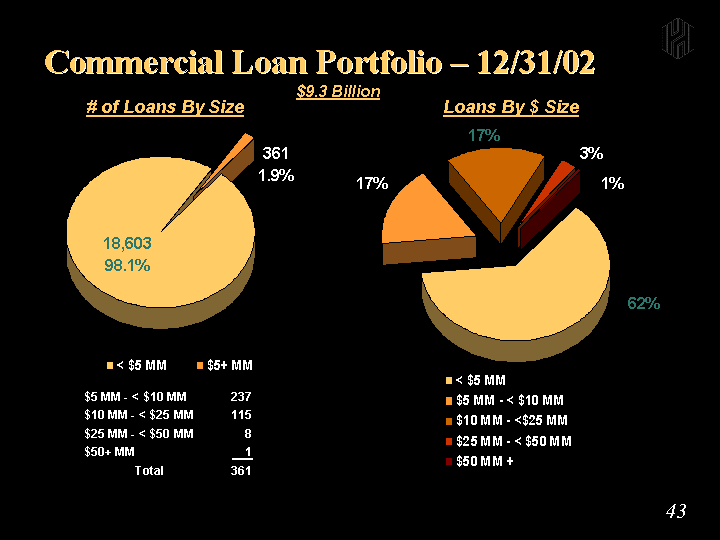
| < $5 MM 18603 $5+ MM 361 $5 MM - < $10 MM 237 $10 MM - < $25 MM 115 $25 MM - < $50 MM 8 $50+ MM 1 Total 361 < $5 MM 0.6227 $5 MM - < $10 MM 0.1714 $10 MM - <$25 MM 0.1714 $25 MM - < $50 MM 0.0292 $50 MM + 0.0054 Commercial Loan Portfolio - 12/31/02 # of Loans By Size 18,603 98.1% 361 1.9% Loans By $ Size 62% 3% $9.3 Billion 17% 17% 1% |
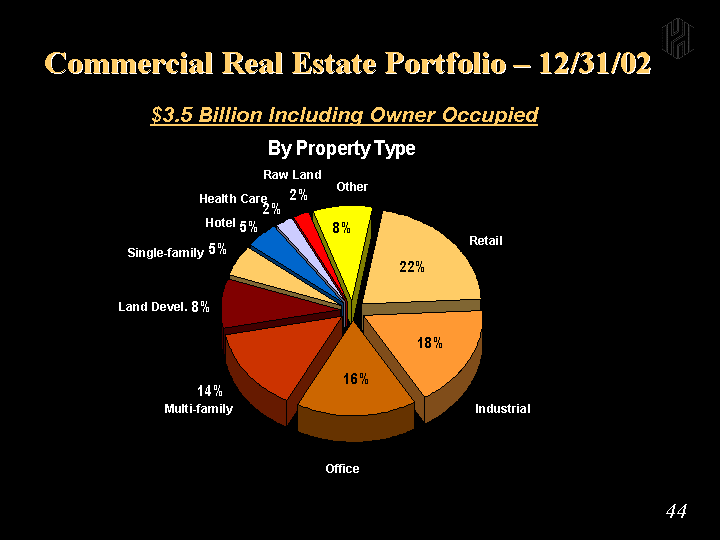
| Commercial Real Estate Portfolio - 12/31/02 Retail Industrial Office Multifamily Land Devel Single-family Hotel Health Care Raw Land Other 0.213 0.174 0.163 0.142 0.082 0.052 0.046 0.023 0.024 0.08 Retail Industri al Office Multi-family Land Devel. Hotel Single- family Health Care Other $3.5 Billion Including Owner Occupied Raw Land |
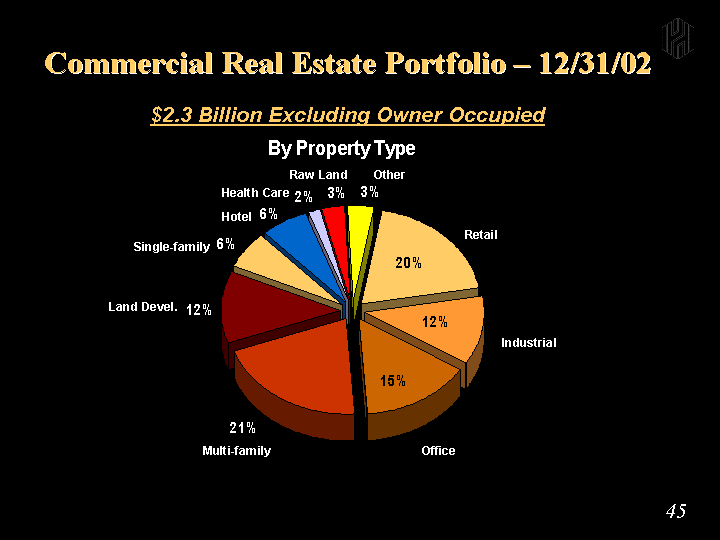
| Commercial Real Estate Portfolio - 12/31/02 Retail Industrial Office Multifamily Land Devel Single-family Hotel Health Care Raw Land Other 0.195 0.115 0.15 0.208 0.12 0.065 0.065 0.016 0.031 0.035 Retail Industri al Office Multi-family Land Devel. Hotel Single- family Health Care Other $2.3 Billion Excluding Owner Occupied Raw Land |
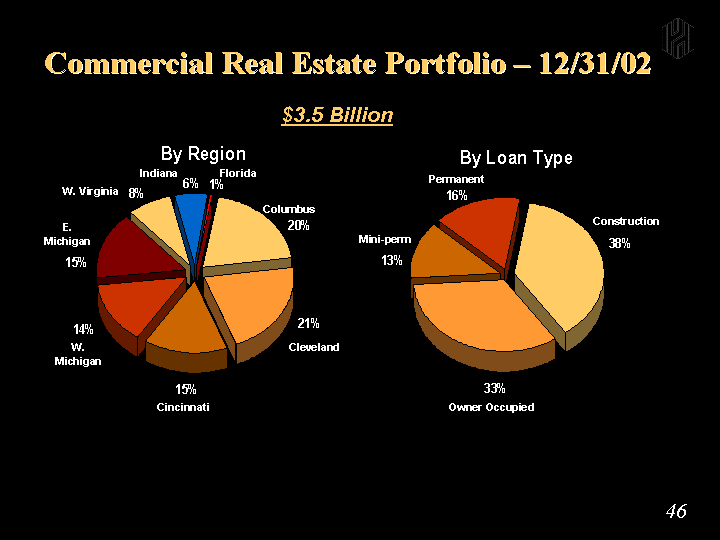
| Columbus Cleveland Cincinnati W. MI E. MI WV ID FL 0.201 0.212 0.151 0.14 0.152 0.078 0.059 0.006 Commercial Real Estate Portfolio - 12/31/02 Construction Owner Occupied Mini-Perm Permanent 0.376 0.335 0.131 0.159 Cincinnat i Columbu s W. Michiga n E. Michiga n W. Virginia Indian a Cleveland Permanen t Mini-perm Owner Occupied Constructi on $3.5 Billion Florid a |
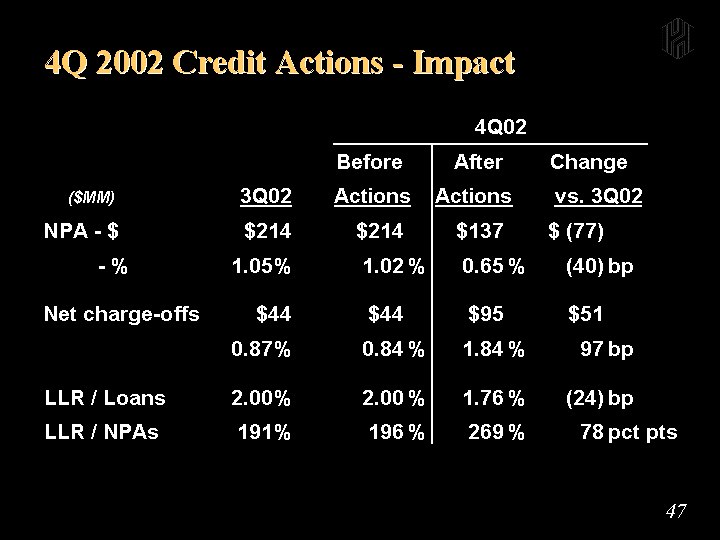
| 4Q 2002 Credit Actions - Impact 4Q02 Before After Change ($MM) 3Q02 Actions Actions vs. 3Q02 NPA - $ $214 $214 $137 $ (77) - % 1.05% 1.02 % 0.65 % (40) bp Net charge-offs $44 $44 $95 $51 0.87% 0.84 % 1.84 % 97 bp LLR / Loans 2.00% 2.00 % 1.76 % (24) bp LLR / NPAs 191% 196 % 269 % 78 pct pts |
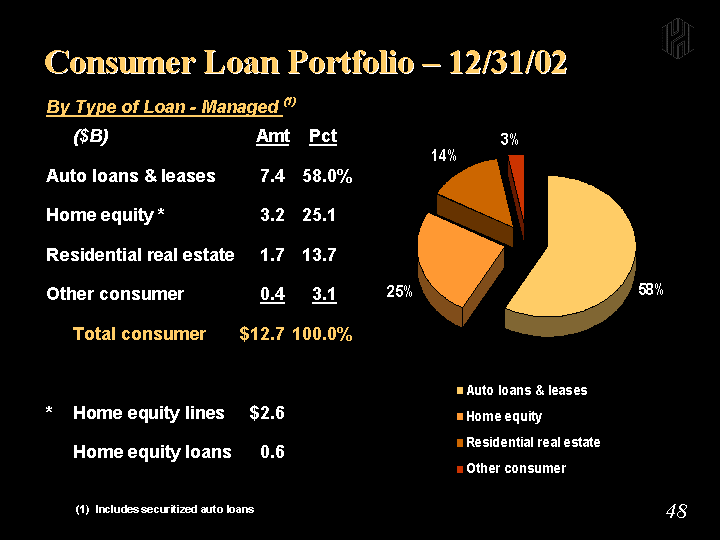
| Consumer Loan Portfolio - 12/31/02 By Type of Loan - Managed (1) ($B) Amt Pct Auto loans & leases 7.4 58.0 % Home equity * 3.2 25.1 Residential real estate 1.7 13.7 Other consumer 0.4 3.1 Total consumer $12.7 100. 0% * Home equity lines $2.6 Home equity loans 0.6 3Q01 Auto loans & leases 0.58 Home equity 0.25 Residential real estate 0.14 Other consumer 0.03 E. Michigan 0 Indiana 0 Auto 0 PFG 0 Mortgage 0 (1) Includes securitized auto loans |
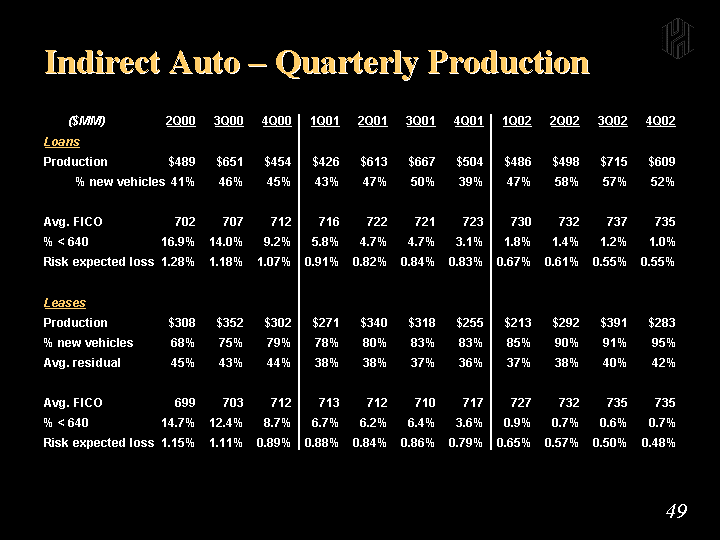
| Indirect Auto - Quarterly Production ($MM) 2Q00 3Q00 4Q00 1Q01 2Q01 3Q01 4Q01 1Q02 2Q02 3 Q02 4Q02 Loans Production $489 $651 $454 $426 $613 $667 $504 $486 $498 $ 715 $609 % new vehicles 41% 46% 45% 43% 47% 50% 39% 47% 58% 5 7% 52% Avg. FICO 702 707 712 716 722 721 723 730 732 737 735 % < 640 16.9% 14.0% 9.2% 5.8% 4.7% 4.7% 3.1% 1.8% 1.4% 1. 2% 1.0% Risk expected loss 1.28% 1.18% 1.07% 0.91% 0.82% 0.84% 0.83% 0.67% 0.61% 0.5 5% 0.55% Leases Production $308 $352 $302 $271 $340 $318 $255 $213 $292 $ 391 $283 % new vehicles 68% 75% 79% 78% 80% 83% 83% 85% 90% 9 1% 95% Avg. residual 45% 43% 44% 38% 38% 37% 36% 37% 38% 4 0% 42% Avg. FICO 699 703 712 713 712 710 717 727 732 735 735 % < 640 14.7% 12.4% 8.7% 6.7% 6.2% 6.4% 3.6% 0.9% 0.7% 0. 6% 0.7% Risk expected loss 1.15% 1.11% 0.89% 0.88% 0.84% 0.86% 0.79% 0.65% 0.57% 0.5 0% 0.48% |

| Indirect Auto - Credit Underwriting FICO - new production Risk expected loss 1Q00 696 0.014 2Q00 702 0.0128 3Q00 707 0.0118 4Q00 712 0.0107 1Q01 716 0.0091 2Q01 722 0.0082 3Q01 721 0.0084 4Q01 723 0.0083 1Q02 730 0.0067 2Q02 732 0.0061 3Q02 737 0.0055 4Q02 735 0.0055 Auto Loans FICO - new production Risk expected loss 1Q00 699 0.0106 2Q00 699 0.0115 3Q00 703 0.0111 4Q00 712 0.0089 1Q01 713 0.0088 2Q01 712 0.0084 3Q01 710 0.0086 4Q01 717 0.0079 1Q02 727 0.0065 2Q02 732 0.0057 3Q02 735 0.005 4Q02 735 0.0048 Auto Leases |
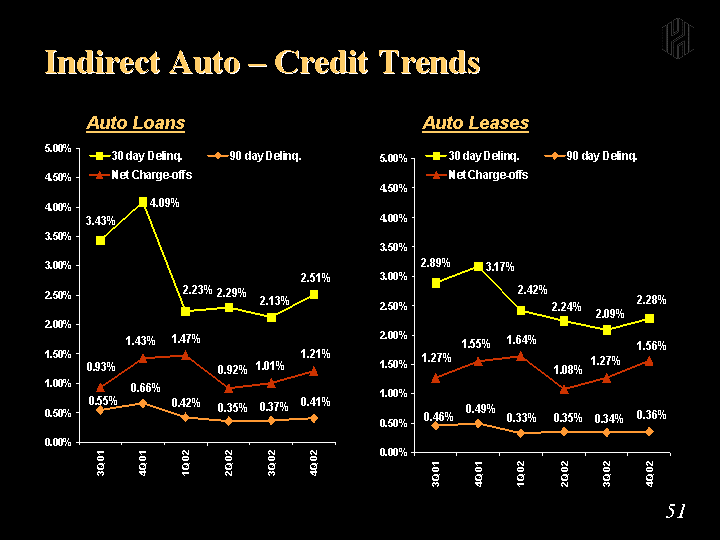
| Indirect Auto - Credit Trends 30 day Delinq. 90 day Delinq. Net Charge-offs 1Q00 0 0 0 2Q00 0 0 0 3Q00 0 0 0 4Q00 0 0 0 1Q01 0 0 0 2Q01 0 0 0 3Q01 0.0343 0.0055 0.0093 4Q01 0.0409 0.0066 0.0143 1Q02 0.0223 0.0042 0.0147 2Q02 0.0229 0.0035 0.0092 3Q02 0.0213 0.0037 0.0101 4Q02 0.0251 0.0041 0.0121 Auto Loans Auto Leases 30 day Delinq. 90 day Delinq. Net Charge-offs 1Q00 0 0 0 2Q00 0 0 0 3Q00 0 0 0 4Q00 0 0 0 1Q01 0 0 0 2Q01 0 0 0 3Q01 0.0289 0.0046 0.0127 4Q01 0.0317 0.0049 0.0155 1Q02 0.0242 0.0033 0.0164 2Q02 0.0224 0.0035 0.0108 3Q02 0.0209 0.0034 0.0127 4Q02 0.0228 0.0036 0.0156 |
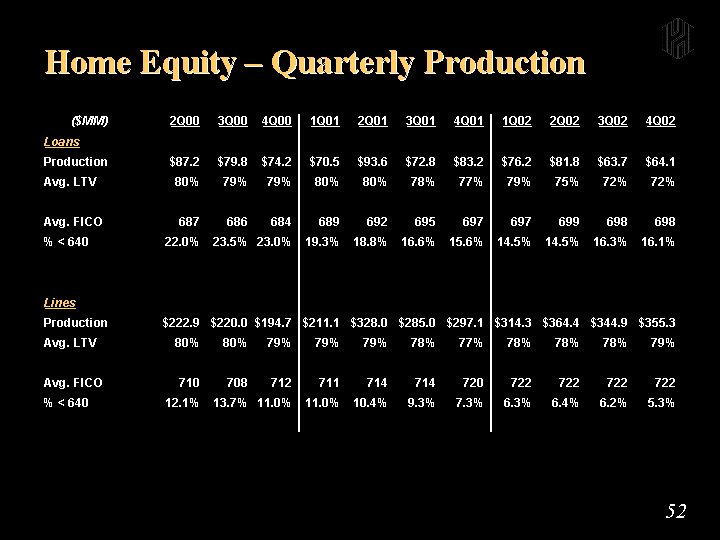
| Home Equity - Quarterly Production ($MM) 2Q00 3Q00 4Q00 1Q01 2Q01 3Q01 4Q01 1Q02 2Q02 3 Q02 4Q02 Loans Production $87.2 $79.8 $74.2 $70.5 $93.6 $72.8 $83.2 $76.2 $81.8 $6 3.7 $64.1 Avg. LTV 80% 79% 79% 80% 80% 78% 77% 79% 75% 7 2% 72% Avg. FICO 687 686 684 689 692 695 697 697 699 698 698 % < 640 22.0% 23.5% 23.0% 19.3% 18.8% 16.6% 15.6% 14.5% 14.5% 16. 3% 16.1% Lines Production $222.9 $220.0 $194.7 $211.1 $328.0 $285.0 $297.1 $314.3 $364.4 $34 4.9 $355.3 Avg. LTV 80% 80% 79% 79% 79% 78% 77% 78% 78% 7 8% 79% Avg. FICO 710 708 712 711 714 714 720 722 722 722 722 % < 640 12.1% 13.7% 11.0% 11.0% 10.4% 9.3% 7.3% 6.3% 6.4% 6. 2% 5.3% |
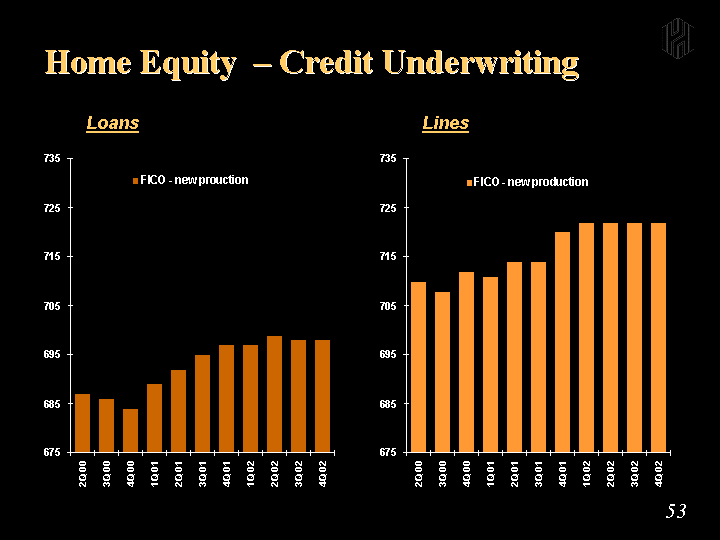
| Home Equity - Credit Underwriting FICO - new prouction Risk expected loss 1Q00 684 0.0074 2Q00 687 0.0076 3Q00 686 0.0064 4Q00 684 0.0068 1Q01 689 0.0055 2Q01 692 0.0049 3Q01 695 0.0049 4Q01 697 0.0063 1Q02 697 0.0041 2Q02 699 0.0041 3Q02 698 0.0045 4Q02 698 Loans FICO - new production Risk expected loss 2Q00 710 0.0055 3Q00 708 0.0059 4Q00 712 0.0055 1Q01 711 0.0053 2Q01 714 0.005 3Q01 714 0.006 4Q01 720 0.0065 1Q02 722 0.0052 2Q02 722 0.0054 3Q02 722 0.0048 4Q02 722 Lines |
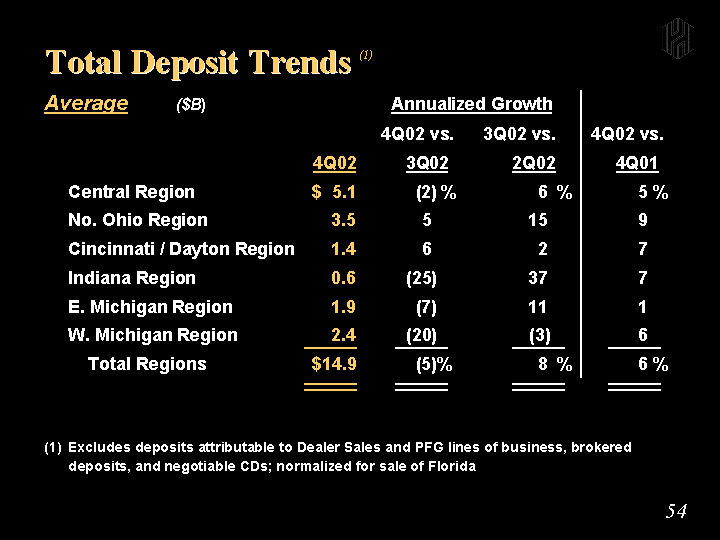
| Total Deposit Trends (1) Average ($B) Annualized Growth 4Q02 vs. 3Q02 vs. 4Q02 vs. 4Q02 3Q02 2Q02 4Q01 Central Region $ 5.1 (2) % 6 % 5 % No. Ohio Region 3.5 5 15 9 Cincinnati / Dayton Region 1.4 6 2 7 Indiana Region 0.6 (25) 37 7 E. Michigan Region 1.9 (7) 11 1 W. Michigan Region 2.4 (20) (3) 6 Total Regions $14.9 (5)% 8 % 6 % (1) Excludes deposits attributable to Dealer Sales and PFG lines of business, brokered deposits, and negotiable CDs; normalized for sale of Florida |
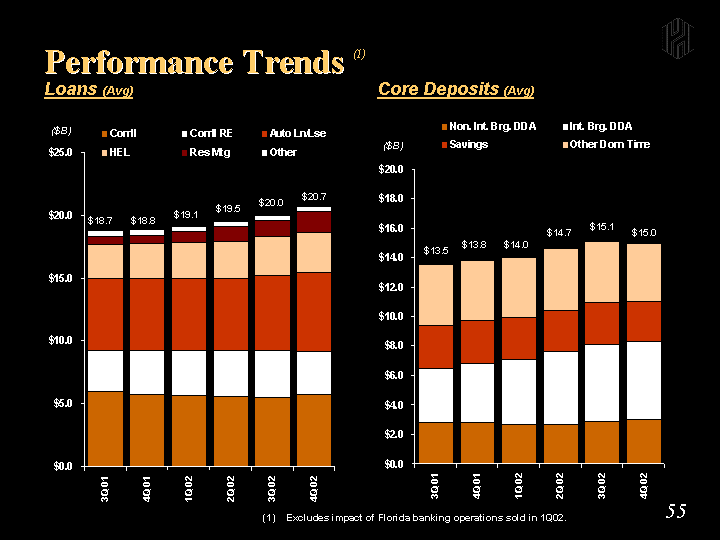
| Performance Trends (1) Loans (Avg) Core Deposits (Avg) Com'l Com'l RE Auto Ln/Lse HEL Res Mtg Other 1Q00 6.345 3.394 6.358 1.748 1.449 1.504 2Q00 6.439 3.426 6.024 1.861 1.473 1.54 3Q00 6.454 3.476 5.737 2.009 1.325 1.622 4Q00 6.543 3.533 5.689 2.119 0.94 1.666 1Q01 2Q01 5.986 3.184 5.511 2.664 0.696 0.485 3Q01 5.946 3.3 5.688 2.7 0.619 0.459 4Q01 5.751 3.5 5.718 2.753 0.672 0.446 1Q02 5.661 3.6 5.726 2.788 0.9 0.425 2Q02 5.614 3.653 5.71 2.911 1.229 0.413 3Q02 5.502 3.746 5.965 3.062 1.31 0.404 4Q02 5.7 3.5 6.2 3.2 1.7 0.4 ($B) Non. Int. Brg. DDA Int. Brg. DDA Savings Other Dom. Time 1Q00 3.466 4.053 3.645 7.271 2Q00 3.485 4.228 3.583 7.247 3Q00 3.425 4.385 3.528 7.45 4Q00 3.308 4.496 3.498 7.522 1Q01 2Q01 2.7 3.5 3 3.9 3Q01 2.8 3.7 2.9 4.1 4Q01 2.8 4 2.9 4.1 1Q02 2.7 4.4 2.8 4.1 2Q02 2.7 4.9 2.8 4.2 3Q02 2.868 5.269 2.766 4.167 4Q02 3 5.3 2.7 4 ($B) $18.7 $18.8 $19.1 $19.5 $15.1 $14.7 $14.0 $13.8 $13.5 (1) Excludes impact of Florida banking operations sold in 1Q02. $20.0 $20.7 $15.0 |
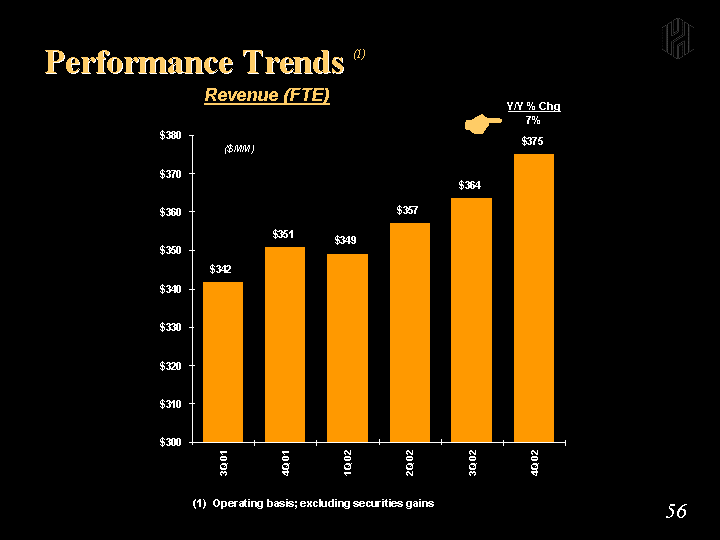
| Performance Trends (1) (1) Operating basis; excluding securities gains Revenue (FTE) Amount 1Q00 343.8 2Q00 350.4 3Q00 348.2 4Q00 364.8 1Q01 321 2Q01 338.36 3Q01 341.944 4Q01 351.129 1Q02 349.264 2Q02 357.234 3Q02 363.754 4Q02 375.253 ($MM) Y/Y % Chg 7% |
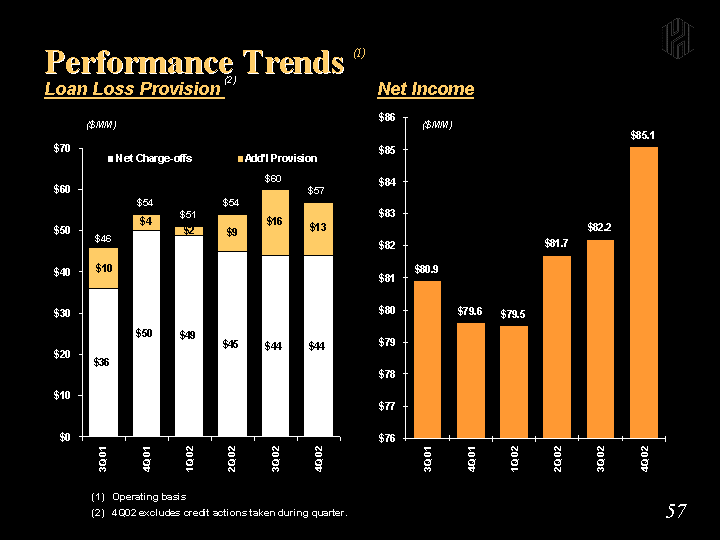
| Performance Trends (1) Loan Loss Provision (2) Net Income (1) Operating basis (2) 4Q02 excludes credit actions taken during quarter. Net Charge-offs Add'l Provision 2Q01 34 8 3Q01 36 10 4Q01 50 4 1Q02 49 2 2Q02 45 9 3Q02 44 16 4Q02 44 13 ($MM) Amount 2Q01 76 3Q01 80.9 4Q01 79.6 1Q02 79.5 2Q02 81.7 3Q02 82.2 4Q02 85.1 ($MM) $46 $54 $51 $54 $60 $57 |
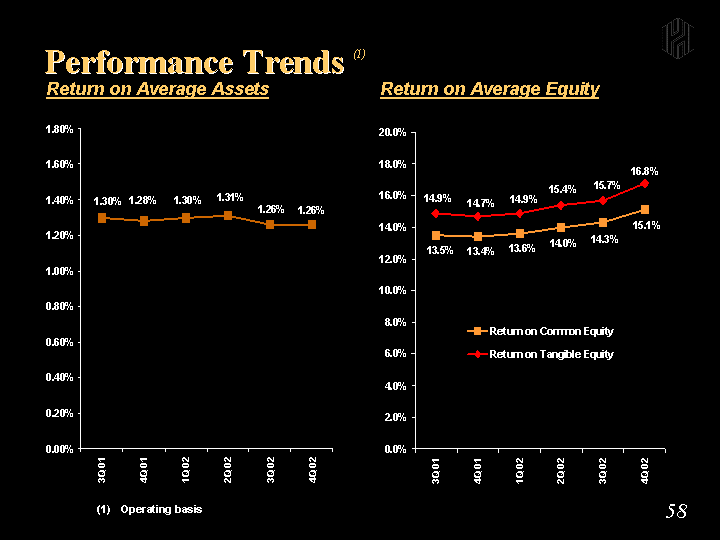
| Performance Trends (1) Return on Average Assets Return on Average Equity Amount 1Q00 0.0145 2Q00 0.0137 3Q00 0.0115 4Q00 0.0106 1Q01 0.0116 2Q01 0.012 3Q01 0.013 4Q01 0.0128 1Q02 0.013 2Q02 0.0131 3Q02 0.0126 4Q02 0.0126 Return on Common Equity Return on Tangible Equity 1Q00 0.1899 2Q00 0.1779 3Q00 0.1404 4Q00 0.1289 1Q01 0.12 2Q01 0.126 0.144 3Q01 0.135 0.149 4Q01 0.134 0.147 1Q02 0.136 0.149 2Q02 0.14 0.154 3Q02 0.143 0.157 4Q02 0.151 0.168 (1) Operating basis |

| Private Financial Group |
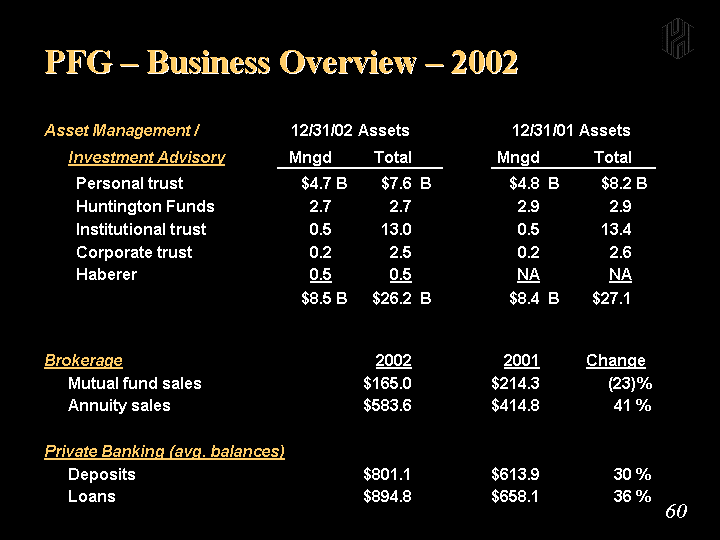
| PFG - Business Overview - 2002 Asset Management / 12/31/02 Assets 12/31/01 Assets Investment Advisory Mngd Total Mngd Total Personal trust $4.7 B $7.6 B $4.8 B $8.2 B Huntington Funds 2.7 2.7 2.9 2.9 Institutional trust 0.5 13.0 0.5 13.4 Corporate trust 0.2 2.5 0.2 2.6 Haberer 0.5 0.5 NA NA $8.5 B $26.2 B $8.4 B $27.1 Brokerage 2002 2001 Change Mutual fund sales $165.0 $214.3 (23) % Annuity sales $583.6 $414.8 41 % Private Banking (avg. balances) Deposits $801.1 $613.9 30 % Loans $894.8 $658.1 36 % |
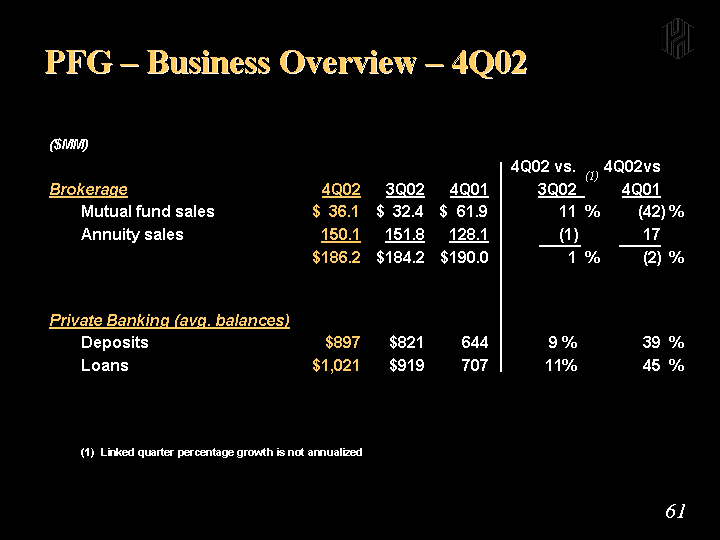
| PFG - Business Overview - 4Q02 ($MM) 4Q02 vs. 4Q02vs Brokerage 4Q02 3Q02 4Q01 3Q02 (1) 4Q01 Mutual fund sales $ 36.1 $ 32.4 $ 61.9 11 % (42) % Annuity sales 150.1 151.8 128.1 (1) 17 $186.2 $184.2 $190.0 1 % (2) % Private Banking (avg. balances) Deposits $897 $821 644 9 % 39 % Loans $1,021 $919 707 11% 45 % (1) Linked quarter percentage growth is not annualized |
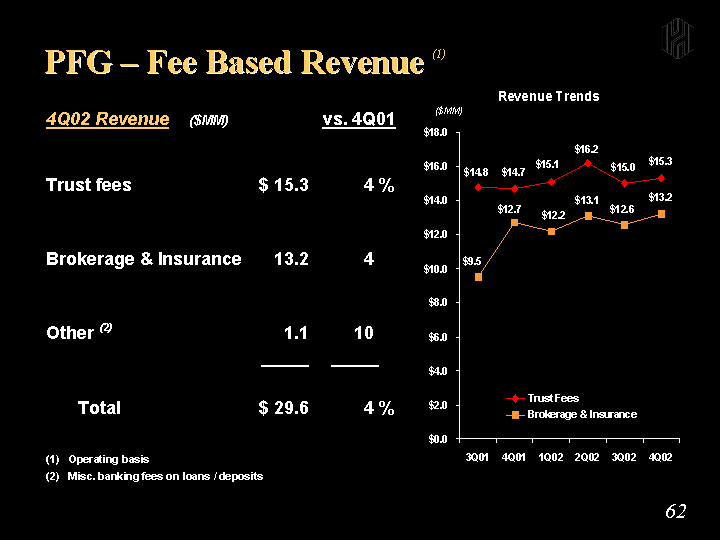
| 4Q02 Revenue ($MM) vs. 4Q01 Trust fees $ 15.3 4 % Brokerage & Insurance 13.2 4 Other (2) 1.1 10 Total $ 29.6 4 % (1) Operating basis (2) Misc. banking fees on loans / deposits PFG - Fee Based Revenue (1) Trust Fees Brokerage & Insurance 1Q01 13.7 10.9 2Q01 14.4 11.1 3Q01 14.8 9.5 4Q01 14.7 12.7 1Q02 15.1 12.2 2Q02 16.2 13.1 3Q02 15 12.6 4Q02 15.3 13.2 ($MM) |
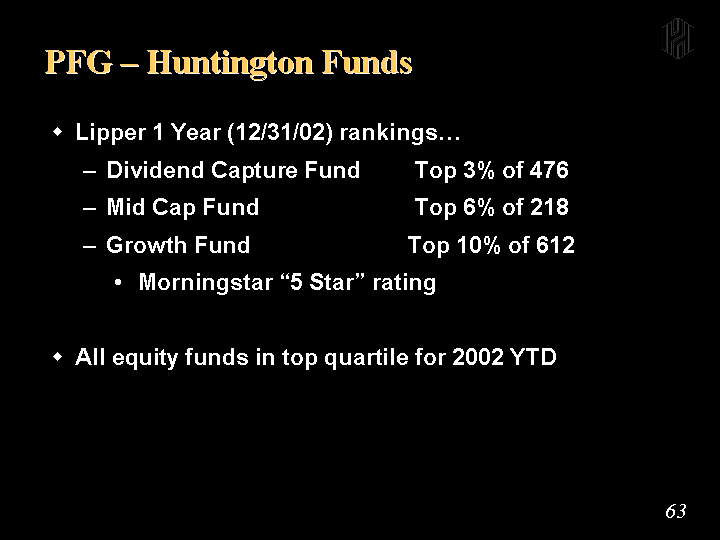
| PFG - Huntington Funds Lipper 1 Year (12/31/02) rankings... Dividend Capture Fund Top 3% of 476 Mid Cap Fund Top 6% of 218 Growth Fund Top 10% of 612 Morningstar "5 Star" rating All equity funds in top quartile for 2002 YTD |
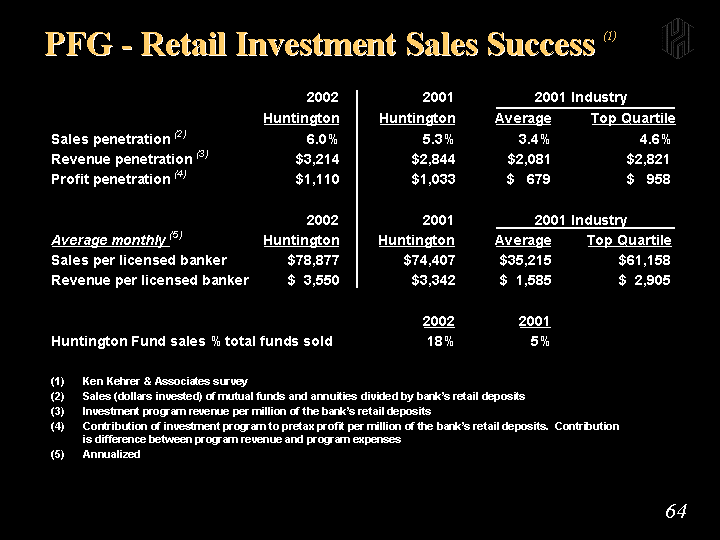
| PFG - Retail Investment Sales Success (1) 2002 2001 2001 Industry Huntington Huntington Average Top Quartile Sales penetration (2) 6.0% 5.3% 3.4% 4.6% Revenue penetration (3) $3,214 $2,844 $2,081 $2,821 Profit penetration (4) $1,110 $1,033 $ 679 $ 958 2002 2001 2001 Industry Average monthly (5) Huntington Huntington Average Top Quartile Sales per licensed banker $78,877 $74,407 $35,215 $61,158 Revenue per licensed banker $ 3,550 $3,342 $ 1,585 $ 2,905 2002 2001 Huntington Fund sales % total funds sold 18% 5% (1) Ken Kehrer & Associates survey (2) Sales (dollars invested) of mutual funds and annuities divided by bank's retail deposits (3) Investment program revenue per million of the bank's retail deposits (4) Contribution of investment program to pretax profit per million of the bank's retail deposits. Contribution is difference between program revenue and program expenses (5) Annualized |