EXHIBIT 99.1
Published on September 16, 2010
Exhibit 99.1
| TM 1 |
| "Breaking Away" Huntington Bancshares IncorporatedInvestor DayNew York CitySeptember 16, 2010 |
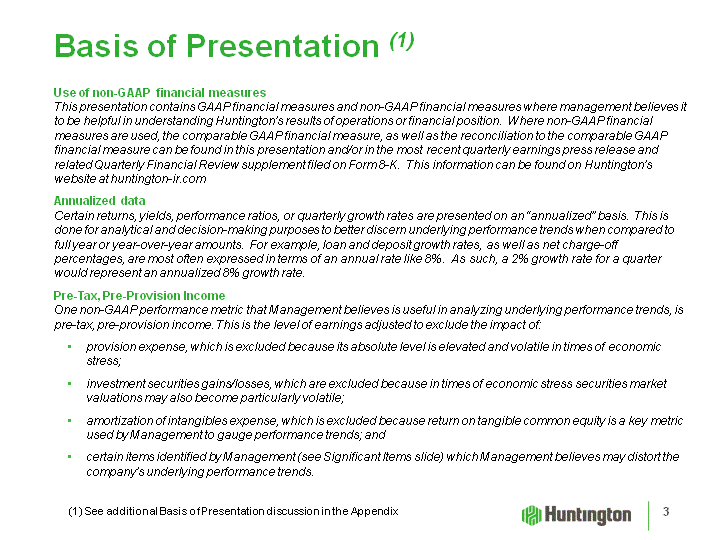
| Basis of Presentation (1) Use of non-GAAP financial measuresThis presentation contains GAAP financial measures and non-GAAP financial measures where management believes it to be helpful in understanding Huntington's results of operations or financial position. Where non-GAAP financial measures are used, the comparable GAAP financial measure, as well as the reconciliation to the comparable GAAP financial measure can be found in this presentation and/or in the most recent quarterly earnings press release and related Quarterly Financial Review supplement filed on Form 8-K. This information can be found on Huntington's website at huntington-ir.comAnnualized dataCertain returns, yields, performance ratios, or quarterly growth rates are presented on an "annualized" basis. This is done for analytical and decision-making purposes to better discern underlying performance trends when compared to full year or year-over-year amounts. For example, loan and deposit growth rates, as well as net charge-off percentages, are most often expressed in terms of an annual rate like 8%. As such, a 2% growth rate for a quarter would represent an annualized 8% growth rate.Pre-Tax, Pre-Provision IncomeOne non-GAAP performance metric that Management believes is useful in analyzing underlying performance trends, is pre-tax, pre-provision income. This is the level of earnings adjusted to exclude the impact of:provision expense, which is excluded because its absolute level is elevated and volatile in times of economic stress;investment securities gains/losses, which are excluded because in times of economic stress securities market valuations may also become particularly volatile;amortization of intangibles expense, which is excluded because return on tangible common equity is a key metric used by Management to gauge performance trends; and certain items identified by Management (see Significant Items slide) which Management believes may distort the company's underlying performance trends. (1) See additional Basis of Presentation discussion in the Appendix 3 |
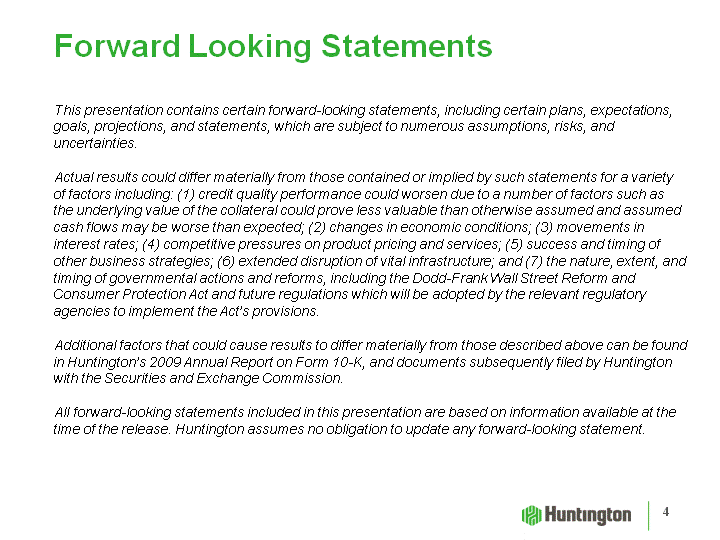
| Forward Looking Statements This presentation contains certain forward-looking statements, including certain plans, expectations, goals, projections, and statements, which are subject to numerous assumptions, risks, and uncertainties.Actual results could differ materially from those contained or implied by such statements for a variety of factors including: (1) credit quality performance could worsen due to a number of factors such as the underlying value of the collateral could prove less valuable than otherwise assumed and assumed cash flows may be worse than expected; (2) changes in economic conditions; (3) movements in interest rates; (4) competitive pressures on product pricing and services; (5) success and timing of other business strategies; (6) extended disruption of vital infrastructure; and (7) the nature, extent, and timing of governmental actions and reforms, including the Dodd-Frank Wall Street Reform and Consumer Protection Act and future regulations which will be adopted by the relevant regulatory agencies to implement the Act's provisions.Additional factors that could cause results to differ materially from those described above can be found in Huntington's 2009 Annual Report on Form 10-K, and documents subsequently filed by Huntington with the Securities and Exchange Commission.All forward-looking statements included in this presentation are based on information available at the time of the release. Huntington assumes no obligation to update any forward-looking statement. 4 |
| Opening Remarks Steve Steinour Chairman, President, & CEO |
| An Industry Redefined Protracted economic weakness Slow and choppy growthA dramatic change in customer psychologyConsumer and business deleveragingDefensive savings and cash accumulationBusinesses reluctant to investConvenience more important than everIntense focus on value and lowering absolute cash outlaysRegulation will decrease revenue, increase costs, and require higher capitalDodd-Frank's hundreds of regulationsConsumer Finance Protection Bureau 6 |
| Some Banks Will... Replace lost fees with new feesCut expensesTake risksJettison businessesThrow in the towel 7 |
| Huntington - A Break Away Opportunity We are...Going beyond the expected overdraft revenue decline to offer transparency and fair value to our customersInvesting in revenue-generating businessesWe will...Dramatically gain share-of-walletTake market share 8 |
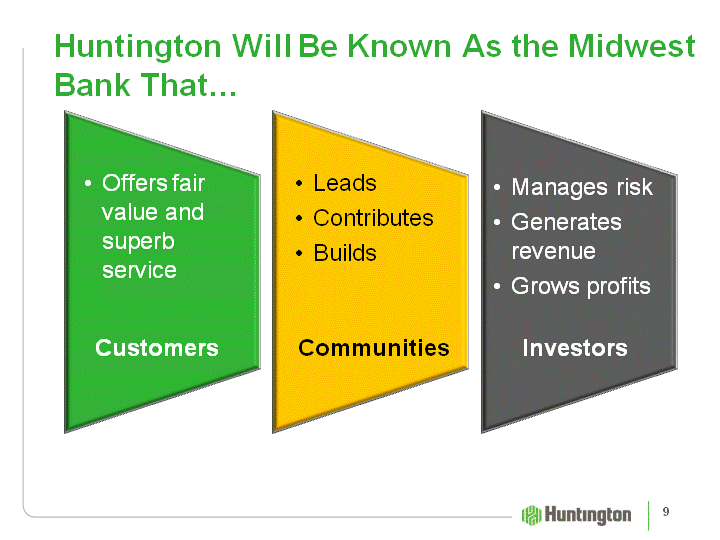
| Huntington Will Be Known As the Midwest Bank That... Offers fair value and superb service Customers LeadsContributesBuilds Communities Manages riskGenerates revenueGrows profits Investors 9 |
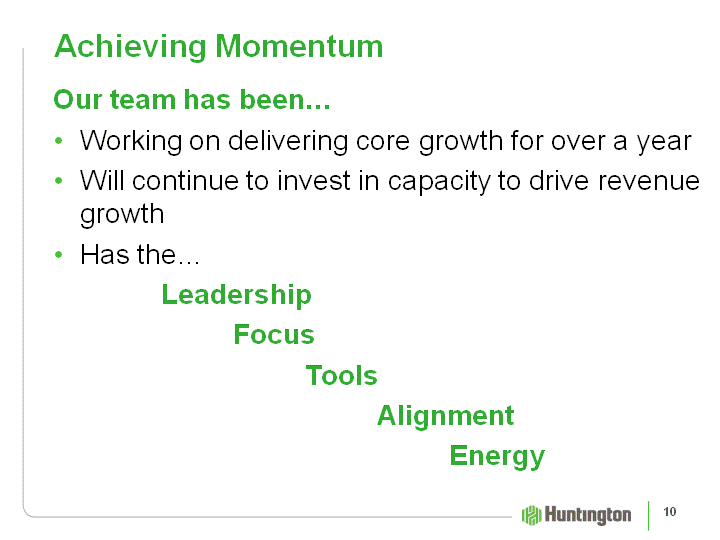
| Achieving Momentum Our team has been...Working on delivering core growth for over a yearWill continue to invest in capacity to drive revenue growthHas the... Leadership Focus Tools Alignment Energy 10 |
| Huntington - A Break Away Story Today We Will Review...Progress on our strategic planOur positioning to exploit this moment in time advantage Initiatives that will drive growthOur long-term vision and performance expectations 11 |
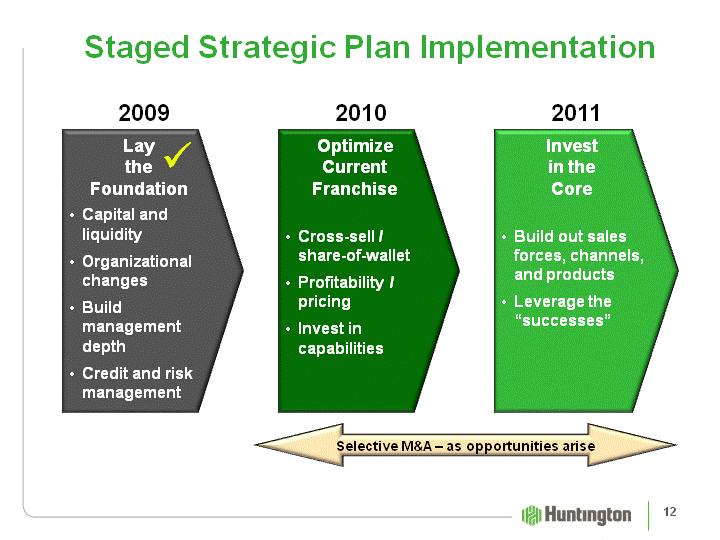
| OptimizeCurrentFranchiseCross-sell / share-of-walletProfitability / pricingInvest in capabilities Staged Strategic Plan Implementation LaytheFoundationCapital and liquidityOrganizational changes Build management depthCredit and risk management Invest in theCoreBuild out sales forces, channels, and productsLeverage the "successes" 2011 Selective M&A - as opportunities arise 2010 2009 12 |
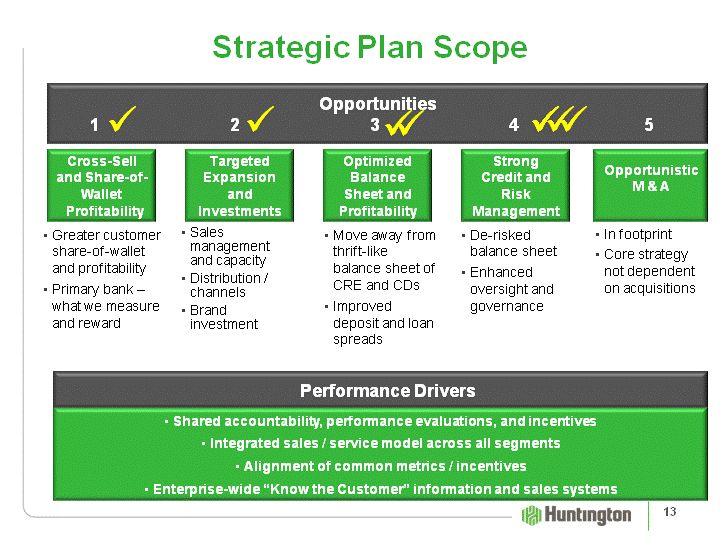
| De-risked balance sheetEnhanced oversight and governance Move away from thrift-like balance sheet of CRE and CDsImproved deposit and loan spreads Greater customer share-of-wallet and profitabilityPrimary bank - what we measure and reward Sales management and capacityDistribution / channelsBrand investment In footprintCore strategy not dependent on acquisitions Strategic Plan Scope Shared accountability, performance evaluations, and incentivesIntegrated sales / service model across all segmentsAlignment of common metrics / incentivesEnterprise-wide "Know the Customer" information and sales systems Strong Credit and Risk Management Optimized Balance Sheet and Profitability Cross-Sell and Share-of- Wallet Profitability Targeted Expansion and Investments Opportunistic M & A Performance Drivers Opportunities 1 2 3 4 5 13 |
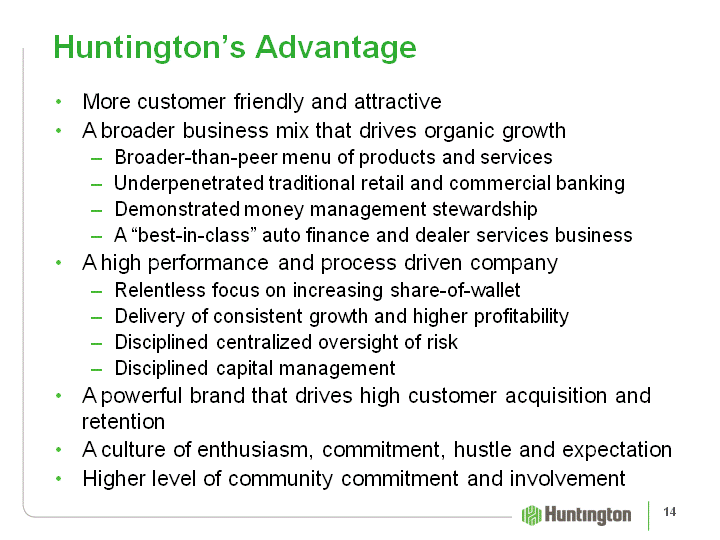
| Huntington's Advantage More customer friendly and attractiveA broader business mix that drives organic growthBroader-than-peer menu of products and servicesUnderpenetrated traditional retail and commercial bankingDemonstrated money management stewardshipA "best-in-class" auto finance and dealer services businessA high performance and process driven companyRelentless focus on increasing share-of-walletDelivery of consistent growth and higher profitabilityDisciplined centralized oversight of riskDisciplined capital managementA powerful brand that drives high customer acquisition and retentionA culture of enthusiasm, commitment, hustle and expectationHigher level of community commitment and involvement 14 |
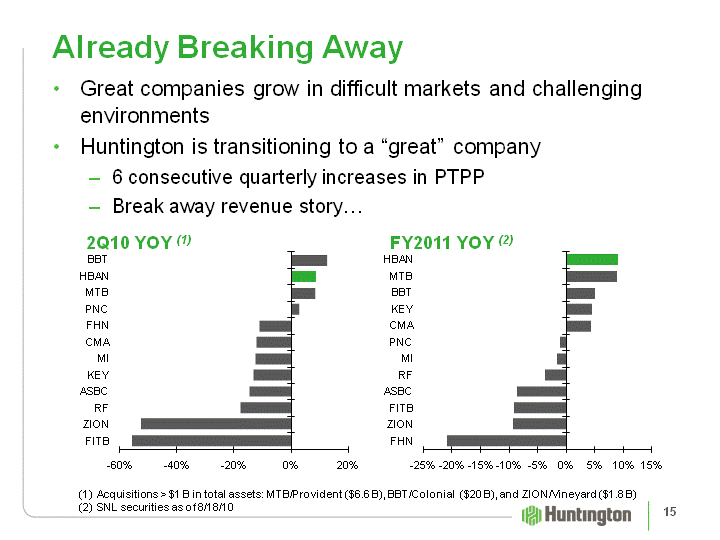
| (CHART) Already Breaking Away Great companies grow in difficult markets and challenging environmentsHuntington is transitioning to a "great" company6 consecutive quarterly increases in PTPPBreak away revenue story... Acquisitions > $1 B in total assets: MTB/Provident ($6.6 B), BBT/Colonial ($20 B), and ZION/Vineyard ($1.8 B)SNL securities as of 8/18/10 (CHART) 2Q10 YOY (1) FY2011 YOY (2) 15 |
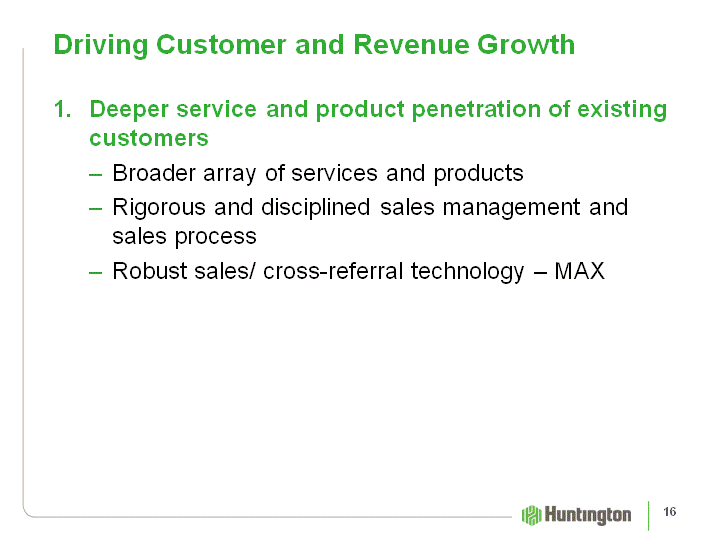
| Driving Customer and Revenue Growth Deeper service and product penetration of existing customersBroader array of services and productsRigorous and disciplined sales management and sales processRobust sales/ cross-referral technology - MAX 16 |
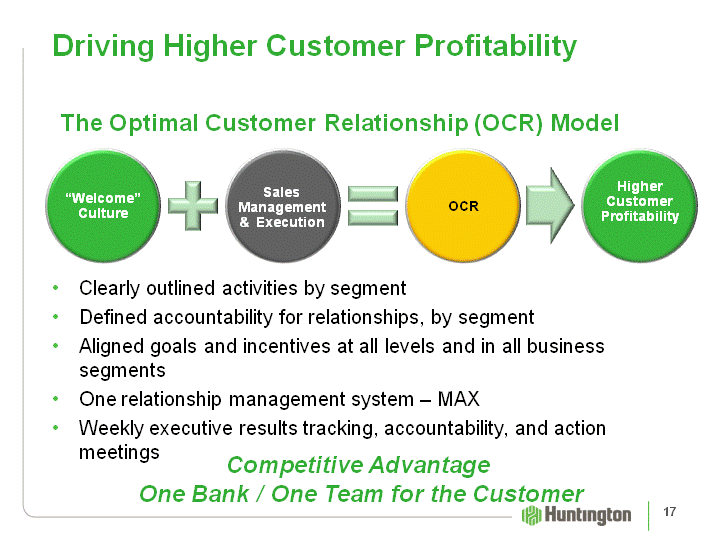
| Driving Higher Customer Profitability Clearly outlined activities by segmentDefined accountability for relationships, by segmentAligned goals and incentives at all levels and in all business segmentsOne relationship management system - MAXWeekly executive results tracking, accountability, and action meetings Competitive Advantage One Bank / One Team for the Customer The Optimal Customer Relationship (OCR) Model "Welcome" Culture Sales Management & Execution OCR Higher Customer Profitability 17 |
| Driving Customer and Revenue Growth Grow customer base and take market shareA compelling banking philosophy - "Fair Play" bankingIncrease convenience and multiply the effective size of our existing footprintSelective out-of-footprint expansionOpportunistic acquisitions 18 |
| Our "Fair Play" Banking Philosophy Deliver a Category of One customer experience that drives higher relative customer satisfaction and acquisitionNo nuisance fees... our version of Southwest Airline's successful "The Bags Fly Free"(r) market positioningSimple / compelling productsMost convenient bank in OhioBest customer serviceRelationship driven 19 |
| Driving Customer and Revenue Growth A powerful brand 20 |
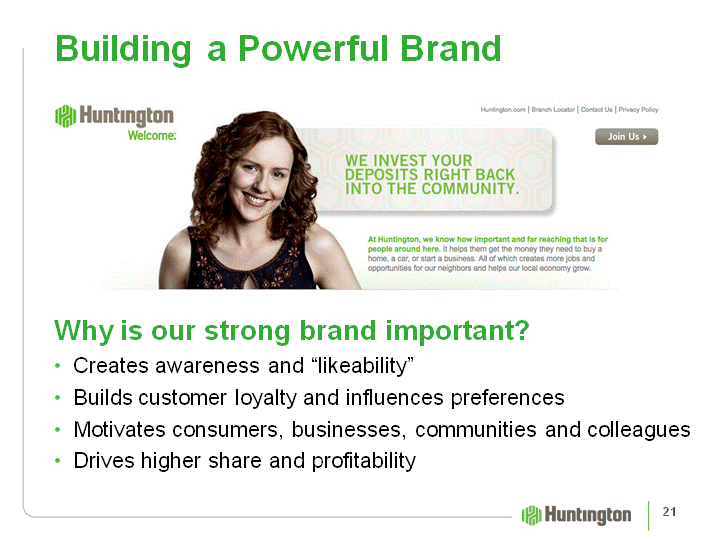
| Building a Powerful Brand Why is our strong brand important?Creates awareness and "likeability"Builds customer loyalty and influences preferencesMotivates consumers, businesses, communities and colleaguesDrives higher share and profitability 21 |
| Building a Powerful Brand The Bank Committed to the MidwestFull commitmentMaking investmentsSourcing locallyBig enough to make an impact on our communitiesValue PropositionValue - Deliver superior customer value through exceptional products and services that meet our customers' needsValues - Shared values with our customers - honest, fair, speak a common language, and share common goals for our families, neighborhoods, and communitiesInvaluable - An invaluable partner with our customers and an invaluable community partner 22 |
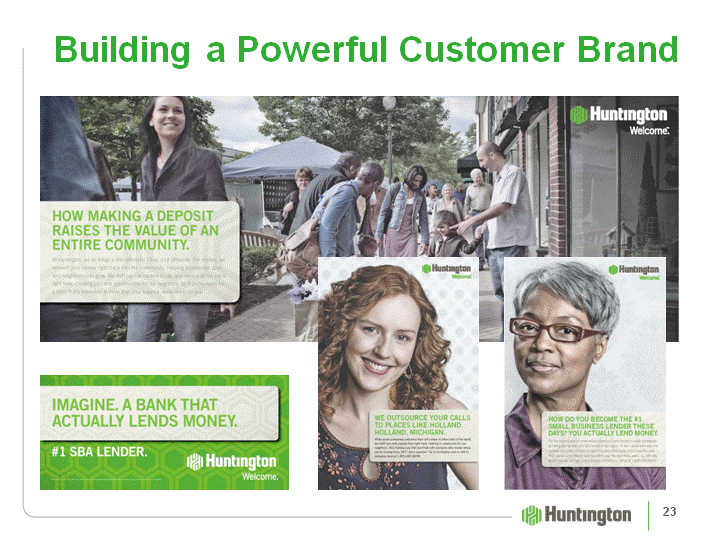
| Building a Powerful Customer Brand 23 |
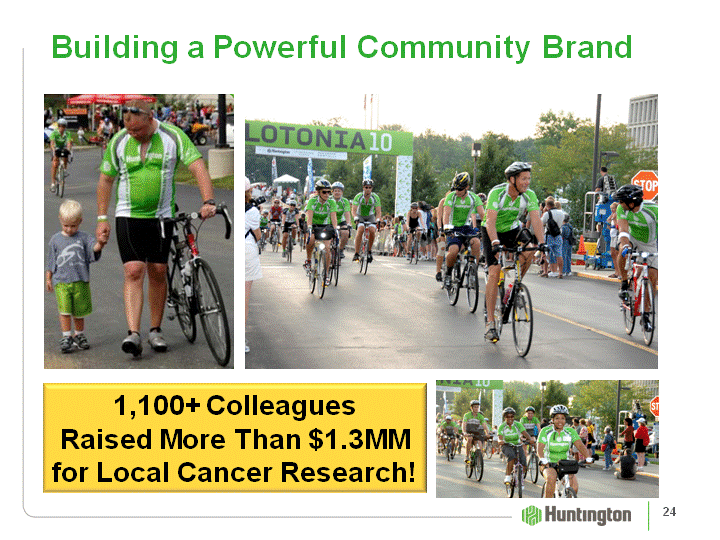
| Building a Powerful Community Brand 1,100+ Colleagues Raised More Than $1.3MM for Local Cancer Research! 24 |
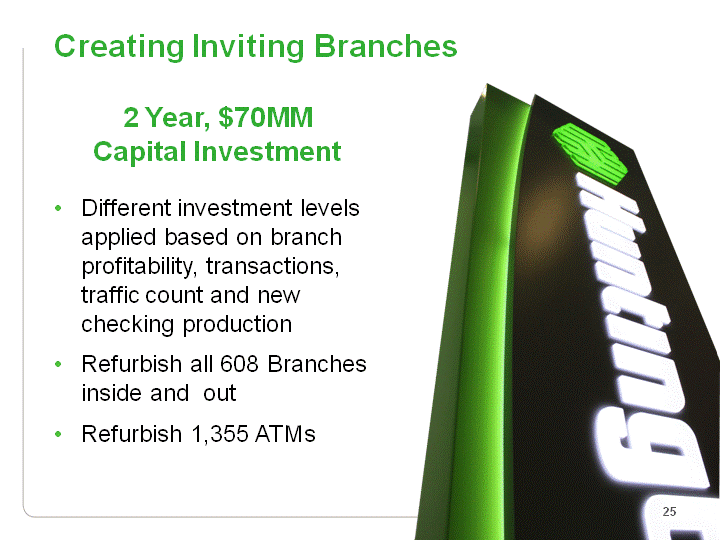
| Creating Inviting Branches 2 Year, $70MM Capital Investment Different investment levels applied based on branch profitability, transactions, traffic count and new checking productionRefurbish all 608 Branches inside and outRefurbish 1,355 ATMs 25 |
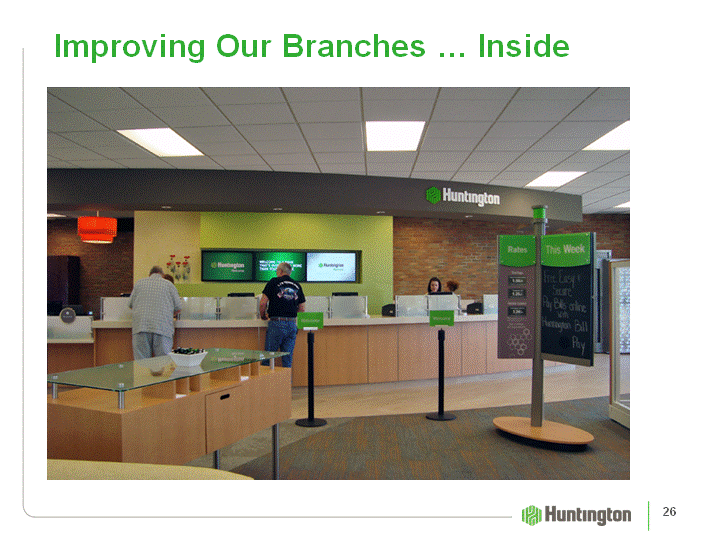
| Improving Our Branches ... Inside 26 |
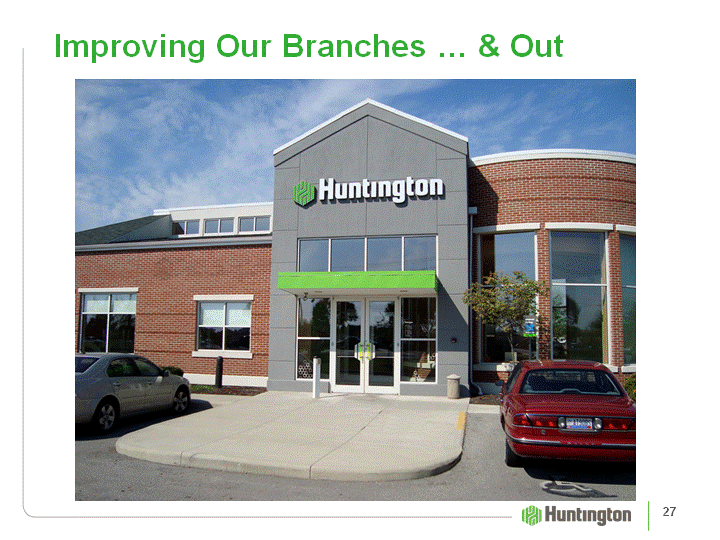
| Improving Our Branches ... & Out 27 |
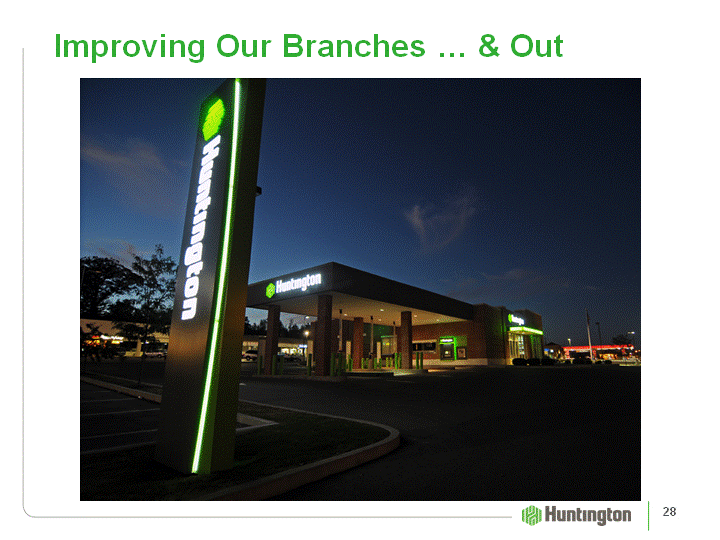
| Improving Our Branches ... & Out 28 |
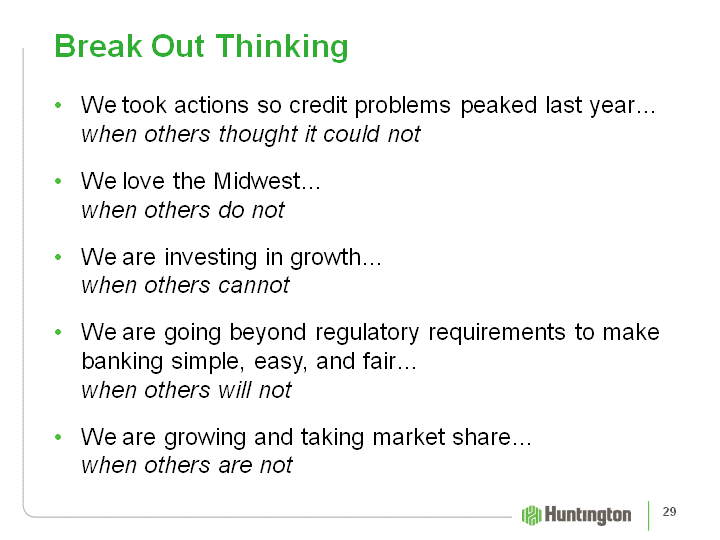
| Break Out Thinking We took actions so credit problems peaked last year... when others thought it could notWe love the Midwest... when others do notWe are investing in growth... when others cannotWe are going beyond regulatory requirements to make banking simple, easy, and fair... when others will notWe are growing and taking market share... when others are not 29 |
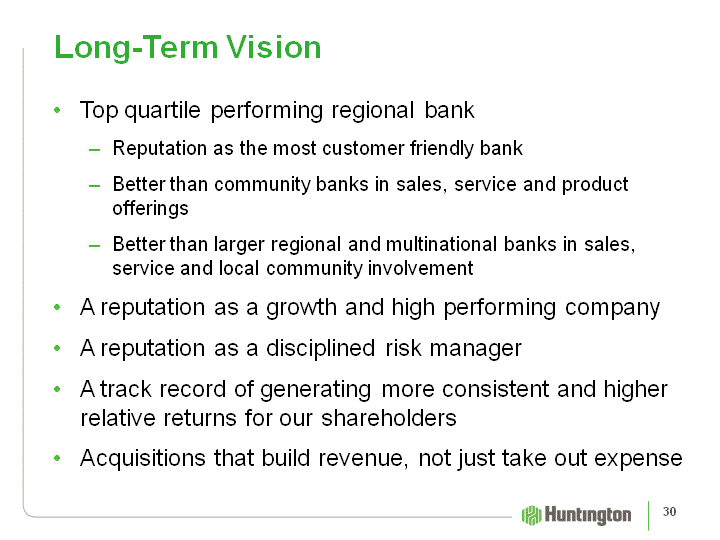
| Long-Term Vision Top quartile performing regional bankReputation as the most customer friendly bankBetter than community banks in sales, service and product offeringsBetter than larger regional and multinational banks in sales, service and local community involvementA reputation as a growth and high performing companyA reputation as a disciplined risk managerA track record of generating more consistent and higher relative returns for our shareholdersAcquisitions that build revenue, not just take out expense 30 |
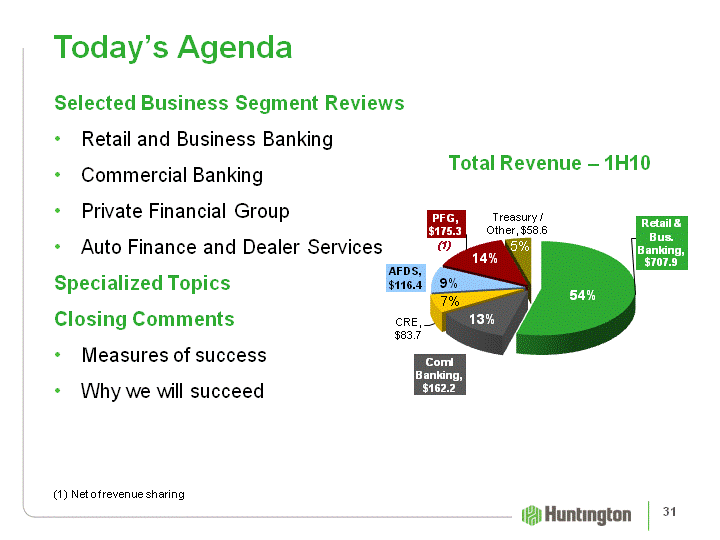
| (CHART) (1) Today's Agenda Total Revenue - 1H10 (1) Net of revenue sharing Selected Business Segment ReviewsRetail and Business BankingCommercial BankingPrivate Financial GroupAuto Finance and Dealer ServicesSpecialized TopicsClosing CommentsMeasures of successWhy we will succeed 54% 13% 7% 9% 14% 5% 31 |
| Retail & Business Banking Mary Navarro SEVP - Retail and Business Banking Director |
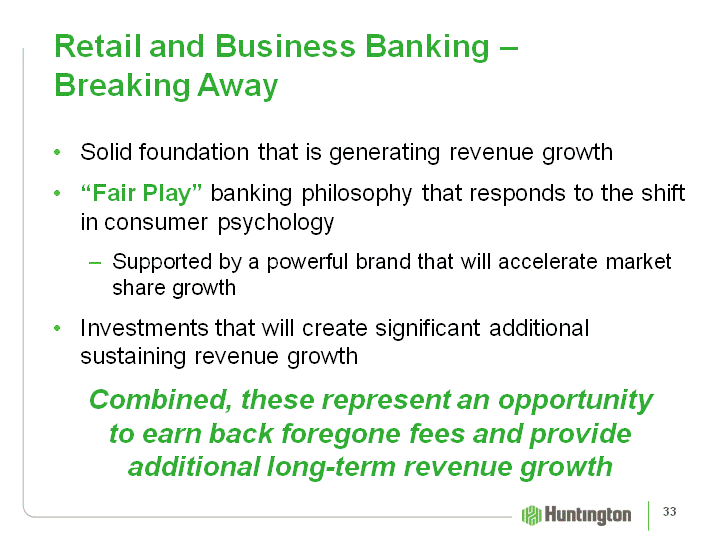
| Retail and Business Banking - Breaking Away Solid foundation that is generating revenue growth"Fair Play" banking philosophy that responds to the shift in consumer psychologySupported by a powerful brand that will accelerate market share growthInvestments that will create significant additional sustaining revenue growthCombined, these represent an opportunity to earn back foregone fees and provide additional long-term revenue growth 33 |
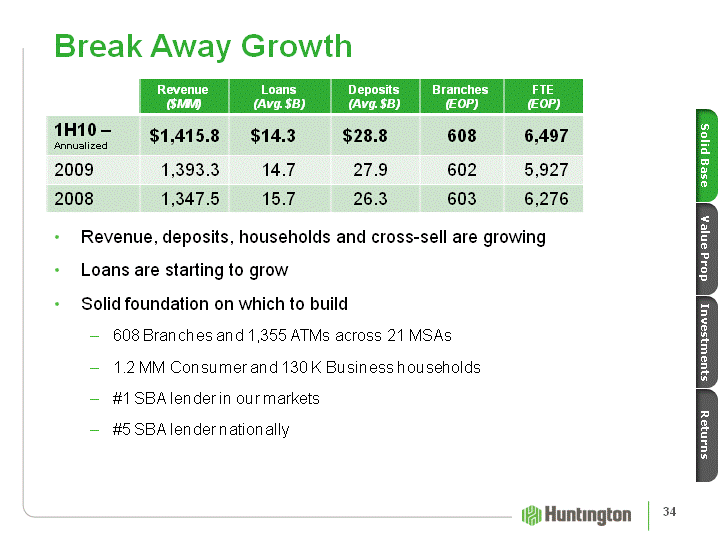
| Break Away Growth Revenue, deposits, households and cross-sell are growingLoans are starting to growSolid foundation on which to build608 Branches and 1,355 ATMs across 21 MSAs1.2 MM Consumer and 130 K Business households #1 SBA lender in our markets#5 SBA lender nationally Revenue($MM) Loans (Avg. $B) Deposits (Avg. $B) Branches (EOP) FTE(EOP) 1H10 - Annualized $1,415.8 $14.3 $28.8 608 6,497 2009 1,393.3 14.7 27.9 602 5,927 2008 1,347.5 15.7 26.3 603 6,276 Solid Base Investments Returns Value Prop 34 |
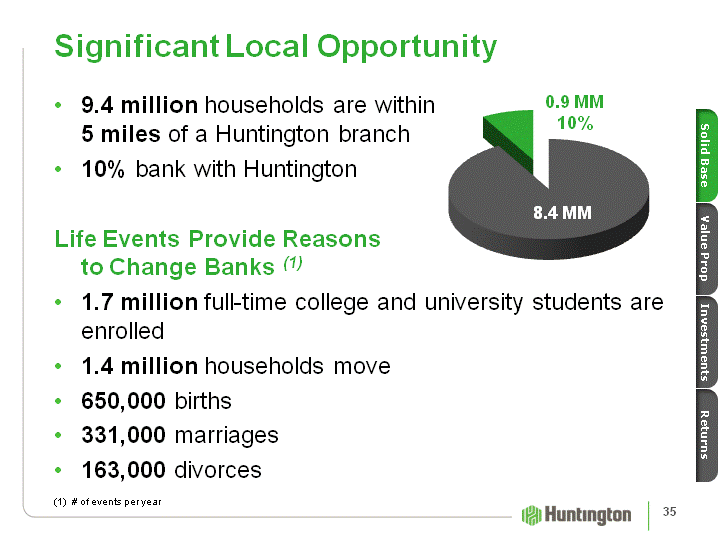
| 9.4 million households are within 5 miles of a Huntington branch10% bank with HuntingtonLife Events Provide Reasons to Change Banks (1)1.7 million full-time college and university students are enrolled1.4 million households move650,000 births331,000 marriages163,000 divorces Significant Local Opportunity (CHART) 0.9 MM 10% 8.4 MM # of events per year Solid Base Investments Returns Value Prop 35 |
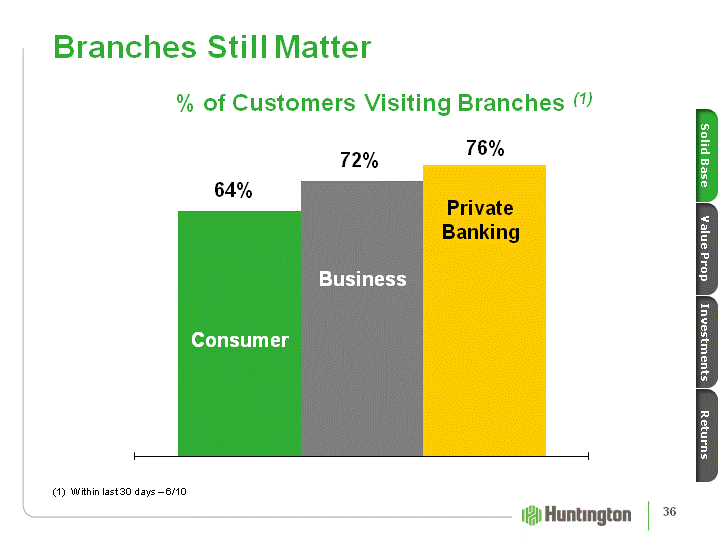
| (CHART) Branches Still Matter % of Customers Visiting Branches (1) Consumer Business 76% 72% 64% Solid Base Investments Returns Value Prop Within last 30 days - 6/10 36 |
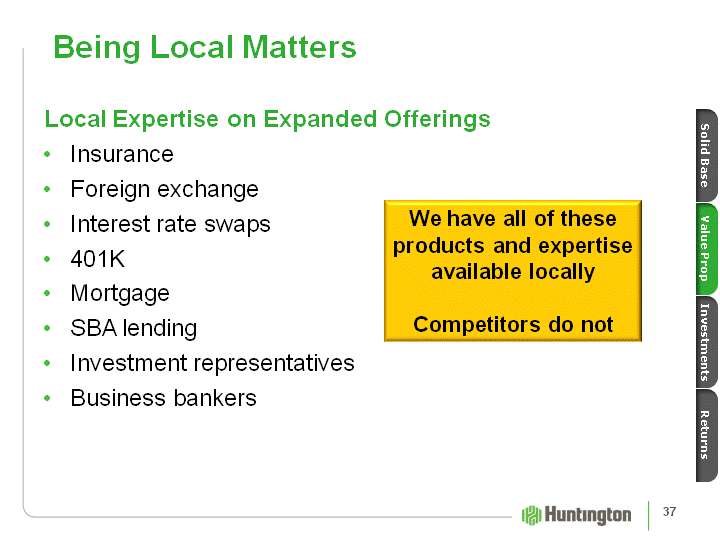
| Being Local Matters Local Expertise on Expanded OfferingsInsuranceForeign exchangeInterest rate swaps401K MortgageSBA lending Investment representativesBusiness bankers Consumer Business 69% 63% 72% 64% We have all of these products and expertise available locally Competitors do not Solid Base Investments Returns Value Prop 37 |
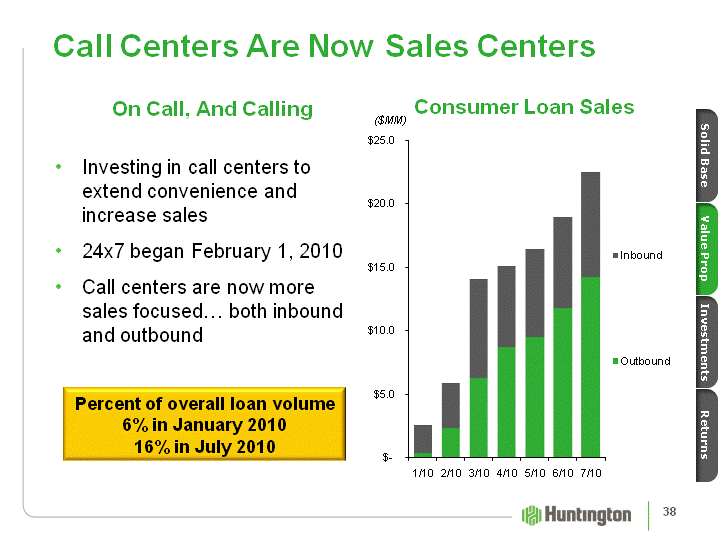
| Call Centers Are Now Sales Centers On Call, And Calling Investing in call centers to extend convenience and increase sales24x7 began February 1, 2010Call centers are now more sales focused... both inbound and outbound Consumer Loan Sales ($MM) Percent of overall loan volume 6% in January 2010 16% in July 2010 Solid Base Investments Returns Value Prop (CHART) 38 |
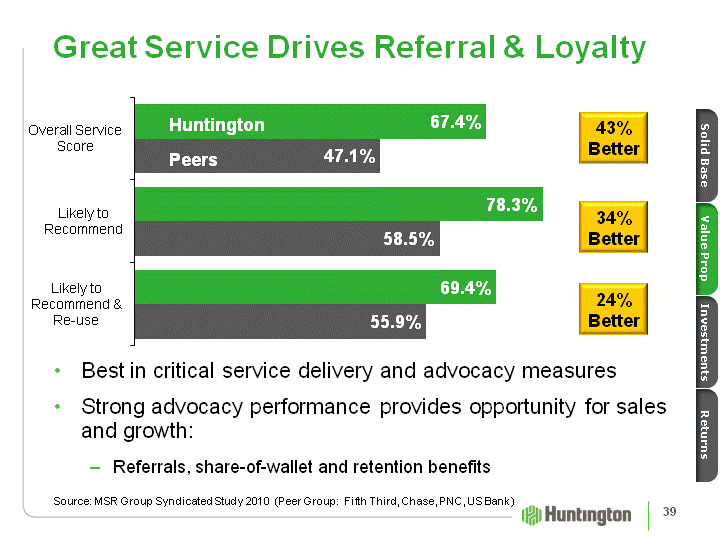
| Great Service Drives Referral & Loyalty Solid Base Investments Returns Value Prop (CHART) Best in critical service delivery and advocacy measuresStrong advocacy performance provides opportunity for sales and growth:Referrals, share-of-wallet and retention benefits Huntington Peers 43% Better 34% Better 24% Better Source: MSR Group Syndicated Study 2010 (Peer Group: Fifth Third, Chase, PNC, US Bank) 39 |
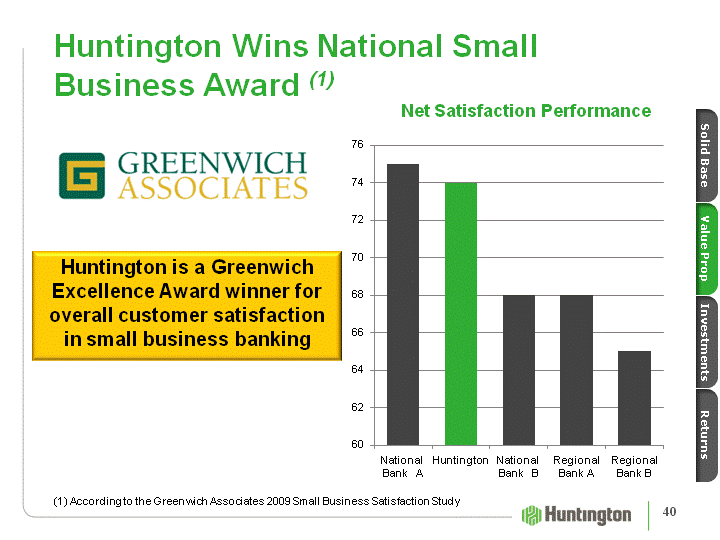
| Net Satisfaction Performance Huntington Wins National Small Business Award (1) Solid Base Investments Returns Value Prop Huntington is a Greenwich Excellence Award winner for overall customer satisfaction in small business banking(CHART) (1) According to the Greenwich Associates 2009 Small Business Satisfaction Study 40 |
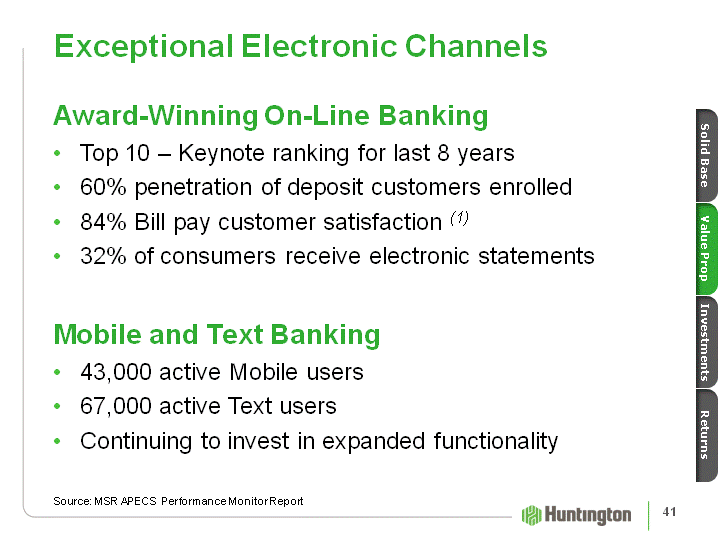
| Exceptional Electronic Channels Award-Winning On-Line BankingTop 10 - Keynote ranking for last 8 years60% penetration of deposit customers enrolled84% Bill pay customer satisfaction (1)32% of consumers receive electronic statementsMobile and Text Banking43,000 active Mobile users67,000 active Text usersContinuing to invest in expanded functionality Solid Base Investments Returns Value Prop Source: MSR APECS Performance Monitor Report 41 |
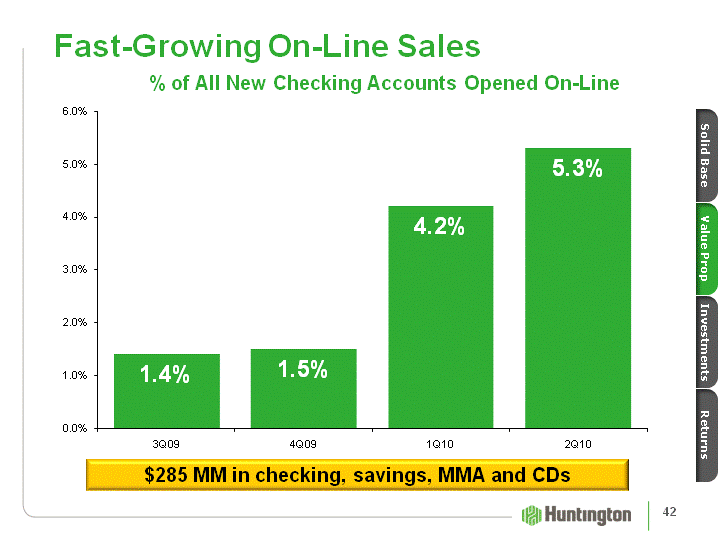
| Fast-Growing On-Line Sales (CHART) % of All New Checking Accounts Opened On-Line $285 MM in checking, savings, MMA and CDs Solid Base Investments Returns Value Prop 42 |

| Increasing Convenience - More Hours Mean More Revenue 67 hrs/week - More than Other BanksLeverages Existing Distribution53 Cleveland branchesM-F, 8a-7p; Sat, 8a-4p; Sun, 12-4pCreates Revenue LiftChecking sales 28% higherBalance growthHigher service charge incomeMajority of new accounts from largest competitors Current sales results are equivalent to 15 more branches. Solid Base Investments Returns Value Prop 43 |
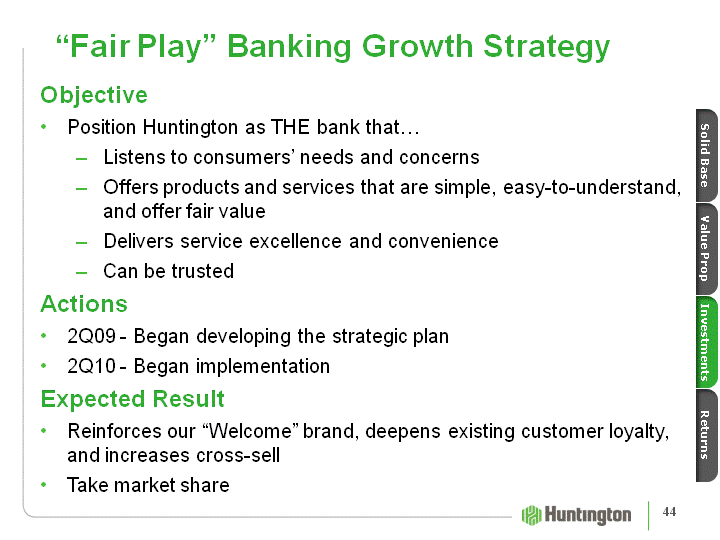
| "Fair Play" Banking Growth Strategy ObjectivePosition Huntington as THE bank that... Listens to consumers' needs and concernsOffers products and services that are simple, easy-to-understand, and offer fair valueDelivers service excellence and convenienceCan be trustedActions2Q09 - Began developing the strategic plan2Q10 - Began implementationExpected ResultReinforces our "Welcome" brand, deepens existing customer loyalty, and increases cross-sellTake market share Solid Base Investments Returns Value Prop 44 |
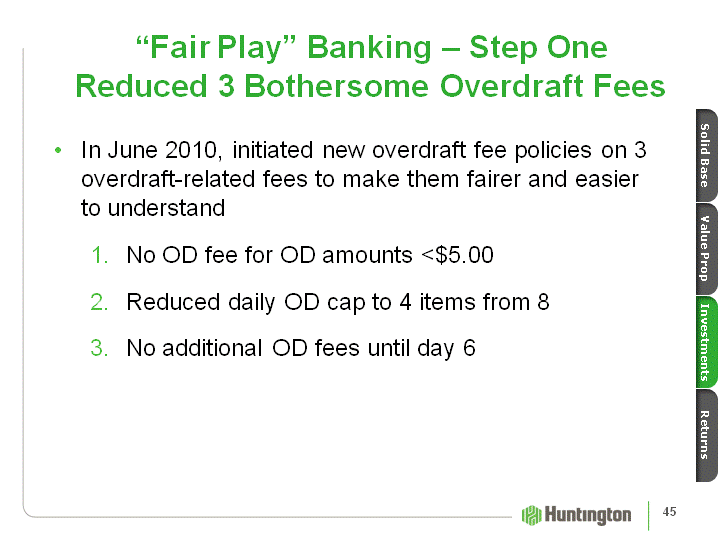
| "Fair Play" Banking - Step One Reduced 3 Bothersome Overdraft Fees In June 2010, initiated new overdraft fee policies on 3 overdraft-related fees to make them fairer and easier to understandNo OD fee for OD amounts <$5.00Reduced daily OD cap to 4 items from 8No additional OD fees until day 6 Solid Base Investments Returns Value Prop 45 |
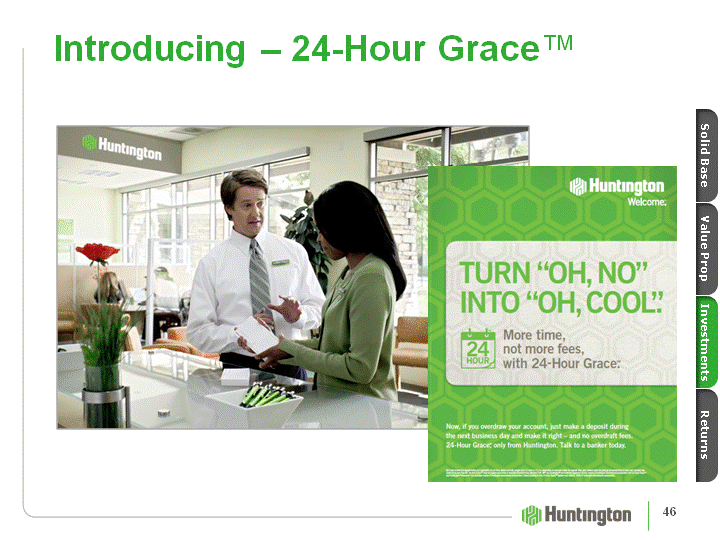
| Introducing - 24-Hour Grace(tm) Solid Base Investments Returns Value Prop 46 |
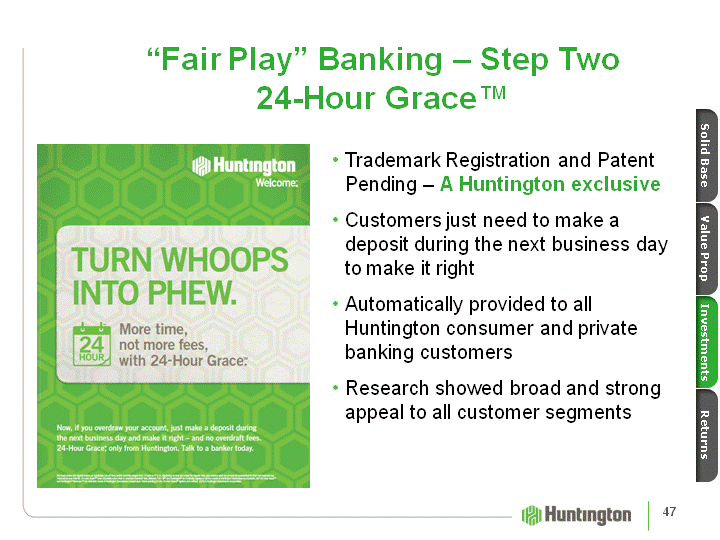
| "Fair Play" Banking - Step Two 24-Hour Grace(tm) Trademark Registration and Patent Pending - A Huntington exclusiveCustomers just need to make a deposit during the next business day to make it rightAutomatically provided to all Huntington consumer and private banking customersResearch showed broad and strong appeal to all customer segments Solid Base Investments Returns Value Prop 47 |
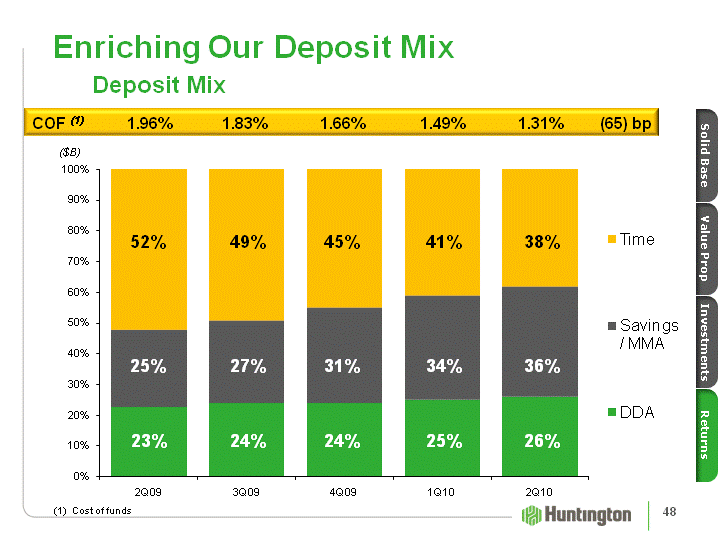
| (CHART) Enriching Our Deposit Mix Deposit Mix ($B) 25% 36% 24% 25% 26% 34% 31% 27% 23% 24% 52% 49% 45% 41% 38% COF (1) 1.96% 1.83% 1.66% 1.49% 1.31% (65) bp Solid Base Investments Returns Value Prop (1) Cost of funds 48 |
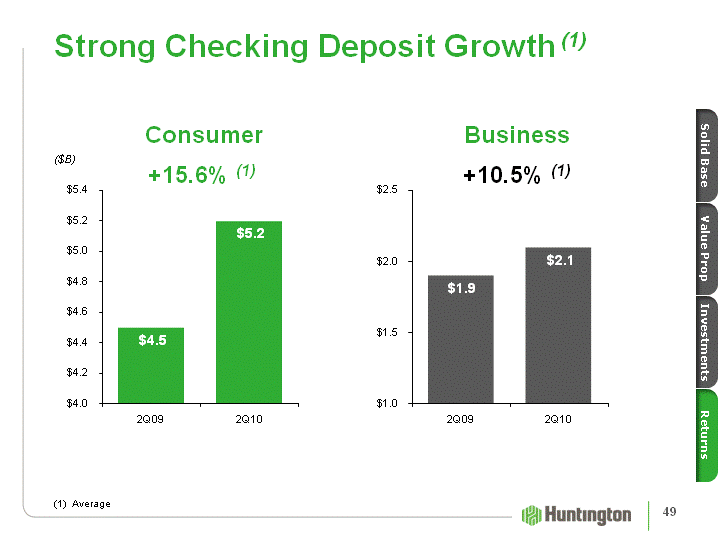
| (CHART) (CHART) Strong Checking Deposit Growth (1) Consumer +15.6% (1) +10.5% (1) Business (1) Average ($B) Solid Base Investments Returns Value Prop 49 |
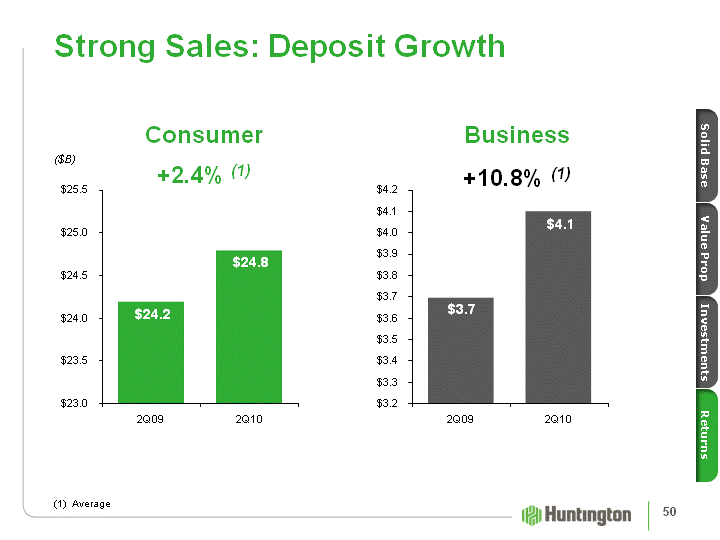
| (CHART) (CHART) Strong Sales: Deposit Growth Consumer +2.4% (1) +10.8% (1) Business (1) Average ($B) Solid Base Investments Returns Value Prop 50 |
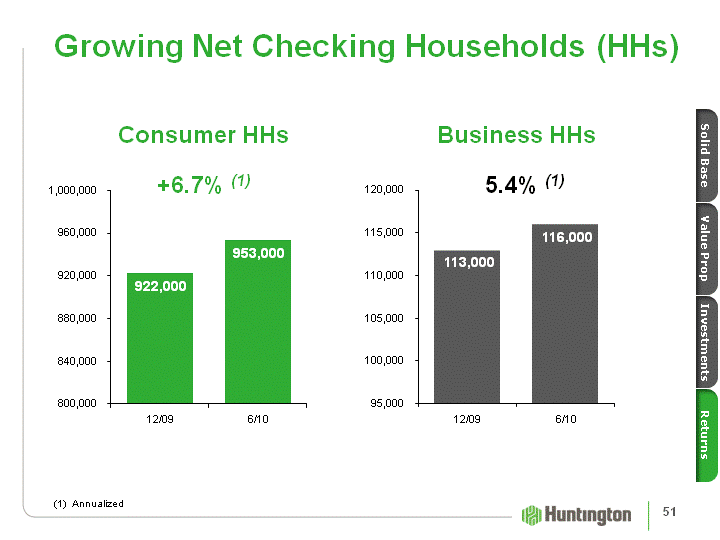
| (CHART) (CHART) Growing Net Checking Households (HHs) Consumer HHs +6.7% (1) 5.4% (1) Business HHs (1) Annualized Solid Base Investments Returns Value Prop 51 |
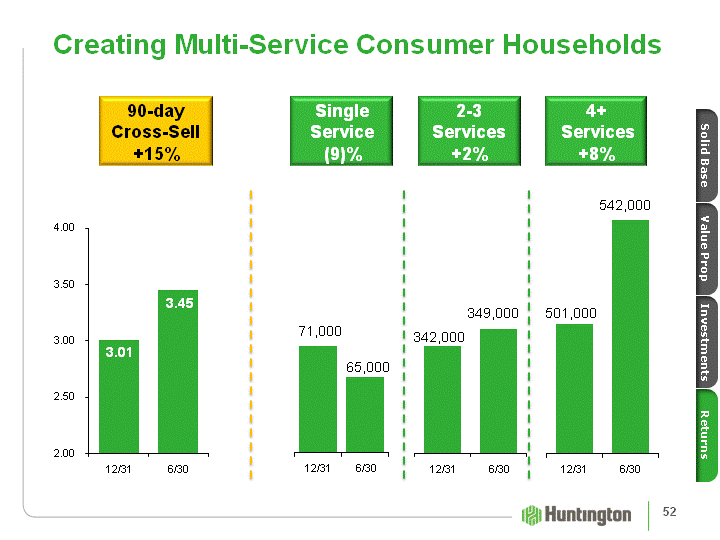
| Creating Multi-Service Consumer Households (CHART) 90-dayCross-Sell+15% Solid Base Investments Returns Value Prop 4+ Services+8% 2-3Services+2% SingleService(9)% (CHART) (CHART) (CHART) 71,000 65,000 342,000 349,000 501,000 542,000 52 |

| Loan Production Growing (1) (CHART) ($MM) +52% (2) +80% (2) +91% (2) Monthly originations6/10 vs. 1/10 Solid Base Investments Returns Value Prop 53 |
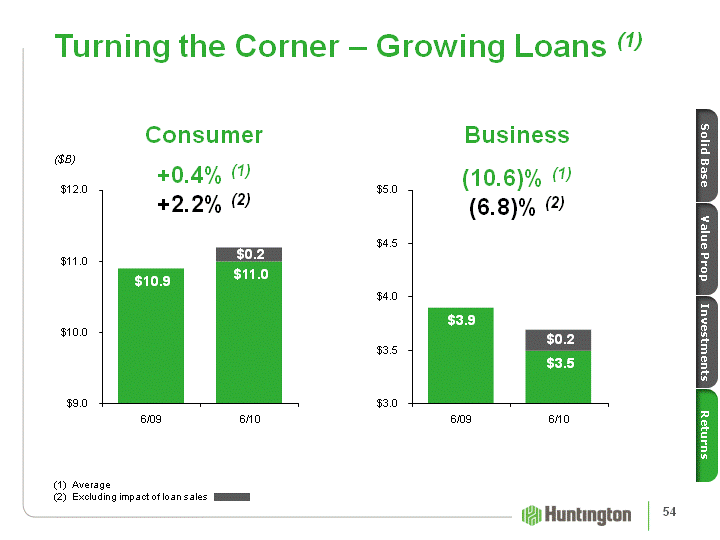
| (CHART) (CHART) Turning the Corner - Growing Loans (1) Consumer +0.4% (1)+2.2% (2) (10.6)% (1)(6.8)% (2) Business AverageExcluding impact of loan sales ($B) Solid Base Investments Returns Value Prop 54 |
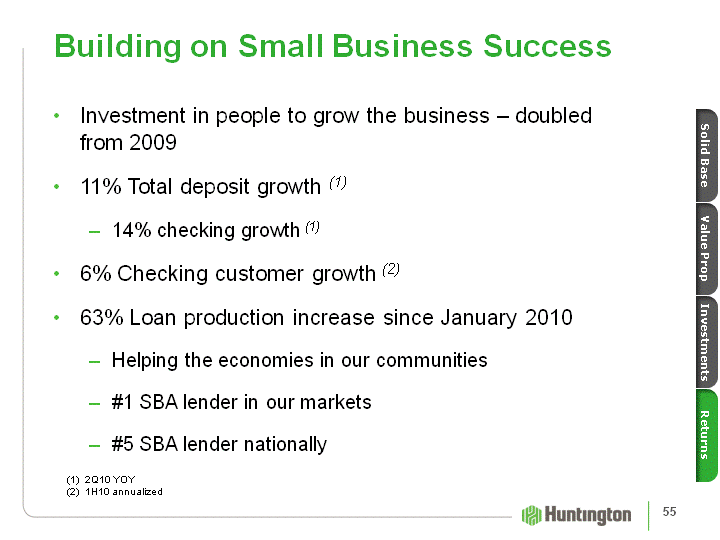
| Building on Small Business Success Investment in people to grow the business - doubled from 200911% Total deposit growth (1)14% checking growth (1)6% Checking customer growth (2)63% Loan production increase since January 2010Helping the economies in our communities#1 SBA lender in our markets#5 SBA lender nationally 2Q10 YOY1H10 annualized Solid Base Investments Returns Value Prop 55 |
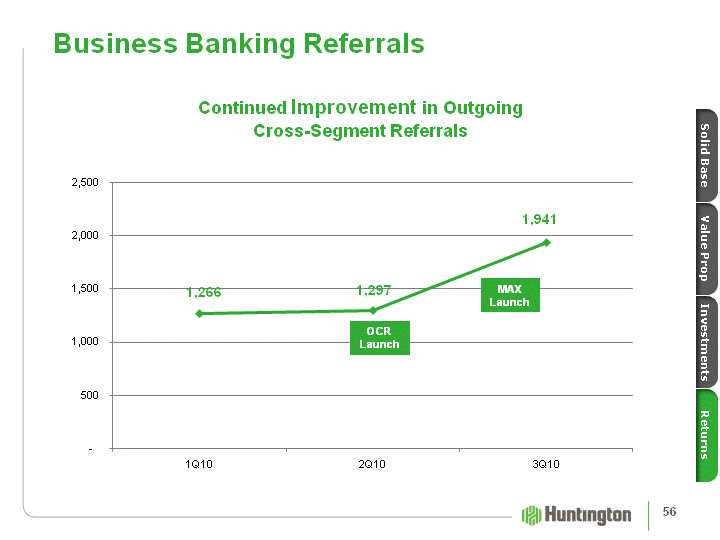
| (CHART) Business Banking Referrals OCR Launch MAX Launch Solid Base Investments Returns Value Prop Continued Improvement in Outgoing Cross-Segment Referrals 56 |
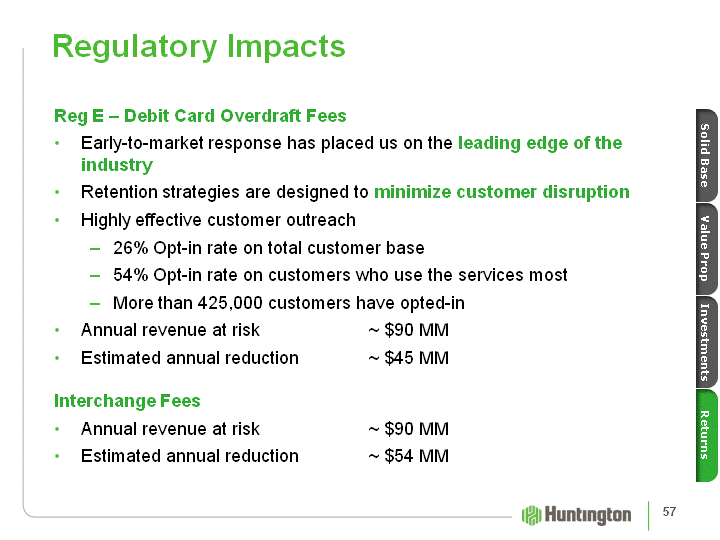
| Regulatory Impacts Reg E - Debit Card Overdraft FeesEarly-to-market response has placed us on the leading edge of the industryRetention strategies are designed to minimize customer disruptionHighly effective customer outreach26% Opt-in rate on total customer base54% Opt-in rate on customers who use the services mostMore than 425,000 customers have opted-inAnnual revenue at risk ~ $90 MMEstimated annual reduction ~ $45 MMInterchange FeesAnnual revenue at risk ~ $90 MMEstimated annual reduction ~ $54 MM Solid Base Investments Returns Value Prop 57 |

| The 2011 Incremental Revenue Equation The 2011 Incremental Revenue Equation 2011 full year estimated impact of $45 MM less 2010 partial year estimated impact of $21 MM2011 full year estimated impact of $54 MM pro-rata for impact beginning 8/112011 full year estimated impact of $36 MM less 2010 partial year estimated impact of $12 MMBenefit of continued reduction in CD funding2011 growth rate 2% higher than in 2010 Solid Base Investments Returns Value Prop 58 |
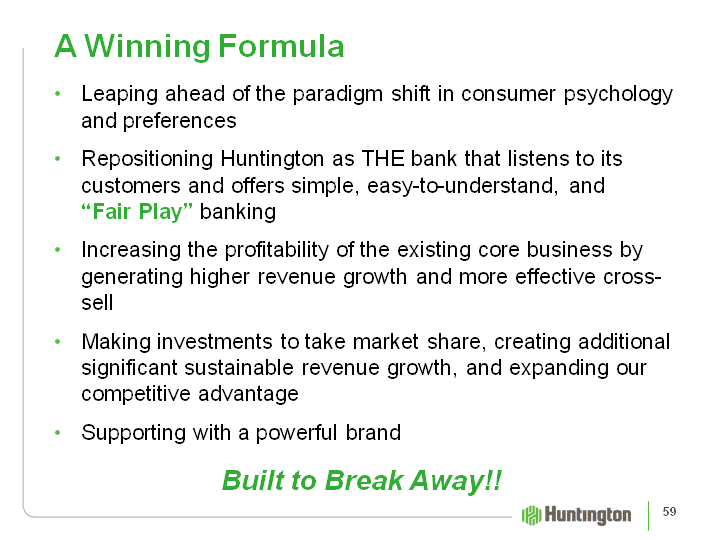
| A Winning Formula Built to Break Away!! Leaping ahead of the paradigm shift in consumer psychology and preferencesRepositioning Huntington as THE bank that listens to its customers and offers simple, easy-to-understand, and "Fair Play" bankingIncreasing the profitability of the existing core business by generating higher revenue growth and more effective cross- sellMaking investments to take market share, creating additional significant sustainable revenue growth, and expanding our competitive advantageSupporting with a powerful brand 59 |
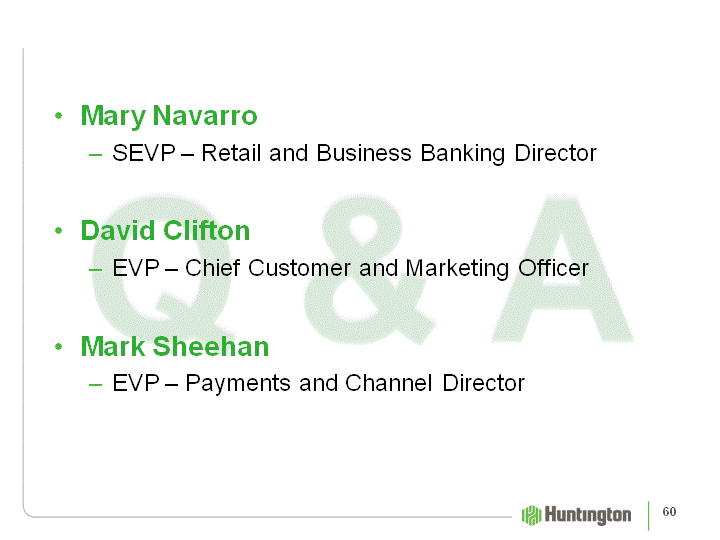
| Q & A Mary NavarroSEVP - Retail and Business Banking DirectorDavid Clifton EVP - Chief Customer and Marketing OfficerMark Sheehan EVP - Payments and Channel Director 60 |
| Commercial Banking Jim Dunlap SEVP - Regional and Commercial Banking Director |
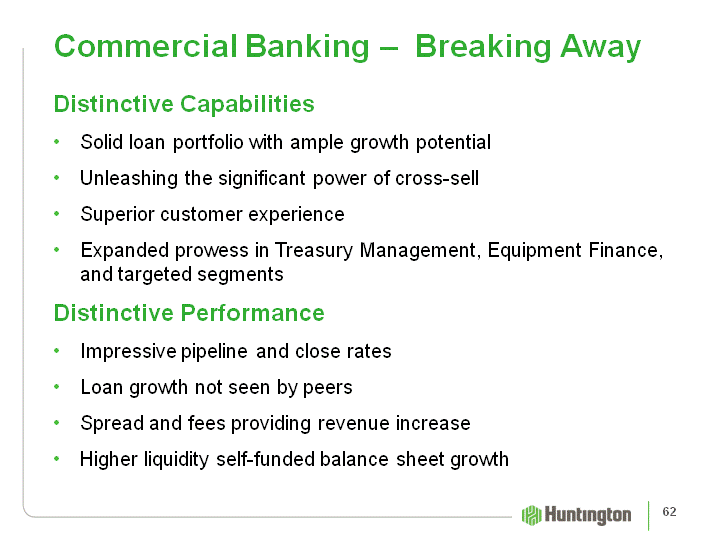
| Commercial Banking - Breaking Away Distinctive CapabilitiesSolid loan portfolio with ample growth potentialUnleashing the significant power of cross-sellSuperior customer experienceExpanded prowess in Treasury Management, Equipment Finance, and targeted segmentsDistinctive PerformanceImpressive pipeline and close ratesLoan growth not seen by peersSpread and fees providing revenue increaseHigher liquidity self-funded balance sheet growth 62 |
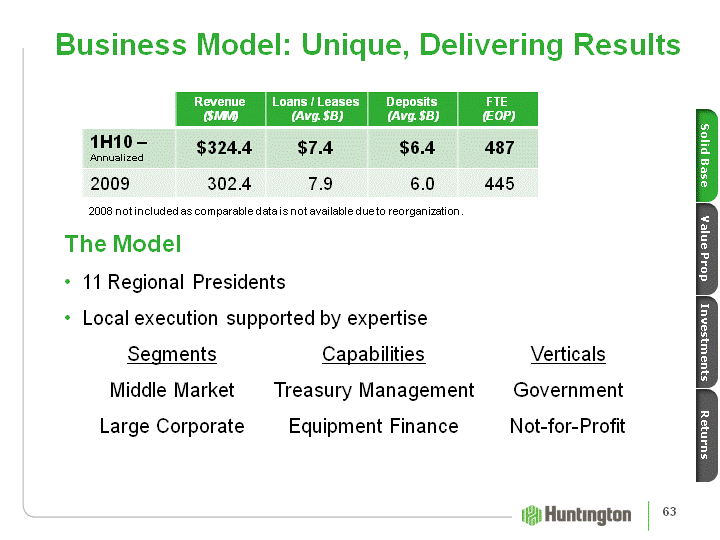
| Business Model: Unique, Delivering Results Revenue($MM) Loans / Leases (Avg. $B) Deposits (Avg. $B) FTE(EOP) 1H10 - Annualized $324.4 $7.4 $6.4 487 2009 302.4 7.9 6.0 445 2008 not included as comparable data is not available due to reorganization. The Model11 Regional PresidentsLocal execution supported by expertise Segments Capabilities Verticals Middle Market Treasury Management Government Large Corporate Equipment Finance Not-for-Profit Solid Base Investments Returns Value Prop 63 |
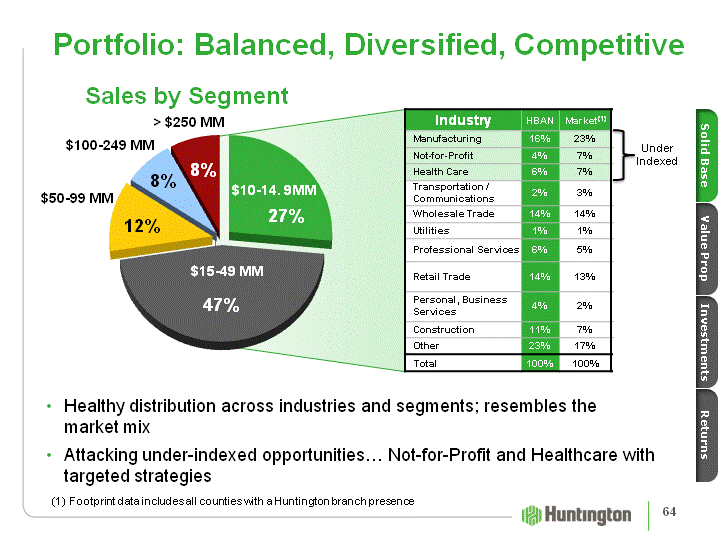
| (CHART) $15-49 MM $10-14. 9MM $50-99 MM $100-249 MM > $250 MM 8% 8% 12% 47% 27% Portfolio: Balanced, Diversified, Competitive Healthy distribution across industries and segments; resembles the market mixAttacking under-indexed opportunities... Not-for-Profit and Healthcare with targeted strategies (1) Footprint data includes all counties with a Huntington branch presence Solid Base Investments Returns Value Prop Value Prop UnderIndexed Sales by Segment 64 |
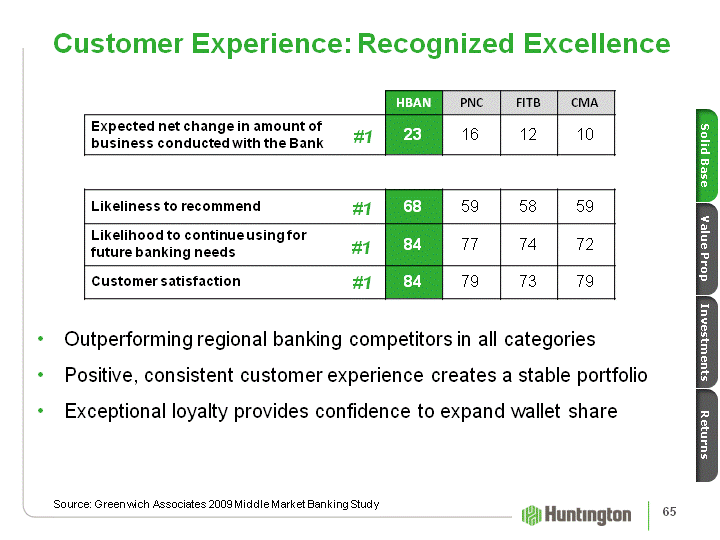
| HBAN PNC FITB CMA Expected net change in amount of business conducted with the Bank 23 16 12 10 Likeliness to recommend 68 59 58 59 Likelihood to continue using for future banking needs 84 77 74 72 Customer satisfaction 84 79 73 79 Customer Experience: Recognized Excellence Source: Greenwich Associates 2009 Middle Market Banking Study Outperforming regional banking competitors in all categoriesPositive, consistent customer experience creates a stable portfolioExceptional loyalty provides confidence to expand wallet share Solid Base Investments Returns Value Prop #1 #1 #1 #1 65 |
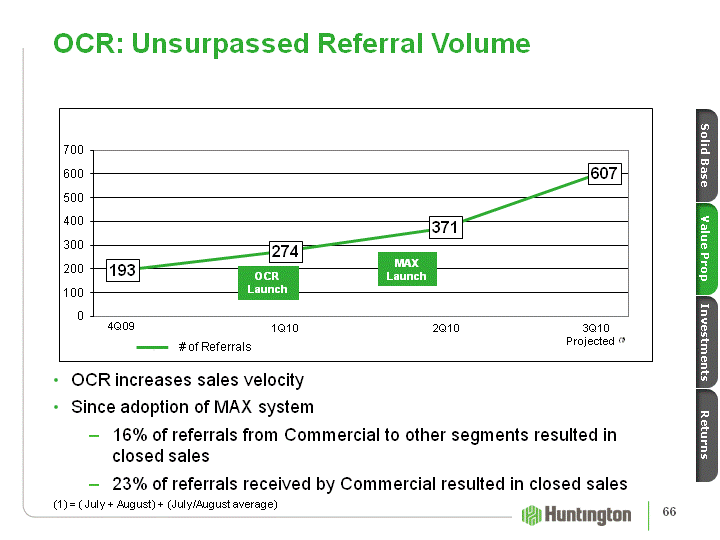
| (CHART) OCR: Unsurpassed Referral Volume OCR increases sales velocitySince adoption of MAX system16% of referrals from Commercial to other segments resulted in closed sales23% of referrals received by Commercial resulted in closed sales Solid Base Investments Returns Value Prop OCR Launch 4Q09 1Q10 2Q10 3Q10 Projected (1) MAX Launch (1) = ( July + August) + (July/August average) # of Referrals 66 |
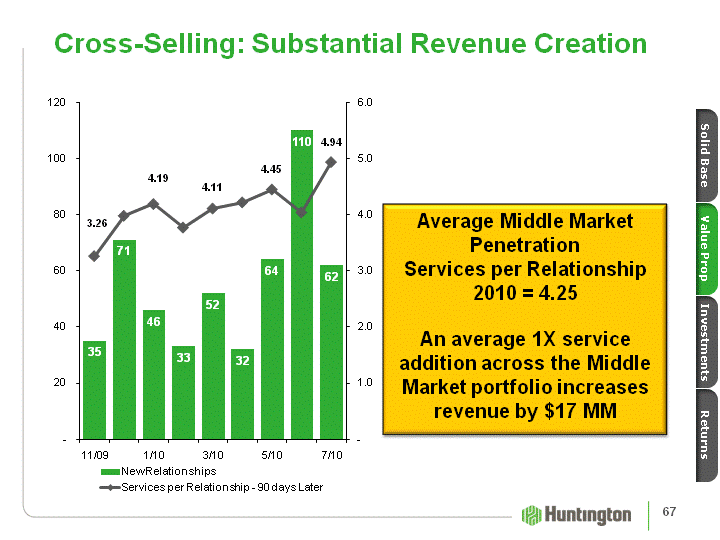
| Cross-Selling: Substantial Revenue Creation (CHART) Average Middle Market PenetrationServices per Relationship2010 = 4.25An average 1X service addition across the Middle Market portfolio increases revenue by $17 MM Solid Base Investments Returns Value Prop 67 |

| Talent: Attracting Industry's Best New ExecutivesRegional President, Cleveland Regional President, PittsburghCommercial Regional Manager, East MichiganCommercial Regional Manager, ColumbusPresident, Huntington Equipment FinanceTreasury Management DirectorCommercial Strategy DirectorLarge Corporate Banking DirectorInvesting Their Future in HuntingtonProven track records at competitor banksJPM Chase; RBS-Citizens; PNC/NCC; Comerica; Fifth-Third; Key Recruiting and hiring continues at executive level 32 new customer facing bankers Solid Base Investments Returns Value Prop 68 |
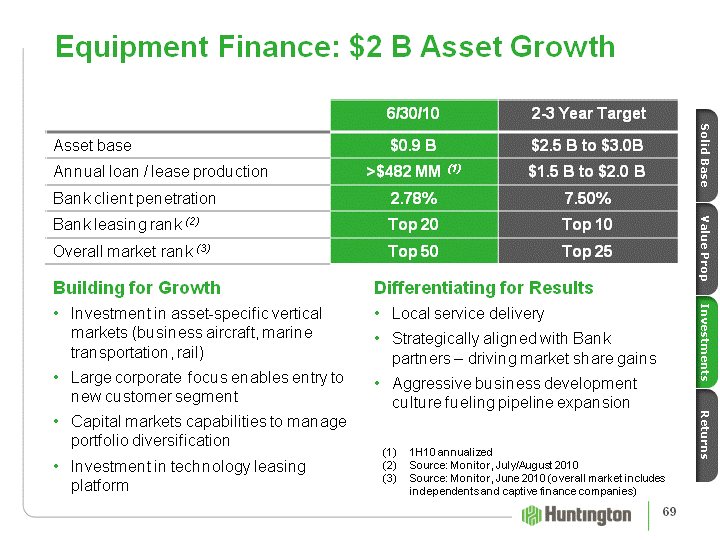
| Solid Base Investments Returns Value Prop Value Prop Building for GrowthInvestment in asset-specific vertical markets (business aircraft, marine transportation, rail)Large corporate focus enables entry to new customer segmentCapital markets capabilities to manage portfolio diversificationInvestment in technology leasing platform 1H10 annualizedSource: Monitor, July/August 2010 Source: Monitor, June 2010 (overall market includes independents and captive finance companies) Differentiating for ResultsLocal service deliveryStrategically aligned with Bank partners - driving market share gainsAggressive business development culture fueling pipeline expansion Equipment Finance: $2 B Asset Growth 69 |
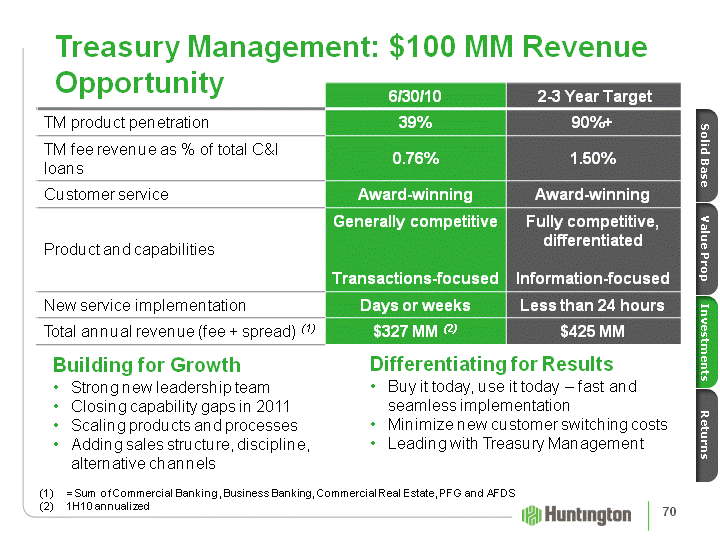
| Solid Base Investments Returns Value Prop Value Prop Building for GrowthStrong new leadership teamClosing capability gaps in 2011Scaling products and processesAdding sales structure, discipline, alternative channels = Sum of Commercial Banking, Business Banking, Commercial Real Estate, PFG and AFDS1H10 annualized Differentiating for ResultsBuy it today, use it today - fast and seamless implementationMinimize new customer switching costsLeading with Treasury Management Treasury Management: $100 MM Revenue Opportunity 70 |
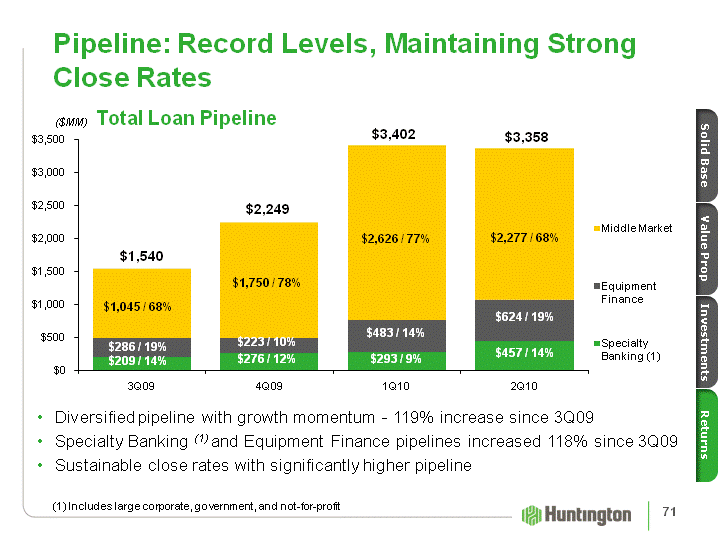
| (CHART) Pipeline: Record Levels, Maintaining Strong Close Rates ($MM) Diversified pipeline with growth momentum - 119% increase since 3Q09Specialty Banking (1) and Equipment Finance pipelines increased 118% since 3Q09Sustainable close rates with significantly higher pipeline Total Loan Pipeline $209 / 14% $286 / 19% $1,045 / 68% $276 / 12% $223 / 10% $1,750 / 78% $293 / 9% $483 / 14% $2,626 / 77% $457 / 14% $624 / 19% $2,277 / 68% Solid Base Investments Returns Value Prop $1,540 $2,249 $3,402 $3,358 (1) Includes large corporate, government, and not-for-profit 71 |
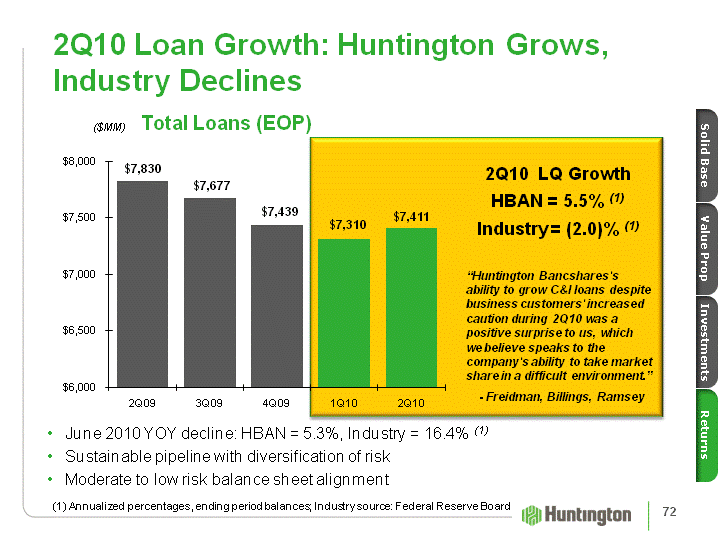
| 2Q10 Loan Growth: Huntington Grows, Industry Declines ($MM) June 2010 YOY decline: HBAN = 5.3%, Industry = 16.4% (1)Sustainable pipeline with diversification of risk Moderate to low risk balance sheet alignment (1) Annualized percentages, ending period balances; Industry source: Federal Reserve Board Total Loans (EOP) Solid Base Investments Returns Value Prop 2Q10 LQ GrowthHBAN = 5.5% (1) Industry = (2.0)% (1) (CHART) "Huntington Bancshares's ability to grow C&I loans despite business customers' increased caution during 2Q10 was a positive surprise to us, which we believe speaks to the company's ability to take market share in a difficult environment." - Freidman, Billings, Ramsey 72 |
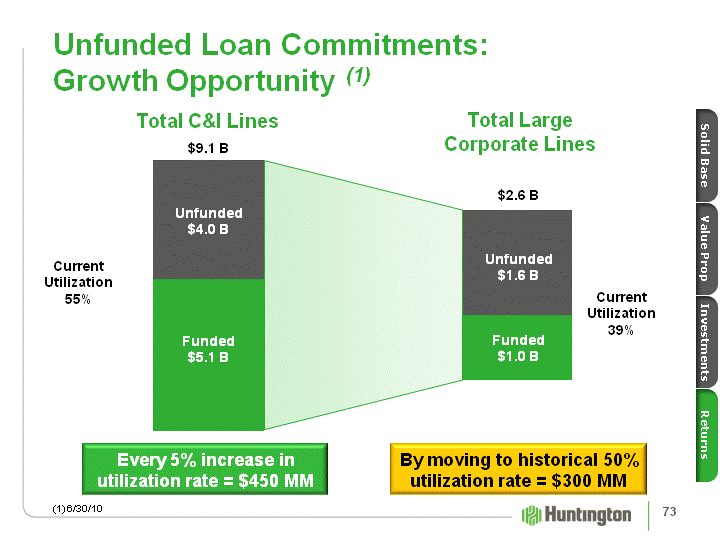
| Unfunded Loan Commitments: Growth Opportunity (1) Solid Base Investments Returns Value Prop (CHART) (CHART) Total C&I Lines (1) 6/30/10 Total Large Corporate Lines Current Utilization 55% Funded$5.1 B Unfunded$4.0 B $9.1 B Every 5% increase in utilization rate = $450 MM Funded$1.0 B Unfunded$1.6 B $2.6 B Current Utilization 39% By moving to historical 50% utilization rate = $300 MM 73 |

| (CHART) Pricing: Optimizing the Portfolio ($MM) Better spread and higher loan feesSpread Over LIBOR + Loan Fees in 2Q10 loan portfolio were $26.6 MM, up 4.3% from 2Q09Higher profitability on optimized portfolio Solid Base Investments Returns Value Prop Avg. Loans 74 |
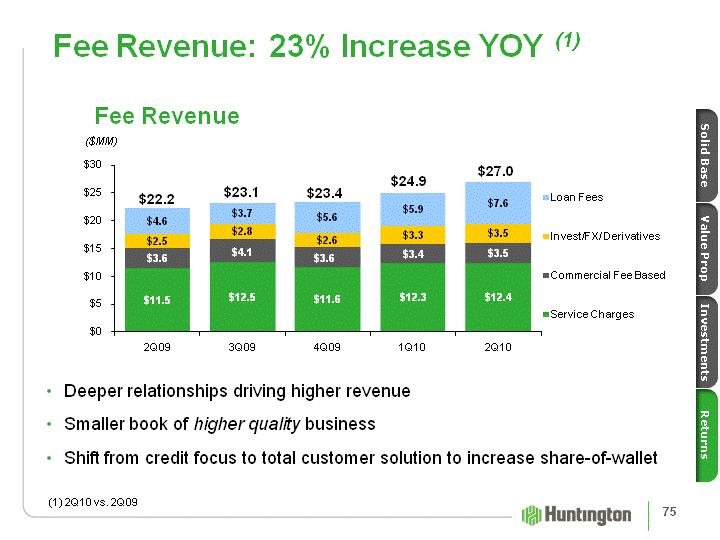
| (CHART) Fee Revenue: 23% Increase YOY (1) ($MM) Deeper relationships driving higher revenueSmaller book of higher quality businessShift from credit focus to total customer solution to increase share-of-wallet Fee Revenue Solid Base Investments Returns Value Prop $22.2 $23.1 $23.4 $24.9 $27.0 (1) 2Q10 vs. 2Q09 75 |
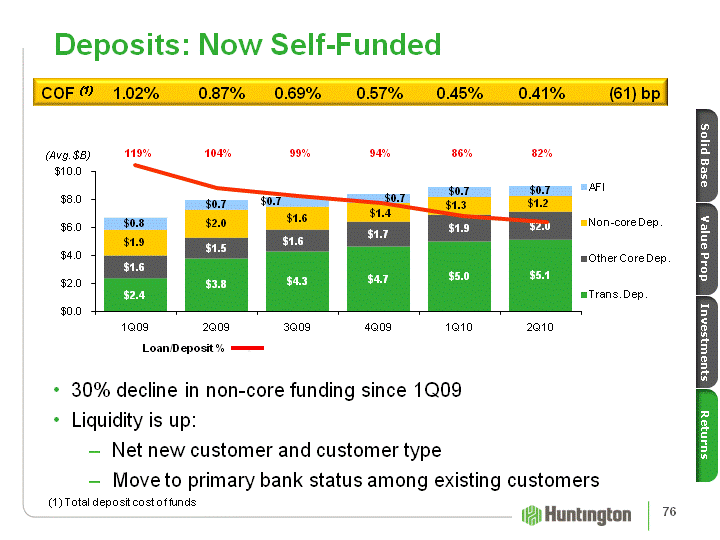
| (CHART) (CHART) Deposits: Now Self-Funded (Avg. $B) 30% decline in non-core funding since 1Q09Liquidity is up:Net new customer and customer typeMove to primary bank status among existing customers Solid Base Investments Returns Value Prop 119% 104% 99% 94% 86% 82% COF (1) 1.02% 0.87% 0.69% 0.57% 0.45% 0.41% (61) bp Loan/Deposit % (1) Total deposit cost of funds 76 |
| Commercial Banking - Breaking Away Distinctive CapabilitiesSolid loan portfolio with ample growth potentialUnleashing the significant power of cross-sellSuperior customer experienceExpanded prowess in Treasury Management, Equipment Finance, and targeted segmentsDistinctive PerformanceImpressive pipeline and close ratesLoan growth not seen by peersSpread and fees providing revenue increaseHigher liquidity self-funded balance sheet growth 77 |
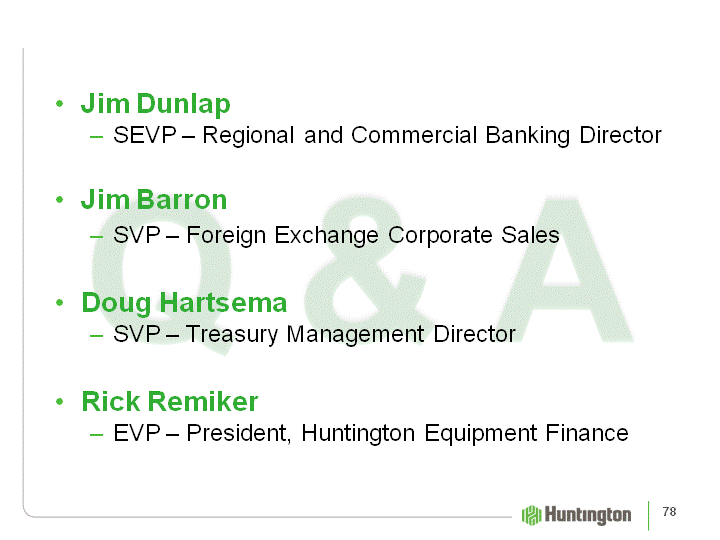
| Q & A Jim Dunlap SEVP - Regional and Commercial Banking Director Jim Barron SVP - Foreign Exchange Corporate Sales Doug Hartsema SVP - Treasury Management DirectorRick Remiker EVP - President, Huntington Equipment Finance 78 |
| Private Financial Group Dan Benhase SEVP - Private Financial Group Director |
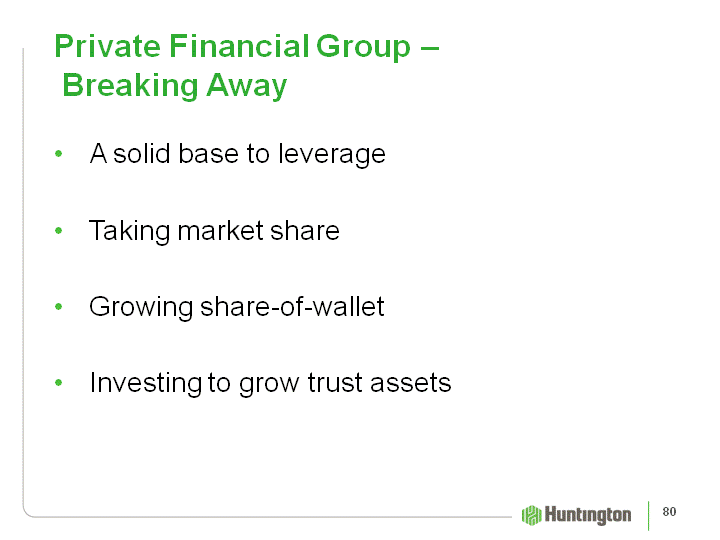
| Private Financial Group - Breaking Away A solid base to leverageTaking market shareGrowing share-of-walletInvesting to grow trust assets 80 |
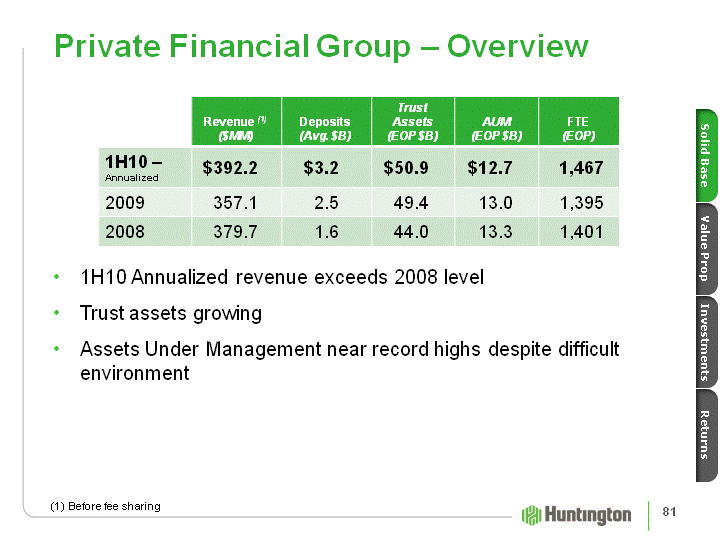
| Private Financial Group - Overview Revenue (1)($MM) Deposits (Avg. $B) Trust Assets (EOP $B) AUM (EOP $B) FTE(EOP) 1H10 - Annualized $392.2 $3.2 $50.9 $12.7 1,467 2009 357.1 2.5 49.4 13.0 1,395 2008 379.7 1.6 44.0 13.3 1,401 Before fee sharing Solid Base Investments Returns Value Prop 1H10 Annualized revenue exceeds 2008 levelTrust assets growingAssets Under Management near record highs despite difficult environment 81 |
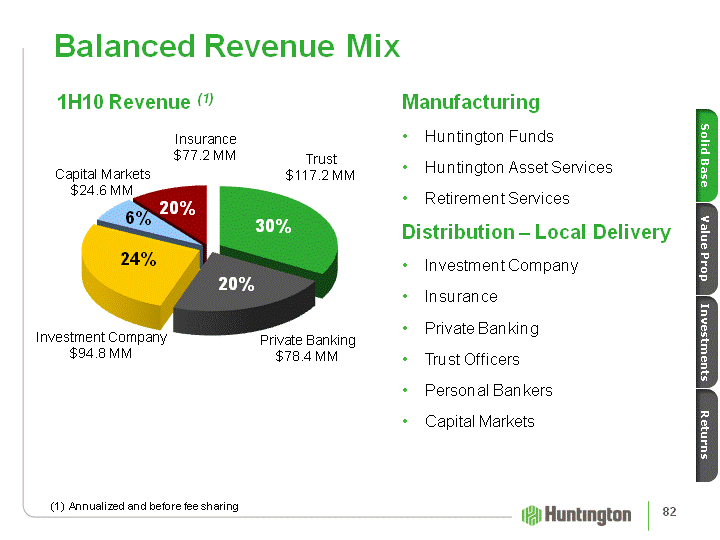
| (CHART) Insurance$77.2 MM Balanced Revenue Mix Solid Base Investments Returns Value Prop Trust$117.2 MM Private Banking$78.4 MM Investment Company$94.8 MM Capital Markets$24.6 MM Annualized and before fee sharing 30% 20% 24% 6% 20% 1H10 Revenue (1) ManufacturingHuntington FundsHuntington Asset ServicesRetirement ServicesDistribution - Local DeliveryInvestment CompanyInsurancePrivate BankingTrust OfficersPersonal BankersCapital Markets 82 |
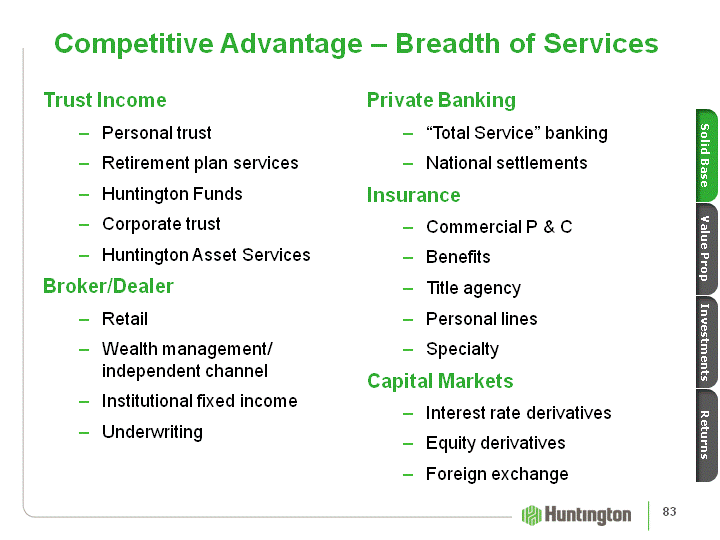
| Competitive Advantage - Breadth of Services Trust IncomePersonal trustRetirement plan servicesHuntington FundsCorporate trustHuntington Asset ServicesBroker/DealerRetailWealth management/ independent channelInstitutional fixed incomeUnderwriting Private Banking"Total Service" bankingNational settlementsInsuranceCommercial P & CBenefitsTitle agencyPersonal linesSpecialtyCapital MarketsInterest rate derivativesEquity derivativesForeign exchange Solid Base Investments Returns Value Prop 83 |
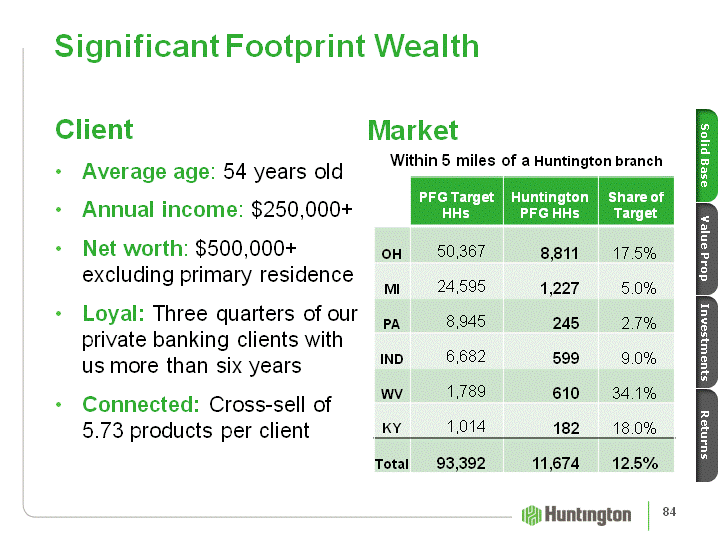
| Significant Footprint Wealth ClientAverage age: 54 years old Annual income: $250,000+Net worth: $500,000+ excluding primary residenceLoyal: Three quarters of our private banking clients with us more than six yearsConnected: Cross-sell of 5.73 products per client Solid Base Investments Returns Value Prop MarketWithin 5 miles of a Huntington branch PFG Target HHs Huntington PFG HHs Share of Target OH 50,367 8,811 17.5% MI 24,595 1,227 5.0% PA 8,945 245 2.7% IND 6,682 599 9.0% WV 1,789 610 34.1% KY 1,014 182 18.0% Total 93,392 11,674 12.5% 84 |
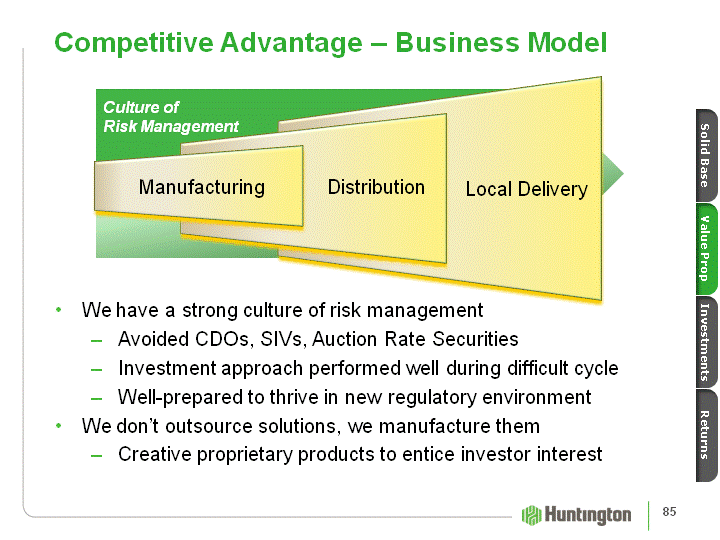
| Competitive Advantage - Business Model We have a strong culture of risk management Avoided CDOs, SIVs, Auction Rate SecuritiesInvestment approach performed well during difficult cycleWell-prepared to thrive in new regulatory environmentWe don't outsource solutions, we manufacture themCreative proprietary products to entice investor interest Manufacturing Distribution Local Delivery Culture of Risk Management Solid Base Investments Returns Value Prop 85 |
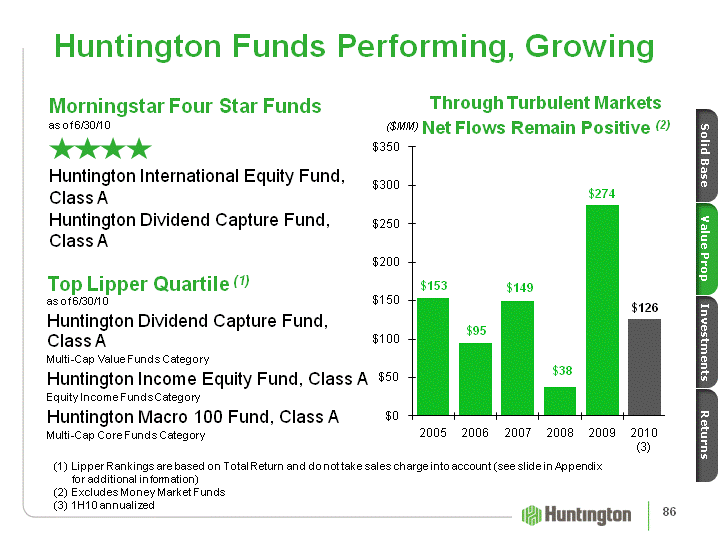
| Huntington Funds Performing, Growing Solid Base Investments Returns Value Prop Morningstar Four Star Funds as of 6/30/10Huntington International Equity Fund, Class AHuntington Dividend Capture Fund, Class A (CHART) Through Turbulent Markets Net Flows Remain Positive (2) Top Lipper Quartile (1) as of 6/30/10Huntington Dividend Capture Fund, Class AMulti-Cap Value Funds CategoryHuntington Income Equity Fund, Class AEquity Income Funds CategoryHuntington Macro 100 Fund, Class AMulti-Cap Core Funds Category ($MM) Lipper Rankings are based on Total Return and do not take sales charge into account (see slide in Appendix for additional information)Excludes Money Market Funds1H10 annualized 86 |
| Win the Share Battle -- Market Share - Share-of-Wallet Taking market shareOpening new and expanding existing officesAdding revenue-generating positions... Huntington now a magnet for top market talent Solid Base Investments Returns Value Prop 87 |

| NewExpandedExistingBranches Grow Market Share Expanding Reach Capitalize on competitor retrenchment with expansion 7 new offices3 expanded offices96 new revenue generators - 10% increase Solid Base Investments Returns Value Prop 88 |
| Win the Share Battle -- Market Share - Share-of-Wallet Growing share-of-walletRelentless pursuit of cross-sellDeeper penetration of our commercial client baseGaining more business from existing clientsAggressive management of cross-sell activity with new technology Solid Base Investments Returns Value Prop 89 |
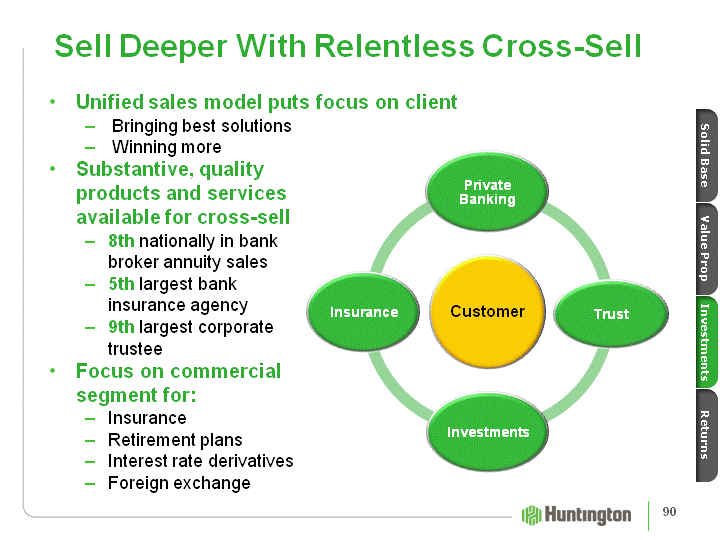
| Unified sales model puts focus on clientBringing best solutions Winning more Sell Deeper With Relentless Cross-Sell Substantive, quality products and services available for cross-sell8th nationally in bank broker annuity sales5th largest bank insurance agency9th largest corporate trusteeFocus on commercial segment for:InsuranceRetirement plansInterest rate derivativesForeign exchange Solid Base Investments Returns Value Prop 90 |
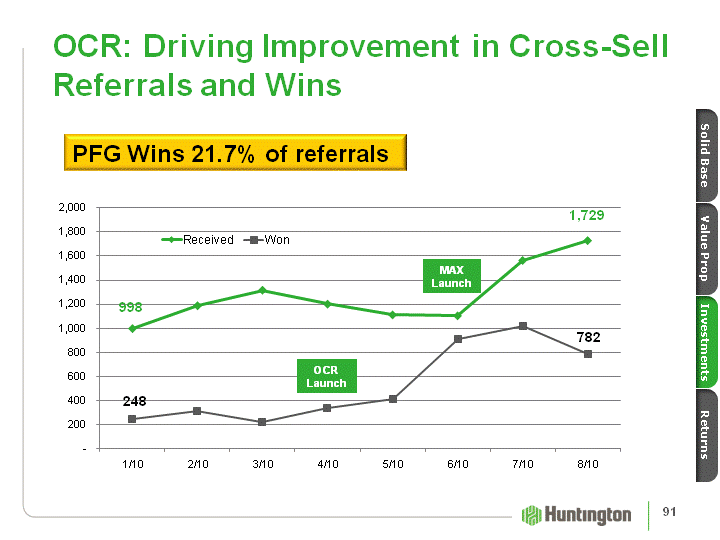
| (CHART) OCR: Driving Improvement in Cross-Sell Referrals and Wins OCR Launch MAX Launch Solid Base Investments Returns Value Prop PFG Wins 21.7% of referrals 91 |
| Win the Share Battle -- Market Share - Share-of-Wallet Investing to grow trust assetsManufacturing unique product and service offerings to capture investor interestBuild third-party distribution Solid Base Investments Returns Value Prop 92 |

| Trust Assets Are Growing $5 B, or 12%, YTD (1) growth in assets under custody through Huntington Asset ServicesHuntington Funds distribution channelsWealth managementRetirement plansBroker / dealerBuilding third-party distributionWill launch three actively managed Exchange Traded Funds (ETF) in 1Q 20117 new + 3 expanded wealth management offices Solid Base Investments Returns Value Prop (1) Through July 31, 2010 93 |
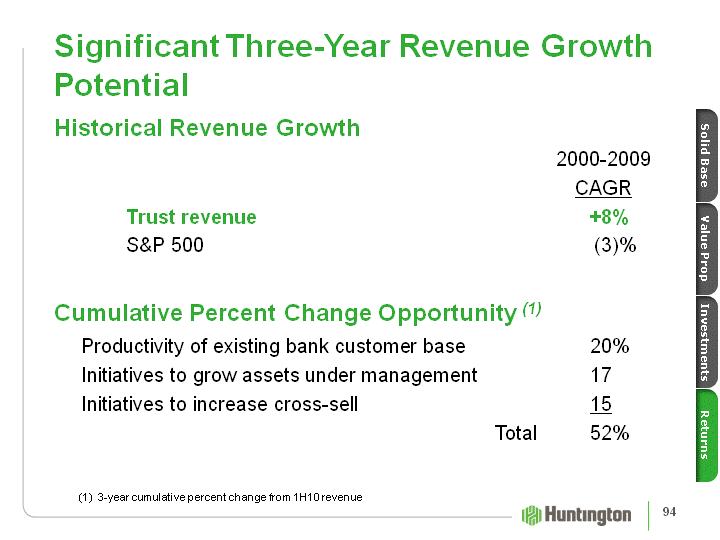
| Significant Three-Year Revenue Growth Potential Historical Revenue Growth 2000-2009 CAGRTrust revenue +8%S&P 500 (3)%Cumulative Percent Change Opportunity (1) Productivity of existing bank customer base 20% Initiatives to grow assets under management 17 Initiatives to increase cross-sell 15 Total 52% Solid Base Investments Returns Value Prop (1) 3-year cumulative percent change from 1H10 revenue 94 |
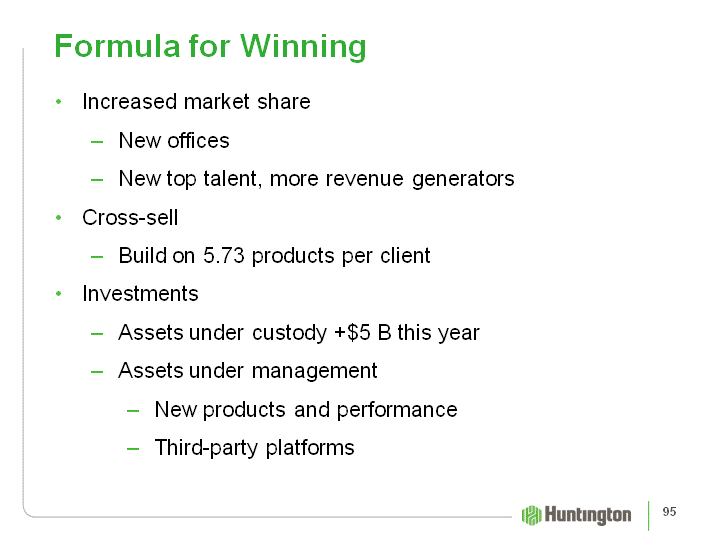
| Formula for Winning Increased market shareNew officesNew top talent, more revenue generatorsCross-sellBuild on 5.73 products per clientInvestmentsAssets under custody +$5 B this yearAssets under managementNew products and performanceThird-party platforms 95 |
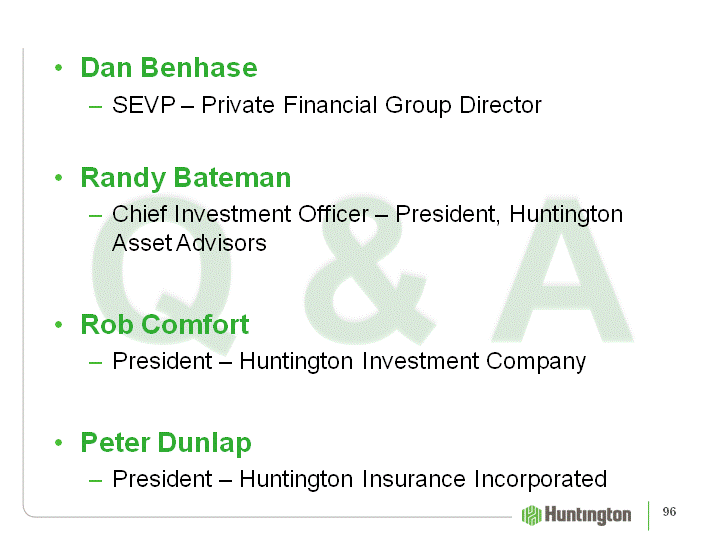
| Q & A Dan BenhaseSEVP - Private Financial Group DirectorRandy BatemanChief Investment Officer - President, Huntington Asset AdvisorsRob ComfortPresident - Huntington Investment CompanyPeter DunlapPresident - Huntington Insurance Incorporated 96 |

| Auto Finance & Dealer Services Nick Stanutz SEVP - Auto Finance Group Director |
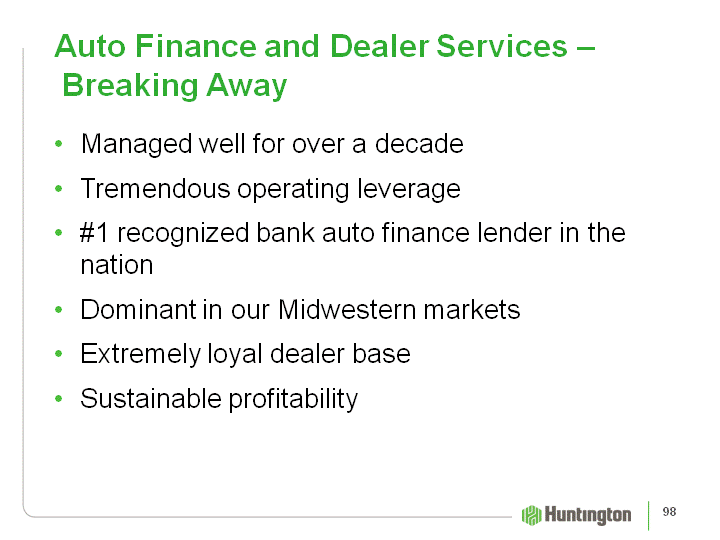
| Auto Finance and Dealer Services - Breaking Away Managed well for over a decadeTremendous operating leverage#1 recognized bank auto finance lender in the nationDominant in our Midwestern marketsExtremely loyal dealer baseSustainable profitability 98 |
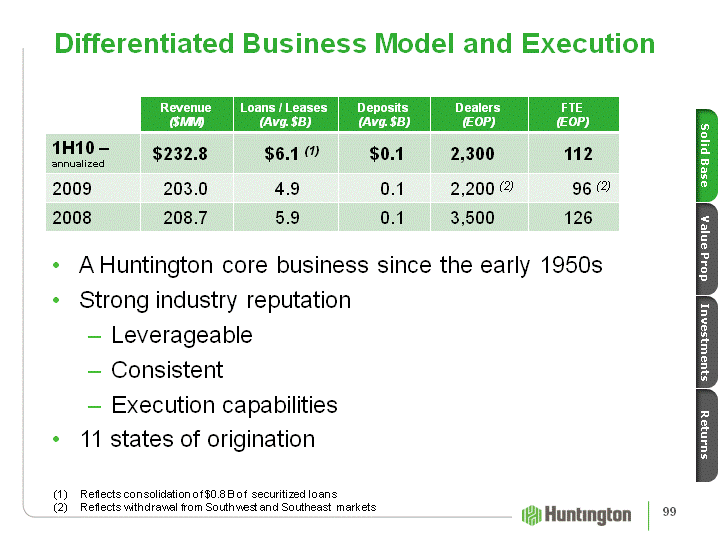
| Differentiated Business Model and Execution A Huntington core business since the early 1950sStrong industry reputationLeverageable Consistent Execution capabilities11 states of origination Solid Base Investments Returns Value Prop Revenue($MM) Loans / Leases (Avg. $B) Deposits (Avg. $B) Dealers(EOP) FTE(EOP) 1H10 - annualized $232.8 $6.1 (1) $0.1 2,300 112 2009 203.0 4.9 0.1 2,200 (2) 96 (2) 2008 208.7 5.9 0.1 3,500 126 Reflects consolidation of $0.8 B of securitized loansReflects withdrawal from Southwest and Southeast markets 99 |
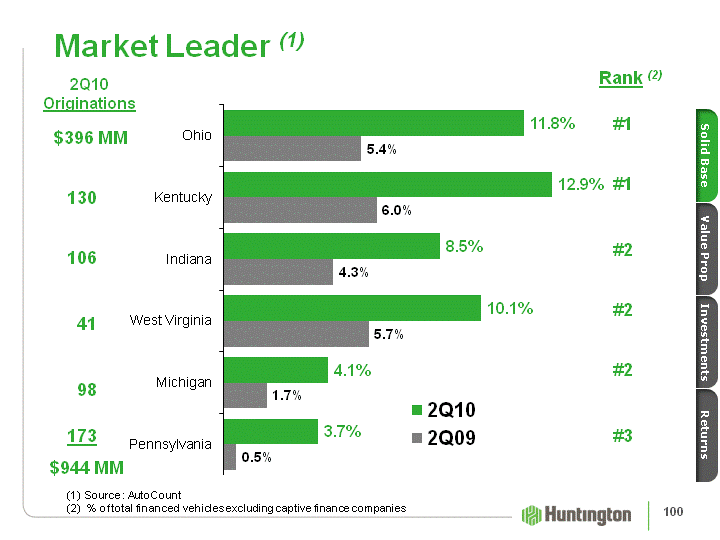
| (CHART) Market Leader (1) 2Q10Originations Rank (2) #1 #1 #2 #2 #2 #3 $396 MM 130 106 41 98 173 $944 MM Source : AutoCount % of total financed vehicles excluding captive finance companies Solid Base Investments Returns Value Prop 100 |
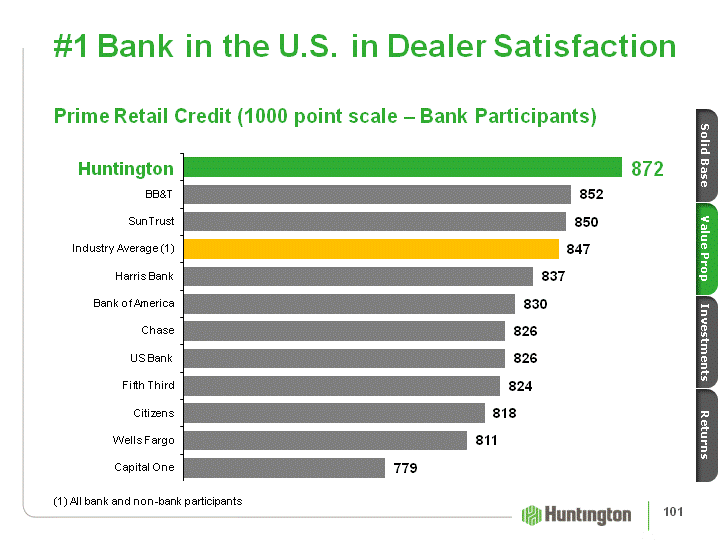
| (CHART) Prime Retail Credit (1000 point scale - Bank Participants) Huntington #1 Bank in the U.S. in Dealer Satisfaction Solid Base Investments Returns Value Prop (1) All bank and non-bank participants 101 |
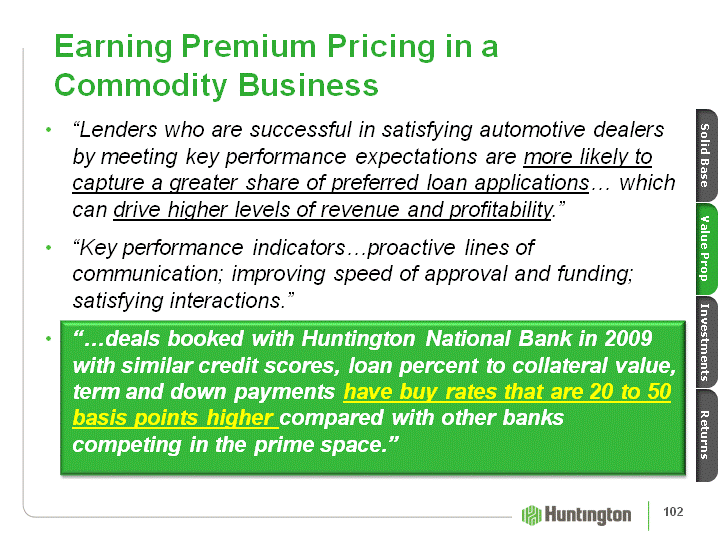
| Earning Premium Pricing in a Commodity Business "Lenders who are successful in satisfying automotive dealers by meeting key performance expectations are more likely to capture a greater share of preferred loan applications... which can drive higher levels of revenue and profitability.""Key performance indicators...proactive lines of communication; improving speed of approval and funding; satisfying interactions.""...deals booked with Huntington National Bank in 2009 with similar credit scores, loan percent to collateral value, term and down payments have buy rates that are 20 to 50 basis points higher compared with other banks competing in the prime space." Solid Base Investments Returns Value Prop 102 |
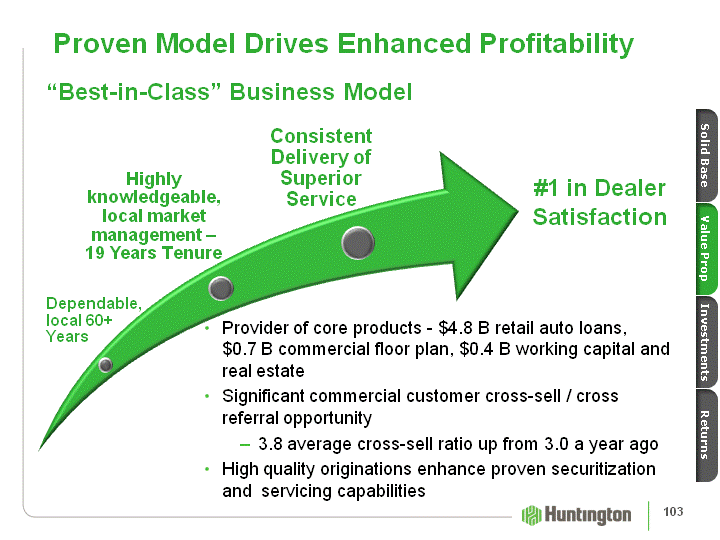
| Proven Model Drives Enhanced Profitability Solid Base Investments Returns Value Prop Provider of core products - $4.8 B retail auto loans, $0.7 B commercial floor plan, $0.4 B working capital and real estateSignificant commercial customer cross-sell / cross referral opportunity3.8 average cross-sell ratio up from 3.0 a year agoHigh quality originations enhance proven securitization and servicing capabilities "Best-in-Class" Business Model #1 in Dealer Satisfaction 103 |
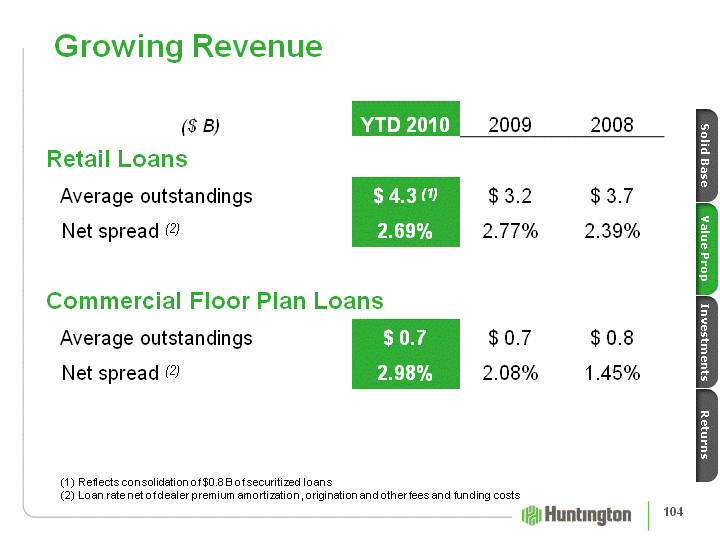
| ($ B) YTD 2010 2009 2008 Retail Loans Average outstandings $ 4.3 (1) $ 3.2 $ 3.7 Net spread (2) 2.69% 2.77% 2.39% Commercial Floor Plan Loans Commercial Floor Plan Loans Average outstandings $ 0.7 $ 0.7 $ 0.8 Net spread (2) 2.98% 2.08% 1.45% Growing Revenue Reflects consolidation of $0.8 B of securitized loansLoan rate net of dealer premium amortization, origination and other fees and funding costs Solid Base Investments Returns Value Prop 104 |
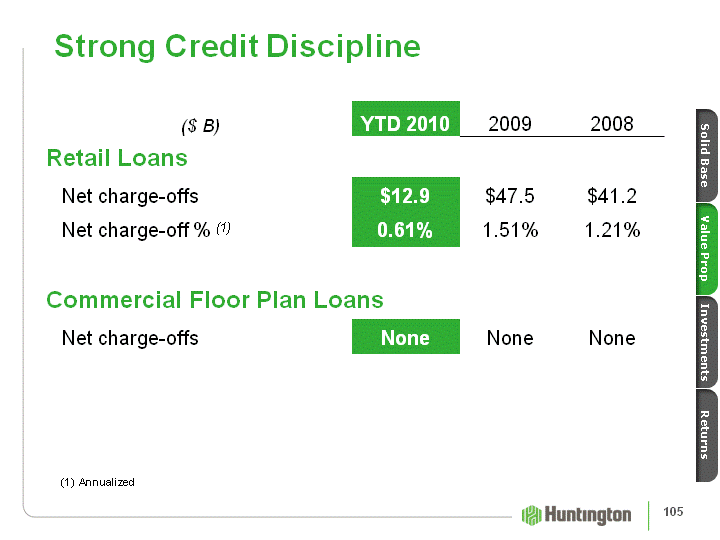
| ($ B) YTD 2010 2009 2008 Retail Loans Net charge-offs $12.9 $47.5 $41.2 Net charge-off % (1) 0.61% 1.51% 1.21% Commercial Floor Plan Loans Commercial Floor Plan Loans Net charge-offs None None None Strong Credit Discipline Annualized Solid Base Investments Returns Value Prop 105 |
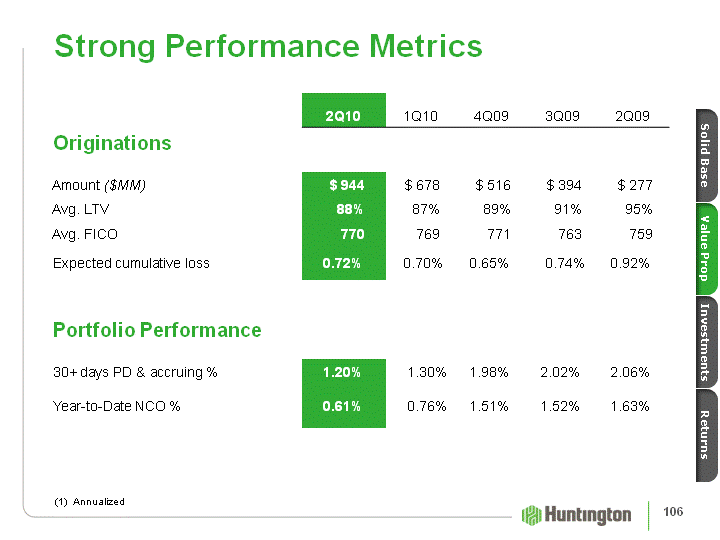
| Strong Performance Metrics Strong Performance Metrics (1) Annualized Solid Base Investments Returns Value Prop 106 |
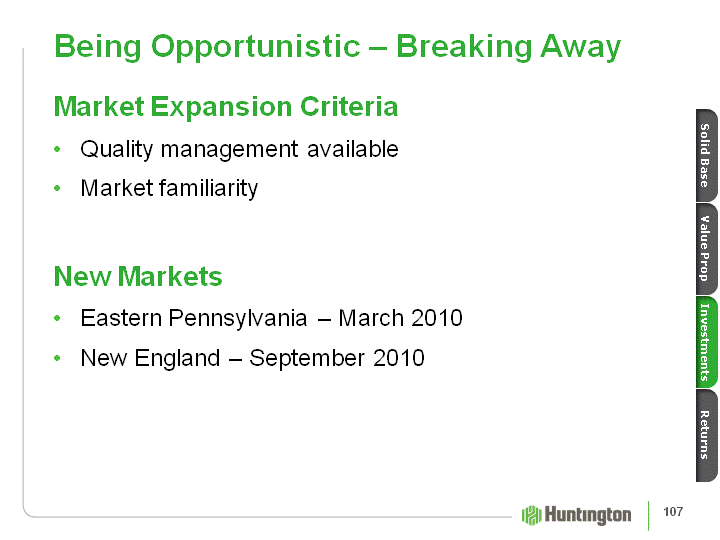
| Being Opportunistic - Breaking Away Market Expansion CriteriaQuality management availableMarket familiarityNew MarketsEastern Pennsylvania - March 2010New England - September 2010 Solid Base Investments Returns Value Prop 107 |

| Growing Share - Building on the Foundation Annual Revenue Opportunity Retail Auto Loans Existing markets Industry growth in vehicle sales of 10% per year $8.0 MM Improved market share - 1% increase equals: 7.0 Newly entered / expanded markets 6.0 Commercial Dealer Loans Consistent 20% in growth potential in outstandings 5.7 Total $26.7 MM Solid Base Investments Returns Value Prop 108 |
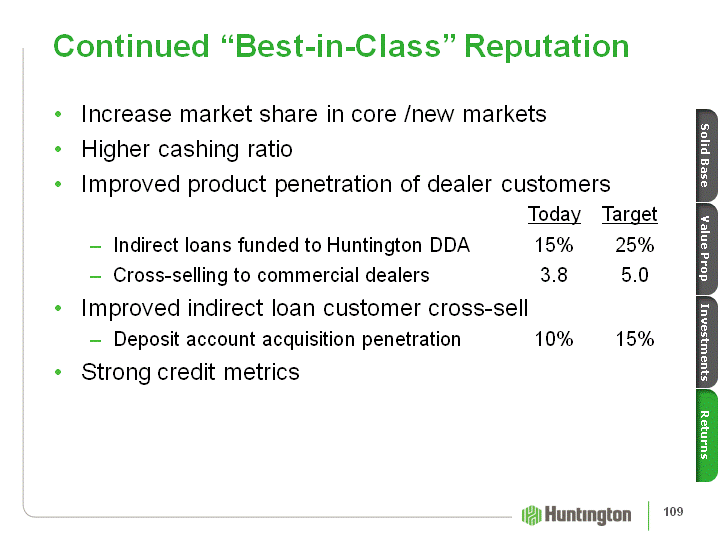
| Continued "Best-in-Class" Reputation Increase market share in core /new marketsHigher cashing ratioImproved product penetration of dealer customers Today TargetIndirect loans funded to Huntington DDA 15% 25%Cross-selling to commercial dealers 3.8 5.0Improved indirect loan customer cross-sellDeposit account acquisition penetration 10% 15%Strong credit metrics Solid Base Investments Returns Value Prop 109 |
| Competitive Advantage Drives Profitable Growth Business we know... and know wellBusiness we can profitably grow"Best-in-Class" in our marketsLong-term dependability drives strong dealer loyalty Solid Base Investments Returns Value Prop 110 |
| Q & A Nick StanutzSEVP - Auto Finance Group Director 111 |

| Specialized TopicsDon KimbleSEVP - CFOClosing RemarksSteve SteinourChairman, President & CEO |
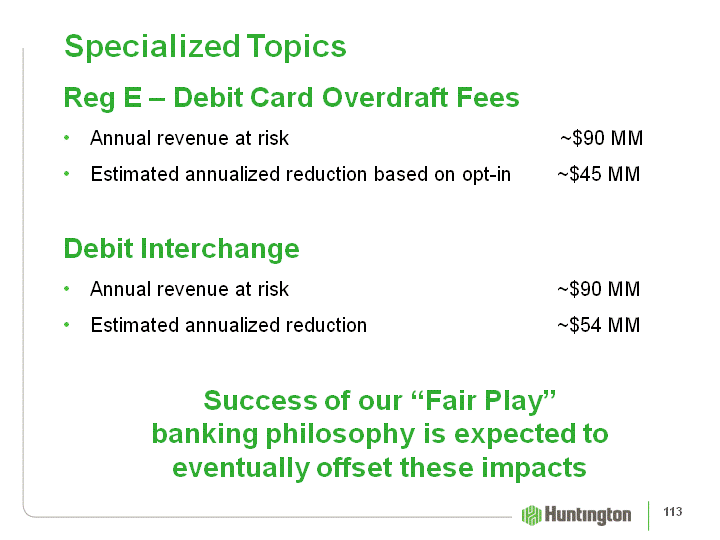
| Specialized Topics Reg E - Debit Card Overdraft FeesAnnual revenue at risk ~$90 MMEstimated annualized reduction based on opt-in ~$45 MM Debit InterchangeAnnual revenue at risk ~$90 MMEstimated annualized reduction ~$54 MM Success of our "Fair Play" banking philosophy is expected to eventually offset these impacts 113 |
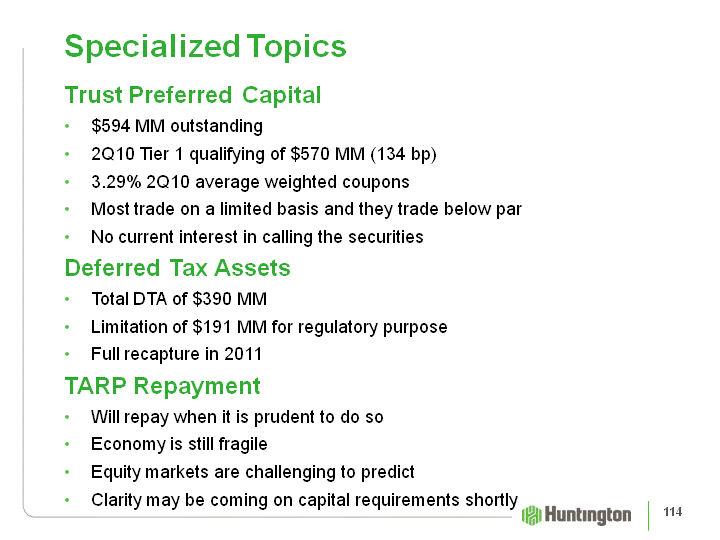
| Specialized Topics Trust Preferred Capital$594 MM outstanding2Q10 Tier 1 qualifying of $570 MM (134 bp)3.29% 2Q10 average weighted couponsMost trade on a limited basis and they trade below parNo current interest in calling the securitiesDeferred Tax AssetsTotal DTA of $390 MMLimitation of $191 MM for regulatory purposeFull recapture in 2011TARP RepaymentWill repay when it is prudent to do soEconomy is still fragileEquity markets are challenging to predictClarity may be coming on capital requirements shortly 114 |
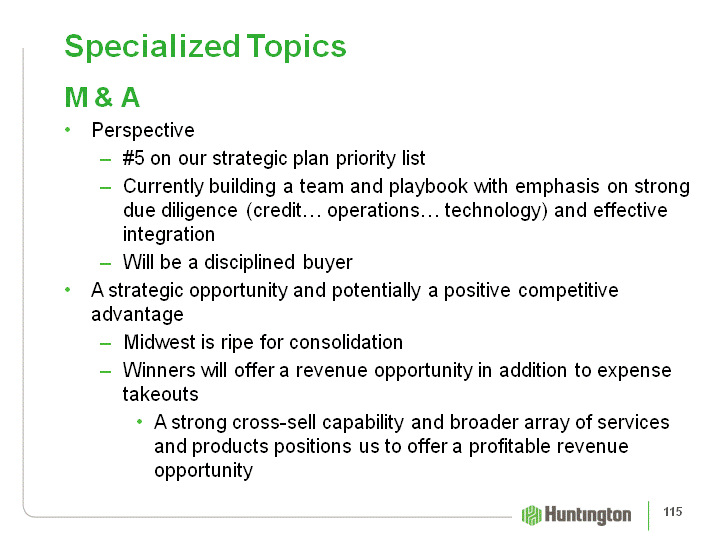
| Specialized Topics M & APerspective#5 on our strategic plan priority listCurrently building a team and playbook with emphasis on strong due diligence (credit... operations... technology) and effective integrationWill be a disciplined buyerA strategic opportunity and potentially a positive competitive advantageMidwest is ripe for consolidationWinners will offer a revenue opportunity in addition to expense takeoutsA strong cross-sell capability and broader array of services and products positions us to offer a profitable revenue opportunity 115 |
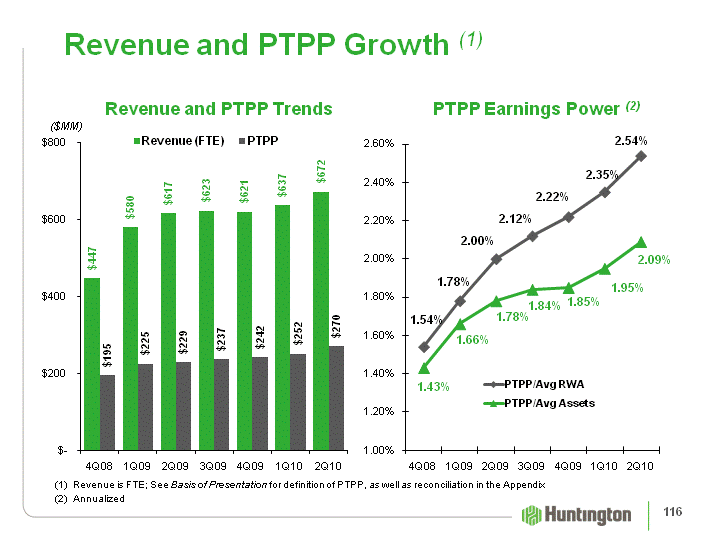
| (CHART) Revenue and PTPP Growth (1) ($MM) (CHART) (1) Revenue is FTE; See Basis of Presentation for definition of PTPP, as well as reconciliation in the Appendix(2) Annualized PTPP Earnings Power (2) Revenue and PTPP Trends 116 |
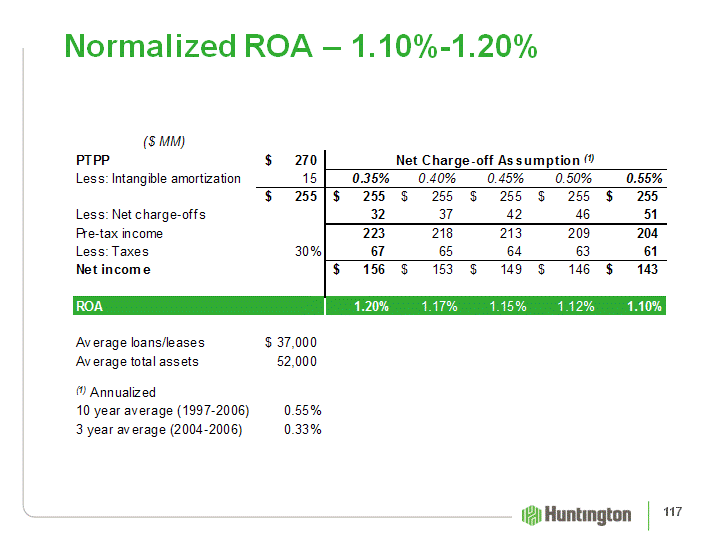
| Normalized ROA - 1.10%-1.20% 117 |
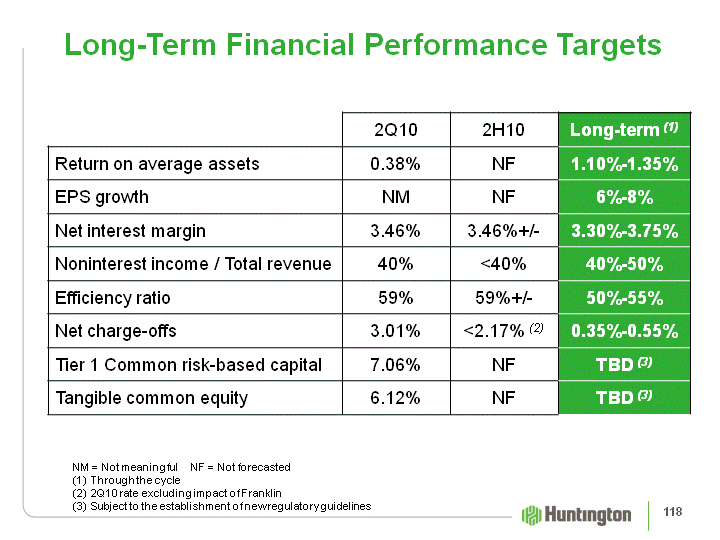
| Long-Term Financial Performance Targets 2Q10 2H10 Long-term (1) Return on average assets 0.38% NF 1.10%-1.35% EPS growth NM NF 6%-8% Net interest margin 3.46% 3.46%+/- 3.30%-3.75% Noninterest income / Total revenue 40% <40% 40%-50% Efficiency ratio 59% 59%+/- 50%-55% Net charge-offs 3.01% <2.17% (2) 0.35%-0.55% Tier 1 Common risk-based capital 7.06% NF TBD (3) Tangible common equity 6.12% NF TBD (3) NM = Not meaningful NF = Not forecastedThrough the cycle2Q10 rate excluding impact of FranklinSubject to the establishment of new regulatory guidelines 118 |
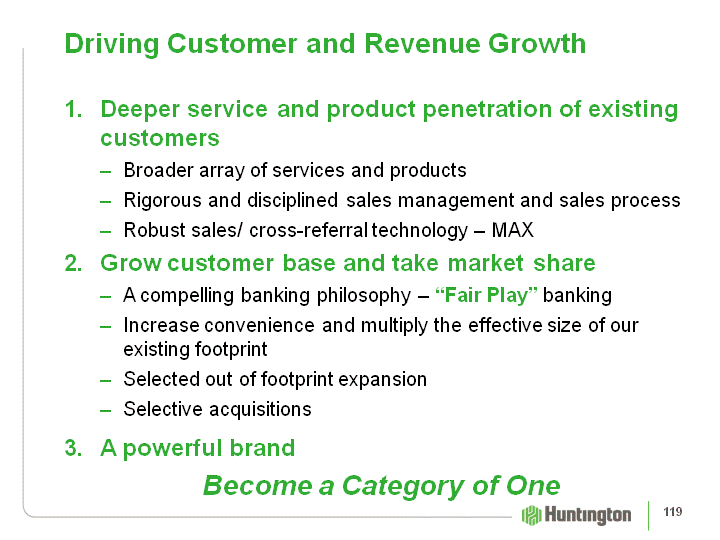
| Driving Customer and Revenue Growth Deeper service and product penetration of existing customersBroader array of services and productsRigorous and disciplined sales management and sales processRobust sales/ cross-referral technology - MAXGrow customer base and take market shareA compelling banking philosophy - "Fair Play" bankingIncrease convenience and multiply the effective size of our existing footprintSelected out of footprint expansionSelective acquisitionsA powerful brandBecome a Category of One 119 |
| A Break Away Opportunity The environment and customer psychology has changed dramaticallyTo win big requires finding a value proposition that delivers a strong competitive advantageSome banks will try old formulas to compensate, or throw in the towelHuntington is taking a bold, customer friendly, "Fair Play" banking contrarian approachProviding greater value to customers, supported by a powerful brand, will drive both new customers to us and dramatic gains in share-of-walletHuntington Is Becoming a Category of One 120 |
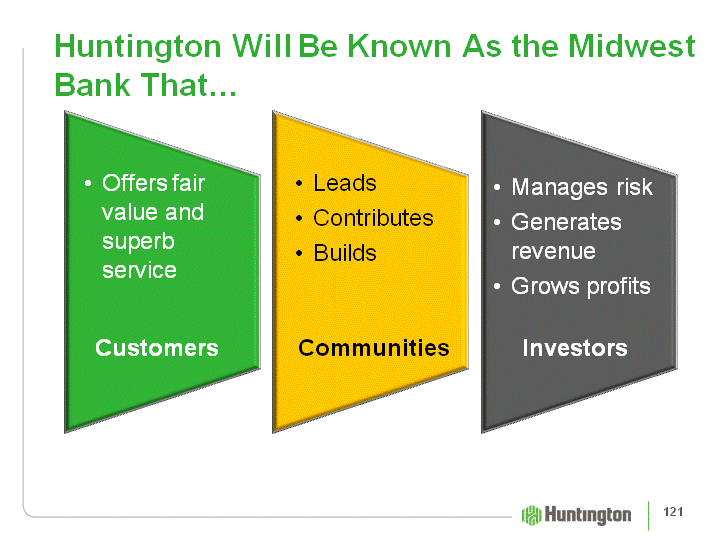
| Huntington Will Be Known As the Midwest Bank That... Offers fair value and superb service Customers LeadsContributesBuilds Communities Manages riskGenerates revenueGrows profits Investors 121 |
| Why Will Huntington Win? Because We Have...Been working at this for over a year with evidence of resultsInvested, and will continue to invest, in capacity to drive sustainable revenue growthThe leadershipAttracting some of the industry's "best and brightest"Rigorous goal setting with frequent, methodical, face- to-face follow-upTeamwork and "buy-in" across all segmentsThe focusDisciplined focus on key financial prerequisites... risk, capital, pricing, and expense 122 |
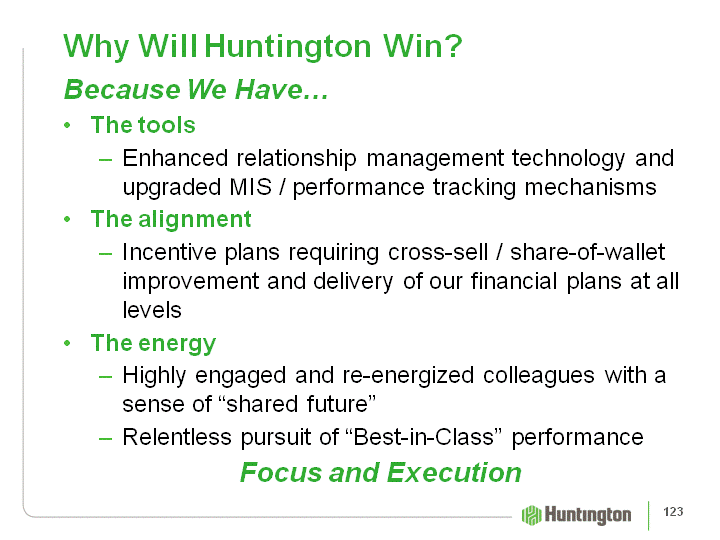
| Why Will Huntington Win? Because We Have...The toolsEnhanced relationship management technology and upgraded MIS / performance tracking mechanismsThe alignmentIncentive plans requiring cross-sell / share-of-wallet improvement and delivery of our financial plans at all levelsThe energyHighly engaged and re-energized colleagues with a sense of "shared future"Relentless pursuit of "Best-in-Class" performanceFocus and Execution 123 |
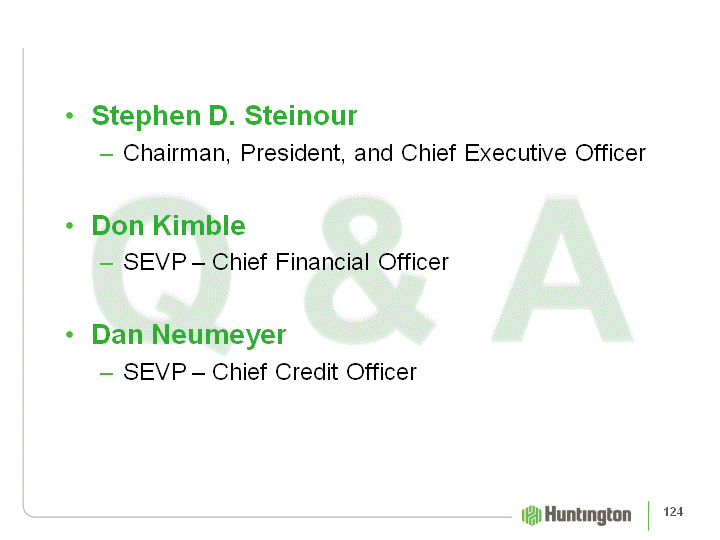
| Q & A Stephen D. SteinourChairman, President, and Chief Executive OfficerDon KimbleSEVP - Chief Financial OfficerDan NeumeyerSEVP - Chief Credit Officer 124 |

| Appendix |
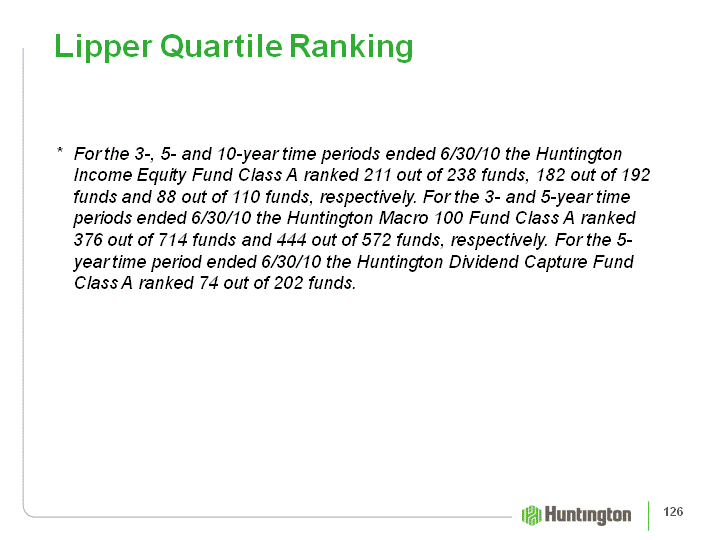
| Lipper Quartile Ranking * For the 3-, 5- and 10-year time periods ended 6/30/10 the Huntington Income Equity Fund Class A ranked 211 out of 238 funds, 182 out of 192 funds and 88 out of 110 funds, respectively. For the 3- and 5-year time periods ended 6/30/10 the Huntington Macro 100 Fund Class A ranked 376 out of 714 funds and 444 out of 572 funds, respectively. For the 5- year time period ended 6/30/10 the Huntington Dividend Capture Fund Class A ranked 74 out of 202 funds. 126 |
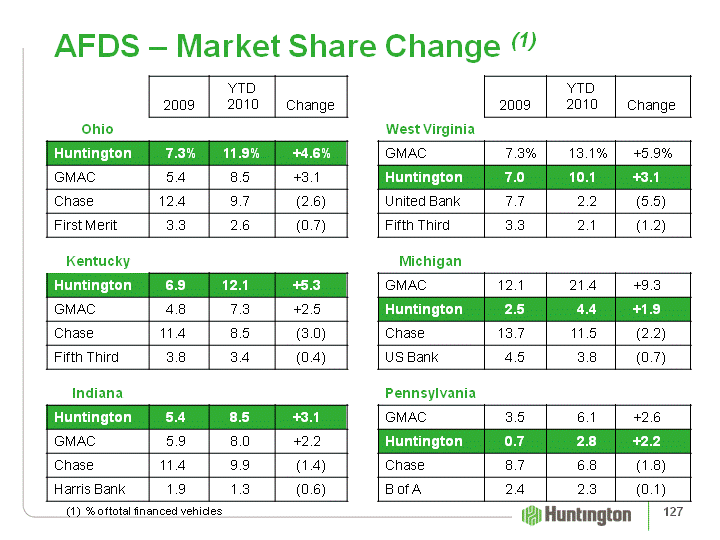
| AFDS - Market Share Change (1) AFDS - Market Share Change (1) 2009 YTD 2010 Change West Virginia GMAC 7.3% 13.1% +5.9% Huntington 7.0 10.1 +3.1 United Bank 7.7 2.2 (5.5) Fifth Third 3.3 2.1 (1.2) Michigan GMAC 12.1 21.4 +9.3 Huntington 2.5 4.4 +1.9 Chase 13.7 11.5 (2.2) US Bank 4.5 3.8 (0.7) Pennsylvania GMAC 3.5 6.1 +2.6 Huntington 0.7 2.8 +2.2 Chase 8.7 6.8 (1.8) B of A 2.4 2.3 (0.1) (1) % of total financed vehicles 127 |
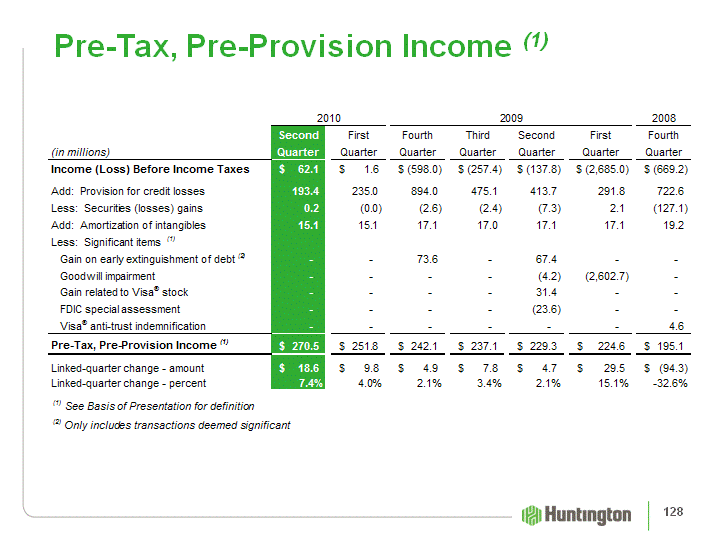
| Pre-Tax, Pre-Provision Income (1) 128 |
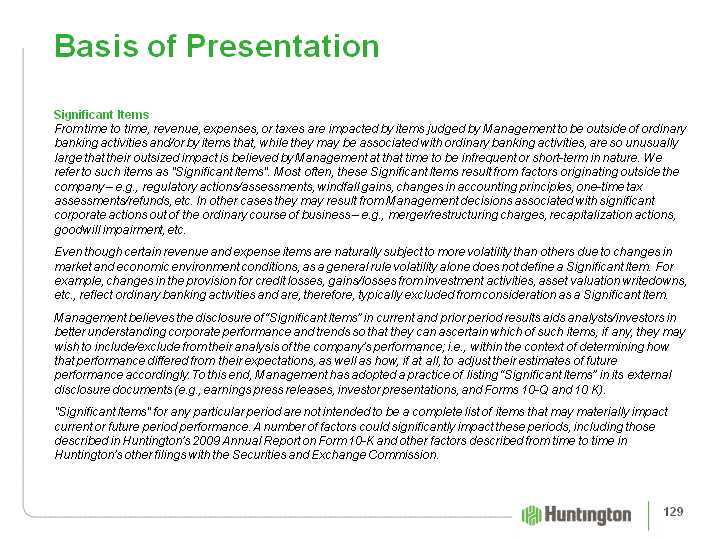
| Basis of Presentation Significant ItemsFrom time to time, revenue, expenses, or taxes are impacted by items judged by Management to be outside of ordinary banking activities and/or by items that, while they may be associated with ordinary banking activities, are so unusually large that their outsized impact is believed by Management at that time to be infrequent or short-term in nature. We refer to such items as "Significant Items". Most often, these Significant Items result from factors originating outside the company - e.g., regulatory actions/assessments, windfall gains, changes in accounting principles, one-time tax assessments/refunds, etc. In other cases they may result from Management decisions associated with significant corporate actions out of the ordinary course of business - e.g., merger/restructuring charges, recapitalization actions, goodwill impairment, etc. Even though certain revenue and expense items are naturally subject to more volatility than others due to changes in market and economic environment conditions, as a general rule volatility alone does not define a Significant Item. For example, changes in the provision for credit losses, gains/losses from investment activities, asset valuation writedowns, etc., reflect ordinary banking activities and are, therefore, typically excluded from consideration as a Significant Item.Management believes the disclosure of "Significant Items" in current and prior period results aids analysts/investors in better understanding corporate performance and trends so that they can ascertain which of such items, if any, they may wish to include/exclude from their analysis of the company's performance; i.e., within the context of determining how that performance differed from their expectations, as well as how, if at all, to adjust their estimates of future performance accordingly. To this end, Management has adopted a practice of listing "Significant Items" in its external disclosure documents (e.g., earnings press releases, investor presentations, and Forms 10-Q and 10 K)."Significant Items" for any particular period are not intended to be a complete list of items that may materially impact current or future period performance. A number of factors could significantly impact these periods, including those described in Huntington's 2009 Annual Report on Form 10-K and other factors described from time to time in Huntington's other filings with the Securities and Exchange Commission. 129 |
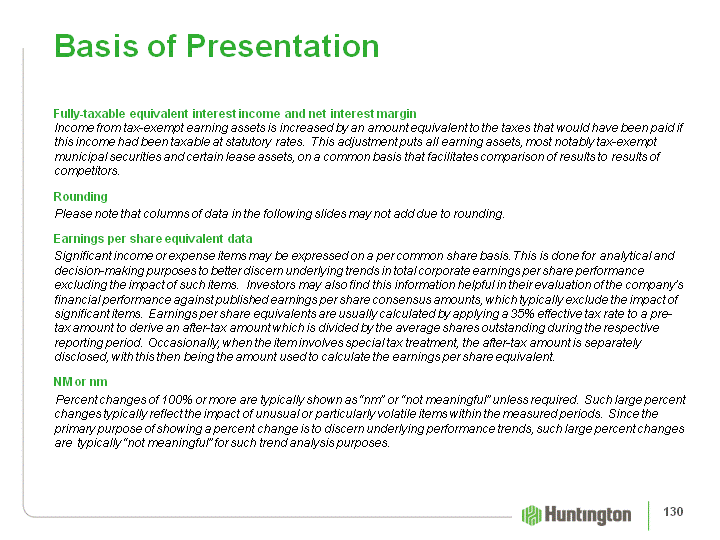
| Basis of Presentation Fully-taxable equivalent interest income and net interest marginIncome from tax-exempt earning assets is increased by an amount equivalent to the taxes that would have been paid if this income had been taxable at statutory rates. This adjustment puts all earning assets, most notably tax-exempt municipal securities and certain lease assets, on a common basis that facilitates comparison of results to results of competitors.RoundingPlease note that columns of data in the following slides may not add due to rounding.Earnings per share equivalent dataSignificant income or expense items may be expressed on a per common share basis. This is done for analytical and decision-making purposes to better discern underlying trends in total corporate earnings per share performance excluding the impact of such items. Investors may also find this information helpful in their evaluation of the company's financial performance against published earnings per share consensus amounts, which typically exclude the impact of significant items. Earnings per share equivalents are usually calculated by applying a 35% effective tax rate to a pre- tax amount to derive an after-tax amount which is divided by the average shares outstanding during the respective reporting period. Occasionally, when the item involves special tax treatment, the after-tax amount is separately disclosed, with this then being the amount used to calculate the earnings per share equivalent.NM or nmPercent changes of 100% or more are typically shown as "nm" or "not meaningful" unless required. Such large percent changes typically reflect the impact of unusual or particularly volatile items within the measured periods. Since the primary purpose of showing a percent change is to discern underlying performance trends, such large percent changes are typically "not meaningful" for such trend analysis purposes. 130 |