EX-99.2
Published on May 21, 2009
Exhibit 99.2

| May 20, 2009 Capital Update 1 |
| 2 Basis of Presentation Use of non-GAAP financial measures This presentation contains GAAP financial measures and non-GAAP financial measures where management believes it to be helpful in understanding Huntington's results of operations or financial position. Where non-GAAP financial measures are used, the comparable GAAP financial measure, as well as the reconciliation to the comparable GAAP financial measure, can be found in the current quarter earnings release, this presentation, in the Quarterly Financial Review supplement to the current quarter earnings release, or 8-K related to the filed 4/21/09 earnings press release, which can be found on Huntington's website at huntington-ir.com Annualized data Certain returns, yields, performance ratios, or growth rates for a quarter are "annualized" in this presentation to represent an annual time period. This is done for analytical and decision-making purposes to better discern underlying performance trends when compared to full-year or year-over-year amounts. For example, loan growth rates are most often expressed in terms of an annual rate like 8%. As such, a 2% growth rate for a quarter would represent an annualized 8% growth rate. Fully taxable equivalent interest income and net interest margin Income from tax-exempt earning assets is increased by an amount equivalent to the taxes that would have been paid if this income had been taxable at statutory rates. This adjustment puts all earning assets, most notably tax-exempt municipal securities and certain lease assets, on a common basis that facilitates comparison of results to results of competitors. Rounding Please note that columns of data in the following slides may not add due to rounding. NM or nm Percent changes of 100% or more are typically shown as "nm" or "not meaningful" unless required. Such large percent changes typically reflect the impact of unusual or particularly volatile items within the measured periods. Since the primary purpose of showing a percent change is for discerning underlying performance trends, such large percent changes are typically "not meaningful" for trend analysis purposes. 2 |
| 3 Forward Looking Statements We caution you that this presentation contains certain forward-looking statements within the meaning of Section 27A of the Securities Act of 1933, as amended, and Section 21E of the Securities Exchange Act of 1934, as amended, including certain plans, expectations, goals, projections, and statements, which are subject to numerous assumptions, risks, and uncertainties. The use of words such as "anticipates", "estimates", "expects", "intends", "plans", and "believes", among others, generally identify forward-looking statements. However, these words are not the exclusive means of identifying such statements. Forward- looking statements can be identified by the fact that they do not relate strictly to historical or current facts. Actual results could differ materially from those contained or implied by such statements for a variety of factors including: (1) deterioration in the loan portfolio could be worse than expected due to a number of factors such as the underlying value of the collateral could prove less valuable than otherwise assumed and assumed cash flows may be worse than expected; (2) changes in economic conditions; (3) movements in interest rates; (4) competitive pressures on product pricing and services; (5) success and timing of other business strategies; (6) the nature, extent, and timing of governmental actions and reforms, including existing and potential future restrictions and limitations imposed in connection with the Troubled Asset Relief Program's voluntary Capital Purchase Plan or otherwise under the Emergency Economic Stabilization Act of 2008; (7) extended disruption of vital infrastructure; and (8) the pricing and total shares sold under the DEIP and the relative success of the tender offer. Additional factors that could cause results to differ materially from those described above can be found in Huntington's 2008 Annual Report on Form 10-K, including in the discussion under "Risk Factors", and documents subsequently filed by Huntington with the Securities and Exchange Commission, including Huntington's Quarterly Report on Form 10-Q for the quarter ended March 31, 2009. All forward-looking statements included in this presentation are based on information available at the time of the presentation. Huntington assumes no obligation to update any forward-looking statement. 3 |
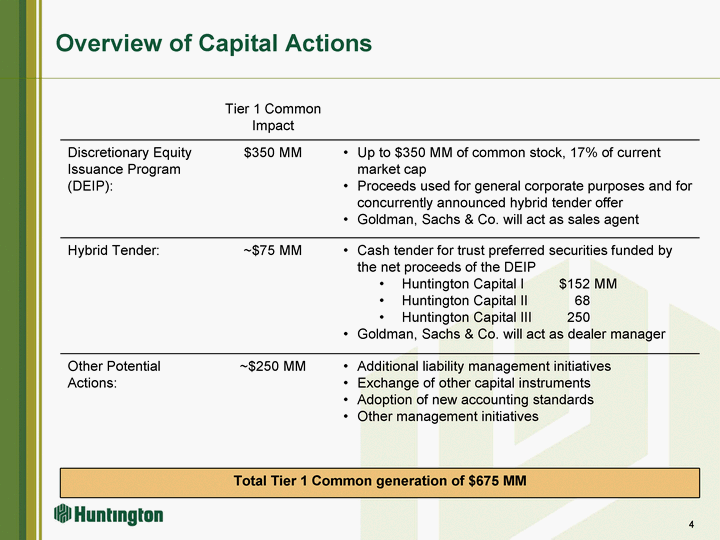
| Overview of Capital Actions Tier 1 Common Impact Discretionary Equity Issuance Program (DEIP): $350 MM Up to $350 MM of common stock, 17% of current market cap Proceeds used for general corporate purposes and for concurrently announced hybrid tender offer Goldman, Sachs & Co. will act as sales agent Hybrid Tender: ~$75 MM Cash tender for trust preferred securities funded by the net proceeds of the DEIP Huntington Capital I $152 MM Huntington Capital II 68 Huntington Capital III 250 Goldman, Sachs & Co. will act as dealer manager Other Potential Actions: ~$250 MM Additional liability management initiatives Exchange of other capital instruments Adoption of new accounting standards Other management initiatives Total Tier 1 Common generation of $675 MM Total Tier 1 Common generation of $675 MM Total Tier 1 Common generation of $675 MM 4 |
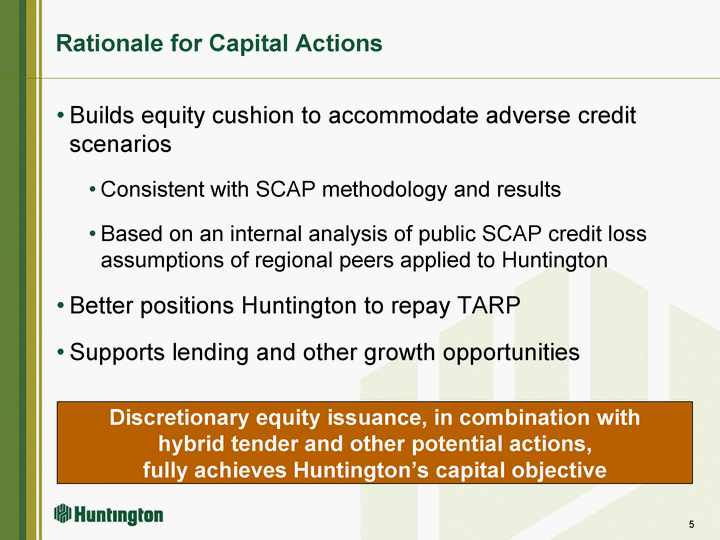
| 5 Rationale for Capital Actions Builds equity cushion to accommodate adverse credit scenarios Consistent with SCAP methodology and results Based on an internal analysis of public SCAP credit loss assumptions of regional peers applied to Huntington Better positions Huntington to repay TARP Supports lending and other growth opportunities Discretionary equity issuance, in combination with hybrid tender and other potential actions, fully achieves Huntington's capital objective |
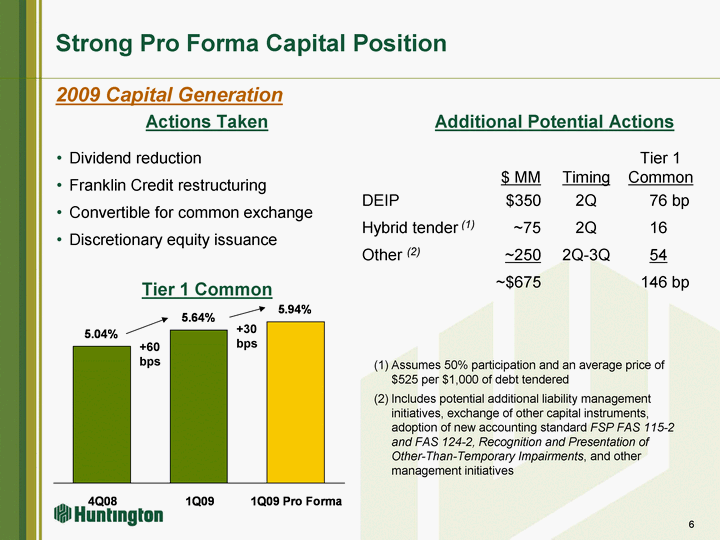
| 6 Strong Pro Forma Capital Position Tier 1 $ MM Timing Common DEIP $350 2Q 76 bp Hybrid tender (1) ~75 2Q 16 Other (2) ~250 2Q-3Q 54 ~$675 146 bp Dividend reduction Franklin Credit restructuring Convertible for common exchange Discretionary equity issuance 4Q08 1Q09 1Q09 Pro Forma 4th Qtr East 0.0504 0.0564 0.0594 20.4 West 30.6 38.6 34.6 31.6 North 45.9 46.9 45 43.9 Actions Taken Additional Potential Actions +60 bps +30 bps Tier 1 Common Assumes 50% participation and an average price of $525 per $1,000 of debt tendered Includes potential additional liability management initiatives, exchange of other capital instruments, adoption of new accounting standard FSP FAS 115-2 and FAS 124-2, Recognition and Presentation of Other-Than-Temporary Impairments, and other management initiatives 2009 Capital Generation |
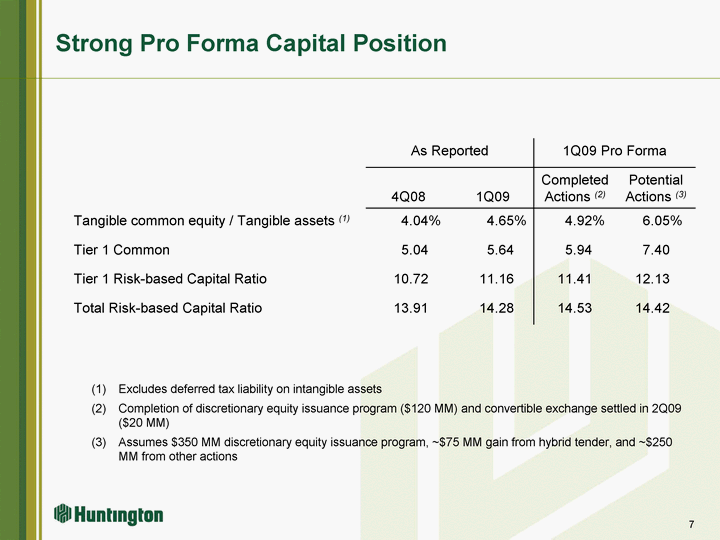
| 7 Strong Pro Forma Capital Position Excludes deferred tax liability on intangible assets Completion of discretionary equity issuance program ($120 MM) and convertible exchange settled in 2Q09 ($20 MM) Assumes $350 MM discretionary equity issuance program, ~$75 MM gain from hybrid tender, and ~$250 MM from other actions 7 As Reported As Reported 1Q09 Pro Forma 1Q09 Pro Forma 4Q08 1Q09 Completed Actions (2) Potential Actions (3) Tangible common equity / Tangible assets (1) 4.04% 4.65% 4.92% 6.05% Tier 1 Common 5.04 5.64 5.94 7.40 Tier 1 Risk-based Capital Ratio 10.72 11.16 11.41 12.13 Total Risk-based Capital Ratio 13.91 14.28 14.53 14.42 |
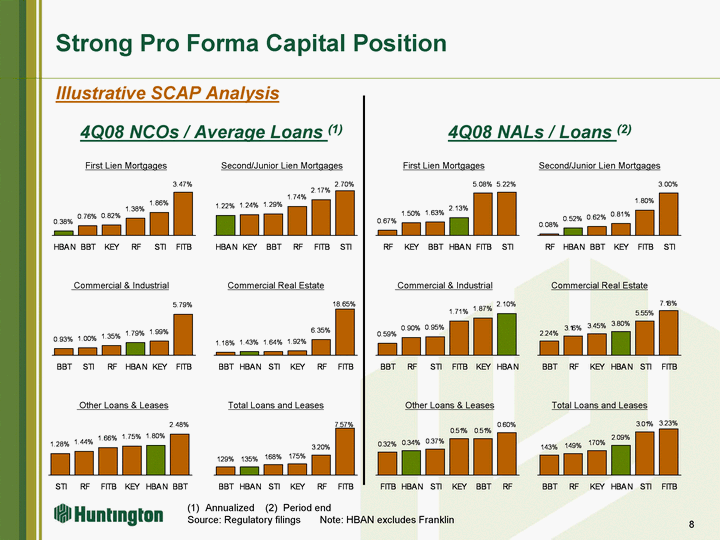
| HBAN 0.0038 BBT 0.0076 KEY 0.0082 RF 0.0138 STI 0.0186 FITB 0.0347 HBAN 0.0122 KEY 0.0124 BBT 0.0129 RF 0.0174 FITB 0.0217 STI 0.027 RF 0.0067 KEY 0.015 BBT 0.0163 HBAN 0.0213 FITB 0.0508 STI 0.0522 RF 0.0008 HBAN 0.0052 BBT 0.0062 KEY 0.0081 FITB 0.018 STI 0.03 BBT 0.0093 STI 0.01 RF 0.0135 HBAN 0.0179 KEY 0.0199 FITB 0.0579 BBT 0.0118 HBAN 0.0143 STI 0.0164 KEY 0.0192 RF 0.0635 FITB 0.1865 BBT 0.0059 RF 0.009 STI 0.0095 FITB 0.0171 KEY 0.0187 HBAN 0.021 BBT 0.0224 RF 0.0316 KEY 0.0345 HBAN 0.038 STI 0.0555 FITB 0.0718 STI 0.0128 RF 0.0144 FITB 0.0166 KEY 0.0175 HBAN 0.018 BBT 0.0248 FITB 0.0032 HBAN 0.0034 STI 0.0037 KEY 0.0051 BBT 0.0051 RF 0.006 8 Strong Pro Forma Capital Position Annualized (2) Period end Source: Regulatory filings Note: HBAN excludes Franklin First Lien Mortgages Second/Junior Lien Mortgages First Lien Mortgages Second/Junior Lien Mortgages Commercial & Industrial Commercial Real Estate Commercial & Industrial Commercial Real Estate Other Loans & Leases Other Loans & Leases 4Q08 NALs / Loans (2) 4Q08 NCOs / Average Loans (1) Illustrative SCAP Analysis BBT 0.0129 HBAN 0.0135 STI 0.0168 KEY 0.0175 RF 0.032 FITB 0.0757 BBT 0.0143 RF 0.0149 KEY 0.017 HBAN 0.0209 STI 0.0301 FITB 0.0323 Total Loans and Leases Total Loans and Leases |
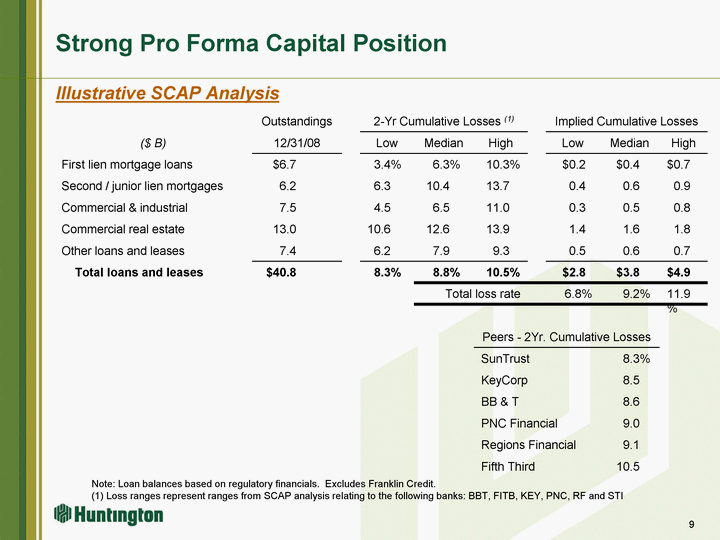
| 9 Strong Pro Forma Capital Position Note: Loan balances based on regulatory financials. Excludes Franklin Credit. (1) Loss ranges represent ranges from SCAP analysis relating to the following banks: BBT, FITB, KEY, PNC, RF and STI Illustrative SCAP Analysis Outstandings 2-Yr Cumulative Losses (1) 2-Yr Cumulative Losses (1) 2-Yr Cumulative Losses (1) Implied Cumulative Losses Implied Cumulative Losses Implied Cumulative Losses ($ B) 12/31/08 Low Median High Low Median High First lien mortgage loans $6.7 3.4% 6.3% 10.3% $0.2 $0.4 $0.7 Second / junior lien mortgages 6.2 6.3 10.4 13.7 0.4 0.6 0.9 Commercial & industrial 7.5 4.5 6.5 11.0 0.3 0.5 0.8 Commercial real estate 13.0 10.6 12.6 13.9 1.4 1.6 1.8 Other loans and leases 7.4 6.2 7.9 9.3 0.5 0.6 0.7 Total loans and leases $40.8 8.3% 8.8% 10.5% $2.8 $3.8 $4.9 Total loss rate Total loss rate 6.8% 9.2% 11.9% Peers - 2Yr. Cumulative Losses Peers - 2Yr. Cumulative Losses Peers - 2Yr. Cumulative Losses Peers - 2Yr. Cumulative Losses SunTrust SunTrust SunTrust 8.3% KeyCorp KeyCorp KeyCorp 8.5 BB & T BB & T BB & T 8.6 PNC Financial PNC Financial PNC Financial 9.0 Regions Financial Regions Financial Regions Financial 9.1 Fifth Third Fifth Third Fifth Third 10.5 |
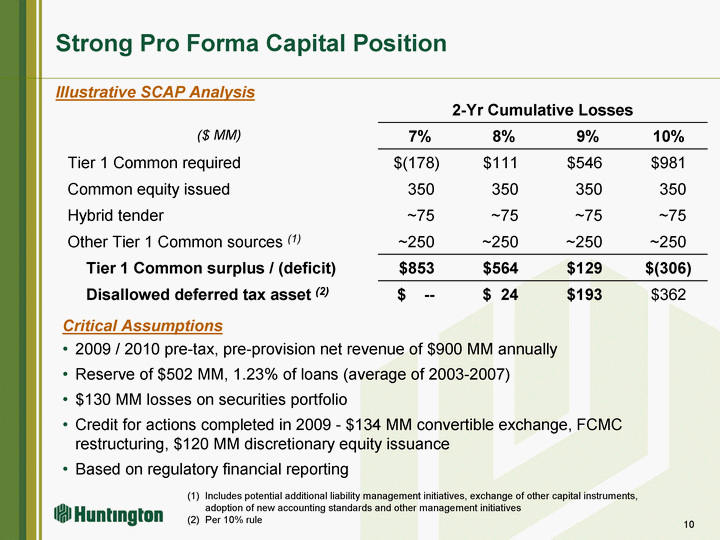
| 10 Strong Pro Forma Capital Position Includes potential additional liability management initiatives, exchange of other capital instruments, adoption of new accounting standards and other management initiatives Per 10% rule Illustrative SCAP Analysis 2-Yr Cumulative Losses 2-Yr Cumulative Losses 2-Yr Cumulative Losses 2-Yr Cumulative Losses ($ MM) 7% 8% 9% 10% Tier 1 Common required $(178) $111 $546 $981 Common equity issued 350 350 350 350 Hybrid tender ~75 ~75 ~75 ~75 Other Tier 1 Common sources (1) ~250 ~250 ~250 ~250 Tier 1 Common surplus / (deficit) $853 $564 $129 $(306) Disallowed deferred tax asset (2) $ -- $ 24 $193 $362 Critical Assumptions 2009 / 2010 pre-tax, pre-provision net revenue of $900 MM annually Reserve of $502 MM, 1.23% of loans (average of 2003-2007) $130 MM losses on securities portfolio Credit for actions completed in 2009 - $134 MM convertible exchange, FCMC restructuring, $120 MM discretionary equity issuance Based on regulatory financial reporting |
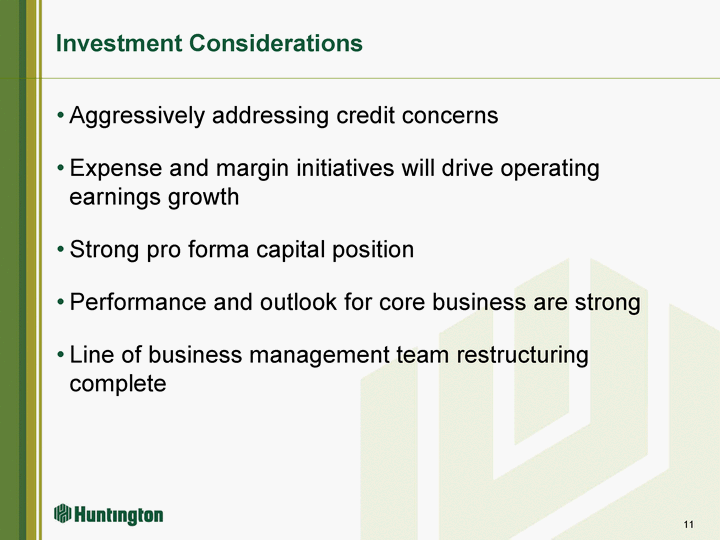
| 11 Investment Considerations Aggressively addressing credit concerns Expense and margin initiatives will drive operating earnings growth Strong pro forma capital position Performance and outlook for core business are strong Line of business management team restructuring complete |
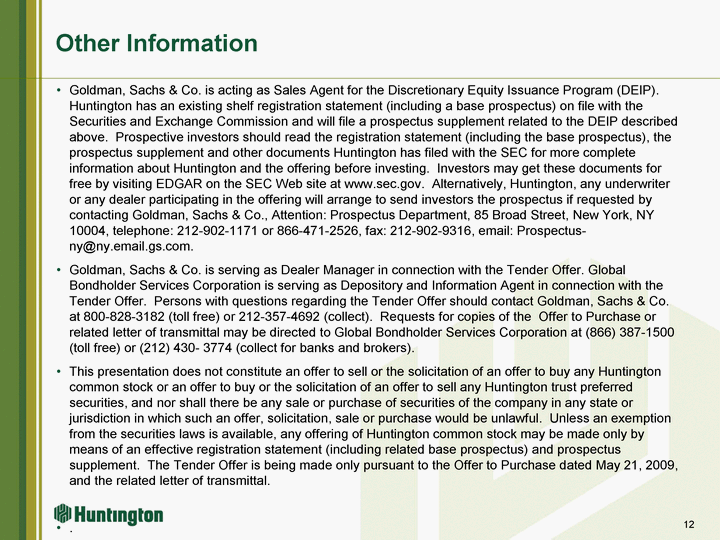
| 12 Other Information Goldman, Sachs & Co. is acting as Sales Agent for the Discretionary Equity Issuance Program (DEIP). Huntington has an existing shelf registration statement (including a base prospectus) on file with the Securities and Exchange Commission and will file a prospectus supplement related to the DEIP described above. Prospective investors should read the registration statement (including the base prospectus), the prospectus supplement and other documents Huntington has filed with the SEC for more complete information about Huntington and the offering before investing. Investors may get these documents for free by visiting EDGAR on the SEC Web site at www.sec.gov. Alternatively, Huntington, any underwriter or any dealer participating in the offering will arrange to send investors the prospectus if requested by contacting Goldman, Sachs & Co., Attention: Prospectus Department, 85 Broad Street, New York, NY 10004, telephone: 212-902-1171 or 866-471-2526, fax: 212-902-9316, email: Prospectus- ny@ny.email.gs.com. Goldman, Sachs & Co. is serving as Dealer Manager in connection with the Tender Offer. Global Bondholder Services Corporation is serving as Depository and Information Agent in connection with the Tender Offer. Persons with questions regarding the Tender Offer should contact Goldman, Sachs & Co. at 800-828-3182 (toll free) or 212-357-4692 (collect). Requests for copies of the Offer to Purchase or related letter of transmittal may be directed to Global Bondholder Services Corporation at (866) 387-1500 (toll free) or (212) 430- 3774 (collect for banks and brokers). This presentation does not constitute an offer to sell or the solicitation of an offer to buy any Huntington common stock or an offer to buy or the solicitation of an offer to sell any Huntington trust preferred securities, and nor shall there be any sale or purchase of securities of the company in any state or jurisdiction in which such an offer, solicitation, sale or purchase would be unlawful. Unless an exemption from the securities laws is available, any offering of Huntington common stock may be made only by means of an effective registration statement (including related base prospectus) and prospectus supplement. The Tender Offer is being made only pursuant to the Offer to Purchase dated May 21, 2009, and the related letter of transmittal. .. 12 |

| Appendix 13 |
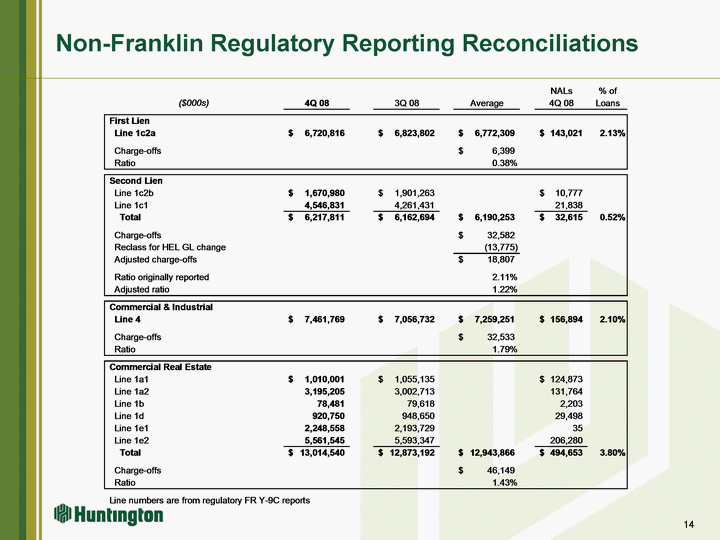
| Non-Franklin Regulatory Reporting Reconciliations 14 |
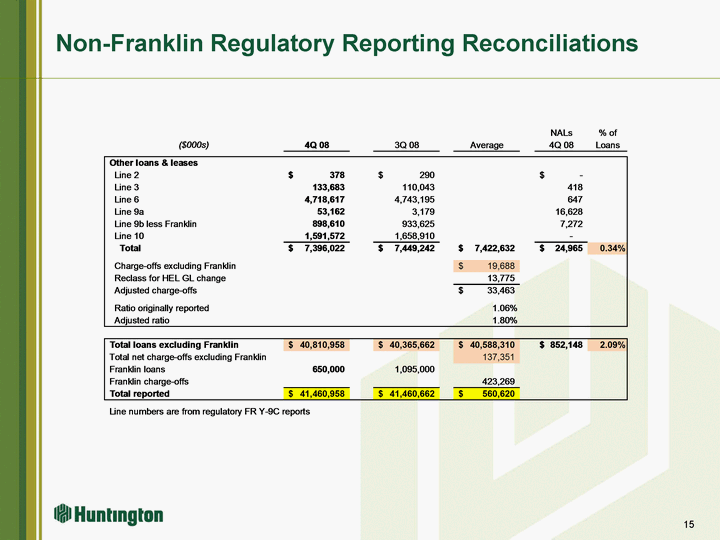
| Non-Franklin Regulatory Reporting Reconciliations 15 |