425: Filing under Securities Act Rule 425 of certain prospectuses and communications in connection with business combination transactions
Published on December 21, 2006
Filed by Huntington Bancshares Incorporated
Pursuant to Rule 425 under the Securities Act of 1933
and deemed filed pursuant to Rule 14a-12
of the Securities Exchange Act of 1934
Subject Company: Sky Financial Group, Inc.
(Commission File No. 001-14473)
Huntington                                                                  Sky

                           A Value Added Combination
                                      ---
                         A Stronger Regional Presence


                               December 21, 2006

                                                                              1
|
 |
Meeting Participants

                                  Huntington

Tom Hoaglin
- -- Chairman, President and Chief Executive Officer

Don Kimble
- -- Executive Vice President -- Chief Financial Officer

Jay Gould
- -- Senior Vice President -- Investor Relations

                                      Sky

Marty Adams
- -- Chairman, President and Chief Executive Officer

                                                                              2
|
 |
Presentation Overview

o    Why this transaction?

o    A value added combination

o    A stronger regional presence

o    Organizational structure

o    Low execution risk

o    Appendix

                                                                              3
|
 |
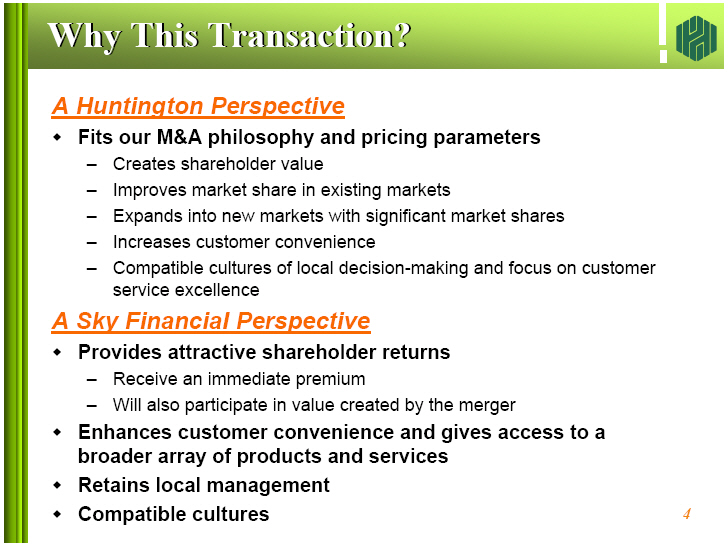
Why This Transaction?

A Huntington Perspective
- ------------------------

o Fits our M&A philosophy and pricing parameters
        --      Creates shareholder value
        --      Improves market share in existing markets
        --      Expands into new markets with significant market shares
        --      Increases customer convenience
        --      Compatible cultures of local decision-making and focus on
                customer service excellence

A Sky Financial Perspective
- ---------------------------

o Provides attractive shareholder returns
        --      Receive an immediate premium
        --      Will also participate in value created by the merger

o Enhances customer convenience and gives access to a broader array of products
  and services

o Retains local management

o Compatible cultures

                                                                              4
|
 |
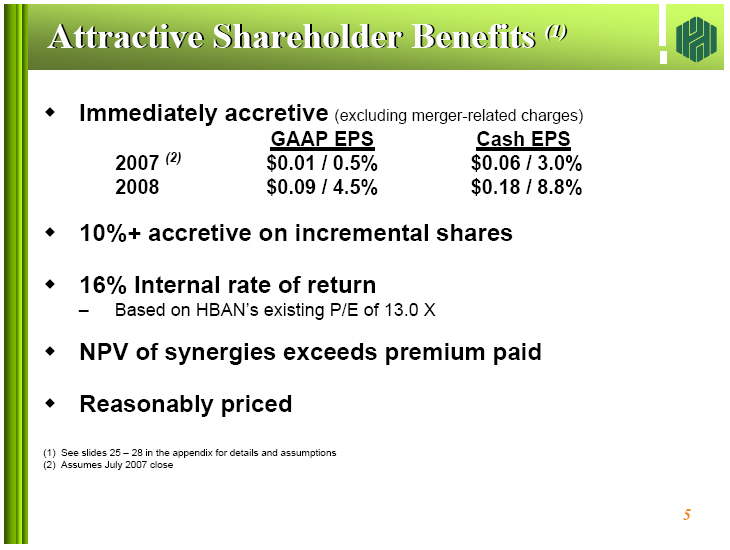
Attractive Shareholder Benefits (1)

o Immediately accretive (excluding merger-related charges)

                         GAAP EPS        Cash EPS
                         --------        --------
         2007 (2)        $0.01 / 0.5%    $0.06 / 3.0%
         2008            $0.09 / 4.5%    $0.18 / 8.8%

o 10%+ accretive on incremental shares

o 16% Internal rate of return
        --      Based on HBAN's existing P/E of 13.0 X

o NPV of synergies exceeds premium paid

o Reasonably priced


(1)     See slides 25 -- 28 in the appendix for details and assumptions
(2)     Assumes July 2007 close

                                                                              5
|
 |
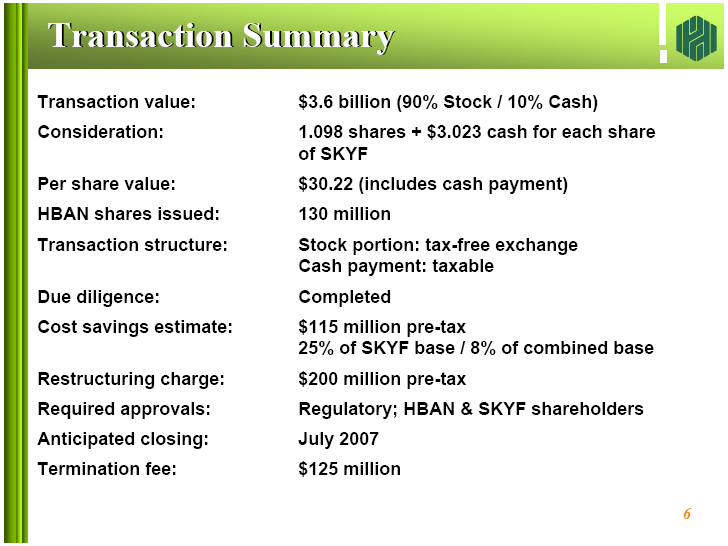
Transaction Summary

Transaction value:       $3.6 billion (90% Stock / 10% Cash)

Consideration:           1.098 shares + $3.023 cash for each share
                         of SKYF

Per share value:         $30.22 (includes cash payment)

HBAN shares issued:      130 million

Transaction structure:   Stock portion: tax-free exchange
                         Cash payment: taxable

Due diligence:           Completed

Cost savings estimate:   $115 million pre-tax
                         25% of SKYF base / 8% of combined base

Restructuring charge:    $200 million pre-tax

Required approvals:      Regulatory; HBAN & SKYF shareholders

Anticipated closing:     July 2007

Termination fee:         $125 million

                                                                              6
|
 |
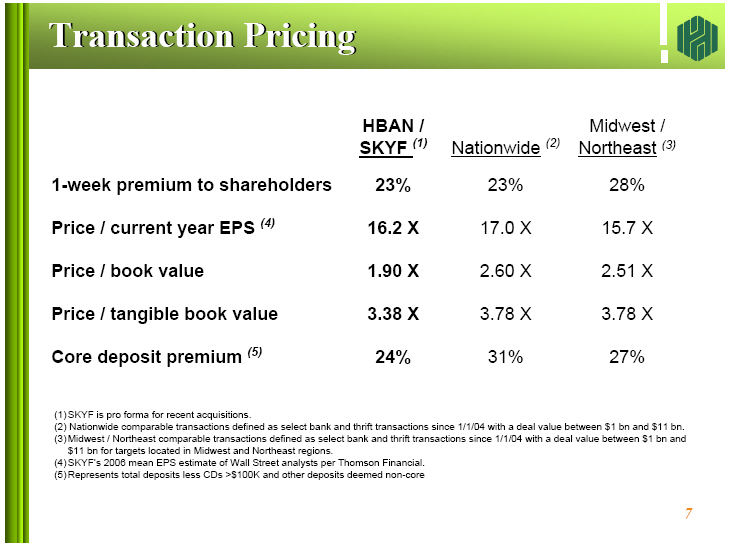
Transaction Pricing

                                 HBAN /                          Midwest /
                                 SKYF(1)         Nationwide(2)   Northeast(3)
                                 -------         -------------   ------------

1-week premium to shareholders   23%             23%             28%

Price / current year EPS (4)     16.2X           17.0X           15.7X

Price / book value               1.90X           2.60X           2.51X

Price / tangible book value      3.38X           3.78X           3.78X

Core deposit premium (5)         24%             31%             27%


(1) SKYF is pro forma for recent acquisitions.
(2) Nationwide comparable transactions defined as select bank and thrift
    transactions since 1/1/04 with a deal value between $1 bn and $11 bn.
(3) Midwest / Northeast comparable transactions defined as select bank and
    thrift transactions since 1/1/04 with a deal value between $1 bn and $11 bn for
    targets located in Midwest and Northeast regions.
(4) SKYF's 2006 mean EPS estimate of Wall Street analysts per Thomson Financial.
(5) Represents total deposits less CDs >$100K and other deposits deemed
    non-core

                                                                              7
|
 |
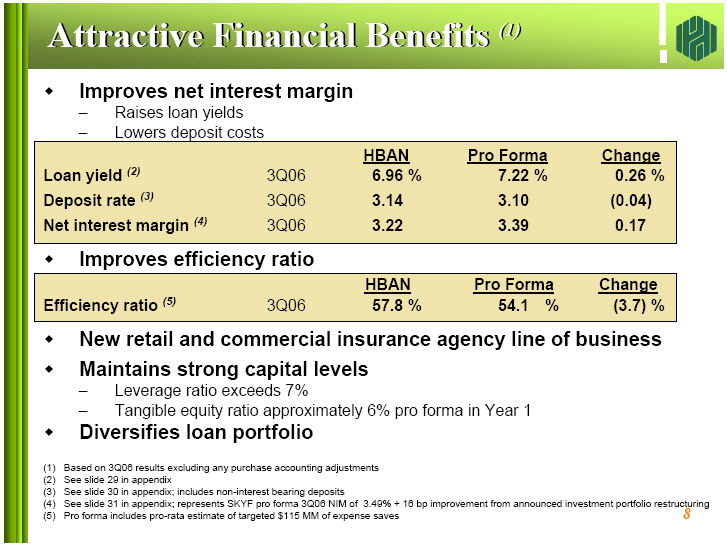
Attractive Financial Benefits (1)


o Improves net interest margin
         --      Raises loan yields
         --      Lowers deposit costs

- -------------------------------------------------------------------------------
                                         HBAN    Pro Forma   Change
                                         ----    ---------   ------
Loan yield (2)                   3Q06    6.96%   7.22%       0.26%
Deposit rate (3)                 3Q06    3.14    3.10       (0.04)
Net interest margin (4)          3Q06    3.22    3.39        0.17
- -------------------------------------------------------------------------------

o Improves efficiency ratio

- -------------------------------------------------------------------------------
                                         HBAN    Pro Forma   Change
                                         ----    ---------   ------
Efficiency ratio (5)             3Q06    57.8%   54.1%      (3.7)%
- -------------------------------------------------------------------------------

o New retail and commercial insurance agency line of business

o Maintains strong capital levels
        --      Leverage ratio exceeds 7%
        --      Tangible equity ratio approximately 6% pro forma in Year 1

o Diversifies loan portfolio


(1) Based on 3Q06 results excluding any purchase accounting adjustments
(2) See slide 29 in appendix
(3) See slide 30 in appendix; includes non-interest bearing deposits
(4) See slide 31 in appendix; represents SKYF pro forma 3Q06 NIM of 3.49% +
    16 bp improvement from announced investment portfolio restructuring
(5) Pro forma includes pro-rata estimate of targeted $115 MM of expense saves

                                                                              8
|
 |
A Better-Balanced Franchise (1)

Loan Composition

Deposit Composition

(1) 3Q06 average balances
(2) Pro forma: reported 3Q06 amounts adjusted for subsequent acquisitions
(3) Includes non-interest bearing deposits

                                                                              9
|
 |
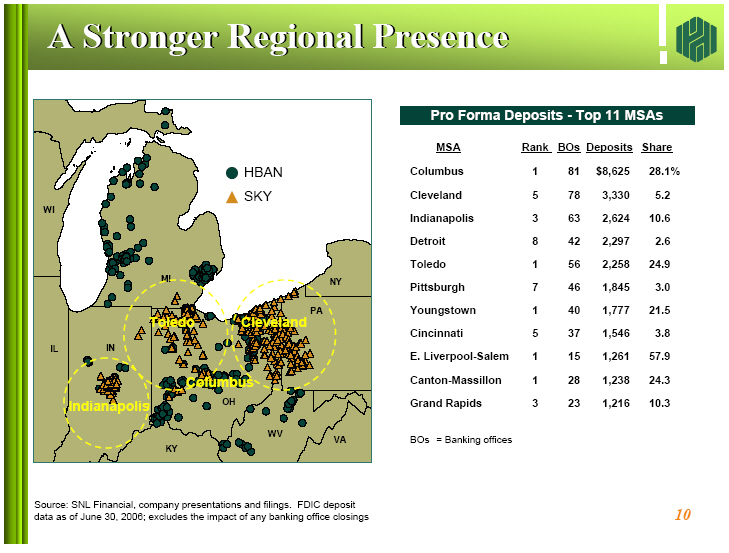
A Stronger Regional Presence

- --------------------------------
Pro Forma Deposits - Top 11 MSAs
- --------------------------------

MSA                      Rank    BOs    Deposits   Share
- ---                      ----    ---    --------   -----
Columbus                 1       81     $8,625     28.1%
Cleveland                5       78     3,330      5.2
Indianapolis             3       63     2,624      10.6
Detroit                  8       42     2,297      2.6
Toledo                   1       56     2,258      24.9
Pittsburgh               7       46     1,845      3.0
Youngstown               1       40     1,777      21.5
Cincinnati               5       37     1,546      3.8
E. Liverpool-Salem       1       15     1,261      57.9
Canton-Massillon         1       28     1,238      24.3
Grand Rapids             3       23     1,216      10.3

BOs = Banking offices


Source: SNL Financial, company presentations and filings. FDIC deposit data as
of June 30, 2006; excludes the impact of any banking office closings

                                                                             10
|
 |
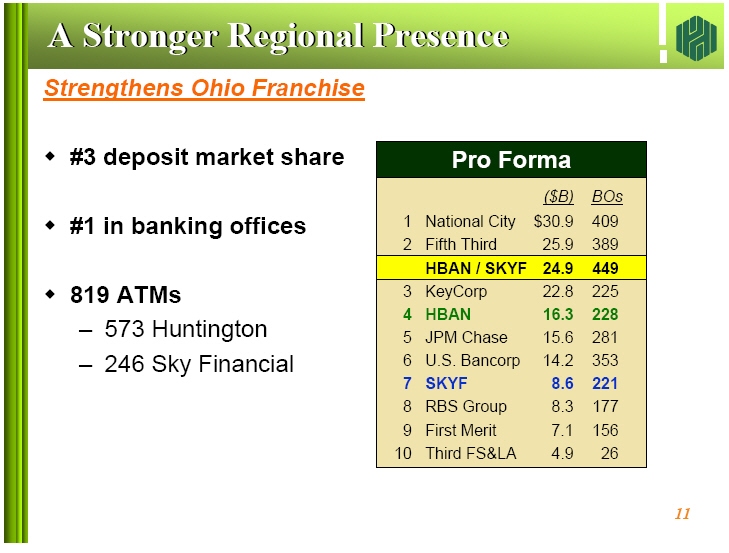
A Stronger Regional Presence


Strengthens Ohio Franchise
- --------------------------

o #3 deposit market share               -----------------------------------
                                                     Pro Forma
o #1 in banking offices                 -----------------------------------
                                                            ($B)    BOs
o 819 ATMs                                                  ----    ---
        --      573 Huntington          1   National City   $30.9   409
        --      246 Sky Financial       2   Fifth Third     25.9    389
                                        -----------------------------------

x Leverages technology expertise


                                        -----------------------------------
                                        3   KeyCorp         22.8    225
                                        4   HBAN            16.3    228
                                        5   JPM Chase       15.6    281
                                        6   U.S. Bancorp    14.2    353
                                        7   SKYF            8.6     221
                                        8   RBS Group       8.3     177
                                        9   First Merit     7.1     156
                                        10  Third FS&LA     4.9     26
                                        -----------------------------------

                                                                             11
|
 |
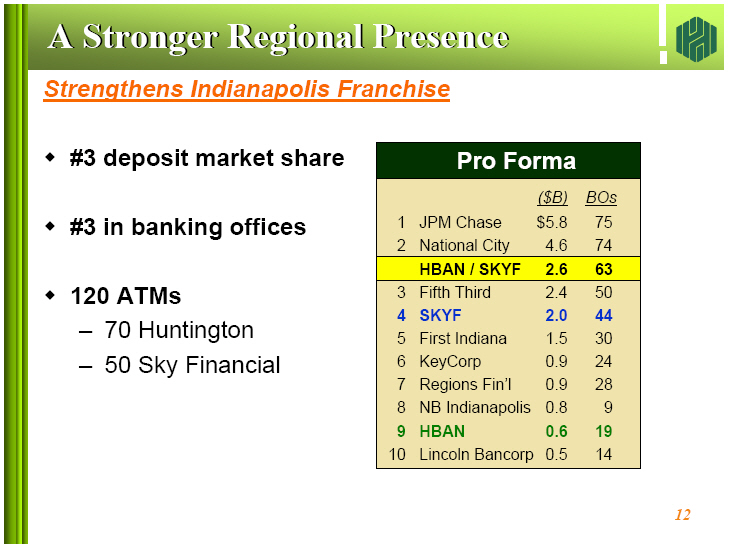
A Stronger Regional Presence


Strengthens Indianapolis Franchise
- ----------------------------------

o #3 deposit market share               ----------------------------------------
                                                         Pro Forma
o #3 in banking offices                 ----------------------------------------
                                                                    ($B)    BOs
o 120 ATMs                                                          ----    ---
        --      70 Huntington           1   JPM Chase               $5.8    75
        --      50 Sky Financial        2   National City           4.6     74
                                        ----------------------------------------
                                            HBAN / SKYF             2.6     63
                                        ----------------------------------------
                                        3   Fifth Third             2.4     50
                                        4   SKYF                    2.0     44
                                        5   First Indiana           1.5     30
                                        6   KeyCorp                 0.9     24
                                        7   Regions Fin'l           0.9     28
                                        8   NB Indianapolis         0.8     9
                                        9   HBAN                    0.6     19
                                        10  Lincoln Bancorp         0.5     14
                                        ----------------------------------------

                                                                             12
|
 |
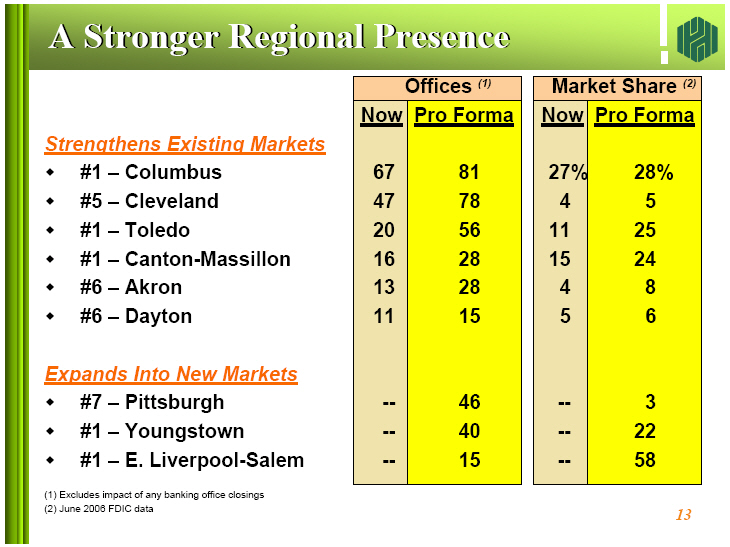
A Stronger Regional Presence

                                                   Offices (1)   Market Share (2)
                                                 --------------  ----------------
                                                 Now  Pro Forma  Now  Pro Forma
                                                 ---  ---------  ---  ---------
Strengthens Existing Markets
- ----------------------------
         #1      --      Columbus                67      81      27%     28%
         #5      --      Cleveland               47      78      4       5
         #1      --      Toledo                  20      56      11      25
         #1      --      Canton-Massillon        16      28      15      24
         #6      --      Akron                   13      28      4       8
         #6      --      Dayton                  11      15      5       6

Expands Into New Markets
- ------------------------
         #7      --      Pittsburgh              --      46      --      3
         #1      --      Youngstown              --      40      --      22
         #1      --      E. Liverpool-Salem      --      15      --      58

(1) Excludes impact of any banking office closings
(2) June 2006 FDIC data
                                                                             13
|
 |
Organizational Structure


Board Composition
- -----------------
                         Current                 Post-merger
                         -------                 -----------
  Huntington               11                      10
  Sky Financial            14                      5

Primary Officers
- ----------------
  Tom Hoaglin              Chairman & CEO
  Marty Adams              President & COO

Succession Plan
- ---------------
  Marty Adams              To be appointed President & CEO on, or before,
                           December 31, 2009
  Tom Hoaglin              To remain Chairman until early 2011

Other Appointments
- ------------------
  Selected the best

                                                                             14
|
 |
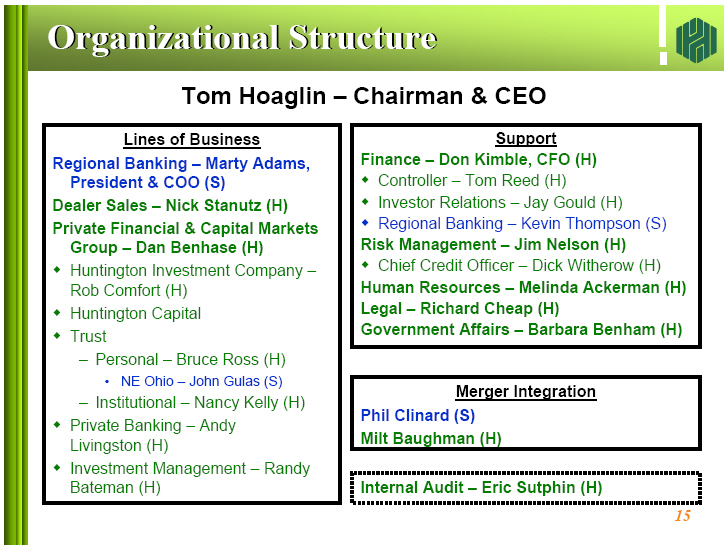
Organizational Structure


                         Tom Hoaglin -- Chairman & CEO

- ----------------------------------------------  ---------------------------------------------
          Lines of Business                                      Support
          -----------------                                      -------
Regional Banking -- Marty Adams,                Finance -- Don Kimble, CFO (H)
  President & COO (S)                           o Controller -- Tom Reed (H)
Dealer Sales -- Nick Stanutz (H)                o Investor Relations -- Jay Gould (H)
Private Financial & Capital Markets             o Regional Banking -- Kevin Thompson (S)
  Group -- Dan Benhase (H)                      Risk Management -- Jim Nelson (H)
o Huntington Investment Company --              o Chief Credit Officer -- Dick Witherow (H)
  Rob Comfort (H)                               Human Resources -- Melinda Ackerman (H)
o Huntington Capital                            Legal -- Richard Cheap (H)
o Trust                                         Government Affairs -- Barbara Benham (H)
         -- Personal -- Bruce Ross (H)          ---------------------------------------------
            o NE Ohio -- John Gulas (S)
         -- Institutional -- Nancy Kelly (H)    ---------------------------------------------
o Private Banking -- Andy                                Merger Integration
  Livingston (H)                                         ------------------
o Investment Management -- Randy                Phil Clinard (S)
  Bateman (H)                                   Milt Baughman (H)
- ----------------------------------------------  ---------------------------------------------

                                                ---------------------------------------------
                                                Internal Audit -- Eric Sutphin (H)
                                                ---------------------------------------------

                                                                             15
|
 |
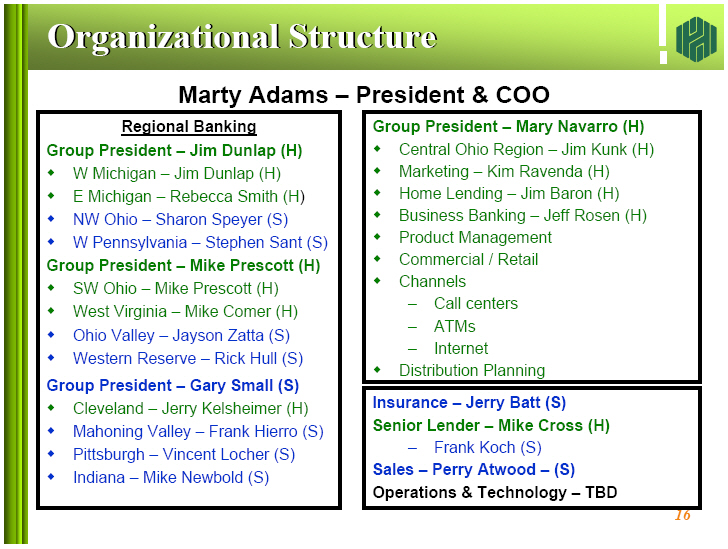
Organizational Structure


                        Marty Adams -- President & COO

- -------------------------------------  -------------------------------------
         Regional Banking              Group President -- Mary Navarro (H)
         ----------------              o Central Ohio Region -- Jim Kunk (H)
Group President -- Jim Dunlap (H)      o Marketing -- Kim Ravenda (H)
o W Michigan -- Jim Dunlap (H)         o Home Lending -- Jim Baron (H)
o E Michigan -- Rebecca Smith (H)      o Business Banking -- Jeff Rosen (H)
o NW Ohio -- Sharon Speyer (S)         o Product Management
o W Pennsylvania -- Stephen Sant (S)   o Commercial / Retail
                                       o Channels
Group President -- Mike Prescott (H)     -- Call centers
o SW Ohio -- Mike Prescott (H)           -- ATMs
o West Virginia -- Mike Comer (H)        -- Internet
o Ohio Valley -- Jayson Zatta (S)      o Distribution Planning
o Western Reserve -- Rick Hull (S)     -------------------------------------

Group President -- Gary Small (S)      -------------------------------------
o Cleveland -- Jerry Kelsheimer (H)    Insurance -- Jerry Batt (S)
o Mahoning Valley -- Frank Hierro (S)  Senior Lender -- Mike Cross (H)
o Pittsburgh -- Vincent Locher (S)              --      Frank Koch (S)
o Indiana -- Mike Newbold (S)          Sales -- Perry Atwood -- (S)
- -------------------------------------  Operations & Technology -- TBD
                                       -------------------------------------

                                                                             16
|
 |
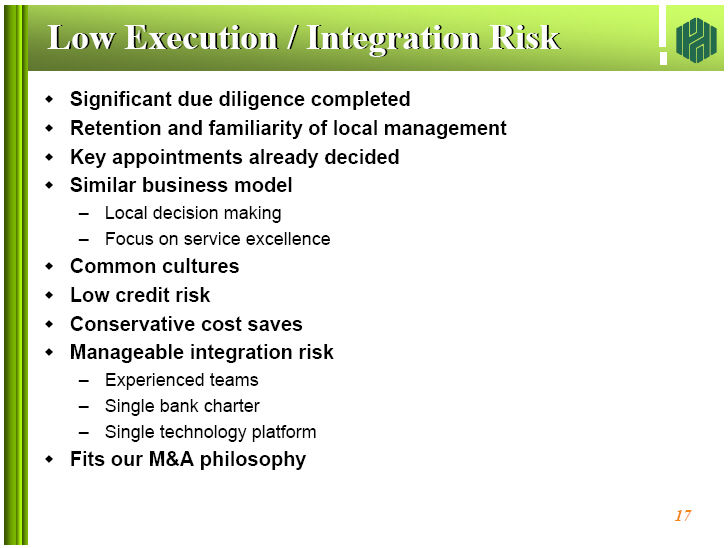
Low Execution / Integration Risk


o Significant due diligence completed
o Retention and familiarity of local management
o Key appointments already decided
o Similar business model
  -- Local decision making
  -- Focus on service excellence
o Common cultures
o Low credit risk
o Conservative cost saves
o Manageable integration risk
  -- Experienced teams
  -- Single bank charter
  -- Single technology platform
o Fits our M&A philosophy

                                                                             17
|
 |
Basis of Presentation


Use of Pro Forma data
- ---------------------
This presentation contains Pro Forma financial measures where management
believes it to be helpful in understanding how the proposed merger with Sky
Financial Group will impact Huntington's results of operations or financial
position. The data represent actual reported information as of September 30,
2006 for both organizations, combined arithmetically, with no adjustments for
purchase accounting made, unless otherwise noted. The data for Sky Financial
Group also include Union Federal Bank reported information on a similar pro
forma basis, as this transaction was completed by Sky Financial Group
subsequent to September 30, 2006.

Use of non-GAAP financial measures
- ----------------------------------
This presentation contains GAAP financial measures and non-GAAP financial
measures where management believes it to be helpful in understanding
Huntington's results of operations or financial position. Where non-GAAP
financial measures are used, the comparable GAAP financial measure, as well as
the reconciliation to the comparable GAAP financial measure, can be found in
the current quarter earnings press release, this presentation, or in the
Quarterly Financial Review supplement to the current Earnings Press Release,
which can be found on Huntington's website at huntington-ir.com.

Annualized data
- ---------------
Certain returns, yields, performance ratios, or growth rates for a quarter are
"annualized" in this presentation to represent an annual time period. This is
done for analytical and decision -making purposes to better discern underlying
performance trends when compared to full-year or year-over-year amounts. For
example, loan growth rates are most often expressed in terms of an annual rate
like 8%. As such, a 2% growth rate for a quarter would represent an annualized
8% growth rate.

Fully taxable equivalent interest income and net interest margin
- ----------------------------------------------------------------
Income from tax-exempt earnings assets is increased by an amount equivalent to
the taxes that would have been paid if this income had been taxable at
statutory rates. This adjustment puts all earning assets, most notably
tax-exempt municipal securities and certain lease assets, on a common basis
that facilitates comparison of results to results of competitors.

Earnings per share equivalent data
- ----------------------------------
Significant and/or one-time income or expense items may be expressed on a per
common share basis. This is done for analytical and decision -making purposes
to better discern underlying trends in total corporate earnings per share
performance excluding the impact of such items. Investors may also find this
information helpful in their evaluation of the company's financial performance
against published earnings per share consensus amounts, which typically exclude
the impact of significant and/or one-time items. Earnings per share equivalents
are usually calculated by applying a 35% effective tax rate to a pre-tax amount
to derive an after-tax amount which is divided by the average shares
outstanding during the respective reporting period. Occasionally, when the item
involves special tax treatment, the after-tax amount is separately disclosed,
with this then being the amount used to calculate the earnings per share
equivalent.

Rounding
- --------
Please note that columns of data in the following slides may not add due to
rounding.

NM or nm
- --------
Percent changes of 100% or more are shown as "nm" or "not meaningful" . Such
large percent changes typically reflect the impact of one-time items within the
measured periods. Since the primary purpose of showing a percent change is for
discerning underlying performance trends, such large percent changes are
"not meaningful" for this purpose.

                                                                             18
|
 |
Forward Looking Statements


This presentation contains certain forward -looking statements, including
certain plans, expectations, goals, and projections, and including statements
about the benefits of the merger between Huntington and Sky Financial Group,
which are subject to numerous assumptions, risks, and uncertainties.

Actual results could differ materially from those contained or implied by such
statements for a variety of factors including: the businesses of Huntington and
Sky Financial Group may not be integrated successfully or such integration may
take longer to accomplish than expected; the expected cost savings and any
revenue synergies from the merger may not be fully realized within the expected
timeframes; disruption from the merger may make it more difficult to maintain
relationships with clients, associates, or suppliers; the required governmental
approvals of the merger may not be obtained on the proposed terms and schedule;
Huntington and/or Sky Financial Group's stockholders may not approve the
merger; changes in economic conditions; movements in interest rates;
competitive pressures on product pricing and services; success and timing of
other business strategies; the nature, extent, and timing of governmental
actions and reforms; and extended disruption of vital infrastructure; and other
factors described in Huntington's 2005 Annual Report on Form 10-K, Sky
Financial Group's 2005 Annual Report on Form 10-K, and documents subsequently
filed by Huntington and Sky Financial Group with the Securities and Exchange
Commission.

All forward-looking statements included in this news release are based on
information available at the time of the release. Neither Huntington nor Sky
Financial Group assume any obligation to update any forward -looking
statement.

                                                                             19
|
 |
Additional Information About the Merger and Where to Find It


Huntington and Sky Financial Group will be filing relevant documents concerning
the transaction with the Securities and Exchange Commission, including a
registration statement on Form S-4 which will include a proxy
statement/prospectus. Stockholders will be able to obtain a free copy of the
proxy statement/prospectus, as well as other filings containing information
about Huntington and Sky Financial Group, at the Securities and Exchange
Commission's internet site (http://www. sec.gov). Copies of the proxy
statement/prospectus and the filings with the Securities and Exchange
Commission that will be incorporated by reference in the proxy
statement/prospectus can also be obtained, without charge, by directing a
request to Huntington Bancshares Incorporated, Huntington Center, 41 South High
Street, Columbus, Ohio 43287, Attention: Investor Relations, 614-480-4060, or

Sky Financial Group, 221 South Church Street, Bowling Green, Ohio, 43402. The
final proxy statement / prospectus will be mailed to stockholders of Huntington
and Sky Financial Group.

Stockholders are urged to read the proxy statement/prospectus, and other
relevant documents filed with the Securities and Exchange Commission regarding
the proposed transaction when they become available, because they will contain
important information.

The directors and executive officers of Huntington and Sky Financial Group and
other persons may be deemed to be participants in the solicitation of proxies
in respect of the proposed merger. Information regarding Huntington's directors
and executive officers is available in its proxy statement filed with the SEC
by Huntington on March 8, 2006. Information regarding Sky Financial Group's
directors and executive officers is available in its proxy statement filed with
the SEC by Sky Financial Group on February 23, 2006. Other information
regarding the participants in the proxy solicitation and a description of their
direct and indirect interests, by security holdings or otherwise, will be
contained in the proxy statement/prospectus and other relevant materials to be
filed with the SEC when they become available.

                                                                             20
|
 |
                           A Value Added Combination
                                      ---
                         A Stronger Regional Presence

                                                                             21
|
 |
                                   Appendix

                                                                             22
|
 |
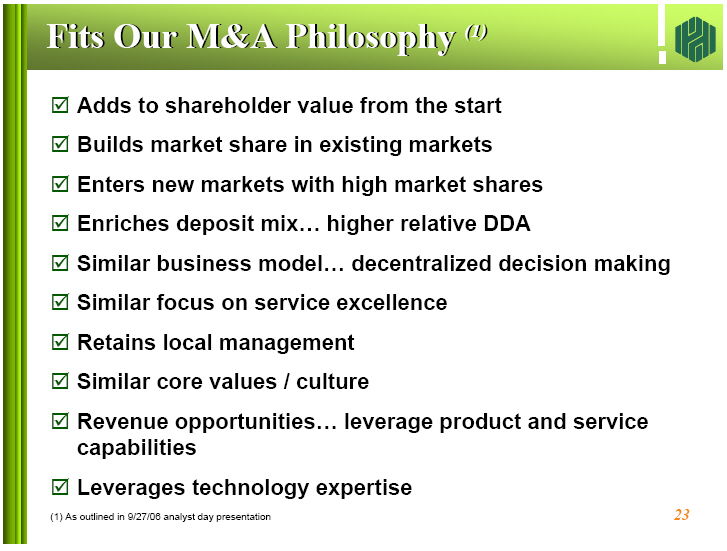
Fits Our M&A Philosophy (1)

x Adds to shareholder value from the start
x Builds market share in existing markets
x Enters new markets with high market shares
x Enriches deposit mix... higher relative DDA
x Similar business model... decentralized decision making
x Similar focus on service excellence
x Retains local management
x Similar core values / culture
x Revenue opportunities... leverage product and service capabilities
x Leverages technology expertise

                                                                             23
(1) As outlined in 9/27/06 analyst day presentation
|
 |
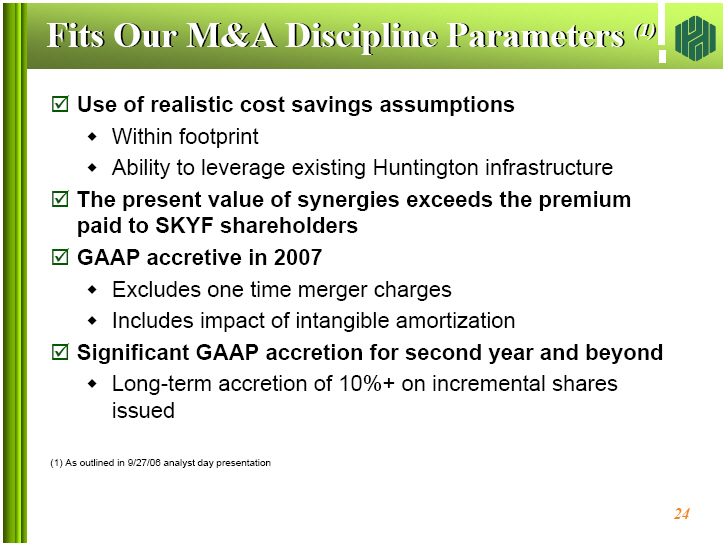
Fits Our M&A Discipline Parameters (1)


x Use of realistic cost savings assumptions
  o Within footprint
  o Ability to leverage existing Huntington infrastructure
x The present value of synergies exceeds the premium paid to SKYF shareholders
x GAAP accretive in 2007
  o Excludes one time merger charges
  o Includes impact of intangible amortization
x Significant GAAP accretion for second year and beyond
  o Long-term accretion of 10%+ on incremental shares issued


(1) As outlined in 9/27/06 analyst day presentation
                                                                             24
|
 |
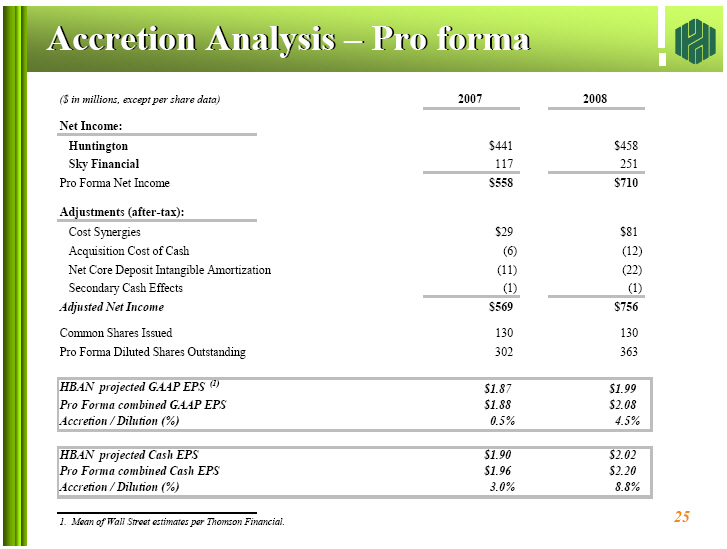
Accretion Analysis ~ Pro forma

($ in millions, except per share data)            2007         2008
                                                 -----------  ----------
Net Income:
- ------------------------------------------
Huntington                                         $441         $458
Sky Financial                                       117          251
                                                 -----------  ----------
Pro Forma Net Income                               $558         $710

Adjustments (after-tax):
- ------------------------------------------
Cost Synergies                                     $ 29         $81
Acquisition Cost of Cash                             (6)         (1)
Net Core Deposit Intangible Amortization            (11)         (2)
Secondary Cash Effects                               (1)         (1)
                                                 -----------  ----------
Adjusted Net Income                                $569         $756

Common Shares Issued                                130          130
Pro Forma Diluted Shares Outstanding                302          363
- ------------------------------------------------------------------------
HBAN projected GAAP EPS (1)                        $1.87        $1.99
Pro Forma combined GAAP EPS                        $1.88        $2.08
Accretion / Dilution (%)                            0.5%         4.%
- ------------------------------------------------------------------------
HBAN projected Cash EPS                            $1.90        $2.02
Pro Forma combined Cash EPS                        $1.96        $2.20
Accretion / Dilution (%)                            3.0%         8.%
- ------------------------------------------------------------------------

 1. Mean of Wall Street estimates per Thomson Financial.                    25
|
 |
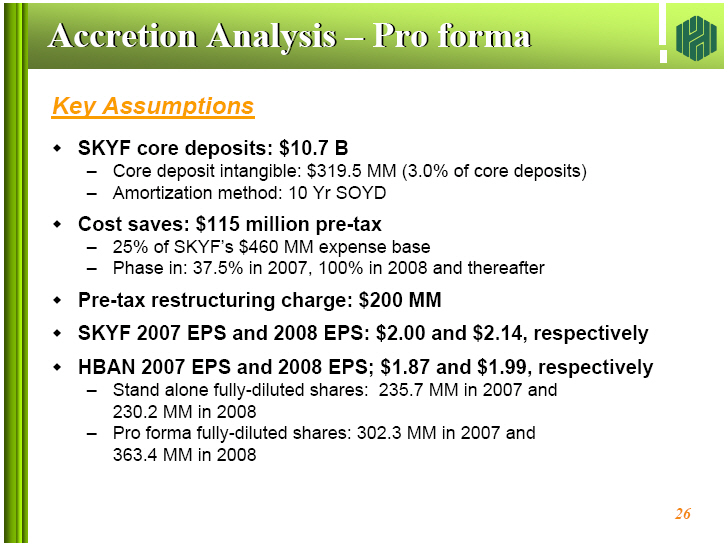
Accretion Analysis ~ Pro forma

Key Assumptions

o       SKYF core deposits: $10.7 B
        - Core deposit intangible: $319.5 MM (3.0% of core deposits)
        - Amortization method: 10 Yr SOYD

o       Cost saves: $115 million pre-tax
        - 25% of SKYF~s $460 MM expense base
        - Phase in: 37.5% in 2007, 100% in 2008 and thereafter

o       Pre-tax restructuring charge: $200 MM

o       SKYF 2007 EPS and 2008 EPS: $2.00 and $2.14, respectively

o       HBAN 2007 EPS and 2008 EPS; $1.87 and $1.99, respectively
        - Stand alone fully-diluted shares: 235.7 MM in 2007 and 230.2  MM in 2008
        - Pro forma fully-diluted shares: 302.3 MM in 2007 and 363.4  MM in 2008

                                                                             26
|
 |
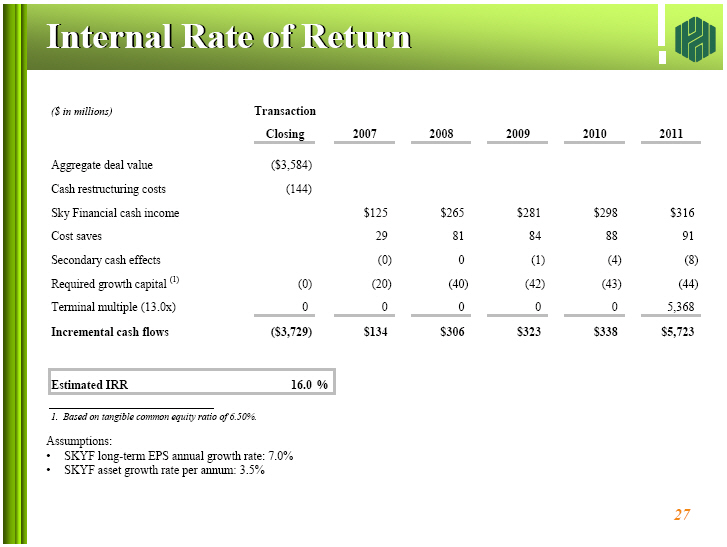
Internal Rate of Return

($ in millions)                    Transaction
                                    Closing        2007     2008      2009     2010     2011
                                   -----------------------------------------------------------
Aggregate deal value                ($ 3,584)
Cash restructuring costs                (144)
Sky Financial cash income                        $  125   $  265   $   281   $  298   $  316
Cost saves                                           29       81        84       88       91
Secondary cash effects                               (0)       0        (1)      (4)      (8)
Required growth capital (1)               (0)       (20)     (40)      (42)     (43)     (44)
Terminal multiple (13.0x)                  0          0        0         0        0    5,368
                                   -----------------------------------------------------------
Incremental cash flows              ($ 3,729)    $  134   $  306   $   323   $  338   $5,723

- -----------------------------------------------------------
Estimated IRR                                      16.0%
- -----------------------------------------------------------

1. Based on tangible common equity ratio of 6.50% .

Assumptions:

o       SKYF long-term EPS annual growth rate: 7.0%
o       SKYF asset growth rate per annum: 3.5%

                                                                             27
|
 |
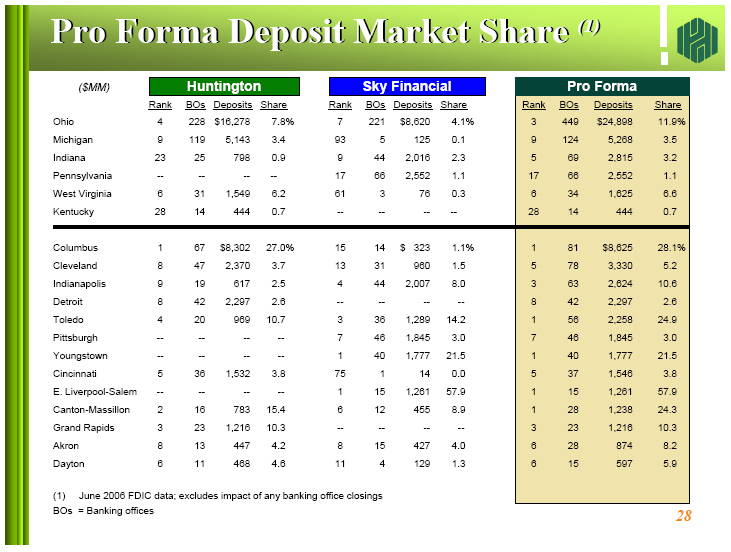
Pro Forma Deposit Market Share (1)

        ($MM)              Huntington                      Sky Financial                  Pro Forma

                    Rank  BOs  Deposits  Share    Rank  BOs  Deposits  Share    Rank   BOs    Deposits   Share
                    ----  ---  --------  -----    ----  ---  --------  -----    ----  -----  ----------  -----
Ohio                  4   228  $ 16,278   7.8%      7   221  $ 8,620   4.1%        3    449  $   24,898  11.9%
Michigan              9   119     5,143   3.4      93     5      125   0.1         9    124       5,268   3.5
Indiana              23    25       798   0.9       9    44    2,016   2.3         5     69       2,815   3.2
Pennsylvania         --    --        --    --      17    66    2,552   1.1        17     66       2,552   1.1
West Virginia         6    31     1,549   6.2      61     3       76   0.3         6     34       1,625   6.6
Kentucky             28    14       444   0.7      --    --       --   --         28     14         444   0.7
- ---------------------------------------------------------------------------------------------------------------
Columbus              1    67  $  8,302  27.0%     15    14  $   323   1.1%        1     81  $    8,625  28.1%
Cleveland             8    47     2,370   3.7      13    31      960   1.5         5     78       3,330   5.2
Indianapolis          9    19       617   2.5       4    44    2,007   8.0         3     63       2,624  10.6
Detroit               8    42     2,297   2.6      --    --       --    --         8     42       2,297   2.6
Toledo                4    20       969  10.7       3    36    1,289  14.2         1     56       2,258  24.9
Pittsburgh           --    --        --    --       7    46    1,845   3.0         7     46       1,845   3.0
Youngstown           --    --        --    --       1    40    1,777  21.5         1     40       1,777  21.5
Cincinnati            5    36     1,532   3.8      75     1       14   0.0         5     37       1,546   3.8
E. Liverpool-Salem   --    --        --    --       1    15    1,261  57.9         1     15       1,261  57.9
Canton-Massillon      2    16       783  15.4       6    12      455   8.9         1     28       1,238  24.3
Grand Rapids          3    23     1,216  10.3      --    --       --    --         3     23       1,216  10.3
Akron                 8    13       447   4.2       8    15      427   4.0         6     28         874   8.2
Dayton                6    11       468   4.6      11     4      129   1.3         6     15         597   5.9

(1) June 2006 FDIC data; excludes impact of any banking office
closings BOs = Banking offices

                                                                                                          28
|
 |
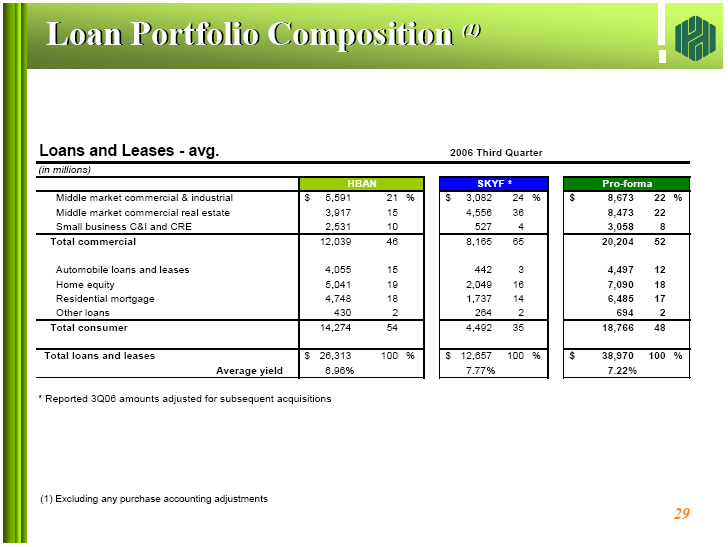
Loan Portfolio Composition (1)

Loans and Leases - avg.                                              2006 Third Quarter
- ----------------------------------------------------------------------------------------------------------------
(in millions)
- ----------------------------------------------------------------------------------------------------------------
                                             HBAN                      SKYF *                 Pro-forma
- ----------------------------------------------------------------------------------------------------------------
Middle market commercial & industrial  $    5,591      21%        $  3,082      24%        $     8,673      22%
Middle market commercial real estate        3,917      15            4,556      36               8,473      22
Small business C&I and CRE                  2,531      10              527       4               3,058       8
- ----------------------------------------------------------------------------------------------------------------
Total commercial                           12,039      46            8,165      65              20,204      52
Automobile loans and leases                 4,055      15              442       3               4,497      12
Home equity                                 5,041      19            2,049      16               7,090      18
Residential mortgage                        4,748      18            1,737      14               6,485      17
Other loans                                   430       2              264       2                 694       2
- ----------------------------------------------------------------------------------------------------------------
Total consumer                             14,274      54            4,492      35              18,766      48
- ----------------------------------------------------------------------------------------------------------------
Total loans and leases                 $   26,313     100%        $ 12,657     100%        $    38,970     100%
                        Average yield        6.96%                    7.77%                       7.22%
- ----------------------------------------------------------------------------------------------------------------

* Reported 3Q06 amounts adjusted for subsequent acquisitions

(1) Excluding any purchase accounting adjustments

                                                                                                              29
|
 |
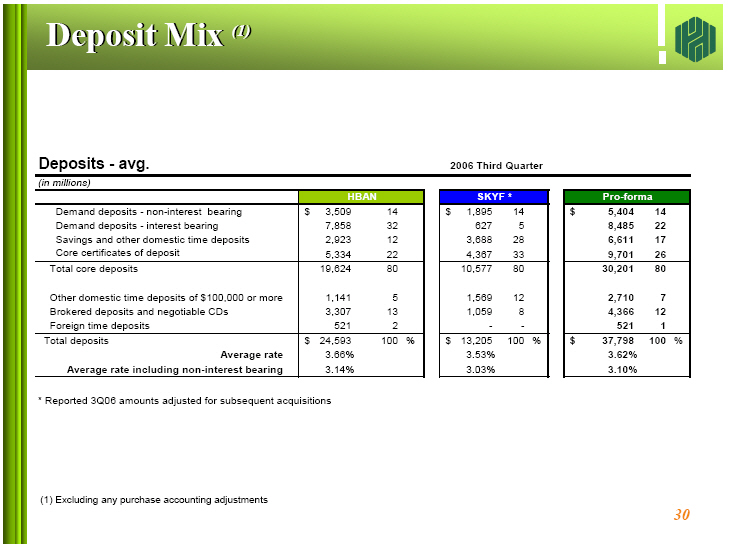
Deposit Mix (1)

Deposits - avg.                                                     2006 Third Quarter
- ----------------------------------------------------------------------------------------------------------------
(in millions)
- ----------------------------------------------------------------------------------------------------------------
                                                         HBAN                   SKYF *          Pro-forma
- ----------------------------------------------------------------------------------------------------------------
Demand deposits - non-interest bearing           $   3,509      14     $   1,895       14    $   5,404     14
Demand deposits - interest bearing                   7,858      32           627        5        8,485     22
Savings and other domestic time deposits             2,923      12         3,688       28        6,611     17
Core certificates of deposit                         5,334      22         4,367       33        9,701     26
- ----------------------------------------------------------------------------------------------------------------
Total core deposits                                 19,624      80        10,577       80       30,201     80
Other domestic time deposits of $100,000 or more     1,141       5         1,569       12        2,710      7
Brokered deposits and negotiable CDs                 3,307      13         1,059        8        4,366     12
Foreign time deposits                                  521       2             -        -          521      1
- ----------------------------------------------------------------------------------------------------------------
Total deposits                                   $  24,593     100%    $  13,205      100%   $  37,798    100%
Average rate                                          3.66%                 3.53%                 3.62%
Average rate including non-interest bearing           3.14%                 3.03%                 3.10%
- ----------------------------------------------------------------------------------------------------------------

* Reported 3Q06 amounts adjusted for subsequent acquisitions


(1) Excluding any purchase accounting adjustments

                                                                                                           30
|
 |
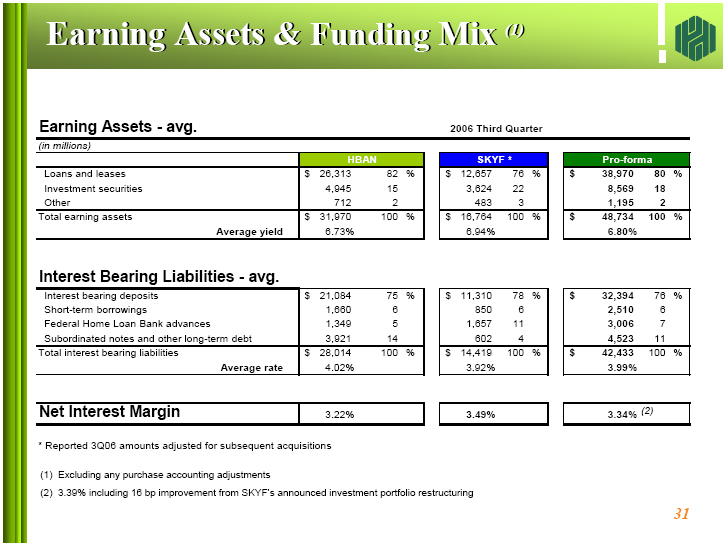
Earning Assets & Funding Mix (1)

Earning Assets - avg.                                              2006 Third Quarter
- --------------------------------------------------------------------------------------------------------------
(in millions)
- --------------------------------------------------------------------------------------------------------------
                                                    HBAN                  SKYF *                Pro-forma
- --------------------------------------------------------------------------------------------------------------
Loans and leases                              $   26,313      82%    $ 12,657      76%    $   38,970      80%
Investment securities                              4,945      15        3,624      22          8,569      18
Other                                                712       2          483       3          1,195       2
- --------------------------------------------------------------------------------------------------------------
Total earning assets                          $   31,970     100%    $ 16,764     100%    $   48,734     100%
                             Average yield          6.73%                6.94%                 6.80%
- --------------------------------------------------------------------------------------------------------------
Interest Bearing Liabilities - avg.
- --------------------------------------------------------------------------------------------------------------
Interest bearing deposits                     $   21,084      75%    $ 11,310      78%    $   32,394      76%
Short-term borrowings                              1,660       6          850       6          2,510       6
Federal Home Loan Bank advances                    1,349       5        1,657      11          3,006       7
Subordinated notes and other long-term debt        3,921      14          602       4          4,523      11
- --------------------------------------------------------------------------------------------------------------
Total interest bearing liabilities            $   28,014     100%    $ 14,419     100%    $   42,433     100%
                              Average rate          4.02%                3.92%                 3.99%
- --------------------------------------------------------------------------------------------------------------
Net Interest Margin                                 3.22%                3.49%                 3.34% (2)
- --------------------------------------------------------------------------------------------------------------

*       Reported 3Q06 amounts adjusted for subsequent acquisitions

(1)     Excluding any purchase accounting adjustments
(2)     3.39% including 16 bp improvement from SKYF~s announced investment portfolio restructuring

                                                                                                         31
|
 |
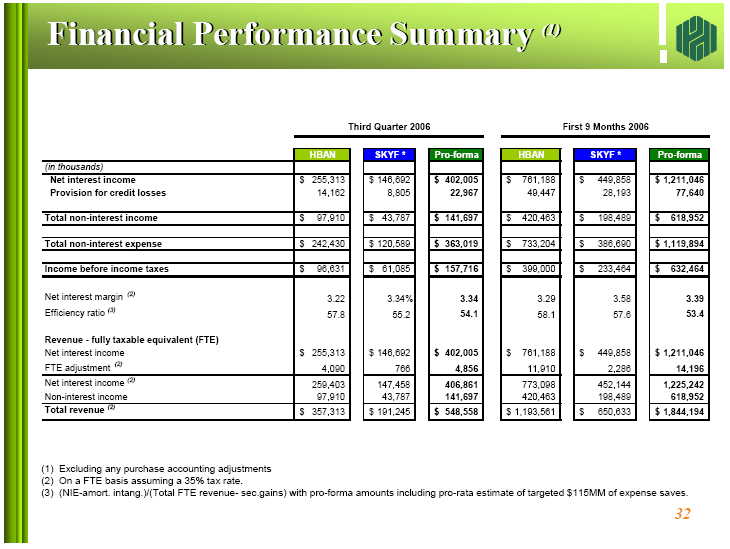
Financial Performance Summary (1)

                                                         Third
                                                        Quarter                      First 9 Months
                                                         2006                             2006
                                          ------------------------------------------------------------------
                                            HBAN     SKYF *   Pro-forma     HBAN       SKYF *    Pro-forma
- ------------------------------------------------------------------------------------------------------------
(in thousands)
- ------------------------------------------------------------------------------------------------------------
Net interest income                       $255,313  $146,692   $402,005  $  761,188  $449,858  $1,211,046
Provision for credit losses                 14,162     8,805     22,967      49,447    28,193      77,640
- ------------------------------------------------------------------------------------------------------------
Total non-interest income                 $ 97,910  $ 43,787   $141,697  $  420,463  $198,489  $  618,952
- ------------------------------------------------------------------------------------------------------------
Total non-interest expense                $242,430  $120,589   $363,019  $  733,204  $386,690  $1,119,894
- ------------------------------------------------------------------------------------------------------------
Income before income taxes                $ 96,631  $ 61,085   $157,716  $  399,000  $233,464  $  632,464
- ------------------------------------------------------------------------------------------------------------
Net interest margin (2)                       3.22      3.34%      3.34        3.29      3.58        3.39
Efficiency ratio (3)                          57.8      55.2       54.1        58.1      57.6        53.4
Revenue - fully taxable equivalent (FTE)
Net interest income                       $255,313  $146,692   $402,005  $  761,188  $449,858  $1,211,046
FTE adjustment (2)                           4,090       766      4,856      11,910     2,286      14,196
- ------------------------------------------------------------------------------------------------------------
Net interest income (2)                    259,403   147,458    406,861     773,098   452,144   1,225,242
Non-interest income                         97,910    43,787    141,697     420,463   198,489     618,952
- ------------------------------------------------------------------------------------------------------------
Total revenue (2)                         $357,313  $191,245   $548,558  $1,193,561  $650,633  $1,844,194
- ------------------------------------------------------------------------------------------------------------

(1)  Excluding any purchase accounting adjustments
(2)  On a FTE basis assuming a 35% tax rate.
(3)  (NIE-amort. intang.)/(Total FTE revenue- sec.gains) with pro-forma amounts including pro-rata estimate
     of targeted $115MM of expense saves.
                                                                                                        32
|
 |
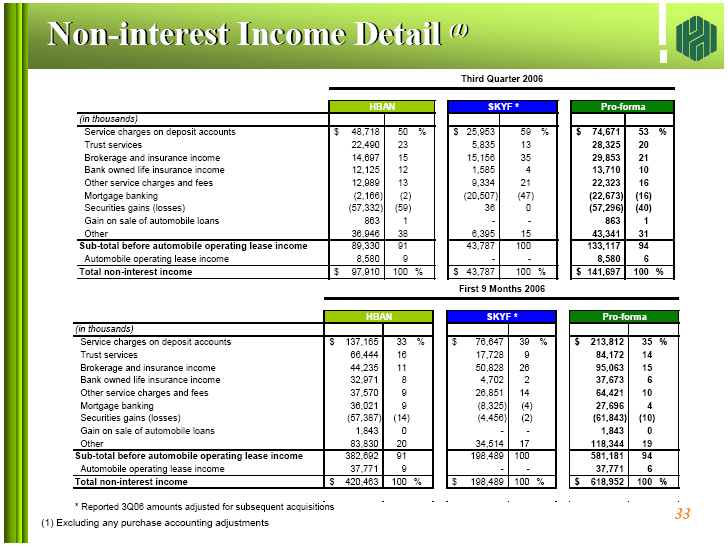
Non-interest Income Detail (1)

                                                                         Third Quarter 2006
                                                      ---------------------------------------------------------
                                                            HBAN               SKYF *           Pro-forma
- ---------------------------------------------------------------------------------------------------------------
(in thousands)
- ---------------------------------------------------------------------------------------------------------------
Service charges on deposit accounts                   $ 48,718   50%     $  25,953    59%    $  74,671    53%
Trust services                                          22,490   23          5,835    13        28,325    20
Brokerage and insurance income                          14,697   15         15,156    35        29,853    21
Bank owned life insurance income                        12,125   12          1,585     4        13,710    10
Other service charges and fees                          12,989   13          9,334    21        22,323    16
Mortgage banking                                        (2,166)  (2)       (20,507)  (47)      (22,673)  (16)
Securities gains (losses)                              (57,332) (59)            36     0       (57,296)  (40)
Gain on sale of automobile loans                           863    1              -     -           863     1
Other                                                   36,946   38          6,395    15        43,341    31
- ---------------------------------------------------------------------------------------------------------------
Sub-total before automobile operating lease income      89,330   91         43,787   100       133,117    94
Automobile operating lease income                        8,580    9              -     -         8,580     6
- ---------------------------------------------------------------------------------------------------------------
Total non-interest income                             $ 97,910  100%     $  43,787   100%     $141,697   100%
- ---------------------------------------------------------------------------------------------------------------
                                                                           First 9 Months 2006
                                                      ---------------------------------------------------------
                                                               HBAN               SKYF *           Pro-forma
- ---------------------------------------------------------------------------------------------------------------
(in thousands)
- ---------------------------------------------------------------------------------------------------------------
Service charges on deposit accounts                   $137,165   33%      $ 76,647    39%     $213,812    35%
Trust services                                          66,444   16         17,728     9        84,172    14
Brokerage and insurance income                          44,235   11         50,828    26        95,063    15
Bank owned life insurance income                        32,971    8          4,702     2        37,673     6
Other service charges and fees                          37,570    9         26,851    14        64,421    10
Mortgage banking                                        36,021    9         (8,325)   (4)       27,696     4
Securities gains (losses)                              (57,387) (14)        (4,456)   (2)      (61,843)  (10)
Gain on sale of automobile loans                         1,843    0              -     -         1,843     0
Other                                                   83,830   20         34,514    17       118,344    19
- ---------------------------------------------------------------------------------------------------------------
Sub-total before automobile operating lease income     382,692   91        198,489   100       581,181    94
Automobile operating lease income                       37,771    9              -     -        37,771     6
- ---------------------------------------------------------------------------------------------------------------
Total non-interest income                             $420,463  100%      $198,489   100%     $618,952   100%
- ---------------------------------------------------------------------------------------------------------------

        * Reported 3Q06 amounts adjusted for subsequent acquisitions

(1) Excluding any purchase accounting adjustments                                                           33
|
 |
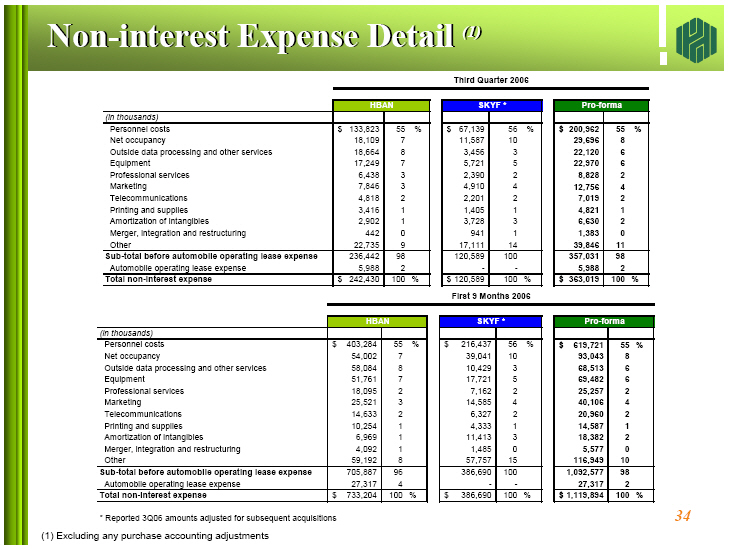
Non-interest Expense Detail (1)

                                                                        Third Quarter 2006
                                                     ----------------------------------------------------
                                                             HBAN         SKYF *             Pro-forma
- ---------------------------------------------------------------------------------------------------------
(in thousands)
- ---------------------------------------------------------------------------------------------------------
Personnel costs                                      $133,823  55%  $ 67,139  56%   $  200,962       55%
Net occupancy                                          18,109   7     11,587  10        29,696        8
Outside data processing and other services             18,664   8      3,456   3        22,120        6
Equipment                                              17,249   7      5,721   5        22,970        6
Professional services                                   6,438   3      2,390   2         8,828        2
Marketing                                               7,846   3      4,910   4         2,756        4
Telecommunications                                      4,818   2      2,201   2         7,019        2
Printing and supplies                                   3,416   1      1,405   1         4,821        1
Amortization of intangibles                             2,902   1      3,728   3         6,630        2
Merger, integration and restructuring                     442   0        941   1         1,383        0
Other                                                  22,735   9     17,111  14        39,846       11
- ---------------------------------------------------------------------------------------------------------
Sub-total before automobile operating lease expense   236,442  98    120,589 100       357,031       98
Automobile operating lease expense                      5,988   2          -   -         5,988        2
- ---------------------------------------------------------------------------------------------------------
Total non-interest expense                           $242,430 100%  $120,589 100%   $  363,019      100%
- ---------------------------------------------------------------------------------------------------------

                                                                       First 9 Monhs 2006
                                                     ----------------------------------------------------
                                                          HBAN         SKYF *             Pro-forma
- ---------------------------------------------------------------------------------------------------------
                      (in thousands)
- ---------------------------------------------------------------------------------------------------------
Personnel costs                                      $403,284  55%  $216,437  56%   $  619,721      55%
Net occupancy                                          54,002   7     39,041  10        93,043       8
Outside data processing and other services             58,084   8     10,429   3        68,513       6
Equipment                                              51,761   7     17,721   5        69,482       6
Professional services                                  18,095   2      7,162   2        25,257       2
Marketing                                              25,521   3     14,585   4        40,106       4
Telecommunications                                     14,633   2      6,327   2        20,960       2
Printing and supplies                                  10,254   1      4,333   1        14,587       1
Amortization of intangibles                             6,969   1     11,413   3        18,382       2
Merger, integration and restructuring                   4,092   1      1,485   0         5,577       0
Other                                                  59,192   8     57,757  15       116,949      10
- ---------------------------------------------------------------------------------------------------------
Sub-total before automobile operating lease expense   705,887  96    386,690 100     1,092,577      98
Automobile operating lease expense                     27,317   4          -   -        27,317       2
- ---------------------------------------------------------------------------------------------------------
Total non-interest expense                           $733,204 100%  $386,690 100%   $1,119,894     100%
- ---------------------------------------------------------------------------------------------------------

        * Reported 3Q06 amounts adjusted for subsequent acquisitions

(1) Excluding any purchase accounting adjustments                                                             34
|
 |
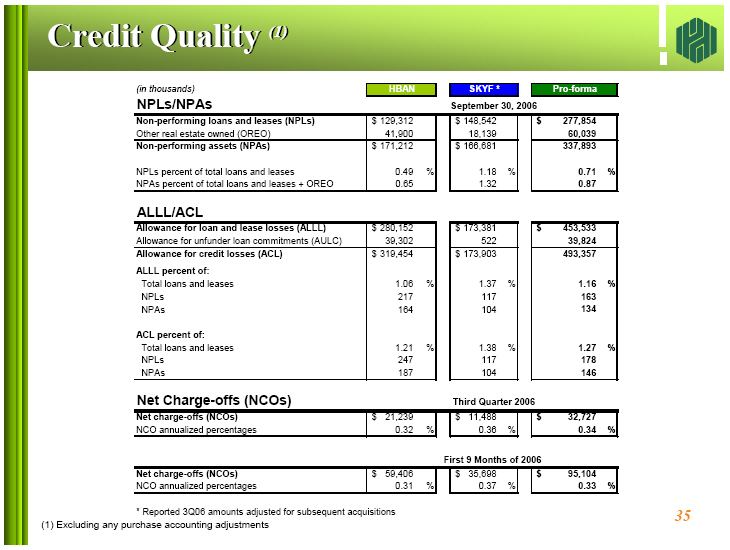
Credit Quality (1)

                                                           -----------------------------------------------
(in thousands)                                                 HBAN         SKYF *     Pro-forma
                                                           -----------------------------------------------
NPLs/NPAs                                                               September 30, 2006
- ----------------------------------------------------------------------------------------------------------
Non-performing loans and leases (NPLs)                     $129,312       $148,542      $277,854
Other real estate owned (OREO)                               41,900         18,139        60,039
- ----------------------------------------------------------------------------------------------------------
Non-performing assets (NPAs)                               $171,212       $166,681       337,893
NPLs percent of total loans and leases                         0.49%          1.18%         0.71%
NPAs percent of total loans and leases + OREO                  0.65           1.32          0.87
- ----------------------------------------------------------------------------------------------------------
ALLL/ACL
- ----------------------------------------------------------------------------------------------------------
Allowance for loan and lease losses (ALLL)                 $280,152       $173,381      $453,533
Allowance for unfunder loan commitments (AULC)               39,302            522        39,824
- ----------------------------------------------------------------------------------------------------------
Allowance for credit losses (ACL)                          $319,454       $173,903       493,357
ALLL percent of:
Total loans and leases                                         1.06%          1.37%         1.16%
NPLs                                                            217            117           163
NPAs                                                            164            104           134
ACL percent of:
Total loans and leases                                         1.21%          1.38%         1.27%
NPLs                                                            247            117           178
NPAs                                                            187            104           146
- ----------------------------------------------------------------------------------------------------------
Net Charge-offs (NCOs)                                               Third Quarter 2006
- ----------------------------------------------------------------------------------------------------------
Net charge-offs (NCOs)                                     $ 21,239       $ 11,488      $ 32,727
NCO annualized percentages                                     0.32%          0.36%         0.34%
- ----------------------------------------------------------------------------------------------------------
                                                                    First 9 Months of 2006
- ----------------------------------------------------------------------------------------------------------
Net charge-offs (NCOs)                                     $ 59,406       $ 35,698      $ 95,104
NCO annualized percentages                                     0.31%          0.37%         0.33%
- ----------------------------------------------------------------------------------------------------------

        * Reported 3Q06 amounts adjusted for subsequent acquisitions
(1) Excluding any purchase accounting adjustments
                                                                                                           35
|
 |