EX-99.1
Published on April 17, 2024

Internal Use Welcome.® 2024 Annual Shareholders’ Meeting April 17, 2024 The Huntington National Bank is Member FDIC. ®, Huntington® and Huntington. Welcome.® are federally registered service marks of Huntington Bancshares Incorporated. ©2024 Huntington Bancshares Incorporated.
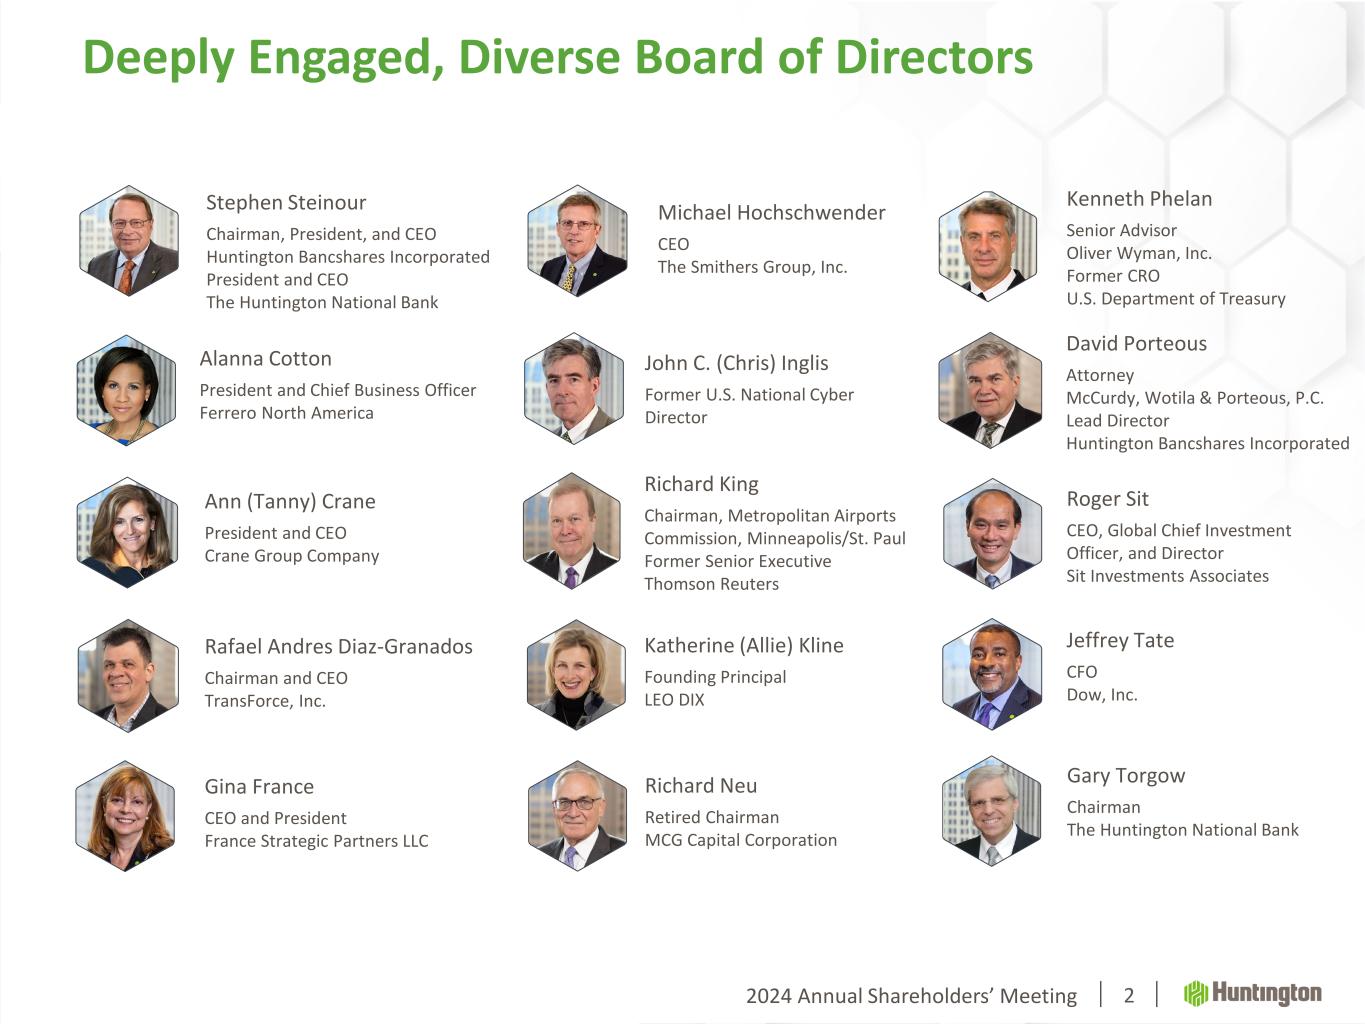
2024 Annual Shareholders’ Meeting 2 Deeply Engaged, Diverse Board of Directors Stephen Steinour Chairman, President, and CEO Huntington Bancshares Incorporated President and CEO The Huntington National Bank Ann (Tanny) Crane President and CEO Crane Group Company Gina France CEO and President France Strategic Partners LLC Katherine (Allie) Kline Founding Principal LEO DIX Kenneth Phelan Senior Advisor Oliver Wyman, Inc. Former CRO U.S. Department of Treasury Michael Hochschwender CEO The Smithers Group, Inc. Richard Neu Retired Chairman MCG Capital Corporation David Porteous Attorney McCurdy, Wotila & Porteous, P.C. Lead Director Huntington Bancshares Incorporated Alanna Cotton President and Chief Business Officer Ferrero North America Richard King Chairman, Metropolitan Airports Commission, Minneapolis/St. Paul Former Senior Executive Thomson Reuters Roger Sit CEO, Global Chief Investment Officer, and Director Sit Investments Associates Gary Torgow Chairman The Huntington National Bank Jeffrey Tate CFO Dow, Inc. Rafael Andres Diaz-Granados Chairman and CEO TransForce, Inc. John C. (Chris) Inglis Former U.S. National Cyber Director

2024 Annual Shareholders’ Meeting 3 Welcome.®
2024 Annual Shareholders’ Meeting 4 Disclaimer CAUTION REGARDING FORWARD-LOOKING STATEMENTS The information contained or incorporated by reference in this presentation contains certain forward-looking statements, including, but not limited to, certain plans, expectations, goals, projections, and statements, which are not historical facts and are subject to numerous assumptions, risks, and uncertainties. Statements that do not describe historical or current facts, including statements about beliefs and expectations, are forward-looking statements. Forward-looking statements may be identified by words such as expect, anticipate, believe, intend, estimate, plan, target, goal, or similar expressions, or future or conditional verbs such as will, may, might, should, would, could, or similar variations. The forward-looking statements are intended to be subject to the safe harbor provided by Section 27A of the Securities Act of 1933, Section 21E of the Securities Exchange Act of 1934, and the Private Securities Litigation Reform Act of 1995. While there is no assurance that any list of risks and uncertainties or risk factors is complete, below are certain factors which could cause actual results to differ materially from those contained or implied in the forward-looking statements: changes in general economic, political, or industry conditions; deterioration in business and economic conditions, including persistent inflation, supply chain issues or labor shortages, instability in global economic conditions and geopolitical matters, as well as volatility in financial markets; the impact of pandemics, including the COVID-19 pandemic and related variants and mutations, and their impact on the global economy and financial market conditions and our business, results of operations, and financial condition; the impacts related to or resulting from recent bank failures and other volatility, including potential increased regulatory requirements and costs, such as FDIC special assessments, long-term debt requirements and heightened capital requirements, and potential impacts to macroeconomic conditions, which could affect the ability of depository institutions, including us, to attract and retain depositors and to borrow or raise capital; unexpected outflows of uninsured deposits which may require us to sell investment securities at a loss; rising interest rates which could negatively impact the value of our portfolio of investment securities; the loss of value of our investment portfolio which could negatively impact market perceptions of us and could lead to deposit withdrawals; the effects of social media on market perceptions of us and banks generally; cybersecurity risks; uncertainty in U.S. fiscal and monetary policy, including the interest rate policies of the Federal Reserve; volatility and disruptions in global capital and credit markets; movements in interest rates; competitive pressures on product pricing and services; success, impact, and timing of our business strategies, including market acceptance of any new products or services including those implementing our “Fair Play” banking philosophy; the nature, extent, timing, and results of governmental actions, examinations, reviews, reforms, regulations, and interpretations, including those related to the Dodd-Frank Wall Street Reform and Consumer Protection Act and the Basel III regulatory capital reforms, as well as those involving the OCC, Federal Reserve, FDIC, and CFPB; and other factors that may affect the future results of Huntington. Additional factors that could cause results to differ materially from those described above can be found in Huntington’s Annual Report on Form 10-K for the year ended December 31, 2023, which is on file with the Securities and Exchange Commission (the “SEC”) and available in the “Investor Relations” section of Huntington’s website http://www.huntington.com, under the heading “Publications and Filings” and in other documents Huntington files with the SEC. All forward-looking statements speak only as of the date they are made and are based on information available at that time. Huntington does not assume any obligation to update forward-looking statements to reflect circumstances or events that occur after the date the forward-looking statements were made or to reflect the occurrence of unanticipated events except as required by federal securities laws. As forward-looking statements involve significant risks and uncertainties, caution should be exercised against placing undue reliance on such statements.

Chairman’s Presentation: Discussion Topics 2023 Year in Review Business / Strategy Update
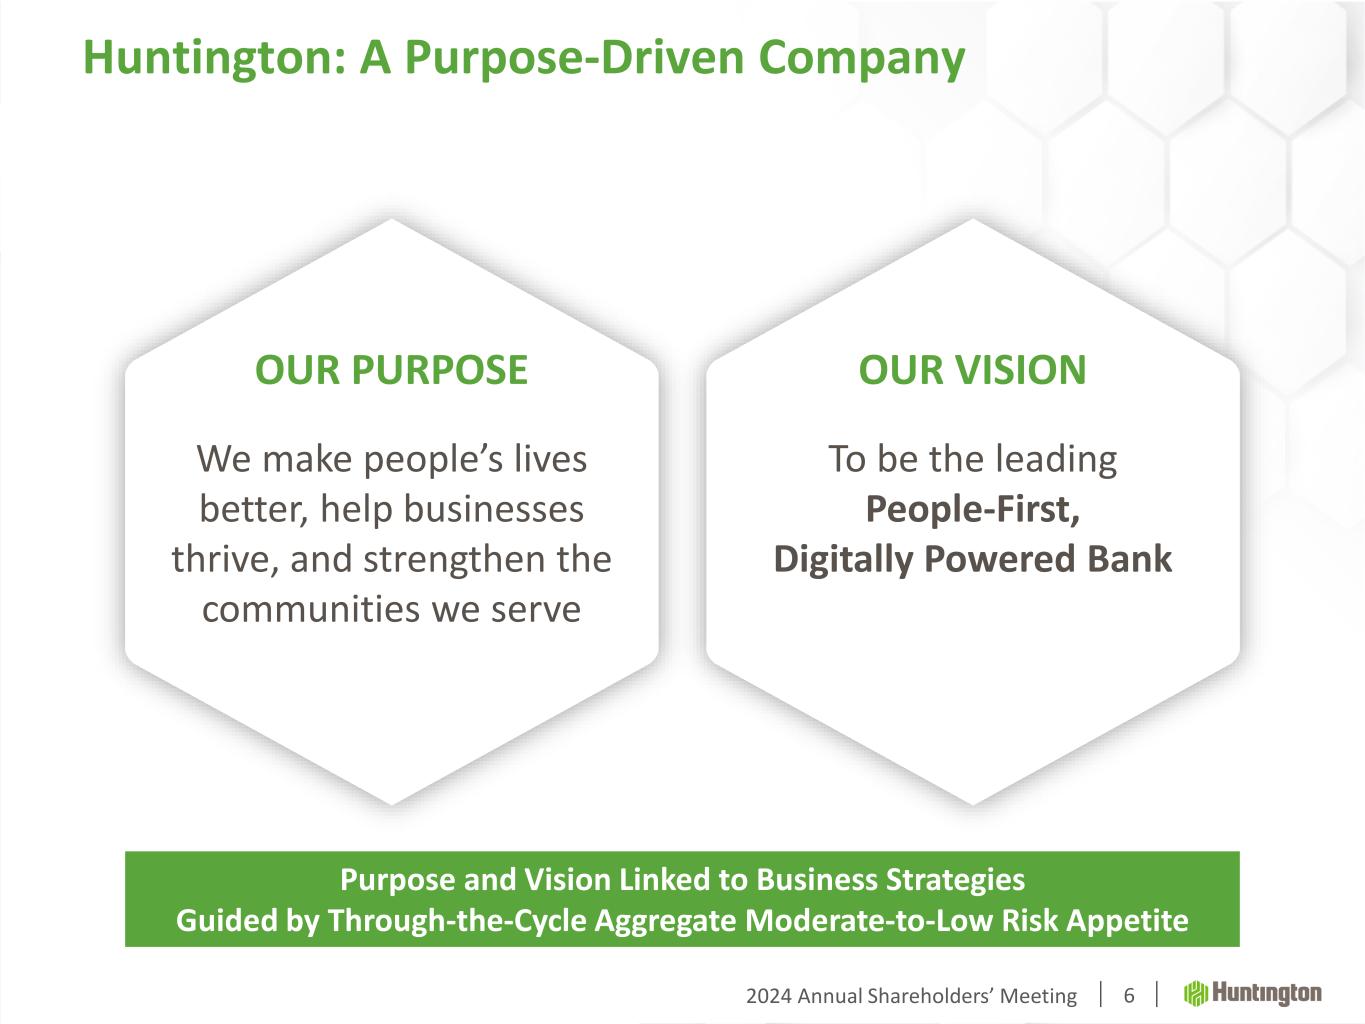
2024 Annual Shareholders’ Meeting 6 OUR PURPOSE We make people’s lives better, help businesses thrive, and strengthen the communities we serve OUR VISION To be the leading People-First, Digitally Powered Bank Purpose and Vision Linked to Business Strategies Guided by Through-the-Cycle Aggregate Moderate-to-Low Risk Appetite Huntington: A Purpose-Driven Company
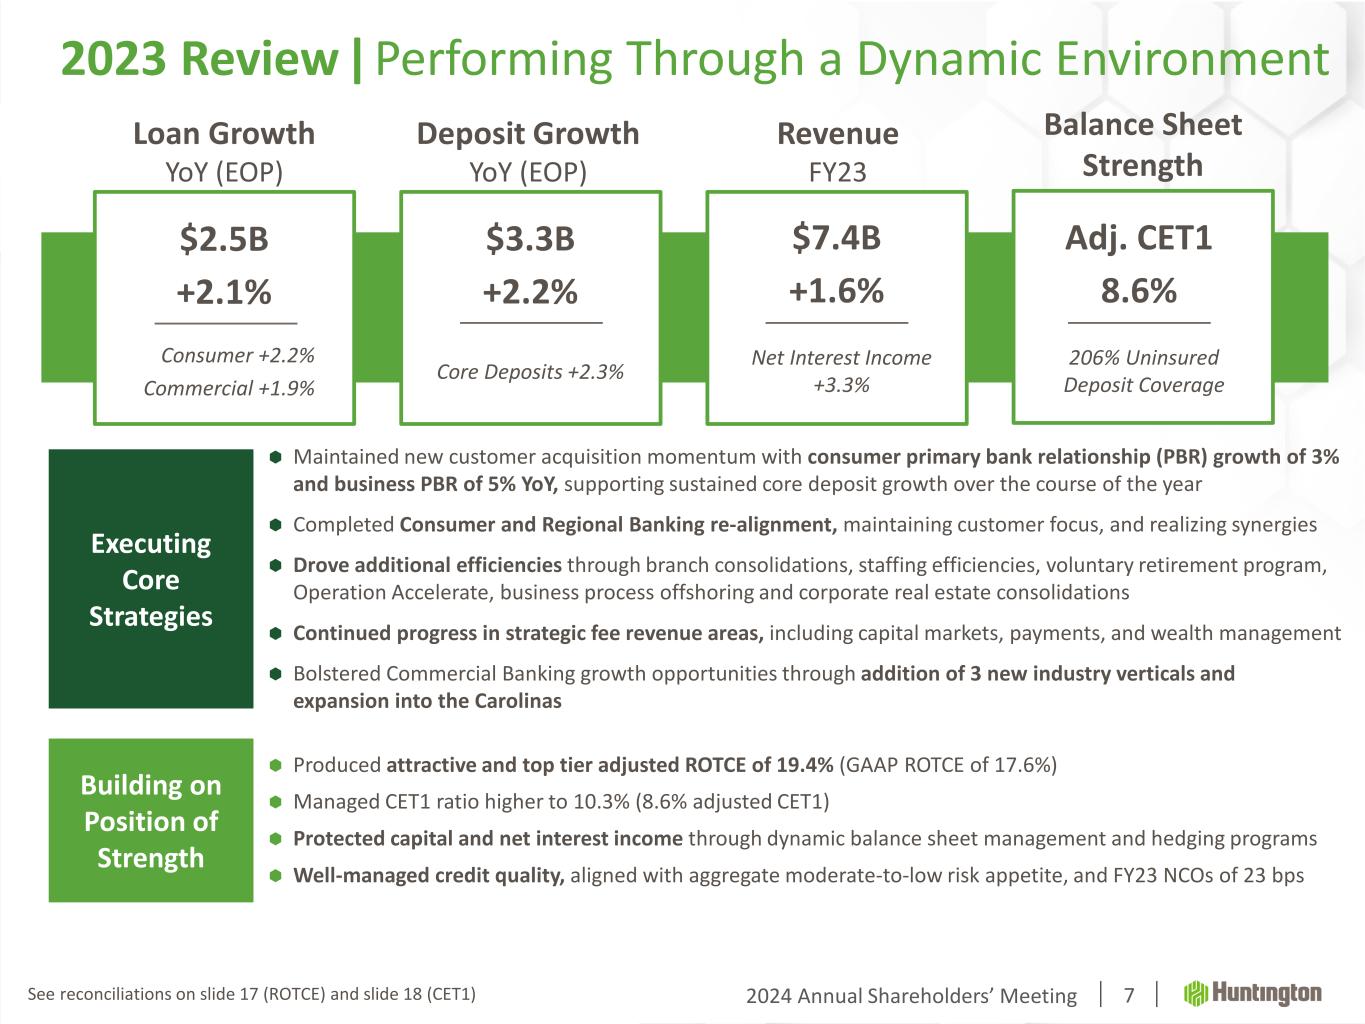
2024 Annual Shareholders’ Meeting 7 2023 Review | Performing Through a Dynamic Environment Executing Core Strategies Building on Position of Strength Maintained new customer acquisition momentum with consumer primary bank relationship (PBR) growth of 3% and business PBR of 5% YoY, supporting sustained core deposit growth over the course of the year Completed Consumer and Regional Banking re-alignment, maintaining customer focus, and realizing synergies Drove additional efficiencies through branch consolidations, staffing efficiencies, voluntary retirement program, Operation Accelerate, business process offshoring and corporate real estate consolidations Continued progress in strategic fee revenue areas, including capital markets, payments, and wealth management Bolstered Commercial Banking growth opportunities through addition of 3 new industry verticals and expansion into the Carolinas Produced attractive and top tier adjusted ROTCE of 19.4% (GAAP ROTCE of 17.6%) Managed CET1 ratio higher to 10.3% (8.6% adjusted CET1) Protected capital and net interest income through dynamic balance sheet management and hedging programs Well-managed credit quality, aligned with aggregate moderate-to-low risk appetite, and FY23 NCOs of 23 bps Loan Growth YoY (EOP) Consumer +2.2% Commercial +1.9% $2.5B +2.1% Deposit Growth YoY (EOP) $3.3B +2.2% Core Deposits +2.3% Revenue FY23 $7.4B +1.6% Net Interest Income +3.3% Balance Sheet Strength See reconciliations on slide 17 (ROTCE) and slide 18 (CET1) Adj. CET1 8.6% 206% Uninsured Deposit Coverage
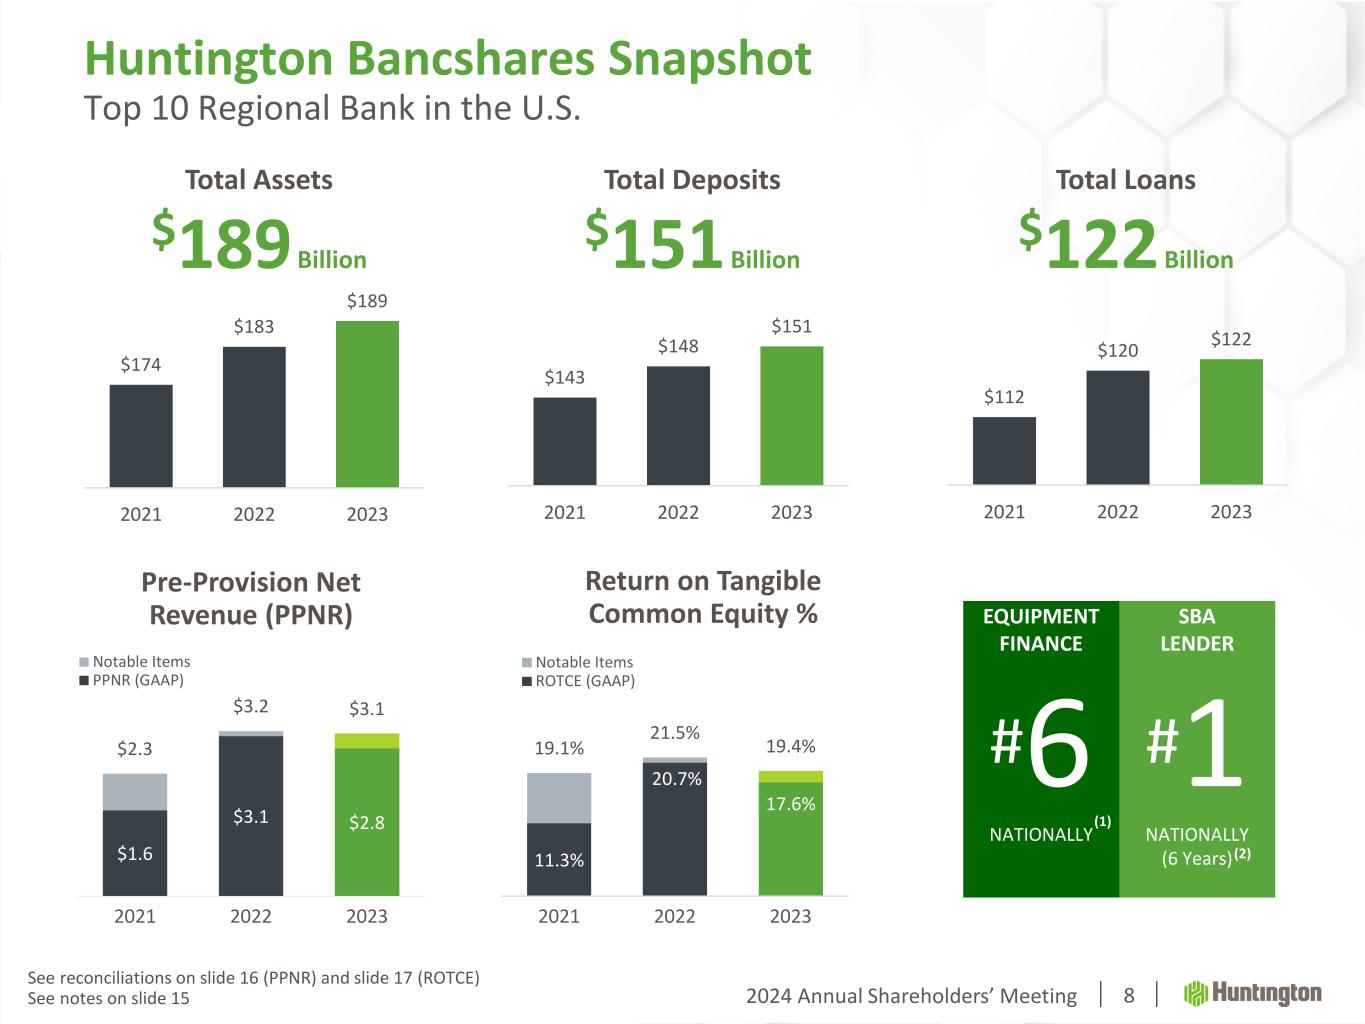
2024 Annual Shareholders’ Meeting 8 $174 $183 $189 2021 2022 2023 $143 $148 $151 2021 2022 2023 Total Assets $189 Billion Total Loans $122 Billion Total Deposits $151 Billion EQUIPMENT FINANCE SBA LENDER #6 #1 NATIONALLY NATIONALLY (6 Years) $112 $120 $122 2021 2022 2023 Huntington Bancshares Snapshot Top 10 Regional Bank in the U.S. (1) (2)11.3% 20.7% 17.6% 19.1% 21.5% 19.4% 2021 2022 2023 Notable Items ROTCE (GAAP) Return on Tangible Common Equity % Pre-Provision Net Revenue (PPNR) $1.6 $3.1 $2.8 $2.3 $3.2 $3.1 0.0 0 0.5 0 1.0 0 1.5 0 2.0 0 2.5 0 3.0 0 3.5 0 4.0 0 2021 2022 2023 Notable Items PPNR (GAAP) See reconciliations on slide 16 (PPNR) and slide 17 (ROTCE) See notes on slide 15
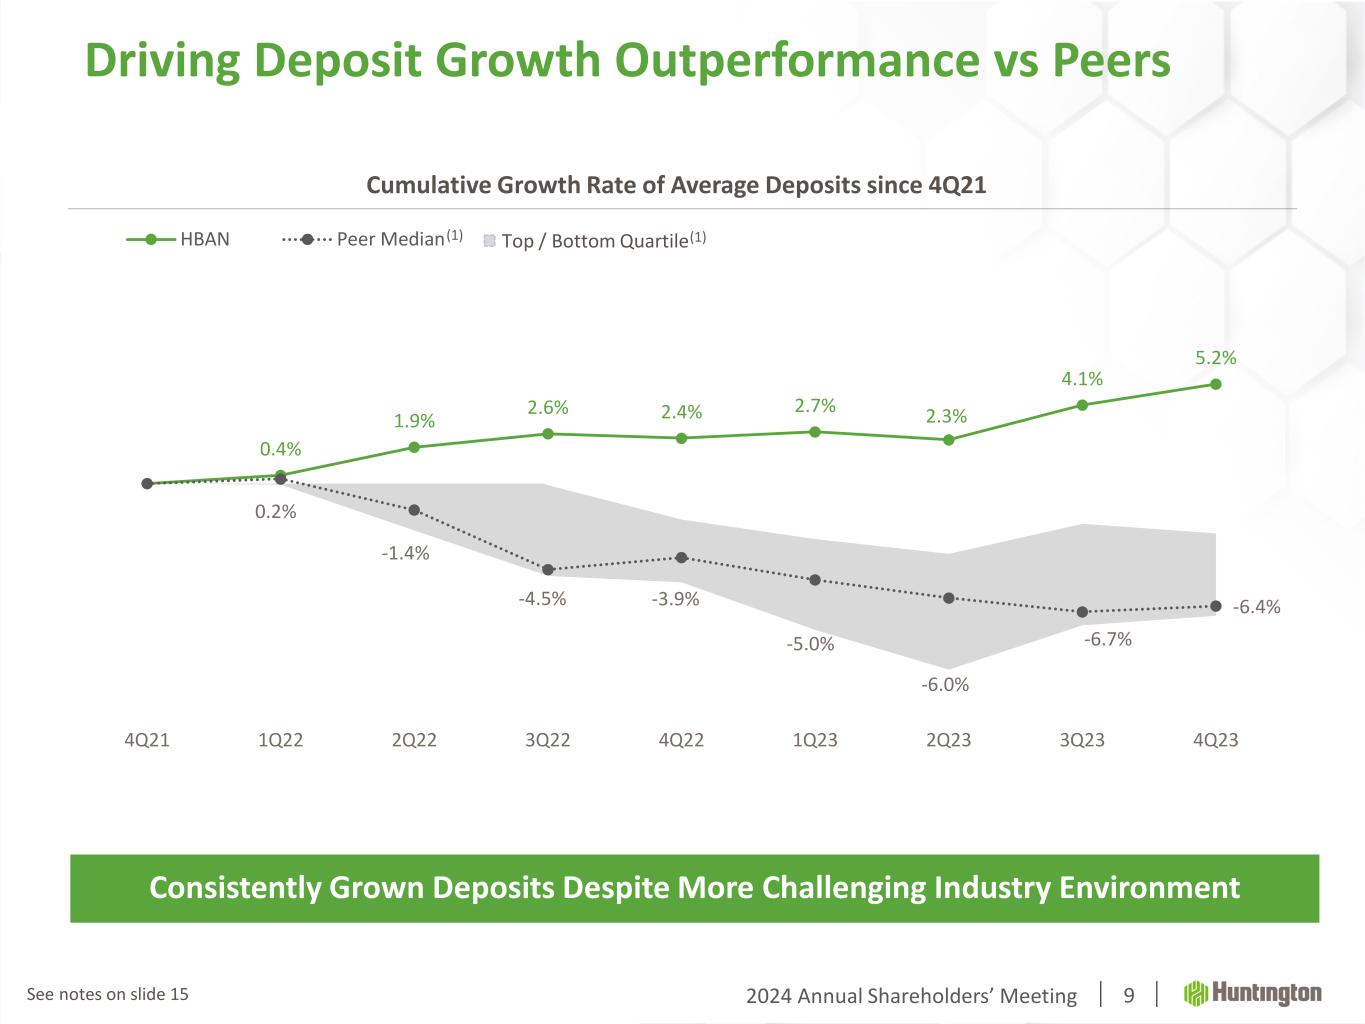
2024 Annual Shareholders’ Meeting 9 Driving Deposit Growth Outperformance vs Peers 0.4% 1.9% 2.6% 2.4% 2.7% 2.3% 4.1% 5.2% 0.2% -1.4% -4.5% -3.9% -5.0% -6.0% -6.7% -6.4% 4Q21 1Q22 2Q22 3Q22 4Q22 1Q23 2Q23 3Q23 4Q23 HBAN Peer Median(1) Cumulative Growth Rate of Average Deposits since 4Q21 Top / Bottom Quartile(1) Consistently Grown Deposits Despite More Challenging Industry Environment See notes on slide 15
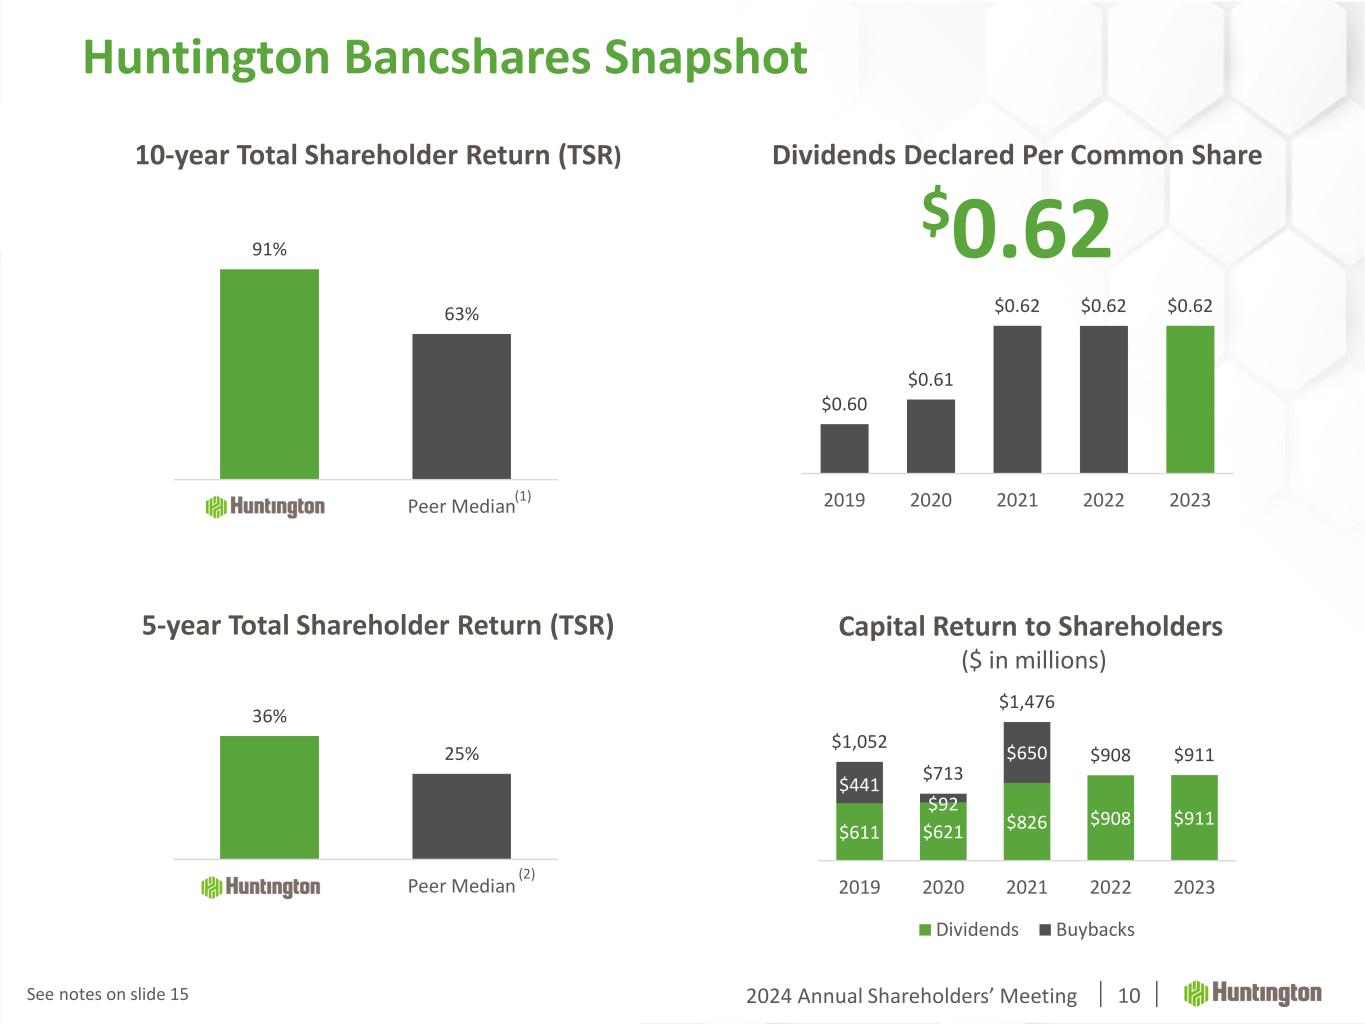
2024 Annual Shareholders’ Meeting 5-year Total Shareholder Return (TSR) 36% 25% HBAN Peer Median (2) Capital Return to Shareholders ($ in millions) $611 $621 $826 $908 $911 $441 $92 $650$1,052 $713 $1,476 $908 $911 2019 2020 2021 2022 2023 Dividends Buybacks Dividends Declared Per Common Share $0.62 $0.60 $0.61 $0.62 $0.62 $0.62 2019 2020 2021 2022 2023 10-year Total Shareholder Return (TSR) Huntington Bancshares Snapshot 10 91% 63% HBAN Peer Median(1) See notes on slide 15
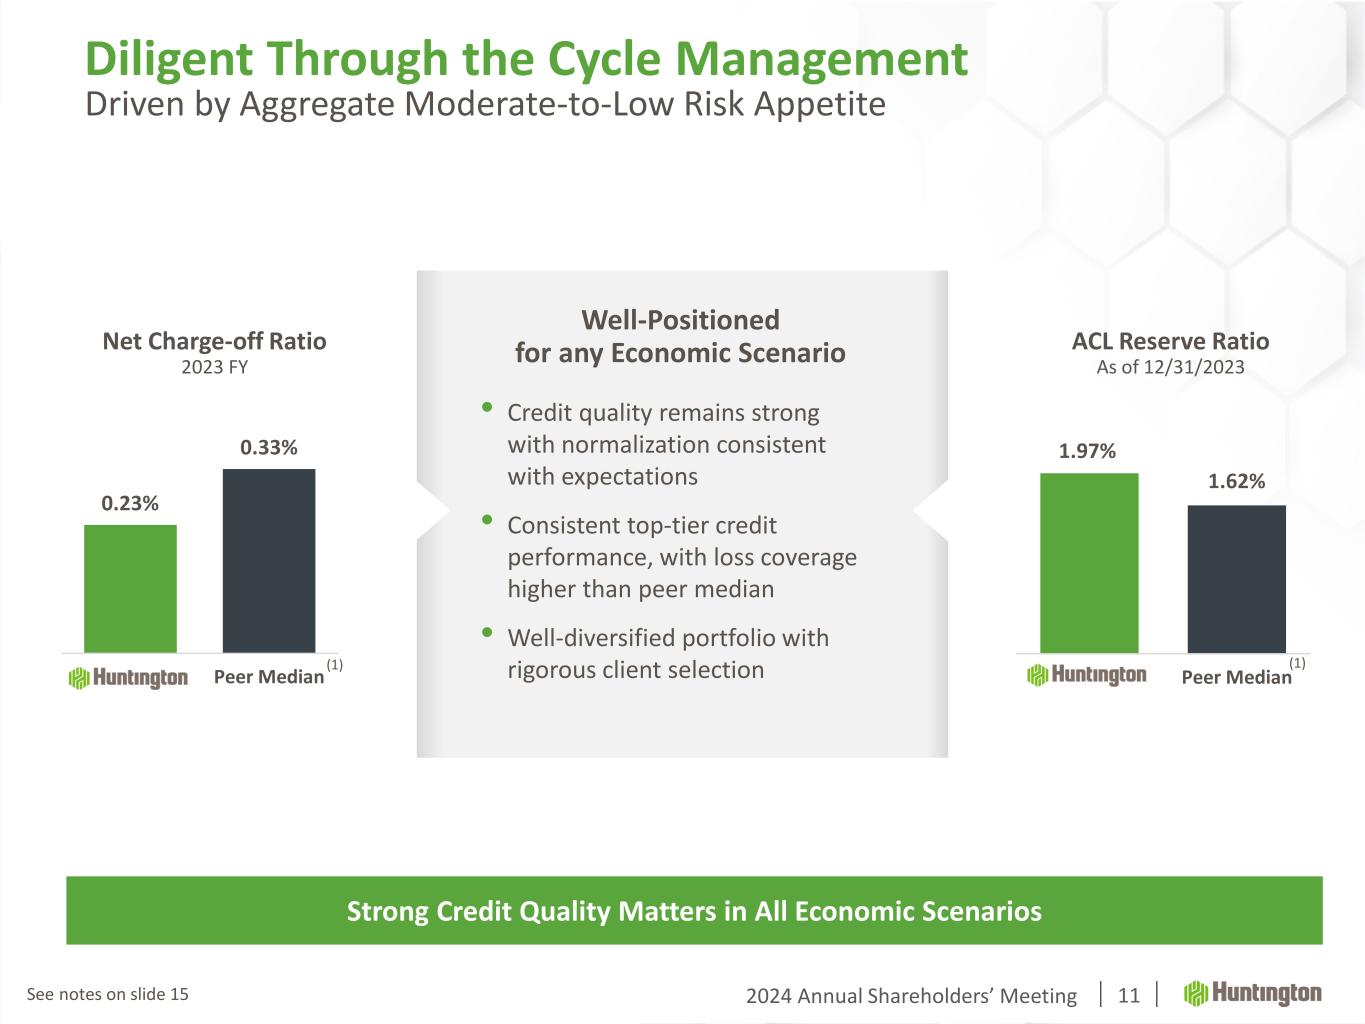
2024 Annual Shareholders’ Meeting 11 Diligent Through the Cycle Management 0.23% 0.33% HBAN Peer Median Net Charge-off Ratio 2023 FY ACL Reserve Ratio As of 12/31/2023 1.97% 1.62% HBAN Peer Median • Credit quality remains strong with normalization consistent with expectations • Consistent top-tier credit performance, with loss coverage higher than peer median • Well-diversified portfolio with rigorous client selection Well-Positioned for any Economic Scenario Strong Credit Quality Matters in All Economic Scenarios Driven by Aggregate Moderate-to-Low Risk Appetite (1) (1) See notes on slide 15
2024 Annual Shareholders’ Meeting 12 First Quarter 2024 Earnings Call Friday, April 19, 2024 8:00 a.m. ET Huntington’s management will host an earnings conference call the same day at 8:00 a.m. ET. The call, along with slides, may be accessed via a live Internet webcast in the Investor Relations section of Huntington’s website or through a dial-in telephone number at (877) 407-8029 conference ID #13744899.
2024 Annual Shareholders’ Meeting 13 Use of Non-GAAP Financial Measures This document contains GAAP financial measures and non-GAAP financial measures where management believes it to be helpful in understanding Huntington’s results of operations or financial position. Where non-GAAP financial measures are used, the comparable GAAP financial measure, as well as the reconciliation to the comparable GAAP financial measure, can be found in this document, conference call slides, or the Form 8-K related to this document, all of which can be found in the Investor Relations section of Huntington’s website, http://www.huntington.com. Annualized Data Certain returns, yields, performance ratios, or quarterly growth rates are presented on an “annualized” basis. This is done for analytical and decision-making purposes to better discern underlying performance trends when compared to full-year or year-over- year amounts. For example, loan and deposit growth rates, as well as net charge-off percentages, are most often expressed in terms of an annual rate like 8%. As such, a 2% growth rate for a quarter would represent an annualized 8% growth rate. Fully-Taxable Equivalent Interest Income and Net Interest Margin Income from tax-exempt earning assets is increased by an amount equivalent to the taxes that would have been paid if this income had been taxable at statutory rates. This adjustment puts all earning assets, most notably tax-exempt municipal securities and certain lease assets, on a common basis that facilitates comparison of results to results of competitors. Earnings per Share Equivalent Data Notable income or expense items may be expressed on a per common share basis. This is done for analytical and decision-making purposes to better discern underlying trends in total corporate earnings per share performance excluding the impact of such items. Investors may also find this information helpful in their evaluation of our financial performance against published earnings per share mean estimate amounts, which typically exclude the impact of Notable Items. Earnings per share equivalents are usually calculated by applying an effective tax rate to a pre-tax amount to derive an after-tax amount, which is divided by the average shares outstanding during the respective reporting period. Occasionally, when the item involves special tax treatment, the after-tax amount is disclosed separately, with this then being the amount used to calculate the earnings per share equivalent. Basis of Presentation
2024 Annual Shareholders’ Meeting 14 Basis of Presentation Rounding Please note that columns of data in this document may not add due to rounding. Notable Items From time to time, revenue, expenses, or taxes are impacted by items judged by management to be outside of ordinary banking activities and/or by items that, while they may be associated with ordinary banking activities, are so unusually large that their outsized impact is believed by management at that time to be infrequent or short term in nature. We refer to such items as “Notable Items.” Management believes it is useful to consider certain financial metrics with and without Notable Items, in order to enable a better understanding of company results, increase comparability of period-to-period results, and to evaluate and forecast those results.
2024 Annual Shareholders’ Meeting Slide 8: (1) Equipment Leasing & Financing Association, 2021, bank-owned firms, includes HTF portfolio in terms of annual production (2) By number (units) of 7(a) loans nationally Slide 9: (1) Source: S&P Global Market Intelligence and filings - Peers includes CMA, FITB, KEY, PNC, RF, TFC, ZION excludes (CFG, USB and MTB) impacted by mergers Slide 10: (1) Peers include: CFG, CMA, FITB, KEY, MTB, PNC, RF, TFC, USB, ZION (2) Peers include: CMA, FITB, KEY, MTB, PNC, RF, TFC, USB, ZION, excludes CFG which did not IPO until 3Q14 Slide 11: (1) Source: S&P Global – Includes all peers: CMA, FITB, ZION, KEY, MTB, PNC, RF, TFC, CFG, and USB Notes 15
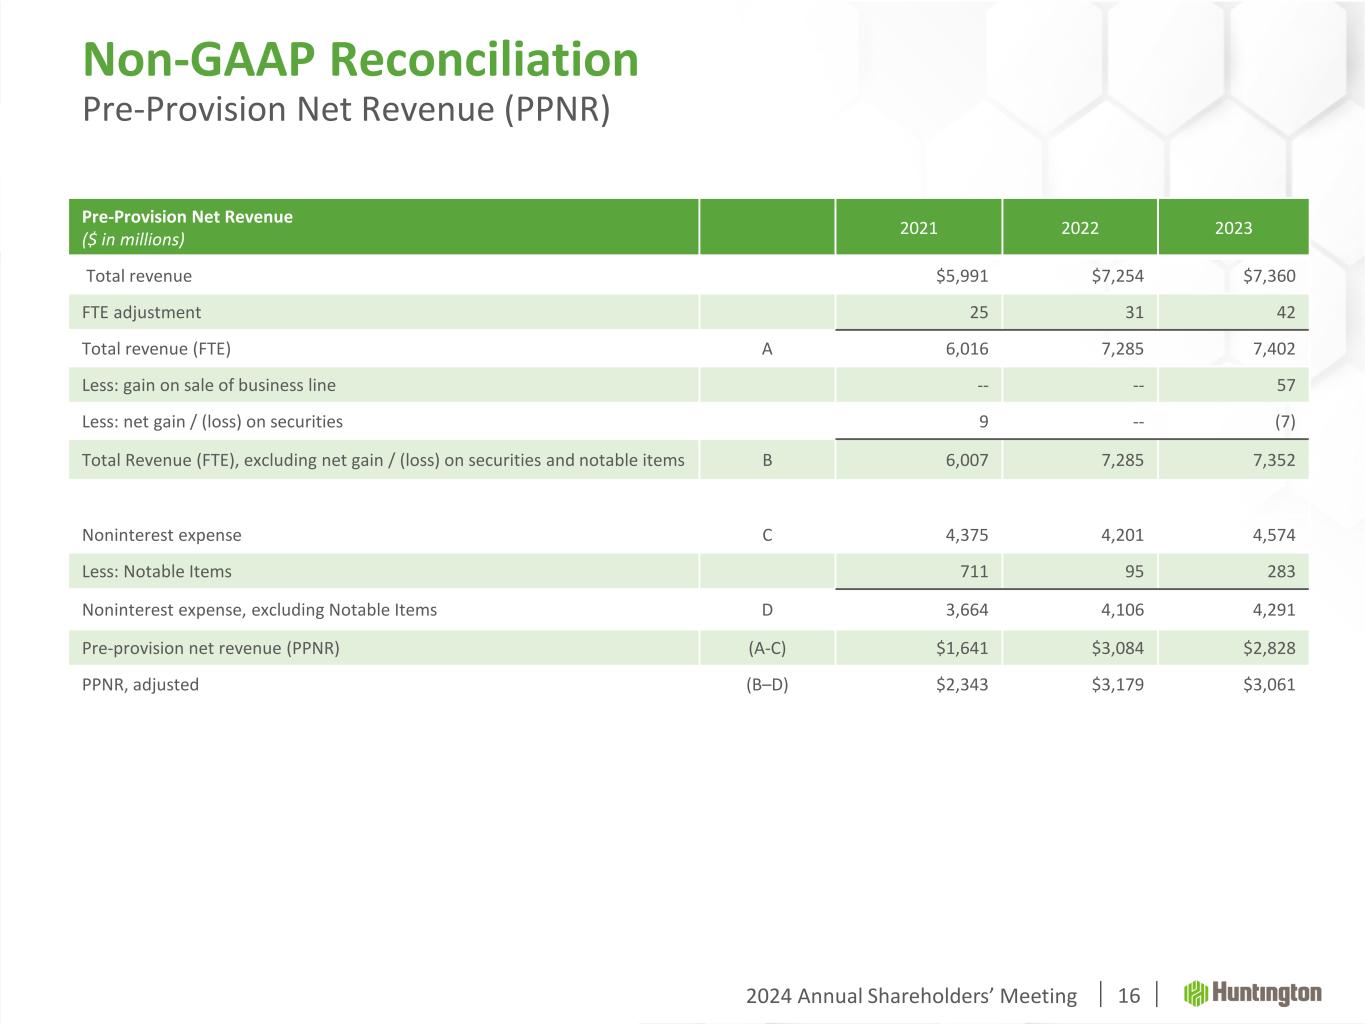
2024 Annual Shareholders’ Meeting Pre-Provision Net Revenue ($ in millions) 2021 2022 2023 Total revenue $5,991 $7,254 $7,360 FTE adjustment 25 31 42 Total revenue (FTE) A 6,016 7,285 7,402 Less: gain on sale of business line -- -- 57 Less: net gain / (loss) on securities 9 -- (7) Total Revenue (FTE), excluding net gain / (loss) on securities and notable items B 6,007 7,285 7,352 Noninterest expense C 4,375 4,201 4,574 Less: Notable Items 711 95 283 Noninterest expense, excluding Notable Items D 3,664 4,106 4,291 Pre-provision net revenue (PPNR) (A-C) $1,641 $3,084 $2,828 PPNR, adjusted (B–D) $2,343 $3,179 $3,061 Non-GAAP Reconciliation Pre-Provision Net Revenue (PPNR) 16
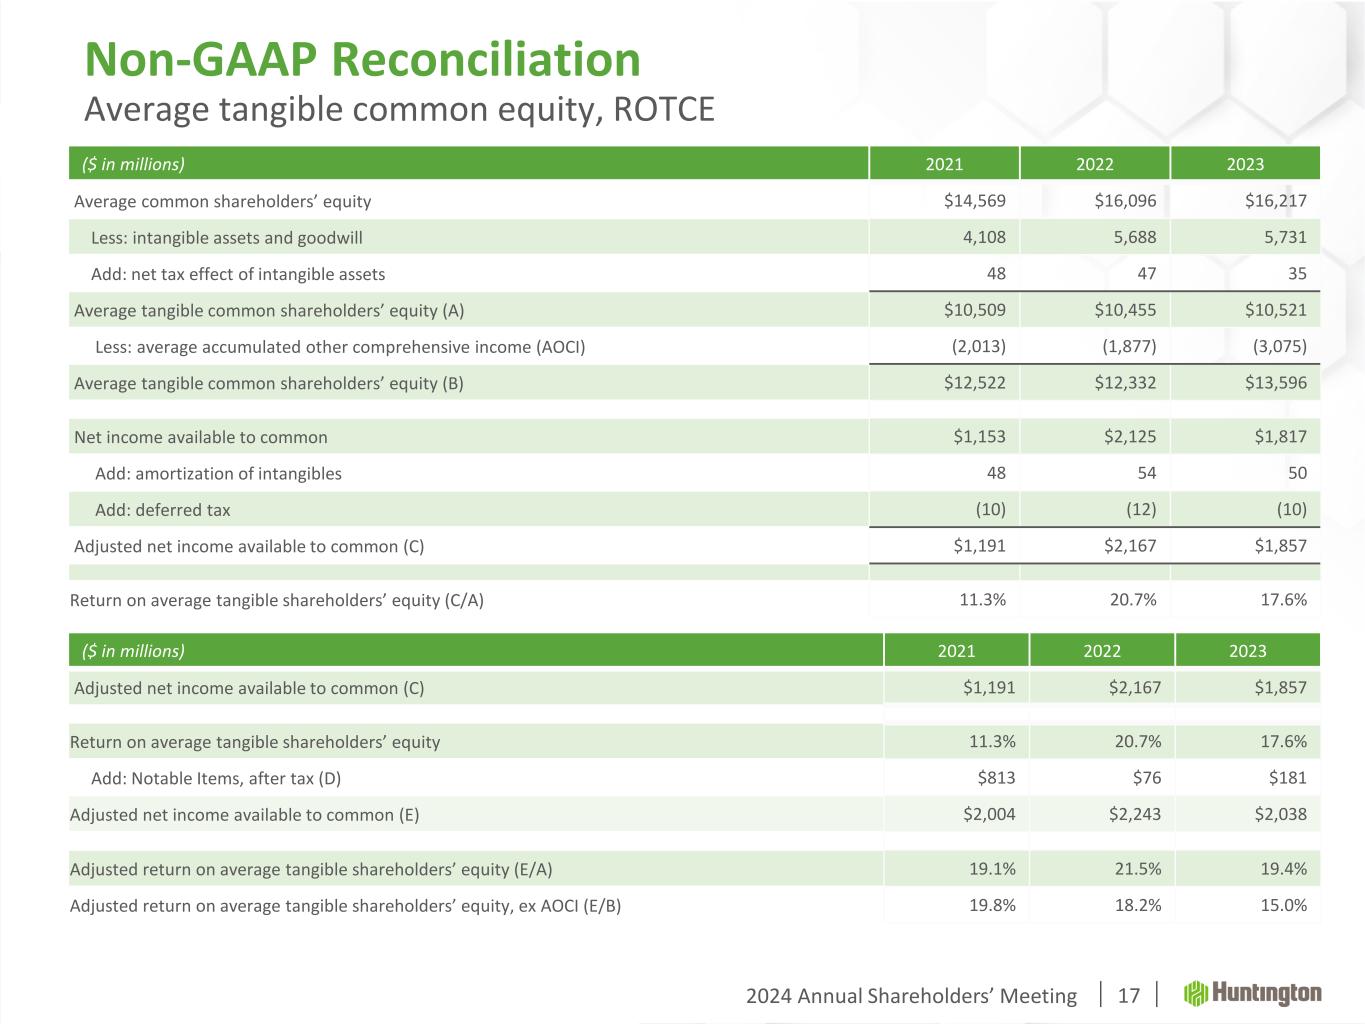
2024 Annual Shareholders’ Meeting ($ in millions) 2021 2022 2023 Average common shareholders’ equity $14,569 $16,096 $16,217 Less: intangible assets and goodwill 4,108 5,688 5,731 Add: net tax effect of intangible assets 48 47 35 Average tangible common shareholders’ equity (A) $10,509 $10,455 $10,521 Less: average accumulated other comprehensive income (AOCI) (2,013) (1,877) (3,075) Average tangible common shareholders’ equity (B) $12,522 $12,332 $13,596 Net income available to common $1,153 $2,125 $1,817 Add: amortization of intangibles 48 54 50 Add: deferred tax (10) (12) (10) Adjusted net income available to common (C) $1,191 $2,167 $1,857 Return on average tangible shareholders’ equity (C/A) 11.3% 20.7% 17.6% ($ in millions) 2021 2022 2023 Adjusted net income available to common (C) $1,191 $2,167 $1,857 Return on average tangible shareholders’ equity 11.3% 20.7% 17.6% Add: Notable Items, after tax (D) $813 $76 $181 Adjusted net income available to common (E) $2,004 $2,243 $2,038 Adjusted return on average tangible shareholders’ equity (E/A) 19.1% 21.5% 19.4% Adjusted return on average tangible shareholders’ equity, ex AOCI (E/B) 19.8% 18.2% 15.0% Non-GAAP Reconciliation Average tangible common equity, ROTCE 17
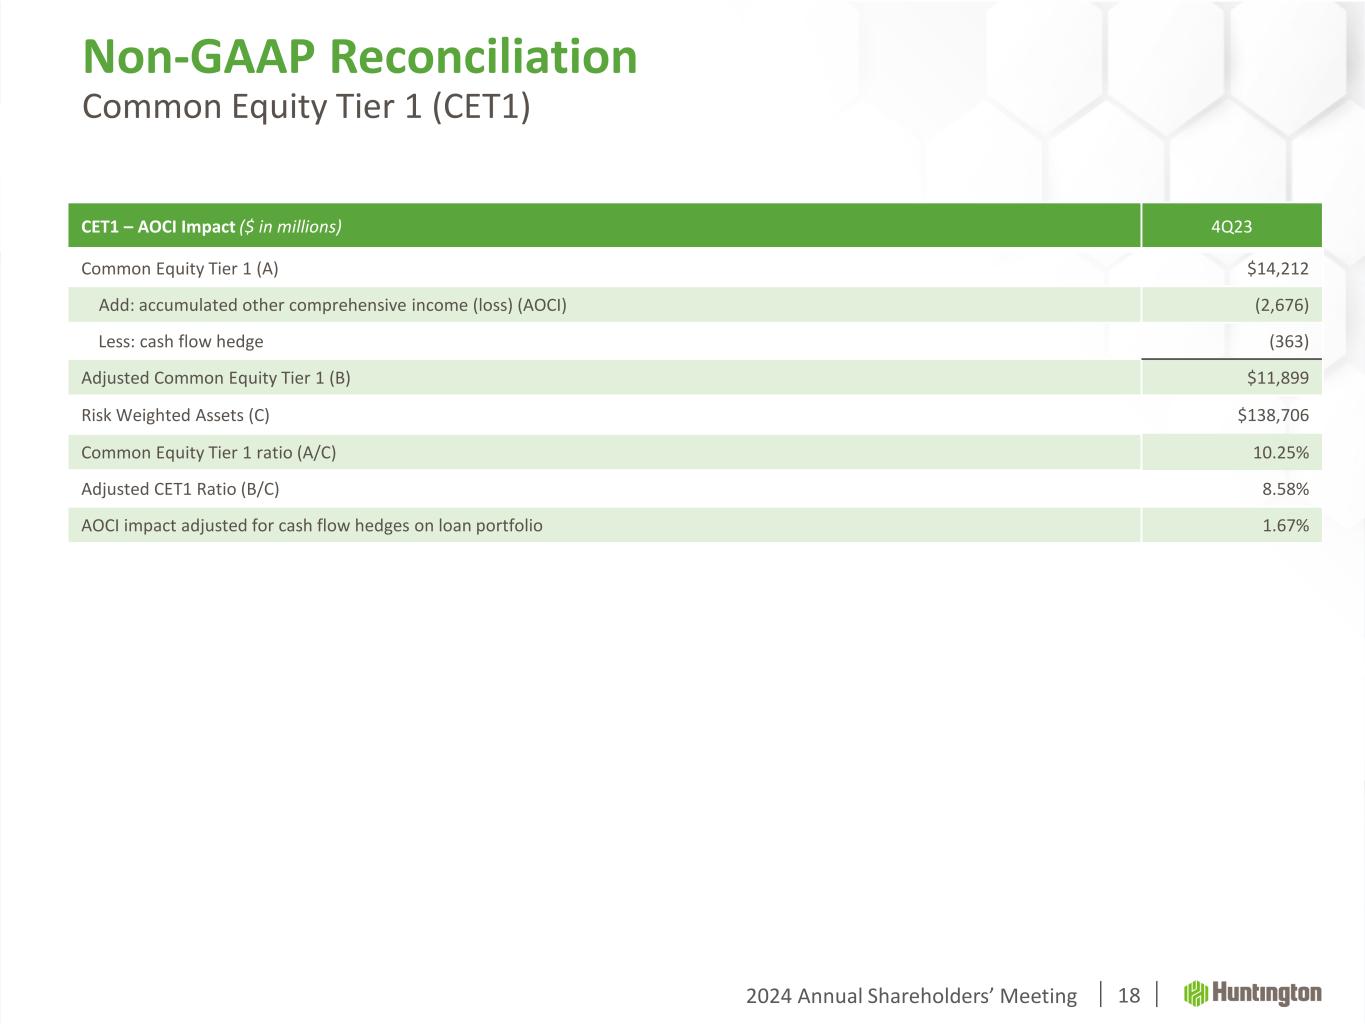
2024 Annual Shareholders’ Meeting 18 Non-GAAP Reconciliation Common Equity Tier 1 (CET1) CET1 – AOCI Impact ($ in millions) 4Q23 Common Equity Tier 1 (A) $14,212 Add: accumulated other comprehensive income (loss) (AOCI) (2,676) Less: cash flow hedge (363) Adjusted Common Equity Tier 1 (B) $11,899 Risk Weighted Assets (C) $138,706 Common Equity Tier 1 ratio (A/C) 10.25% Adjusted CET1 Ratio (B/C) 8.58% AOCI impact adjusted for cash flow hedges on loan portfolio 1.67%

Welcome.®