EX-99.1
Published on December 6, 2023
Welcome.® 2023 Goldman Sachs US Financial Services Conference The Huntington National Bank is Member FDIC. ®, Huntington® and Huntington. Welcome.® are federally registered service marks of Huntington Bancshares Incorporated. ©2023 Huntington Bancshares Incorporated. December 6, 2023
22023 Goldman Sachs US Financial Services Conference Disclaimer CAUTION REGARDING FORWARD-LOOKING STATEMENTS The information contained or incorporated by reference in this presentation contains certain forward-looking statements, including, but not limited to, certain plans, expectations, goals, projections, and statements, which are not historical facts and are subject to numerous assumptions, risks, and uncertainties. Statements that do not describe historical or current facts, including statements about beliefs and expectations, are forward-looking statements. Forward-looking statements may be identified by words such as expect, anticipate, believe, intend, estimate, plan, target, goal, or similar expressions, or future or conditional verbs such as will, may, might, should, would, could, or similar variations. The forward-looking statements are intended to be subject to the safe harbor provided by Section 27A of the Securities Act of 1933, Section 21E of the Securities Exchange Act of 1934, and the Private Securities Litigation Reform Act of 1995. While there is no assurance that any list of risks and uncertainties or risk factors is complete, below are certain factors which could cause actual results to differ materially from those contained or implied in the forward-looking statements: changes in general economic, political, or industry conditions; deterioration in business and economic conditions, including persistent inflation, supply chain issues or labor shortages, instability in global economic conditions and geopolitical matters, as well as volatility in financial markets; the impact of pandemics, including the COVID-19 pandemic and related variants and mutations, and their impact on the global economy and financial market conditions and our business, results of operations, and financial condition; the impacts related to or resulting from recent bank failures and other volatility, including potential increased regulatory requirements and costs, such as FDIC special assessments, long-term debt requirements and heightened capital requirements, and potential impacts to macroeconomic conditions, which could affect the ability of depository institutions, including us, to attract and retain depositors and to borrow or raise capital; unexpected outflows of uninsured deposits which may require us to sell investment securities at a loss; rising interest rates which could negatively impact the value of our portfolio of investment securities; the loss of value of our investment portfolio which could negatively impact market perceptions of us and could lead to deposit withdrawals; the effects of social media on market perceptions of us and banks generally; cybersecurity risks; uncertainty in U.S. fiscal and monetary policy, including the interest rate policies of the Federal Reserve; volatility and disruptions in global capital and credit markets; movements in interest rates; transition away from LIBOR; competitive pressures on product pricing and services; success, impact, and timing of our business strategies, including market acceptance of any new products or services including those implementing our “Fair Play” banking philosophy; the nature, extent, timing, and results of governmental actions, examinations, reviews, reforms, regulations, and interpretations, including those related to the Dodd-Frank Wall Street Reform and Consumer Protection Act and the Basel III regulatory capital reforms, as well as those involving the OCC, Federal Reserve, FDIC, and CFPB; and other factors that may affect the future results of Huntington. Additional factors that could cause results to differ materially from those described above can be found in Huntington’s Annual Report on Form 10-K for the year ended December 31, 2022 and Quarterly Reports on Form 10-Q for the quarters ended March 31, 2023, June 30, 2023 and September 30, 2023, which are on file with the Securities and Exchange Commission (the “SEC”) and available in the “Investor Relations” section of Huntington’s website http://www.huntington.com, under the heading “Publications and Filings” and in other documents Huntington files with the SEC. All forward-looking statements speak only as of the date they are made and are based on information available at that time. Huntington does not assume any obligation to update forward-looking statements to reflect circumstances or events that occur after the date the forward-looking statements were made or to reflect the occurrence of unanticipated events except as required by federal securities laws. As forward-looking statements involve significant risks and uncertainties, caution should be exercised against placing undue reliance on such statements.
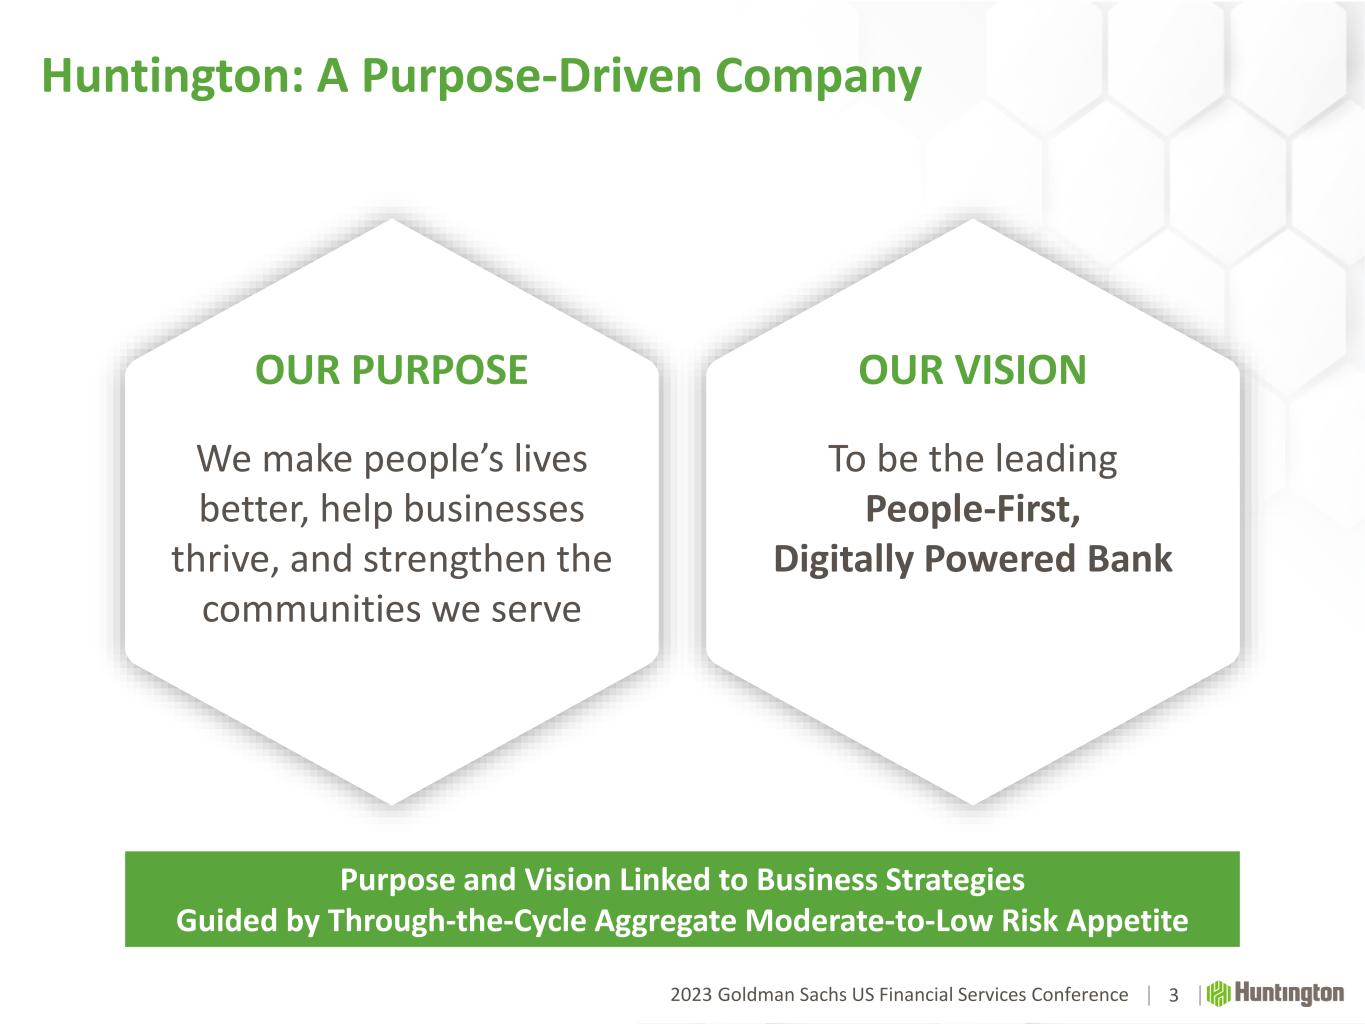
2023 Goldman Sachs US Financial Services Conference Huntington: A Purpose-Driven Company 3 OUR PURPOSE We make people’s lives better, help businesses thrive, and strengthen the communities we serve OUR VISION To be the leading People-First, Digitally Powered Bank Purpose and Vision Linked to Business Strategies Guided by Through-the-Cycle Aggregate Moderate-to-Low Risk Appetite
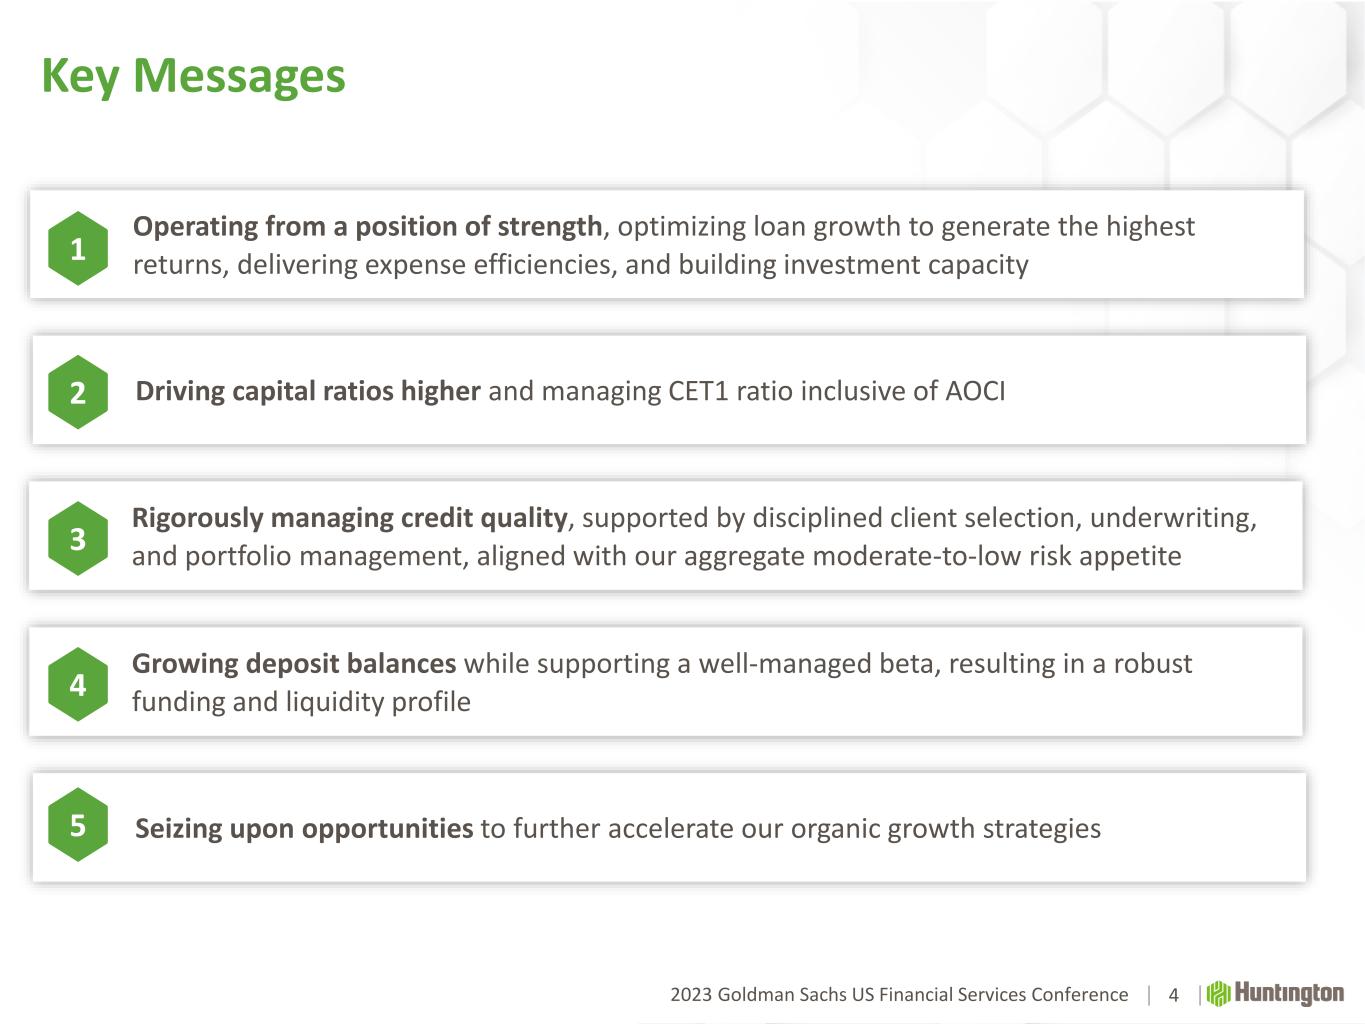
2023 Goldman Sachs US Financial Services Conference Key Messages 4 Rigorously managing credit quality, supported by disciplined client selection, underwriting, and portfolio management, aligned with our aggregate moderate-to-low risk appetite3 Driving capital ratios higher and managing CET1 ratio inclusive of AOCI2 Operating from a position of strength, optimizing loan growth to generate the highest returns, delivering expense efficiencies, and building investment capacity1 Seizing upon opportunities to further accelerate our organic growth strategies5 Growing deposit balances while supporting a well-managed beta, resulting in a robust funding and liquidity profile4
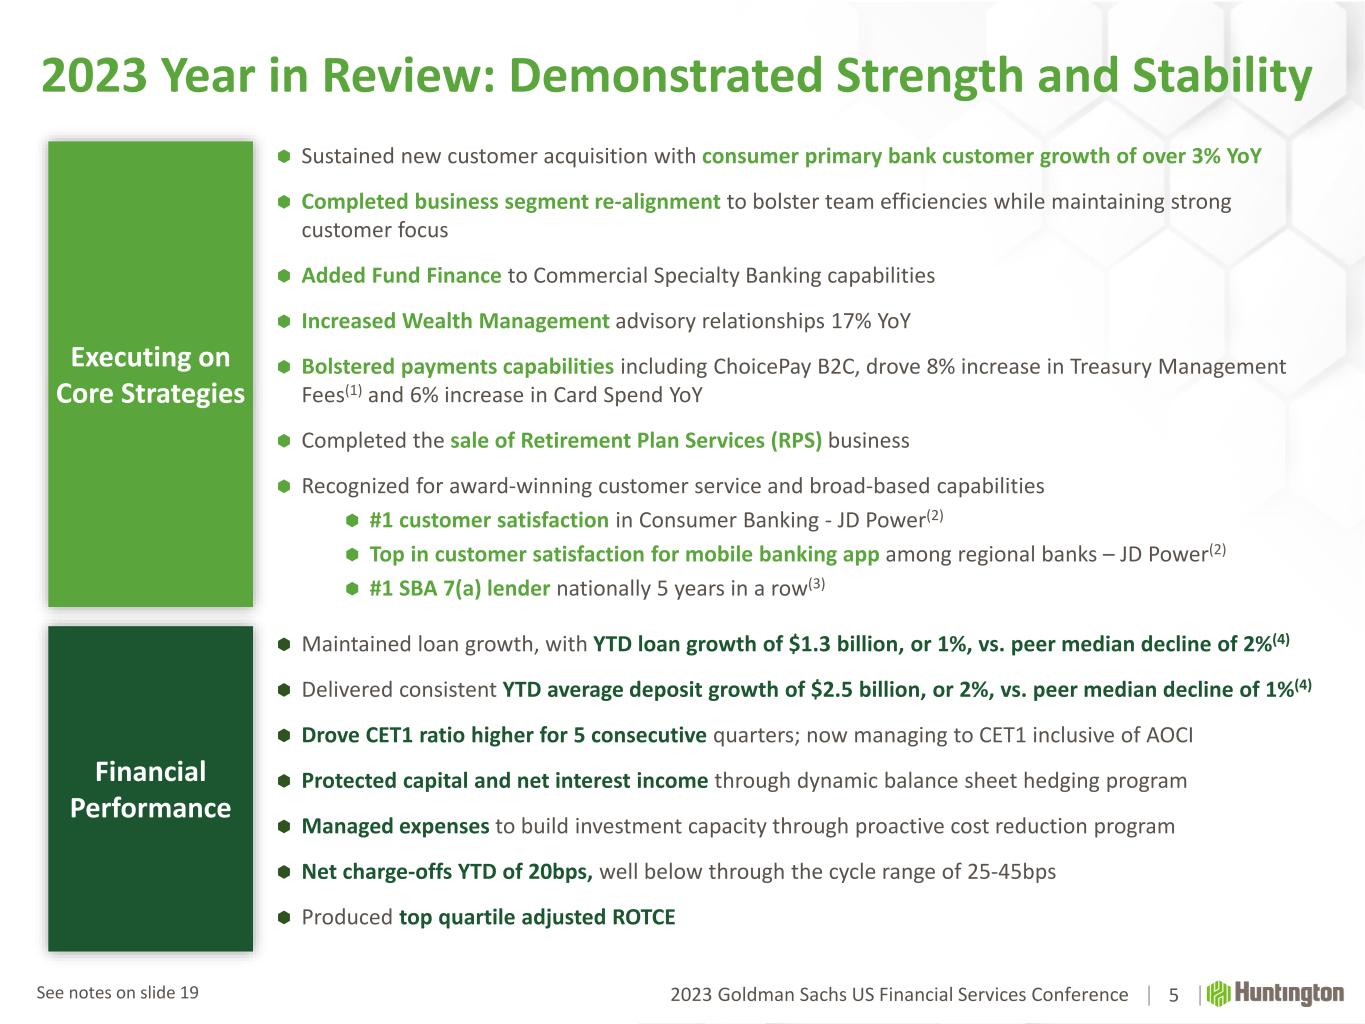
2023 Goldman Sachs US Financial Services Conference 2023 Year in Review: Demonstrated Strength and Stability 5 Financial Performance Maintained loan growth, with YTD loan growth of $1.3 billion, or 1%, vs. peer median decline of 2%(4) Delivered consistent YTD average deposit growth of $2.5 billion, or 2%, vs. peer median decline of 1%(4) Drove CET1 ratio higher for 5 consecutive quarters; now managing to CET1 inclusive of AOCI Protected capital and net interest income through dynamic balance sheet hedging program Managed expenses to build investment capacity through proactive cost reduction program Net charge-offs YTD of 20bps, well below through the cycle range of 25-45bps Produced top quartile adjusted ROTCE Sustained new customer acquisition with consumer primary bank customer growth of over 3% YoY Completed business segment re-alignment to bolster team efficiencies while maintaining strong customer focus Added Fund Finance to Commercial Specialty Banking capabilities Increased Wealth Management advisory relationships 17% YoY Bolstered payments capabilities including ChoicePay B2C, drove 8% increase in Treasury Management Fees(1) and 6% increase in Card Spend YoY Completed the sale of Retirement Plan Services (RPS) business Recognized for award-winning customer service and broad-based capabilities #1 customer satisfaction in Consumer Banking - JD Power(2) Top in customer satisfaction for mobile banking app among regional banks – JD Power(2) #1 SBA 7(a) lender nationally 5 years in a row(3) Executing on Core Strategies See notes on slide 19
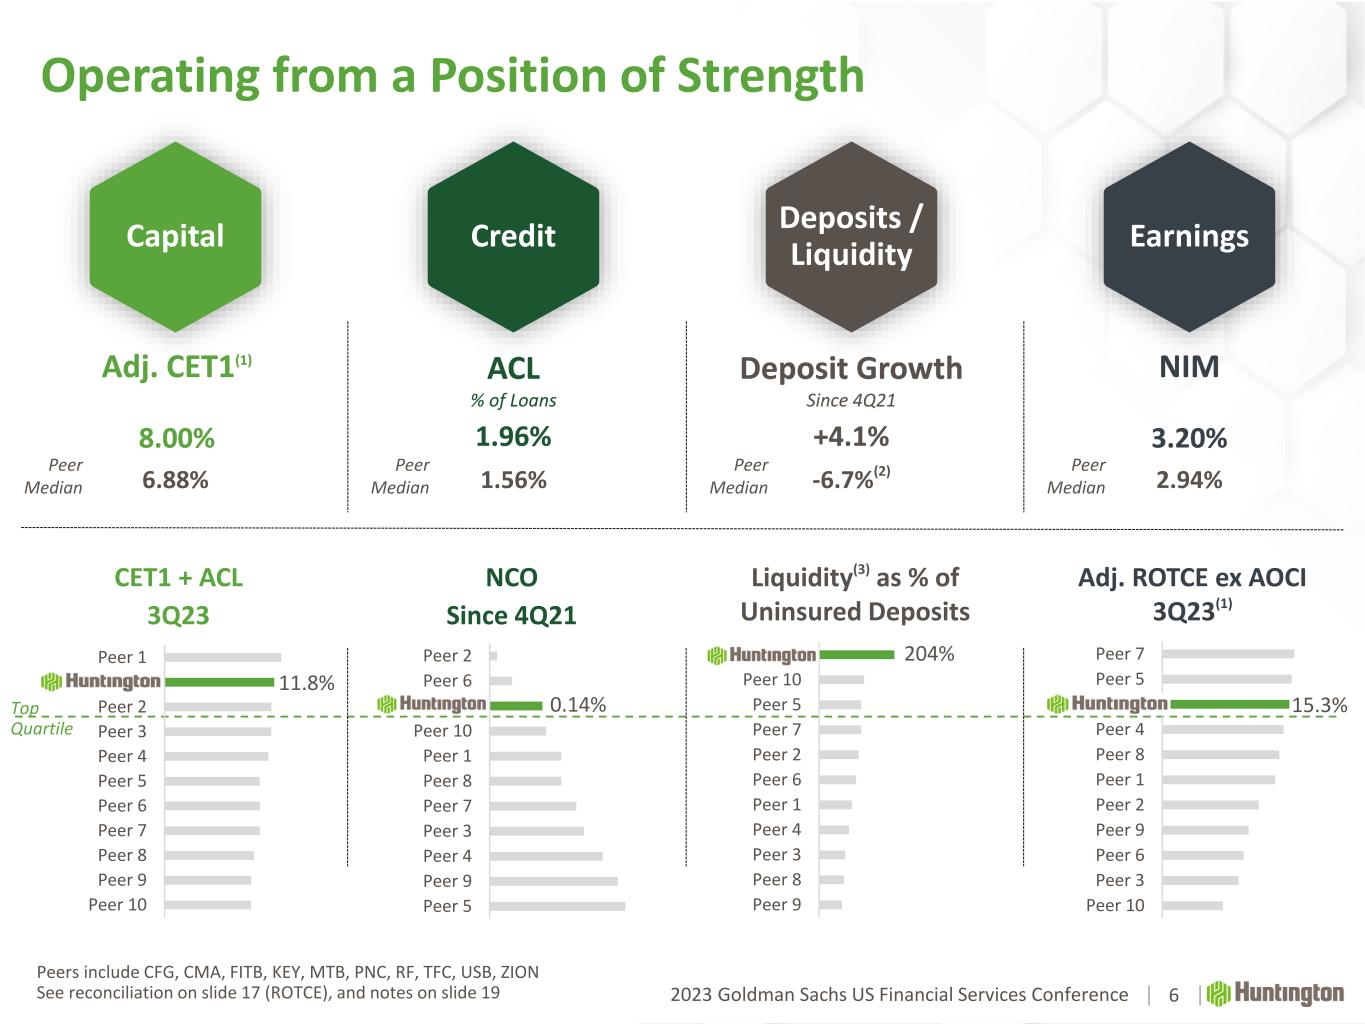
2023 Goldman Sachs US Financial Services Conference Operating from a Position of Strength 6 Peers include CFG, CMA, FITB, KEY, MTB, PNC, RF, TFC, USB, ZION See reconciliation on slide 17 (ROTCE), and notes on slide 19 Capital CET1 + ACL 3Q23 Deposits / Liquidity Liquidity(3) as % of Uninsured Deposits Credit NCO Since 4Q21 Earnings Adj. ROTCE ex AOCI 3Q23(1) Top Quartile Peer Median 11.8% Peer 10 Peer 9 Peer 8 Peer 7 Peer 6 Peer 5 Peer 4 Peer 3 Peer 2 HBAN Peer 1 204% Peer 9 Peer 8 Peer 3 Peer 4 Peer 1 Peer 6 Peer 2 Peer 7 Peer 5 Peer 10 HBAN 0.14% Peer 5 Peer 9 Peer 4 Peer 3 Peer 7 Peer 8 Peer 1 Peer 10 HBAN Peer 6 Peer 2 15.3% Peer 10 Peer 3 Peer 6 Peer 9 Peer 2 Peer 1 Peer 8 Peer 4 HBAN Peer 5 Peer 7 -6.7%(2)1.56% 2.94%6.88% Adj. CET1(1) 8.00% Deposit Growth Since 4Q21 +4.1% ACL % of Loans 1.96% NIM 3.20% Peer Median Peer Median Peer Median
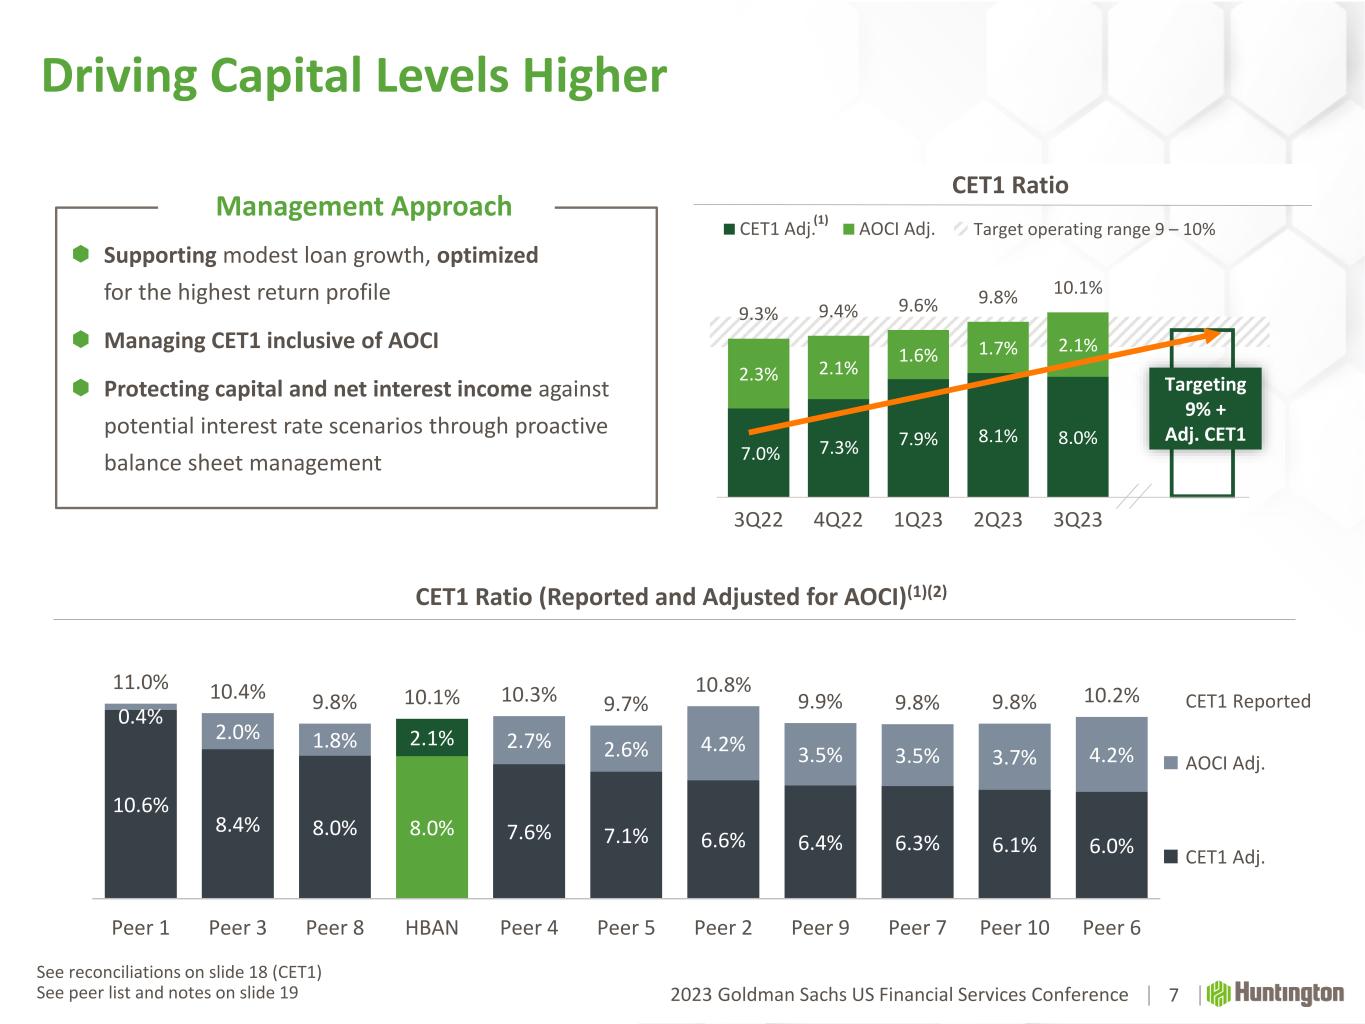
2023 Goldman Sachs US Financial Services Conference 7.0% 7.3% 7.9% 8.1% 8.0% 2.3% 2.1% 1.6% 1.7% 2.1% 9.3% 9.4% 9.6% 9.8% 10.1% 3Q22 4Q22 1Q23 2Q23 3Q23 CET1 Adj. AOCI Adj. Driving Capital Levels Higher CET1 Ratio 7 Supporting modest loan growth, optimized for the highest return profile Managing CET1 inclusive of AOCI Protecting capital and net interest income against potential interest rate scenarios through proactive balance sheet management Management Approach CET1 Ratio (Reported and Adjusted for AOCI)(1)(2) CET1 Adj. AOCI Adj. CET1 Reported Target operating range 9 – 10%(1) Targeting 9% + Adj. CET1 10.6% 8.4% 8.0% 8.0% 7.6% 7.1% 6.6% 6.4% 6.3% 6.1% 6.0% 0.4% 2.0% 1.8% 2.1% 2.7% 2.6% 4.2% 3.5% 3.5% 3.7% 4.2% 11.0% 10.4% 9.8% 10.1% 10.3% 9.7% 10.8% 9.9% 9.8% 9.8% 10.2% Peer 1 Peer 3 Peer 8 HBAN Peer 4 Peer 5 Peer 2 Peer 9 Peer 7 Peer 10 Peer 6 See reconciliations on slide 18 (CET1) See peer list and notes on slide 19
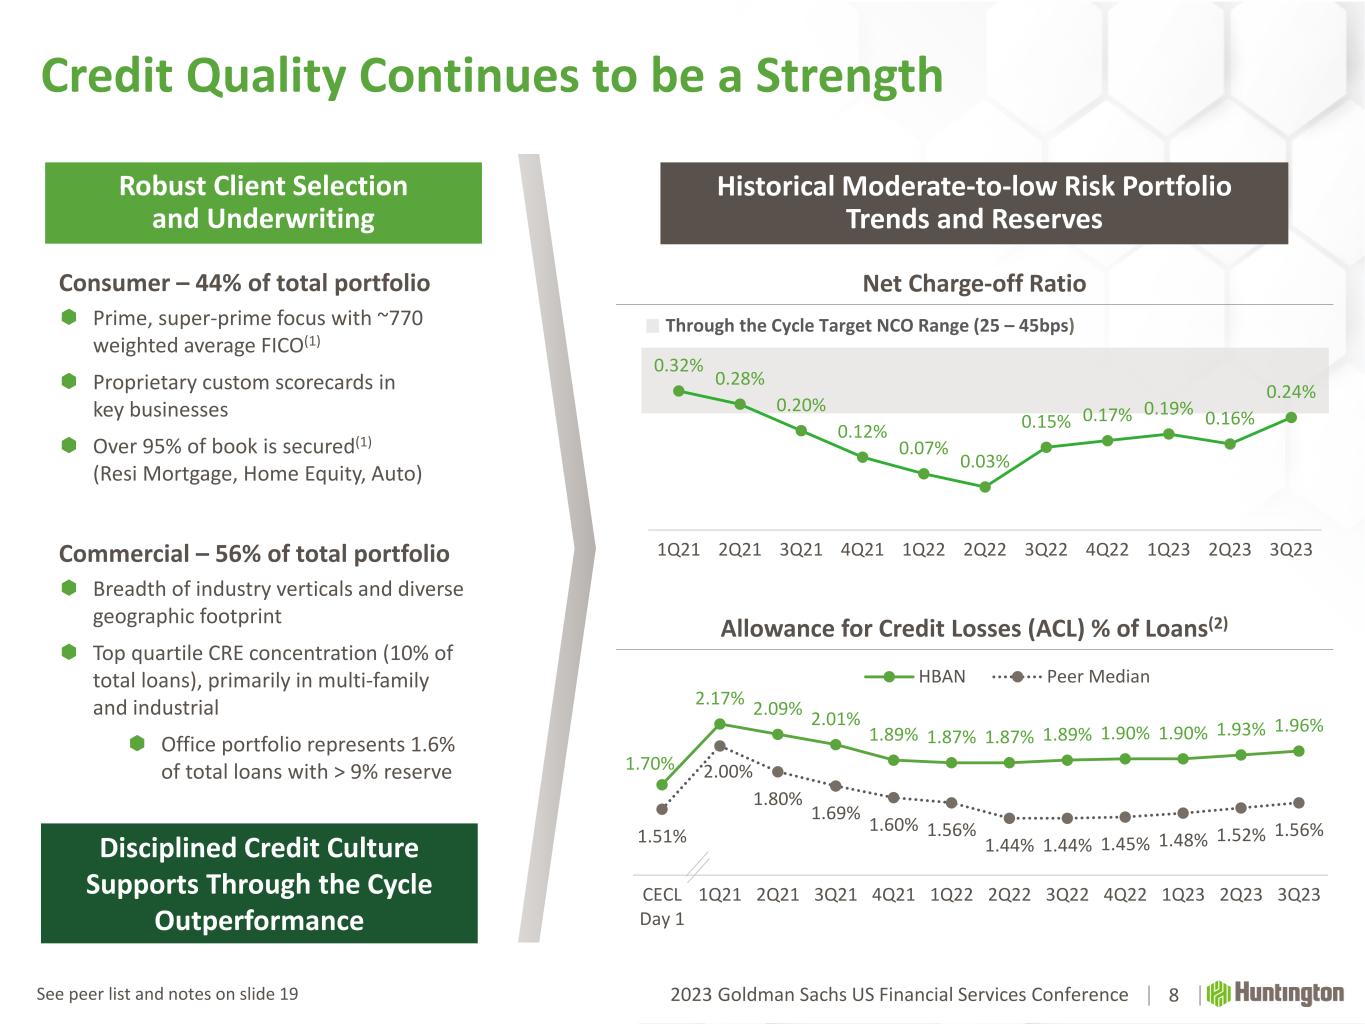
2023 Goldman Sachs US Financial Services Conference 0.32% 0.28% 0.20% 0.12% 0.07% 0.03% 0.15% 0.17% 0.19% 0.16% 0.24% 1Q21 2Q21 3Q21 4Q21 1Q22 2Q22 3Q22 4Q22 1Q23 2Q23 3Q23 1.70% 2.17% 2.09% 2.01% 1.89% 1.87% 1.87% 1.89% 1.90% 1.90% 1.93% 1.96% 1.51% 2.00% 1.80% 1.69% 1.60% 1.56% 1.44% 1.44% 1.45% 1.48% 1.52% 1.56% CECL Day 1 1Q21 2Q21 3Q21 4Q21 1Q22 2Q22 3Q22 4Q22 1Q23 2Q23 3Q23 HBAN Peer Median Credit Quality Continues to be a Strength 8 Robust Client Selection and Underwriting Disciplined Credit Culture Supports Through the Cycle Outperformance Consumer – 44% of total portfolio Prime, super-prime focus with ~770 weighted average FICO(1) Proprietary custom scorecards in key businesses Over 95% of book is secured(1) (Resi Mortgage, Home Equity, Auto) Commercial – 56% of total portfolio Breadth of industry verticals and diverse geographic footprint Top quartile CRE concentration (10% of total loans), primarily in multi-family and industrial Office portfolio represents 1.6% of total loans with > 9% reserve Net Charge-off Ratio Allowance for Credit Losses (ACL) % of Loans(2) Through the Cycle Target NCO Range (25 – 45bps) Historical Moderate-to-low Risk Portfolio Trends and Reserves See peer list and notes on slide 19
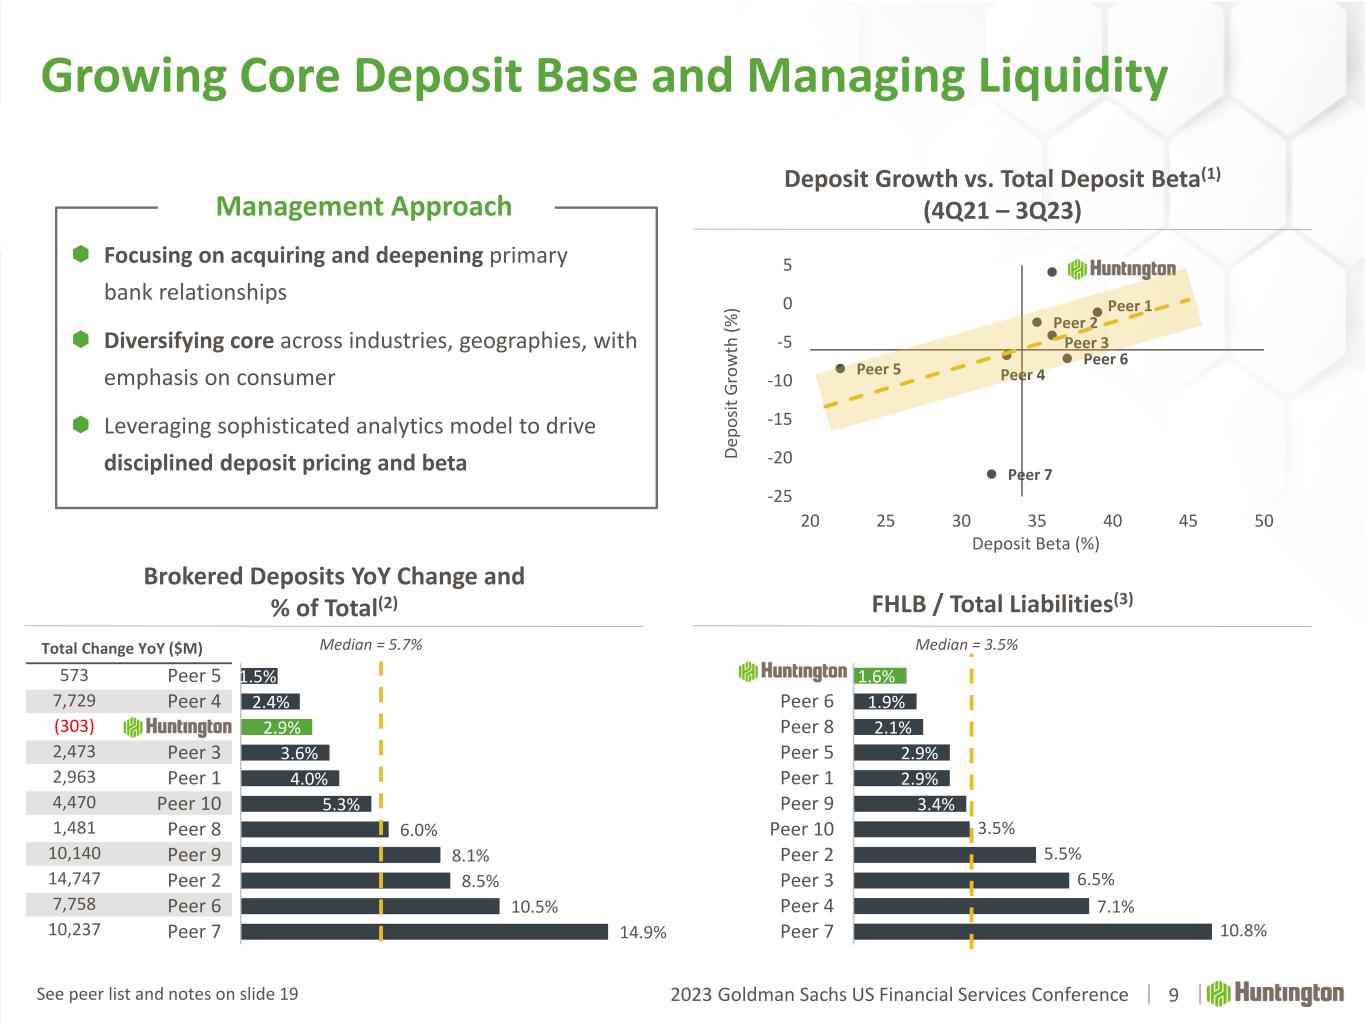
2023 Goldman Sachs US Financial Services Conference Total Change YoY ($M) 573 7,729 (303) 2,473 2,963 4,470 1,481 10,140 14,747 7,758 10,237 Peer 1 Peer 2 Peer 3 Peer 4Peer 5 Peer 6 Peer 7 -25 -20 -15 -10 -5 0 5 20 25 30 35 40 45 50 De po sit G ro w th (% ) Deposit Beta (%) 1.6% 1.9% 2.1% 2.9% 2.9% 3.4% 3.5% 5.5% 6.5% 7.1% 10.8% HBAN Peer 6 Peer 8 Peer 5 Peer 1 Peer 9 Peer 10 Peer 2 Peer 3 Peer 4 Peer 7 Growing Core Deposit Base and Managing Liquidity Deposit Growth vs. Total Deposit Beta(1) (4Q21 – 3Q23) FHLB / Total Liabilities(3) Median = 3.5% 1.5% 2.4% 2.9% 3.6% 4.0% 5.3% 6.0% 8.1% 8.5% 10.5% 14.9% Peer 5 Peer 4 HBAN Peer 3 Peer 1 Peer 10 Peer 8 Peer 9 Peer 2 Peer 6 Peer 7 Brokered Deposits YoY Change and % of Total(2) Median = 5.7% 9 Focusing on acquiring and deepening primary bank relationships Diversifying core across industries, geographies, with emphasis on consumer Leveraging sophisticated analytics model to drive disciplined deposit pricing and beta Management Approach See peer list and notes on slide 19
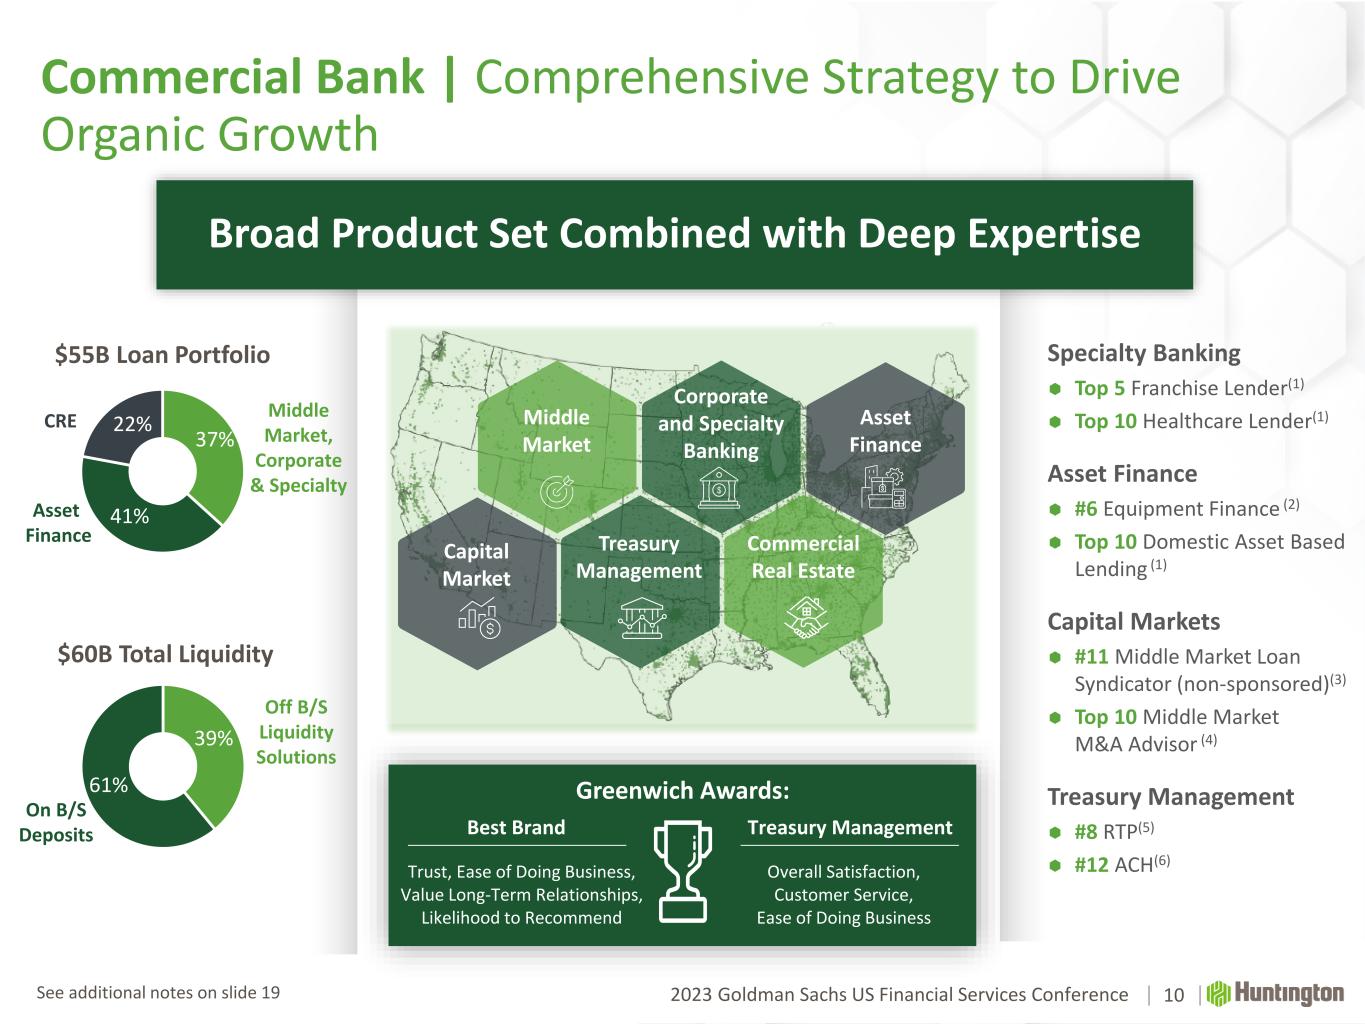
2023 Goldman Sachs US Financial Services Conference Commercial Bank | Comprehensive Strategy to Drive Organic Growth $55B Loan Portfolio Specialty Banking Top 5 Franchise Lender(1) Top 10 Healthcare Lender(1) Asset Finance #6 Equipment Finance (2) Top 10 Domestic Asset Based Lending (1) Capital Markets #11 Middle Market Loan Syndicator (non-sponsored)(3) Top 10 Middle Market M&A Advisor (4) Treasury Management #8 RTP(5) #12 ACH(6) 37% 41% 22%CRE Asset Finance Middle Market, Corporate & Specialty $60B Total Liquidity Off B/S Liquidity Solutions On B/S Deposits Broad Product Set Combined with Deep Expertise Capital Market Middle Market Treasury Management Asset Finance Corporate and Specialty Banking Commercial Real Estate Best Brand Trust, Ease of Doing Business, Value Long-Term Relationships, Likelihood to Recommend Treasury Management Overall Satisfaction, Customer Service, Ease of Doing Business Greenwich Awards: Treasury Management Greenwich Awards: Trust, Ease of Doing Business, Value Long-Term Relationships, Likelihood to Recommend Overall Satisfaction, Customer Service, Ease of Doing Business 10 39% 61% See additional notes on slide 19 Treasury ManagementBest Brand
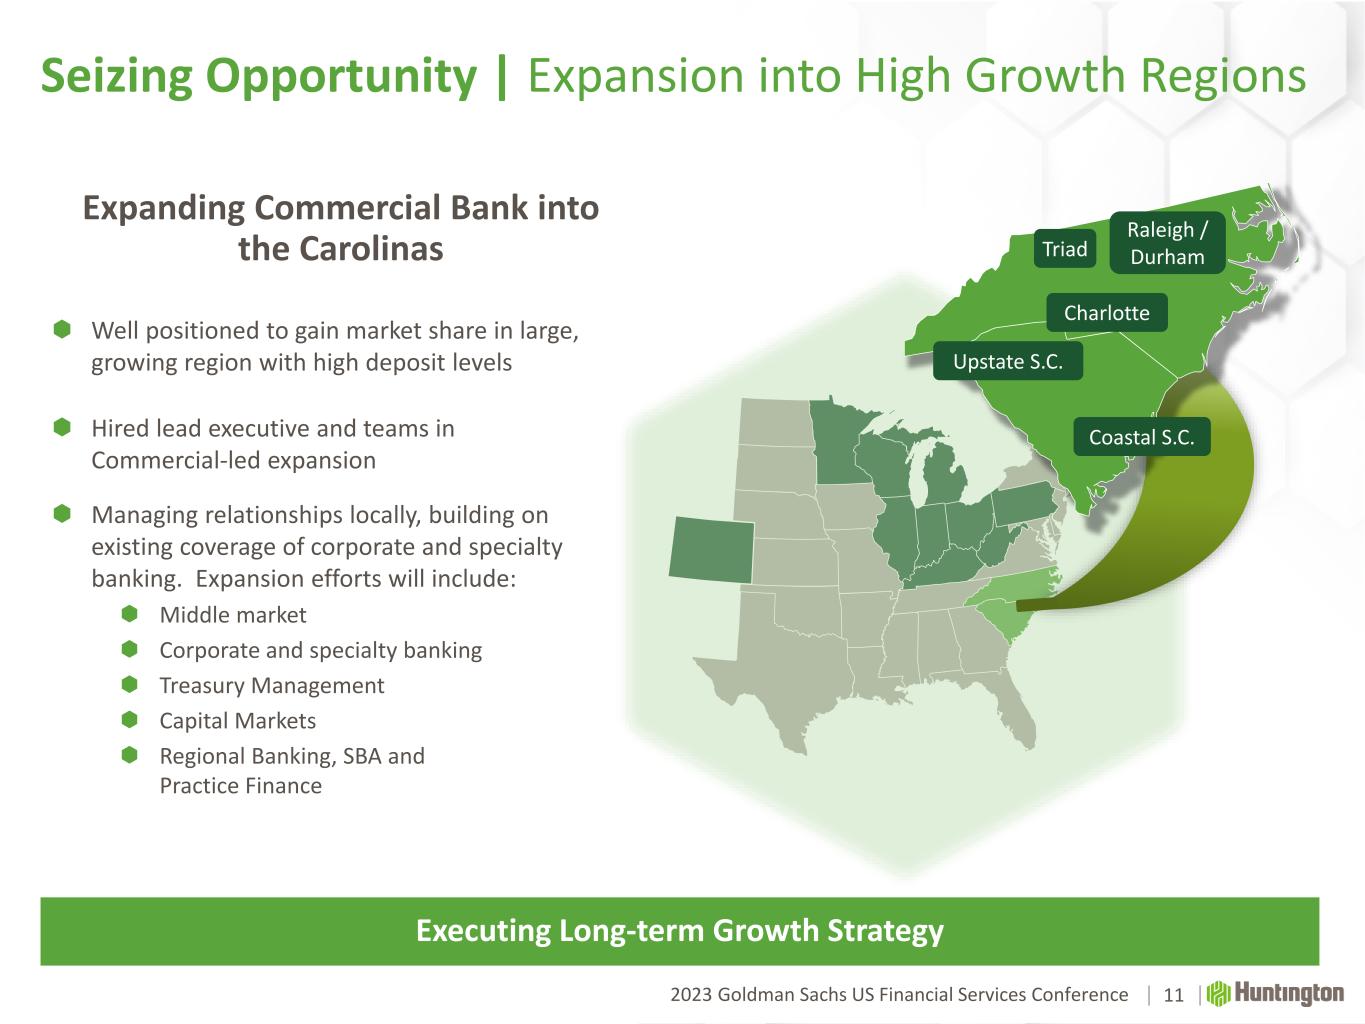
2023 Goldman Sachs US Financial Services Conference Seizing Opportunity | Expansion into High Growth Regions 11 Executing Long-term Growth Strategy Well positioned to gain market share in large, growing region with high deposit levels Hired lead executive and teams in Commercial-led expansion Managing relationships locally, building on existing coverage of corporate and specialty banking. Expansion efforts will include: Middle market Corporate and specialty banking Treasury Management Capital Markets Regional Banking, SBA and Practice Finance Expanding Commercial Bank into the Carolinas Triad Coastal S.C. Upstate S.C. Charlotte Raleigh / Durham
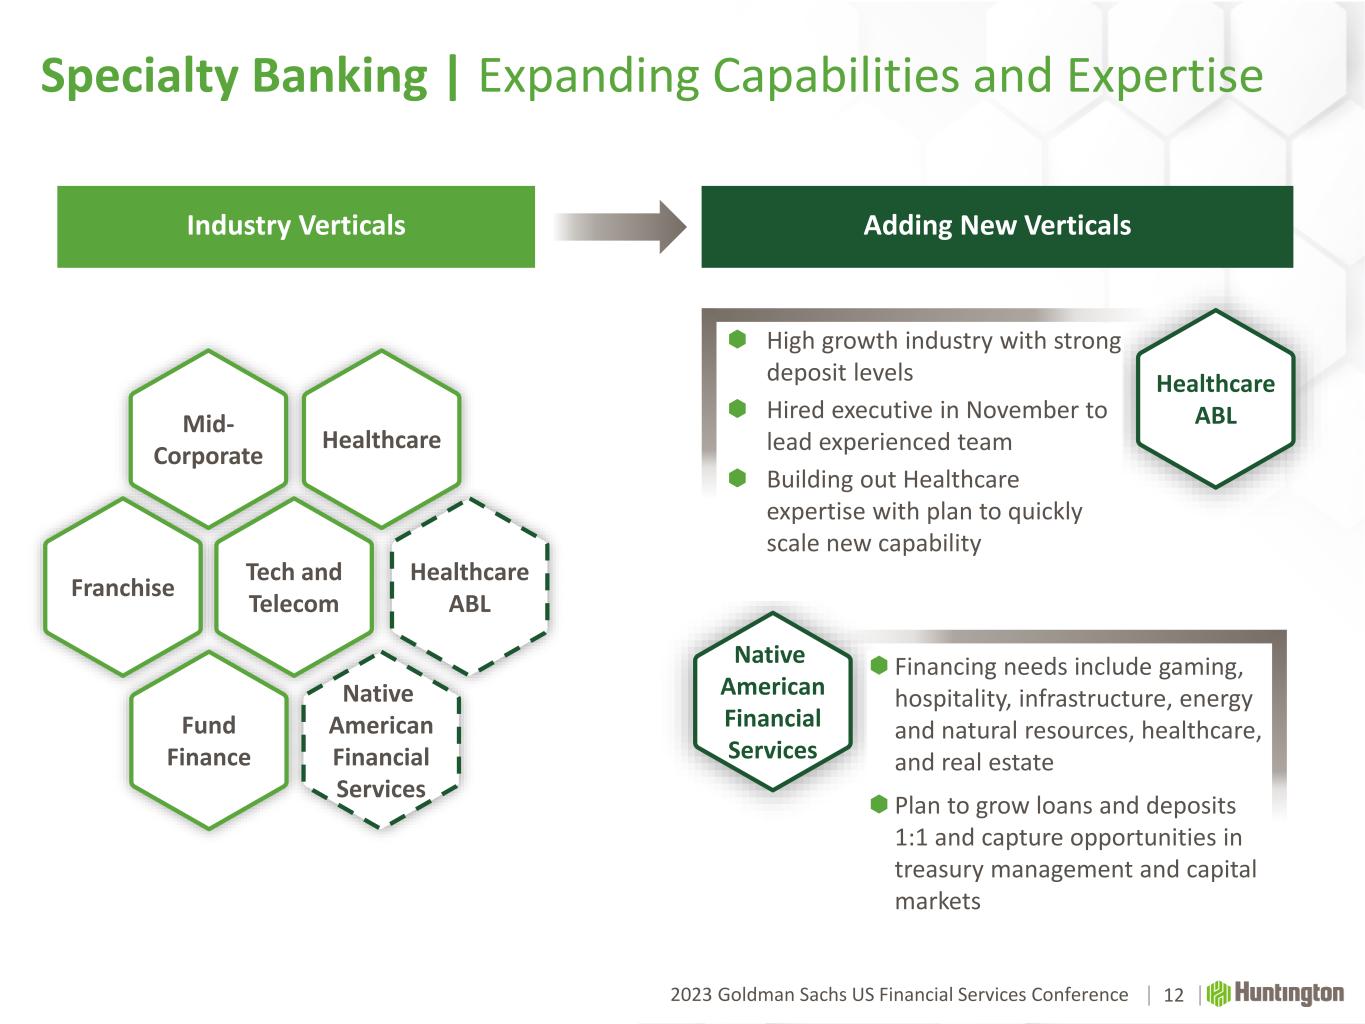
2023 Goldman Sachs US Financial Services Conference Specialty Banking | Expanding Capabilities and Expertise 12 Industry Verticals Adding New Verticals Healthcare ABL Native American Financial Services High growth industry with strong deposit levels Hired executive in November to lead experienced team Building out Healthcare expertise with plan to quickly scale new capability Franchise Tech and Telecom Mid- Corporate Healthcare Native American Financial Services Fund Finance Healthcare ABL Financing needs include gaming, hospitality, infrastructure, energy and natural resources, healthcare, and real estate Plan to grow loans and deposits 1:1 and capture opportunities in treasury management and capital markets

Appendix
142023 Goldman Sachs US Financial Services Conference Use of Non-GAAP Financial Measures This document contains GAAP financial measures and non-GAAP financial measures where management believes it to be helpful in understanding Huntington’s results of operations or financial position. Where non-GAAP financial measures are used, the comparable GAAP financial measure, as well as the reconciliation to the comparable GAAP financial measure, can be found in this document, conference call slides, or the Form 8-K related to this document, all of which can be found in the Investor Relations section of Huntington’s website, http://www.huntington.com. Annualized Data Certain returns, yields, performance ratios, or quarterly growth rates are presented on an “annualized” basis. This is done for analytical and decision-making purposes to better discern underlying performance trends when compared to full-year or year-over-year amounts. For example, loan and deposit growth rates, as well as net charge-off percentages, are most often expressed in terms of an annual rate like 8%. As such, a 2% growth rate for a quarter would represent an annualized 8% growth rate. Fully-Taxable Equivalent Interest Income and Net Interest Margin Income from tax-exempt earning assets is increased by an amount equivalent to the taxes that would have been paid if this income had been taxable at statutory rates. This adjustment puts all earning assets, most notably tax-exempt municipal securities and certain lease assets, on a common basis that facilitates comparison of results to results of competitors. Earnings per Share Equivalent Data Notable income or expense items may be expressed on a per common share basis. This is done for analytical and decision-making purposes to better discern underlying trends in total corporate earnings per share performance excluding the impact of such items. Investors may also find this information helpful in their evaluation of our financial performance against published earnings per share mean estimate amounts, which typically exclude the impact of Notable Items. Earnings per share equivalents are usually calculated by applying an effective tax rate to a pre-tax amount to derive an after-tax amount, which is divided by the average shares outstanding during the respective reporting period. Occasionally, when the item involves special tax treatment, the after-tax amount is disclosed separately, with this then being the amount used to calculate the earnings per share equivalent. Basis of Presentation
152023 Goldman Sachs US Financial Services Conference Basis of Presentation Rounding Please note that columns of data in this document may not add due to rounding. Notable Items From time to time, revenue, expenses, or taxes are impacted by items judged by management to be outside of ordinary banking activities and/or by items that, while they may be associated with ordinary banking activities, are so unusually large that their outsized impact is believed by management at that time to be infrequent or short term in nature. We refer to such items as “Notable Items.” Management believes it is useful to consider certain financial metrics with and without Notable Items, in order to enable a better understanding of company results, increase comparability of period-to-period results, and to evaluate and forecast those results.
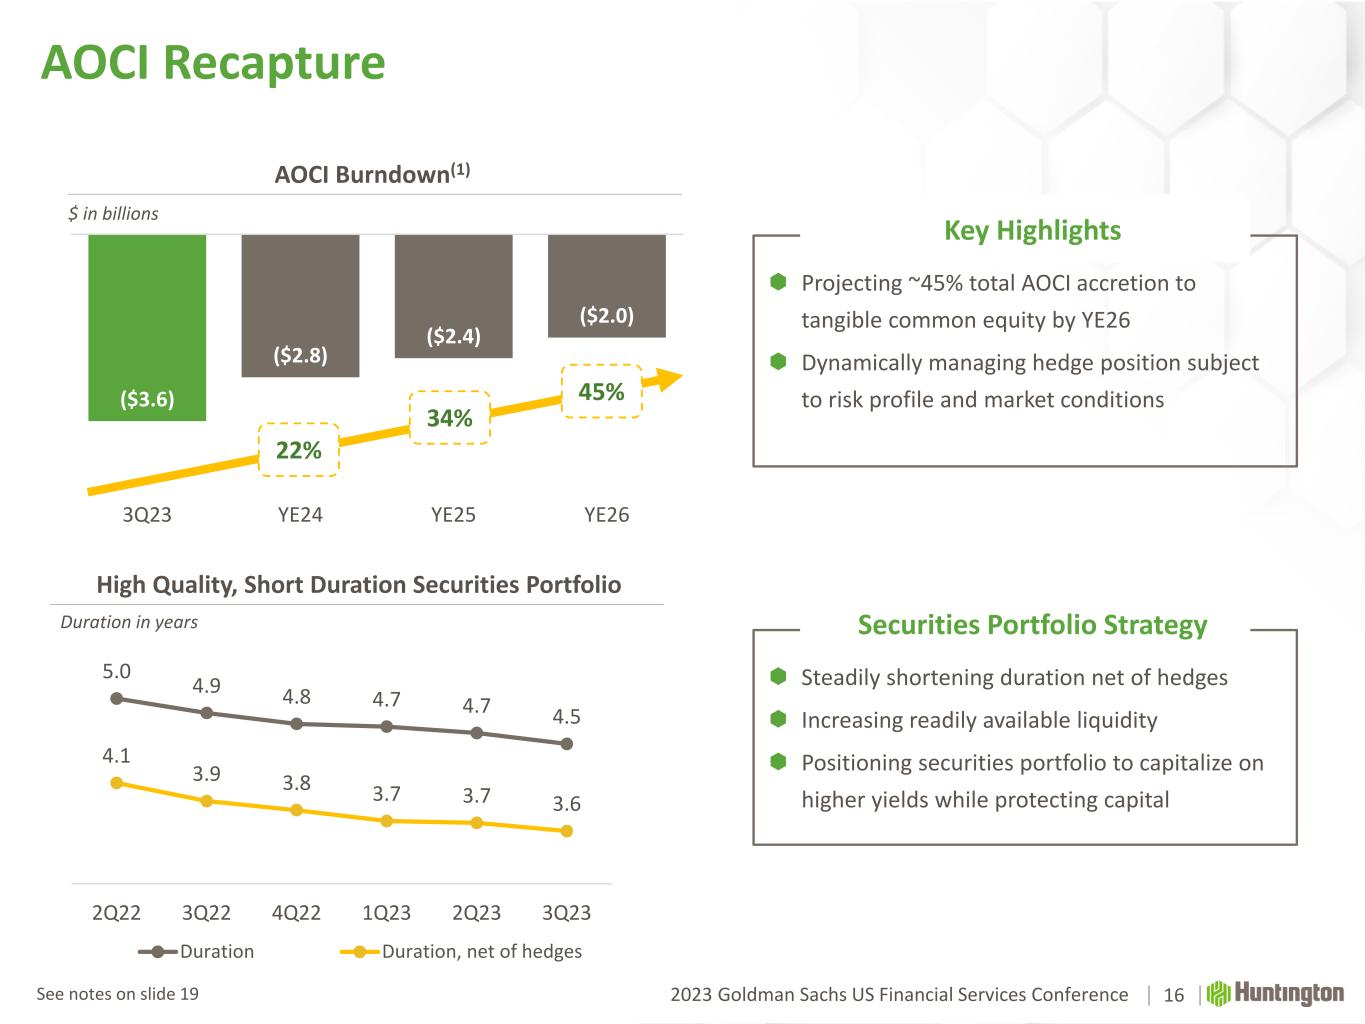
2023 Goldman Sachs US Financial Services Conference AOCI Recapture 16 High Quality, Short Duration Securities Portfolio AOCI Burndown(1) ($3.6) ($2.8) ($2.4) ($2.0) 3Q23 YE24 YE25 YE26 32% 40% Steadily shortening duration net of hedges Increasing readily available liquidity Positioning securities portfolio to capitalize on higher yields while protecting capital Securities Portfolio Strategy 5.0 4.9 4.8 4.7 4.7 4.5 4.1 3.9 3.8 3.7 3.7 3.6 3.0 3.5 4.0 4.5 5.0 5.5 2Q22 3Q22 4Q22 1Q23 2Q23 3Q23 Duration Duration, net of hedges 22% 4 45 Projecting ~45% total AOCI accretion to tangible common equity by YE26 Dynamically managing hedge position subject to risk profile and market conditions Key Highlights $ in billions Duration in years See notes on slide 19
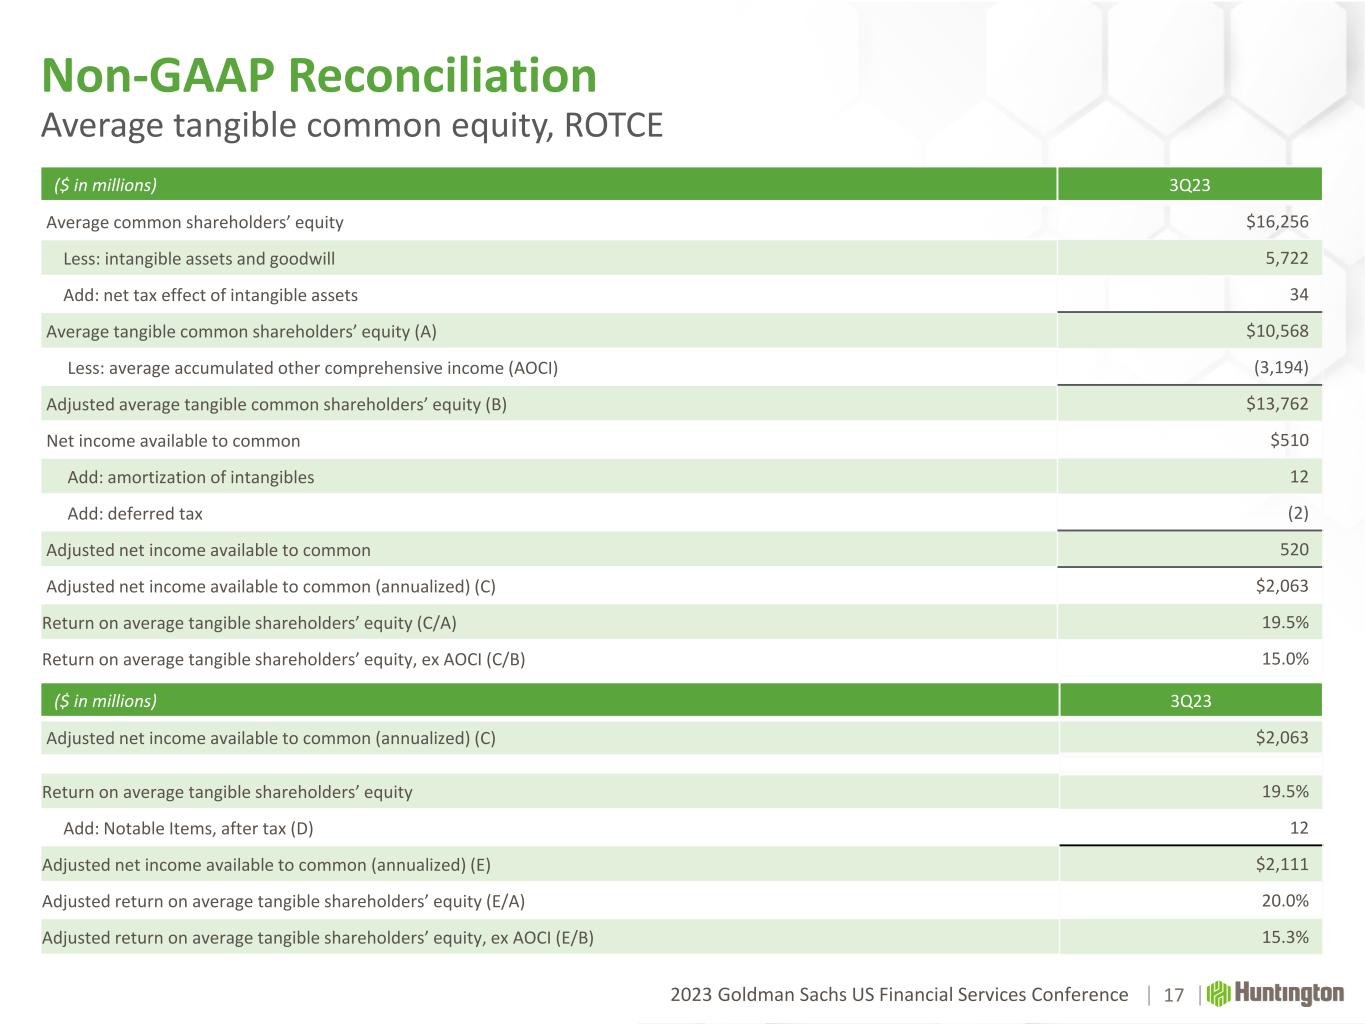
2023 Goldman Sachs US Financial Services Conference Non-GAAP Reconciliation Average tangible common equity, ROTCE ($ in millions) 3Q23 Average common shareholders’ equity $16,256 Less: intangible assets and goodwill 5,722 Add: net tax effect of intangible assets 34 Average tangible common shareholders’ equity (A) $10,568 Less: average accumulated other comprehensive income (AOCI) (3,194) Adjusted average tangible common shareholders’ equity (B) $13,762 Net income available to common $510 Add: amortization of intangibles 12 Add: deferred tax (2) Adjusted net income available to common 520 Adjusted net income available to common (annualized) (C) $2,063 Return on average tangible shareholders’ equity (C/A) 19.5% Return on average tangible shareholders’ equity, ex AOCI (C/B) 15.0% ($ in millions) 3Q23 Adjusted net income available to common (annualized) (C) $2,063 Return on average tangible shareholders’ equity 19.5% Add: Notable Items, after tax (D) 12 Adjusted net income available to common (annualized) (E) $2,111 Adjusted return on average tangible shareholders’ equity (E/A) 20.0% Adjusted return on average tangible shareholders’ equity, ex AOCI (E/B) 15.3% 17
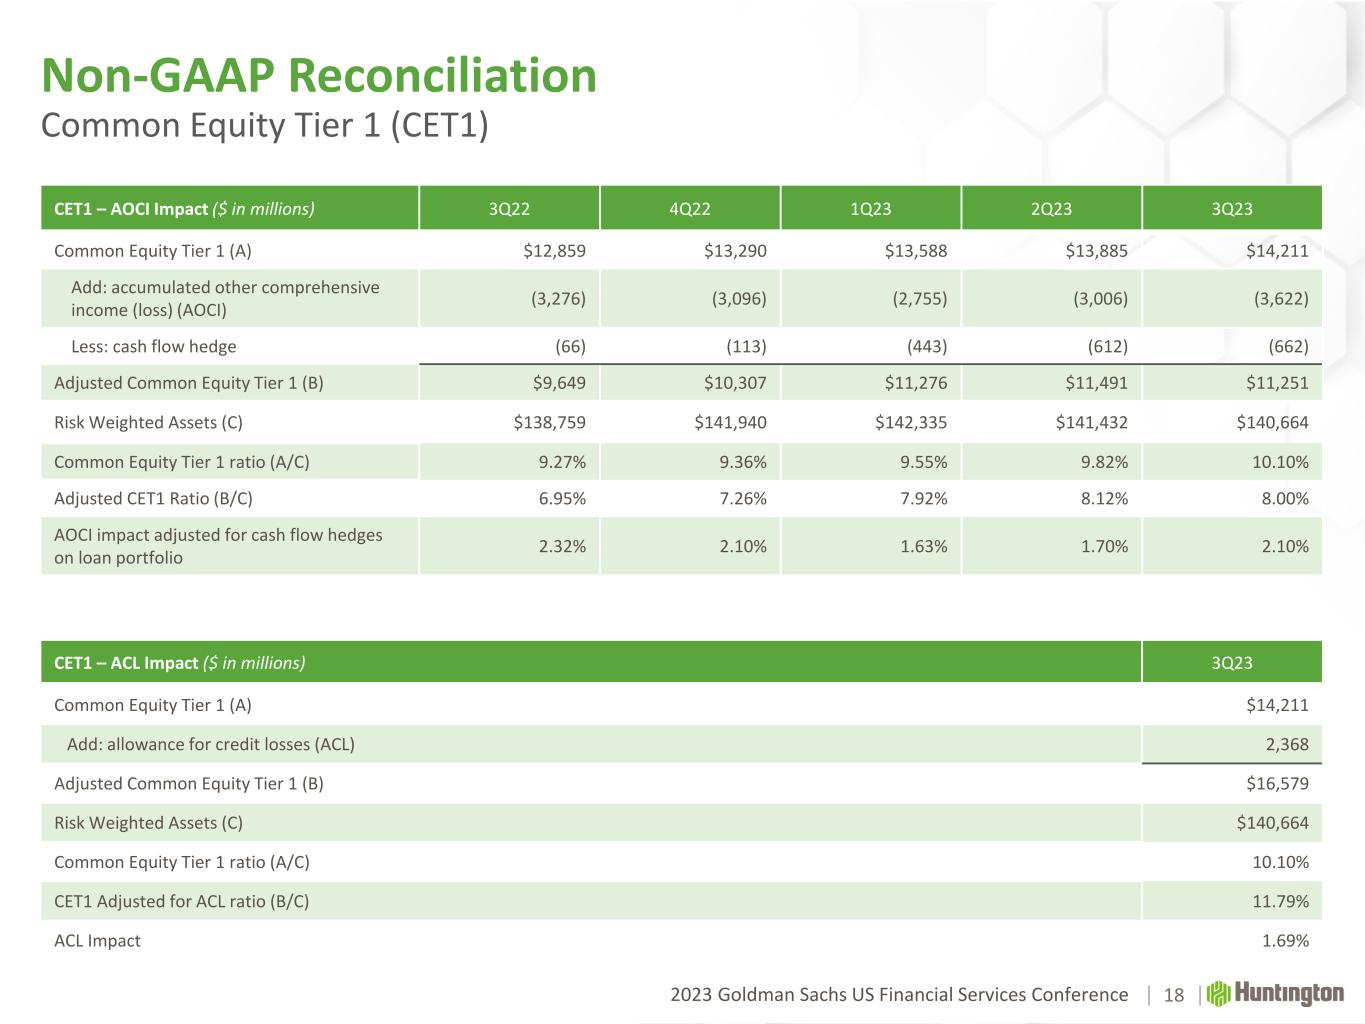
2023 Goldman Sachs US Financial Services Conference 18 Non-GAAP Reconciliation Common Equity Tier 1 (CET1) CET1 – AOCI Impact ($ in millions) 3Q22 4Q22 1Q23 2Q23 3Q23 Common Equity Tier 1 (A) $12,859 $13,290 $13,588 $13,885 $14,211 Add: accumulated other comprehensive income (loss) (AOCI) (3,276) (3,096) (2,755) (3,006) (3,622) Less: cash flow hedge (66) (113) (443) (612) (662) Adjusted Common Equity Tier 1 (B) $9,649 $10,307 $11,276 $11,491 $11,251 Risk Weighted Assets (C) $138,759 $141,940 $142,335 $141,432 $140,664 Common Equity Tier 1 ratio (A/C) 9.27% 9.36% 9.55% 9.82% 10.10% Adjusted CET1 Ratio (B/C) 6.95% 7.26% 7.92% 8.12% 8.00% AOCI impact adjusted for cash flow hedges on loan portfolio 2.32% 2.10% 1.63% 1.70% 2.10% CET1 – ACL Impact ($ in millions) 3Q23 Common Equity Tier 1 (A) $14,211 Add: allowance for credit losses (ACL) 2,368 Adjusted Common Equity Tier 1 (B) $16,579 Risk Weighted Assets (C) $140,664 Common Equity Tier 1 ratio (A/C) 10.10% CET1 Adjusted for ACL ratio (B/C) 11.79% ACL Impact 1.69%
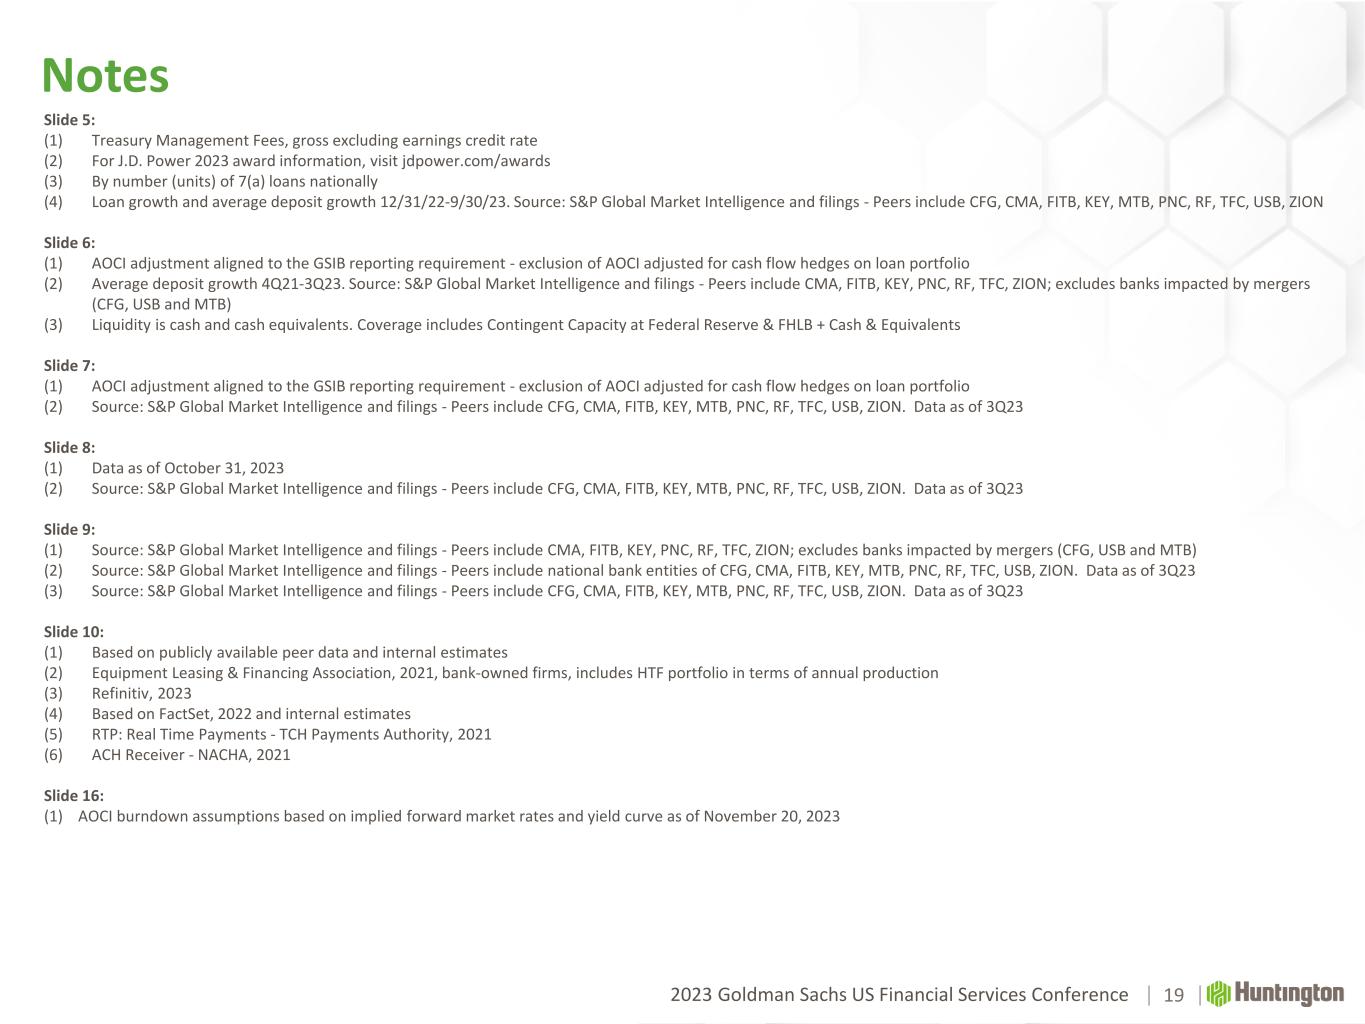
2023 Goldman Sachs US Financial Services Conference Notes 19 Slide 5: (1) Treasury Management Fees, gross excluding earnings credit rate (2) For J.D. Power 2023 award information, visit jdpower.com/awards (3) By number (units) of 7(a) loans nationally (4) Loan growth and average deposit growth 12/31/22-9/30/23. Source: S&P Global Market Intelligence and filings - Peers include CFG, CMA, FITB, KEY, MTB, PNC, RF, TFC, USB, ZION Slide 6: (1) AOCI adjustment aligned to the GSIB reporting requirement - exclusion of AOCI adjusted for cash flow hedges on loan portfolio (2) Average deposit growth 4Q21-3Q23. Source: S&P Global Market Intelligence and filings - Peers include CMA, FITB, KEY, PNC, RF, TFC, ZION; excludes banks impacted by mergers (CFG, USB and MTB) (3) Liquidity is cash and cash equivalents. Coverage includes Contingent Capacity at Federal Reserve & FHLB + Cash & Equivalents Slide 7: (1) AOCI adjustment aligned to the GSIB reporting requirement - exclusion of AOCI adjusted for cash flow hedges on loan portfolio (2) Source: S&P Global Market Intelligence and filings - Peers include CFG, CMA, FITB, KEY, MTB, PNC, RF, TFC, USB, ZION. Data as of 3Q23 Slide 8: (1) Data as of October 31, 2023 (2) Source: S&P Global Market Intelligence and filings - Peers include CFG, CMA, FITB, KEY, MTB, PNC, RF, TFC, USB, ZION. Data as of 3Q23 Slide 9: (1) Source: S&P Global Market Intelligence and filings - Peers include CMA, FITB, KEY, PNC, RF, TFC, ZION; excludes banks impacted by mergers (CFG, USB and MTB) (2) Source: S&P Global Market Intelligence and filings - Peers include national bank entities of CFG, CMA, FITB, KEY, MTB, PNC, RF, TFC, USB, ZION. Data as of 3Q23 (3) Source: S&P Global Market Intelligence and filings - Peers include CFG, CMA, FITB, KEY, MTB, PNC, RF, TFC, USB, ZION. Data as of 3Q23 Slide 10: (1) Based on publicly available peer data and internal estimates (2) Equipment Leasing & Financing Association, 2021, bank-owned firms, includes HTF portfolio in terms of annual production (3) Refinitiv, 2023 (4) Based on FactSet, 2022 and internal estimates (5) RTP: Real Time Payments - TCH Payments Authority, 2021 (6) ACH Receiver - NACHA, 2021 Slide 16: (1) AOCI burndown assumptions based on implied forward market rates and yield curve as of November 20, 2023