EX-99.1
Published on May 8, 2023
Welcome.® 2023 Barclays Americas Select Franchise Conference May 9, 2023 The Huntington National Bank is Member FDIC. ®, Huntington® and Huntington. Welcome.® are federally registered service marks of Huntington Bancshares Incorporated. ©2023 Huntington Bancshares Incorporated.
2023 Barclays America Select Franchise Conference2023 Barclays Americas Disclaimer 2 CAUTION REGARDING FORWARD-LOOKING STATEMENTS The information contained or incorporated by reference in this presentation contains certain forward-looking statements, including, but not limited to, certain plans, expectations, goals, projections, and statements, which are not historical facts and are subject to numerous assumptions, risks, and uncertainties. Statements that do not describe historical or current facts, including statements about beliefs and expectations, are forward-looking statements. Forward-looking statements may be identified by words such as expect, anticipate, believe, intend, estimate, plan, target, goal, or similar expressions, or future or conditional verbs such as will, may, might, should, would, could, or similar variations. The forward-looking statements are intended to be subject to the safe harbor provided by Section 27A of the Securities Act of 1933, Section 21E of the Securities Exchange Act of 1934, and the Private Securities Litigation Reform Act of 1995. While there is no assurance that any list of risks and uncertainties or risk factors is complete, below are certain factors which could cause actual results to differ materially from those contained or implied in the forward-looking statements: changes in general economic, political, or industry conditions; deterioration in business and economic conditions, including persistent inflation, supply chain issues or labor shortages; instability in global economic conditions and geopolitical matters, as well as volatility in financial markets; the impact of pandemics, including the COVID-19 pandemic and related variants and mutations, and their impact on the global economy and financial market conditions and our business, results of operations, and financial condition; the impacts related to or resulting from recent bank failures and other volatility, including potential increased regulatory requirements and costs and potential impacts to macroeconomic conditions, which could affect the ability of depository institutions, including us, to attract and retain depositors and to borrow or raise capital; unexpected outflows of uninsured deposits which may require us to sell investment securities at a loss; rising interest rates which could negatively impact the value of our portfolio of investment securities; the loss of value of our investment portfolio which could negatively impact market perceptions of us and could lead to deposit withdrawals; the effects of social media on market perceptions of us and banks generally; cybersecurity risks; uncertainty in U.S. fiscal and monetary policy, including the interest rate policies of the Federal Reserve; volatility and disruptions in global capital and credit markets; movements in interest rates; transition away from LIBOR; competitive pressures on product pricing and services; success, impact, and timing of our business strategies, including market acceptance of any new products or services including those implementing our “Fair Play” banking philosophy; the nature, extent, timing, and results of governmental actions, examinations, reviews, reforms, regulations, and interpretations, including those related to the Dodd-Frank Wall Street Reform and Consumer Protection Act and the Basel III regulatory capital reforms, as well as those involving the OCC, Federal Reserve, FDIC, and CFPB; and other factors that may affect the future results of Huntington. Additional factors that could cause results to differ materially from those described above can be found in Huntington’s Annual Report on Form 10-K for the year ended December 31, 2022 and Quarterly Report on Form 10-Q for the quarter ended March 31, 2023, which are on file with the Securities and Exchange Commission (the “SEC”) and available in the “Investor Relations” section of Huntington’s website http://www.huntington.com, under the heading “Publications and Filings,” and in other documents Huntington files with the SEC. All forward-looking statements speak only as of the date they are made and are based on information available at that time. Huntington does not assume any obligation to update forward-looking statements to reflect circumstances or events that occur after the date the forward-looking statements were made or to reflect the occurrence of unanticipated events except as required by federal securities laws. As forward-looking statements involve significant risks and uncertainties, caution should be exercised against placing undue reliance on such statements.
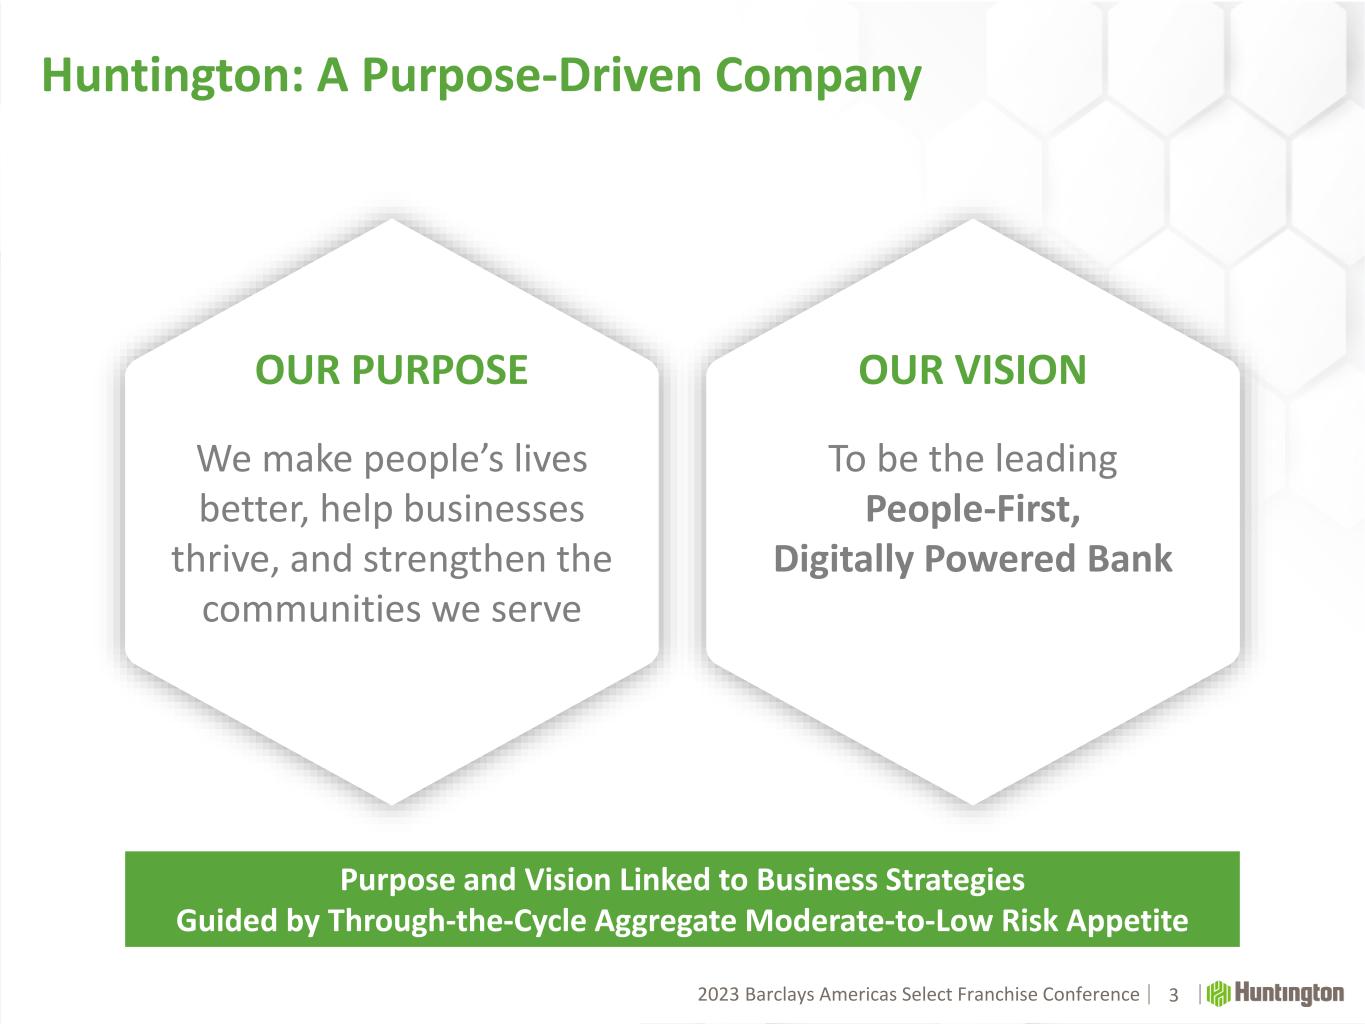
2023 Barclays America Select Franchise Conference2023 Barclays Americas Huntington: A Purpose-Driven Company 3 OUR PURPOSE We make people’s lives better, help businesses thrive, and strengthen the communities we serve OUR VISION To be the leading People-First, Digitally Powered Bank Purpose and Vision Linked to Business Strategies Guided by Through-the-Cycle Aggregate Moderate-to-Low Risk Appetite
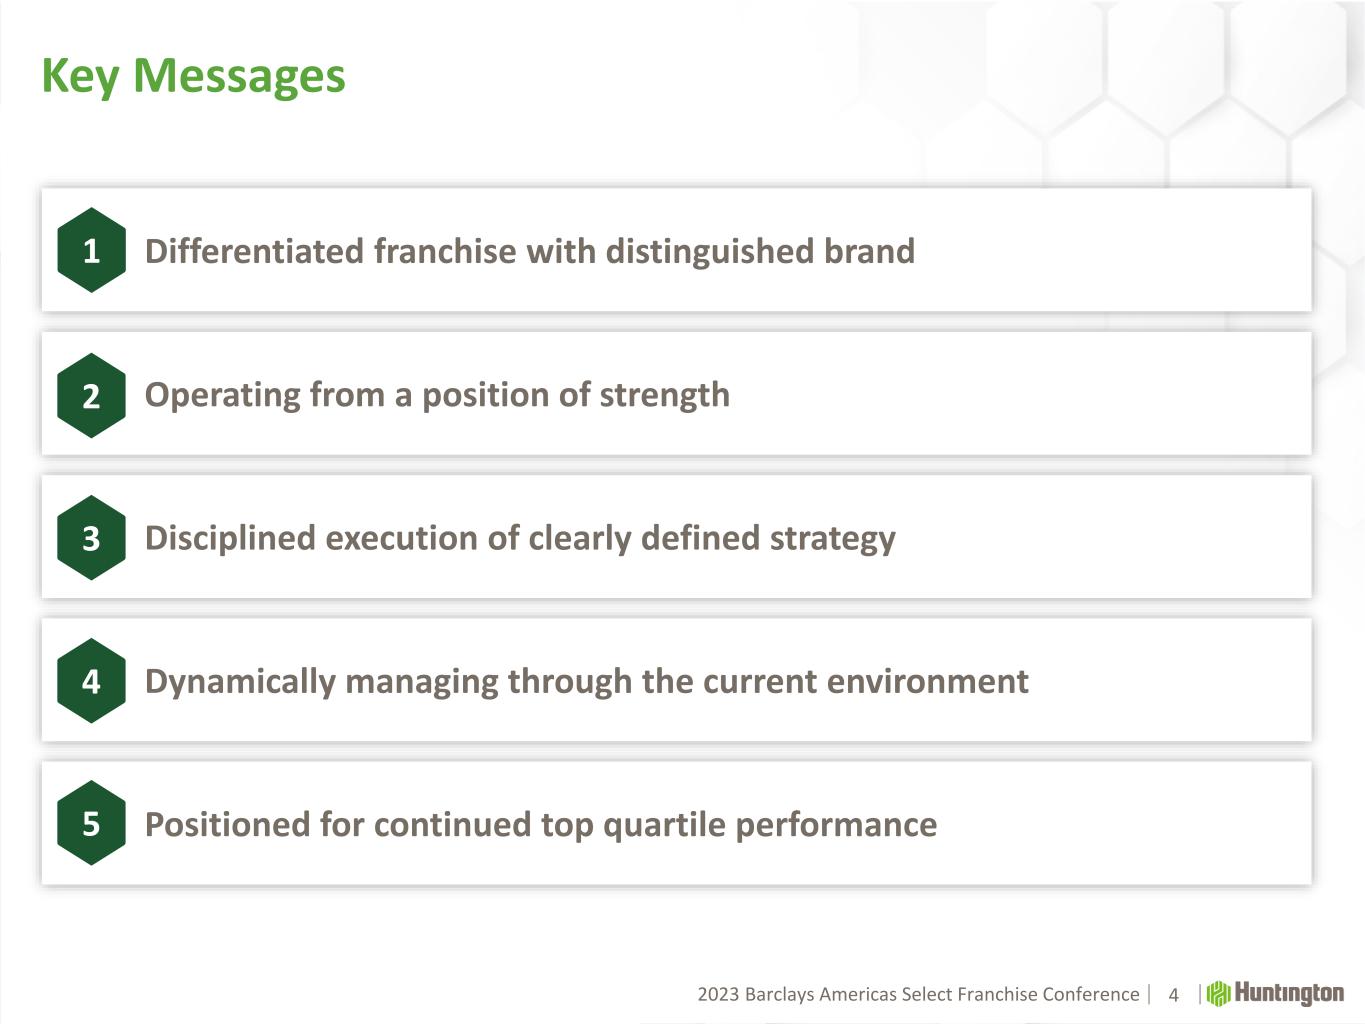
2023 Barclays America Select Franchise Conference2023 Barclays Americas Key Messages Disciplined execution of clearly defined strategy Operating from a position of strength Differentiated franchise with distinguished brand 3 2 1 4 Positioned for continued top quartile performance Dynamically managing through the current environment4 5
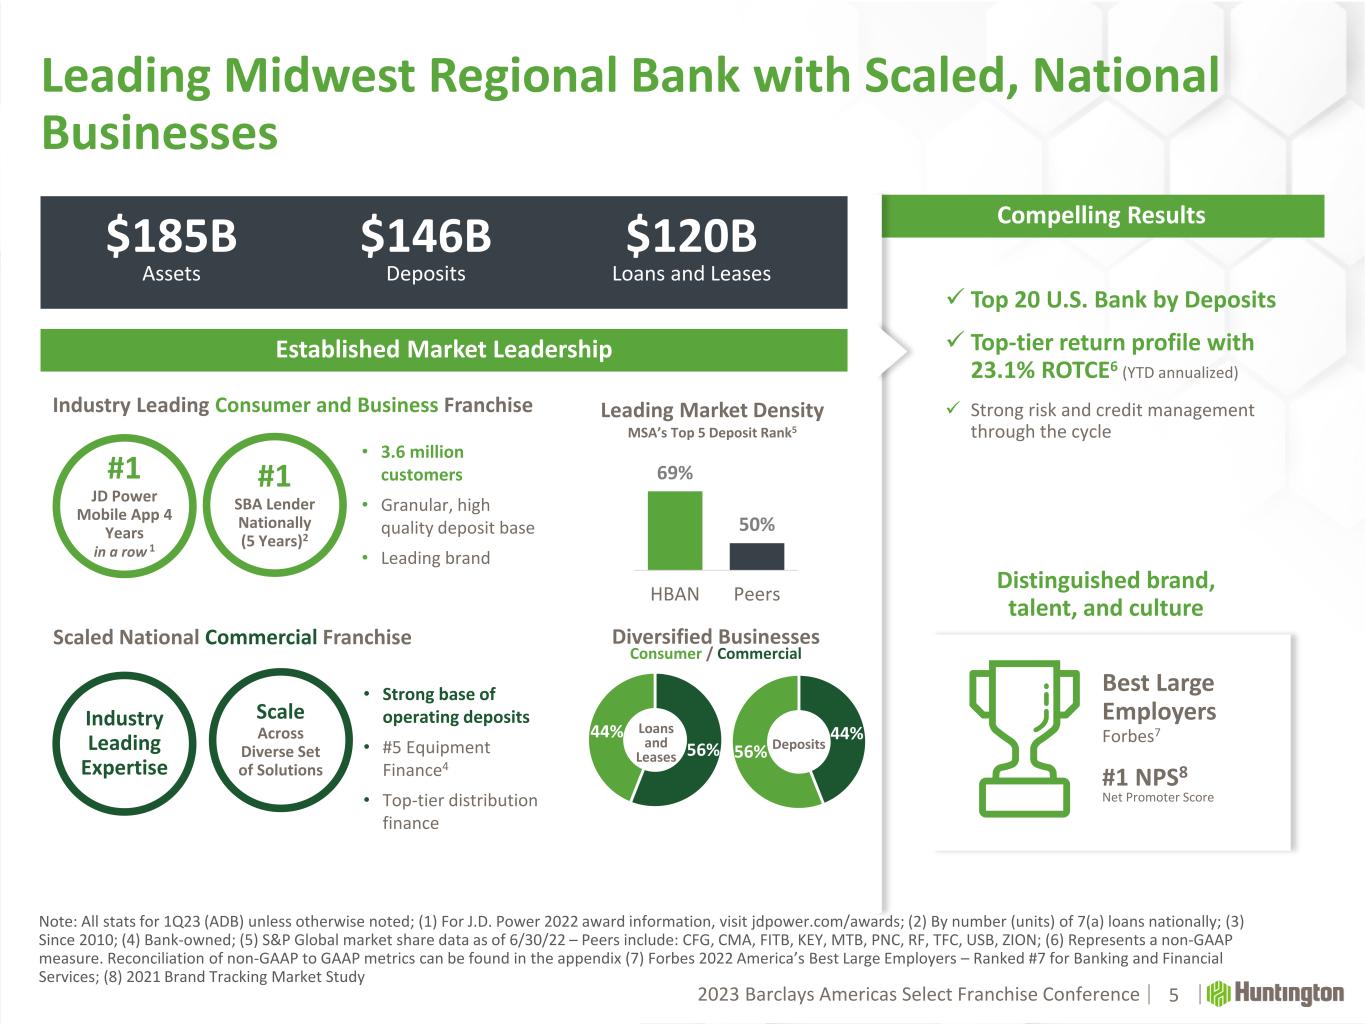
2023 Barclays America Select Franchise Conference2023 Barclays Americas Leading Midwest Regional Bank with Scaled, National Businesses 5 44% 56% #1 SBA Lender Nationally (5 Years)2 #1 NPS8 Net Promoter Score Industry Leading Expertise Scale Across Diverse Set of Solutions Best Large Employers Forbes7 #1 JD Power Mobile App 4 Years in a row 1 $185B Assets $146B Deposits $120B Loans and Leases 69% 50% HBAN Peers Leading Market Density MSA’s Top 5 Deposit Rank5 Top 20 U.S. Bank by Deposits Top-tier return profile with 23.1% ROTCE6 (YTD annualized) Strong risk and credit management through the cycle Established Market Leadership Compelling Results Industry Leading Consumer and Business Franchise Scaled National Commercial Franchise 56% 44% Loans and Leases Deposits Diversified Businesses Consumer / Commercial • 3.6 million customers • Granular, high quality deposit base • Leading brand • Strong base of operating deposits • #5 Equipment Finance4 • Top-tier distribution finance Note: All stats for 1Q23 (ADB) unless otherwise noted; (1) For J.D. Power 2022 award information, visit jdpower.com/awards; (2) By number (units) of 7(a) loans nationally; (3) Since 2010; (4) Bank-owned; (5) S&P Global market share data as of 6/30/22 – Peers include: CFG, CMA, FITB, KEY, MTB, PNC, RF, TFC, USB, ZION; (6) Represents a non-GAAP measure. Reconciliation of non-GAAP to GAAP metrics can be found in the appendix (7) Forbes 2022 America’s Best Large Employers – Ranked #7 for Banking and Financial Services; (8) 2021 Brand Tracking Market Study Distinguished brand, talent, and culture
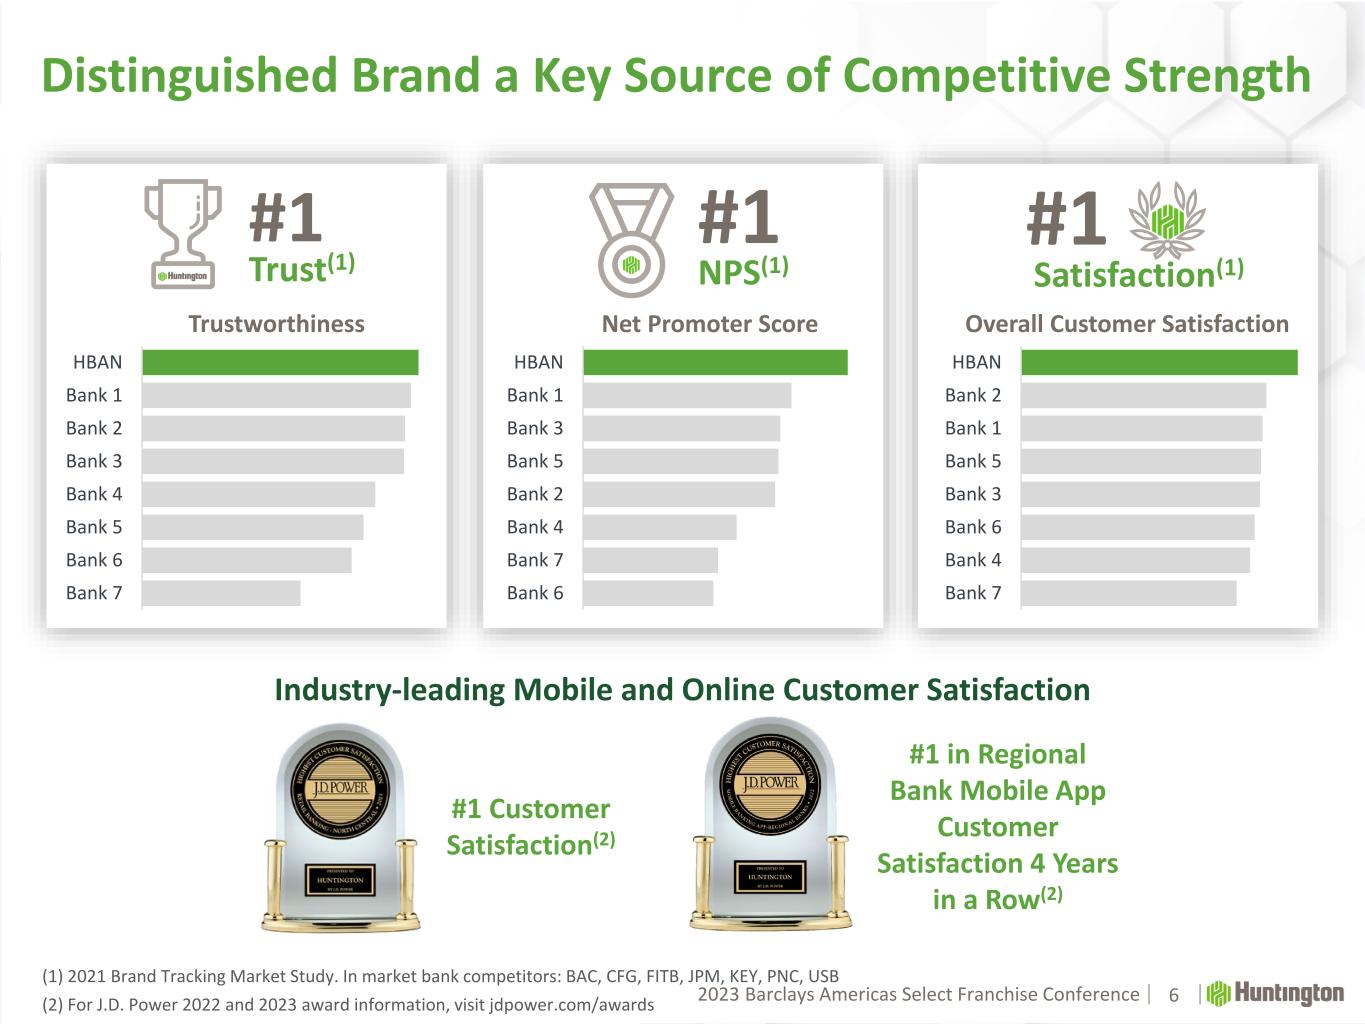
2023 Barclays America Select Franchise Conference2023 Barclays Americas Distinguished Brand a Key Source of Competitive Strength 6 HBAN Bank 1 Bank 3 Bank 5 Bank 2 Bank 4 Bank 7 Bank 6 HBAN Bank 1 Bank 2 Bank 3 Bank 4 Bank 5 Bank 6 Bank 7 HBAN Bank 2 Bank 1 Bank 5 Bank 3 Bank 6 Bank 4 Bank 7 #1 Trust(1) #1 NPS(1) Trustworthiness Net Promoter Score Overall Customer Satisfaction #1 Satisfaction(1) (1) 2021 Brand Tracking Market Study. In market bank competitors: BAC, CFG, FITB, JPM, KEY, PNC, USB (2) For J.D. Power 2022 and 2023 award information, visit jdpower.com/awards Industry-leading Mobile and Online Customer Satisfaction #1 in Regional Bank Mobile App Customer Satisfaction 4 Years in a Row(2) #1 Customer Satisfaction(2)
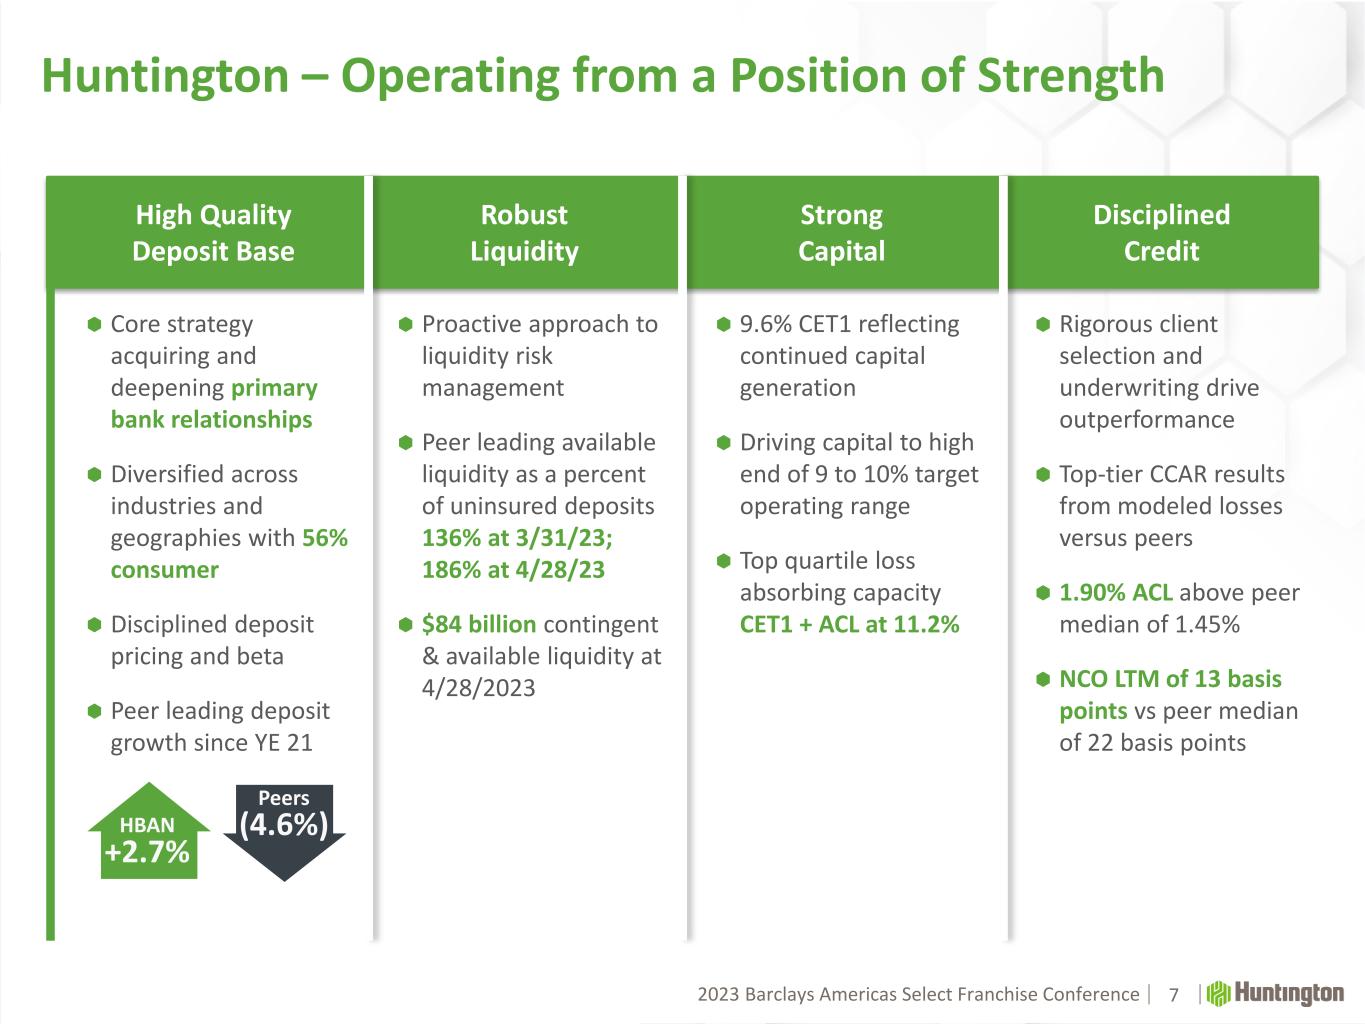
2023 Barclays America Select Franchise Conference2023 Barclays Americas Huntington – Operating from a Position of Strength 7 Disciplined Credit Robust Liquidity High Quality Deposit Base Strong Capital Core strategy acquiring and deepening primary bank relationships Diversified across industries and geographies with 56% consumer Disciplined deposit pricing and beta Peer leading deposit growth since YE 21 9.6% CET1 reflecting continued capital generation Driving capital to high end of 9 to 10% target operating range Top quartile loss absorbing capacity CET1 + ACL at 11.2% Rigorous client selection and underwriting drive outperformance Top-tier CCAR results from modeled losses versus peers 1.90% ACL above peer median of 1.45% NCO LTM of 13 basis points vs peer median of 22 basis points Proactive approach to liquidity risk management Peer leading available liquidity as a percent of uninsured deposits 136% at 3/31/23; 186% at 4/28/23 $84 billion contingent & available liquidity at 4/28/2023 Peers (4.6%)HBAN +2.7%
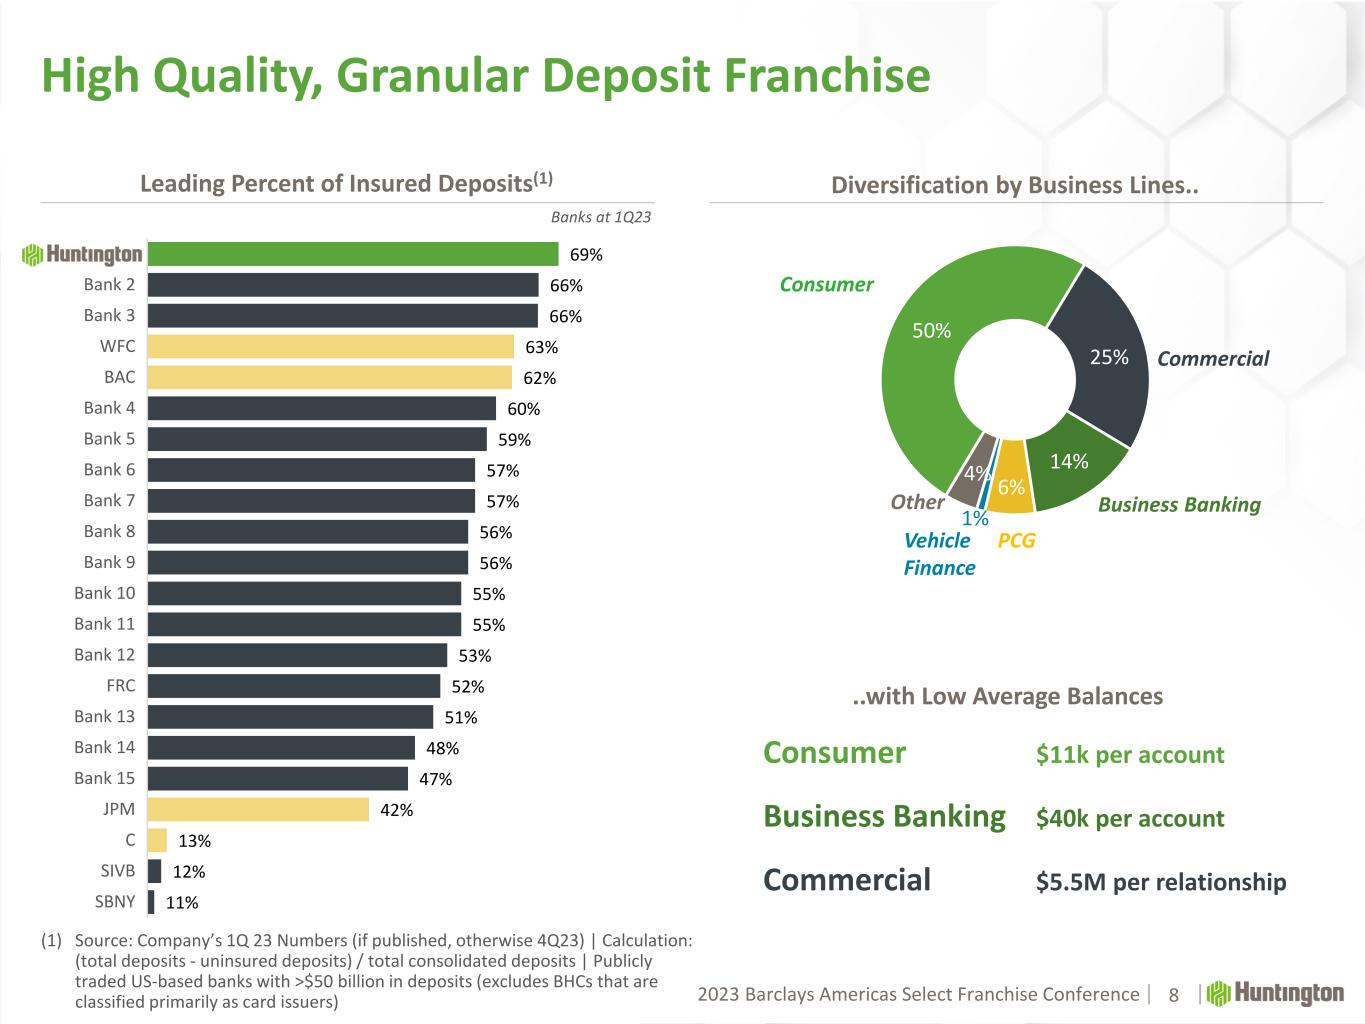
2023 Barclays America Select Franchise Conference2023 Barclays Americas 69% 66% 66% 63% 62% 60% 59% 57% 57% 56% 56% 55% 55% 53% 52% 51% 48% 47% 42% 13% 12% 11% HBAN Bank 2 Bank 3 WFC BAC Bank 4 Bank 5 Bank 6 Bank 7 Bank 8 Bank 9 Bank 10 Bank 11 Bank 12 FRC Bank 13 Bank 14 Bank 15 JPM C SIVB SBNY Leading Percent of Insured Deposits(1) High Quality, Granular Deposit Franchise 8 Diversification by Business Lines.. 50% 25% 14% 6% 1% 4% Consumer Commercial Business Banking PCGVehicle Finance ..with Low Average Balances Consumer $11k per account Business Banking $40k per account Commercial $5.5M per relationship Banks at 1Q23 (1) Source: Company’s 1Q 23 Numbers (if published, otherwise 4Q23) | Calculation: (total deposits - uninsured deposits) / total consolidated deposits | Publicly traded US-based banks with >$50 billion in deposits (excludes BHCs that are classified primarily as card issuers) Other
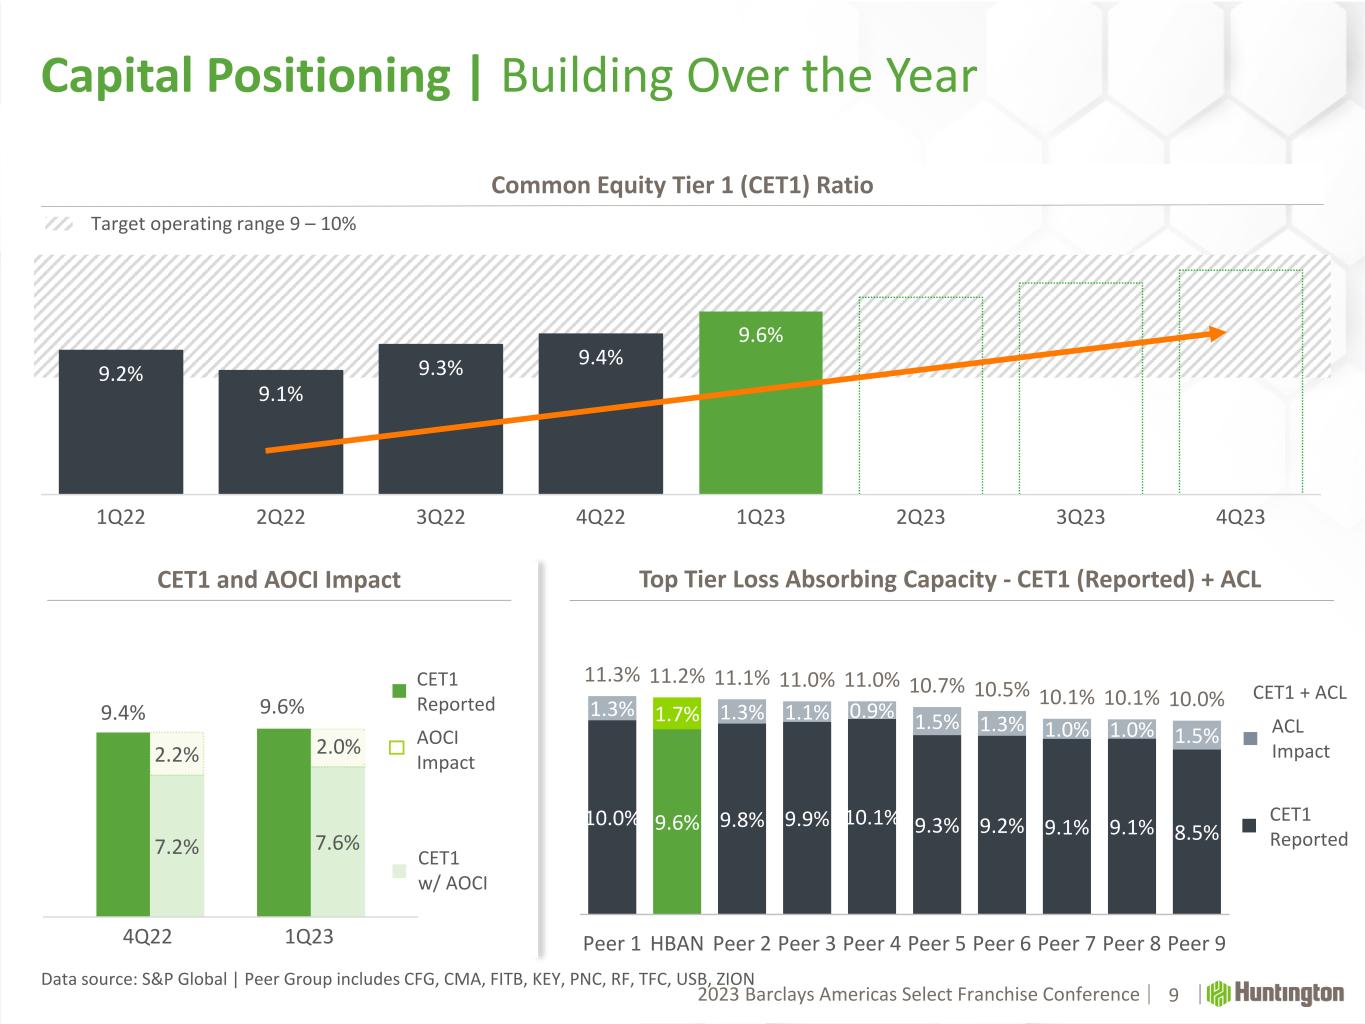
2023 Barclays America Select Franchise Conference2023 Barclays Americas 7.2% 7.6% 2.2% 1.9% 9.4% 9.6% 9.2% 9.1% 9.3% 9.4% 9.6% 1Q22 2Q22 3Q22 4Q22 1Q23 2Q23 3Q23 4Q23 Target operating range 9 – 10% CET1 w/ AOCI Capital Positioning | Building Over the Year Common Equity Tier 1 (CET1) Ratio 9 Data source: S&P Global | Peer Group includes CFG, CMA, FITB, KEY, PNC, RF, TFC, USB, ZION CET1 and AOCI Impact CET1 Reported AOCI Impact 4Q22 1Q23 10.0% 9.6% 9.8% 9.9% 10.1% 9.3% 9.2% 9.1% 9.1% 8.5% 1.3% 1.7% 1.3% 1.1% 0.9% 1.5% 1.3% 1.0% 1.0% 1.5% 11.3% 11.2% 11.1% 11.0% 11.0% 10.7% 10.5% 10.1% 10.1% 10.0% Peer 1 HBAN Peer 2 Peer 3 Peer 4 Peer 5 Peer 6 Peer 7 Peer 8 Peer 9 2 0 Top Tier Loss Absorbing Capacity - CET1 (Reported) + ACL CET1 Reported ACL Impact CET1 + ACL
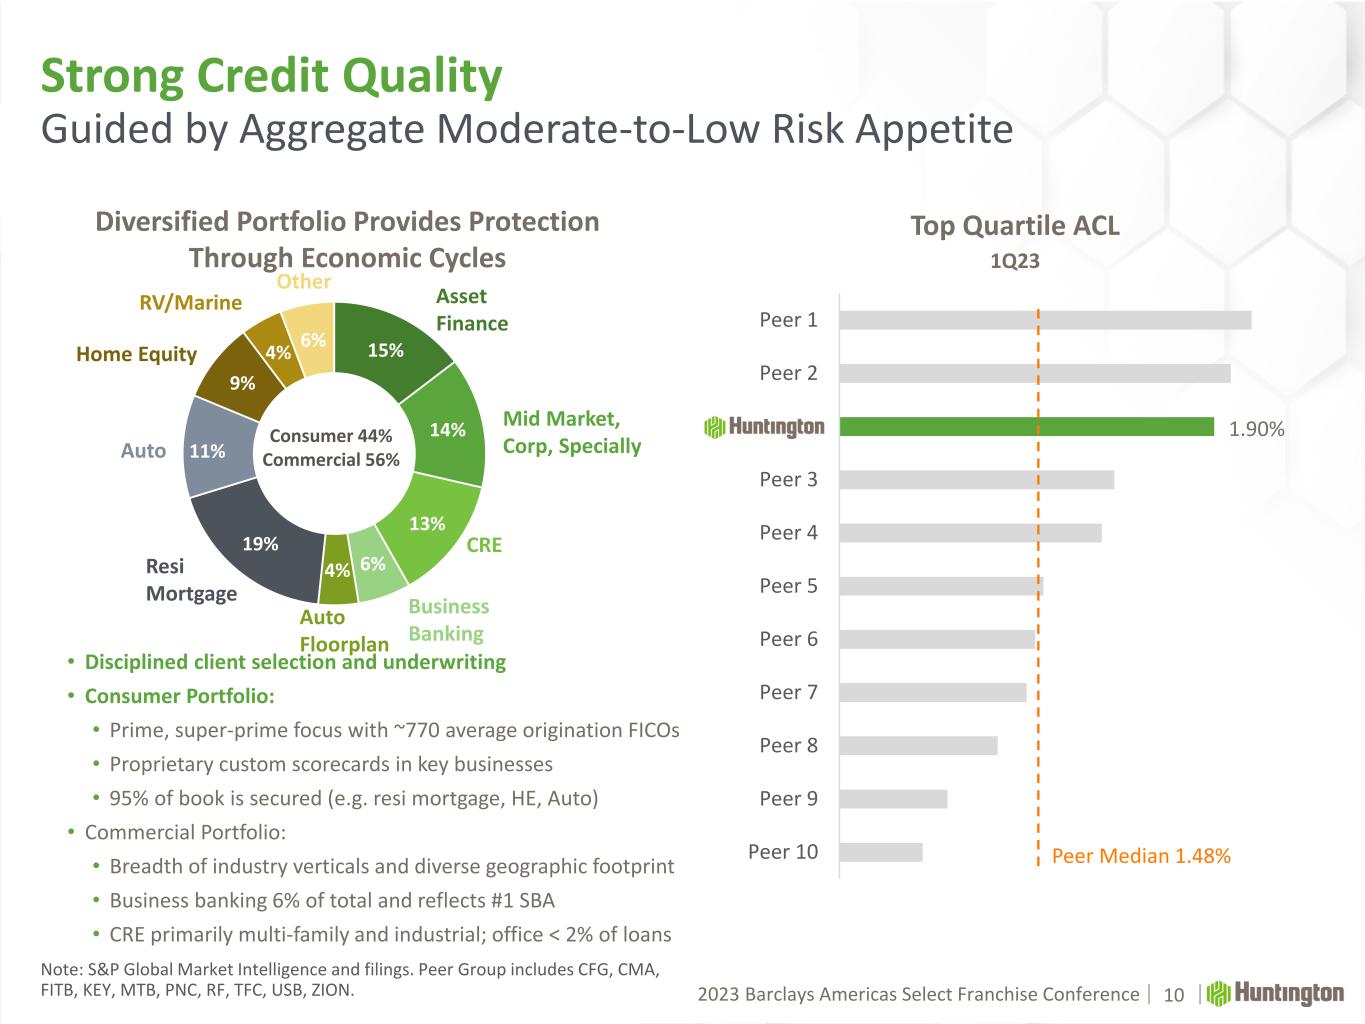
2023 Barclays America Select Franchise Conference2023 Barclays Americas 15% 14% 13% 6%4% 19% 11% 9% 4% 6% Peer 1 Peer 2 HBAN Peer 3 Peer 4 Peer 5 Peer 6 Peer 7 Peer 8 Peer 9 Peer 10 Strong Credit Quality Guided by Aggregate Moderate-to-Low Risk Appetite 10 Top Quartile ACL 1Q23 1.90% Note: S&P Global Market Intelligence and filings. Peer Group includes CFG, CMA, FITB, KEY, MTB, PNC, RF, TFC, USB, ZION. CRE Resi Mortgage Mid Market, Corp, Specially Asset Finance Diversified Portfolio Provides Protection Through Economic Cycles Home Equity RV/Marine • Disciplined client selection and underwriting • Consumer Portfolio: • Prime, super-prime focus with ~770 average origination FICOs • Proprietary custom scorecards in key businesses • 95% of book is secured (e.g. resi mortgage, HE, Auto) • Commercial Portfolio: • Breadth of industry verticals and diverse geographic footprint • Business banking 6% of total and reflects #1 SBA • CRE primarily multi-family and industrial; office < 2% of loans Peer Median 1.48% Auto Other Consumer 44% Commercial 56% Business Banking Auto Floorplan
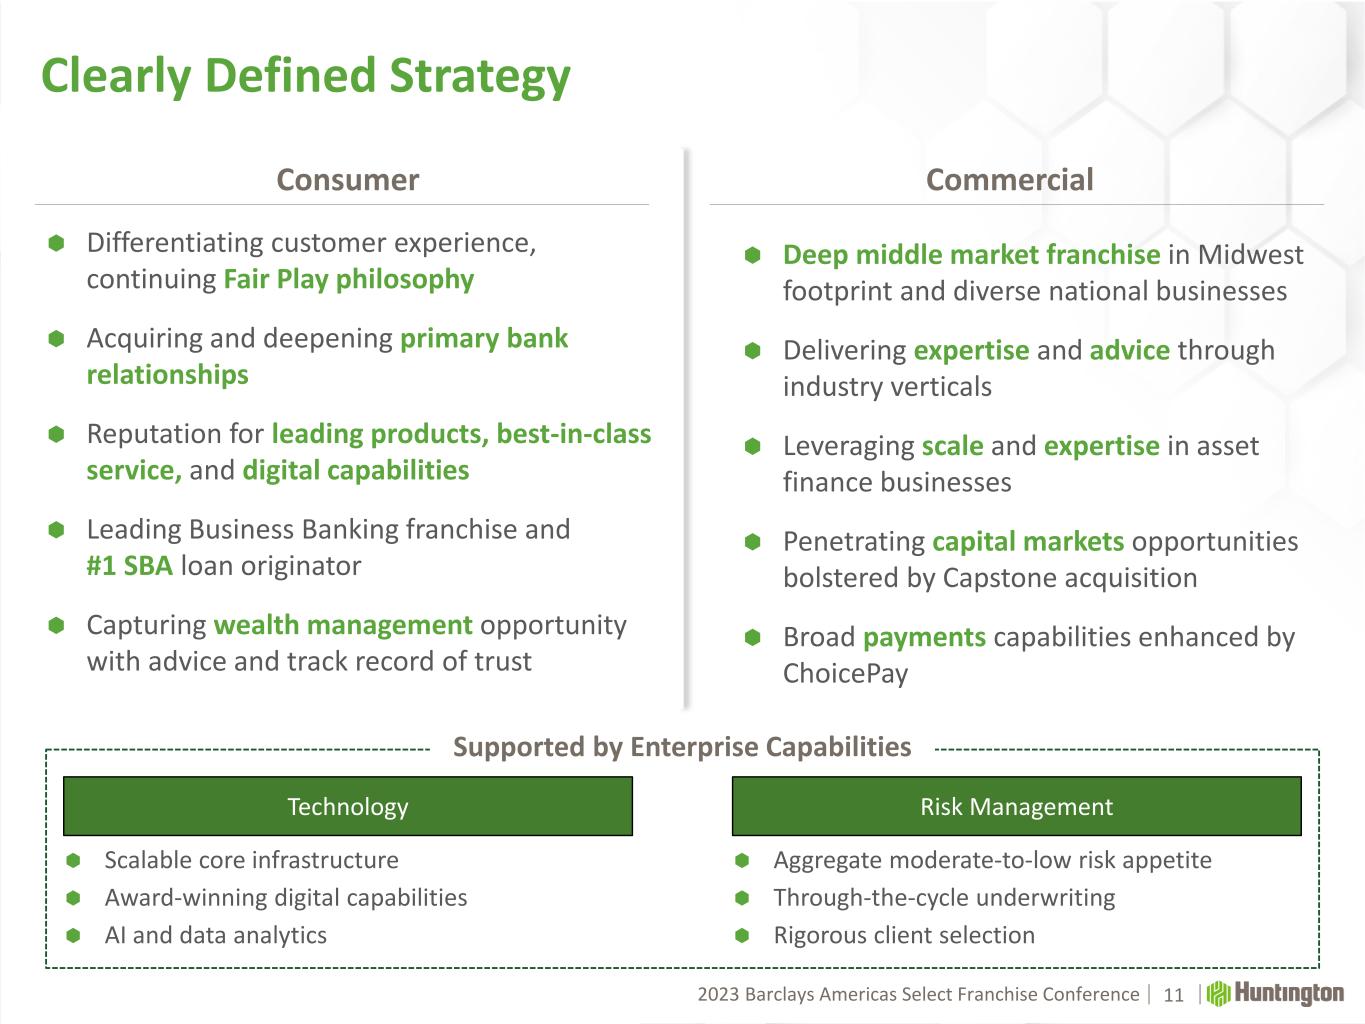
2023 Barclays America Select Franchise Conference2023 Barclays Americas Scalable core infrastructure Award-winning digital capabilities AI and data analytics Clearly Defined Strategy 11 CommercialConsumer Differentiating customer experience, continuing Fair Play philosophy Acquiring and deepening primary bank relationships Reputation for leading products, best-in-class service, and digital capabilities Leading Business Banking franchise and #1 SBA loan originator Capturing wealth management opportunity with advice and track record of trust Deep middle market franchise in Midwest footprint and diverse national businesses Delivering expertise and advice through industry verticals Leveraging scale and expertise in asset finance businesses Penetrating capital markets opportunities bolstered by Capstone acquisition Broad payments capabilities enhanced by ChoicePay Technology Supported by Enterprise Capabilities Risk Management Aggregate moderate-to-low risk appetite Through-the-cycle underwriting Rigorous client selection
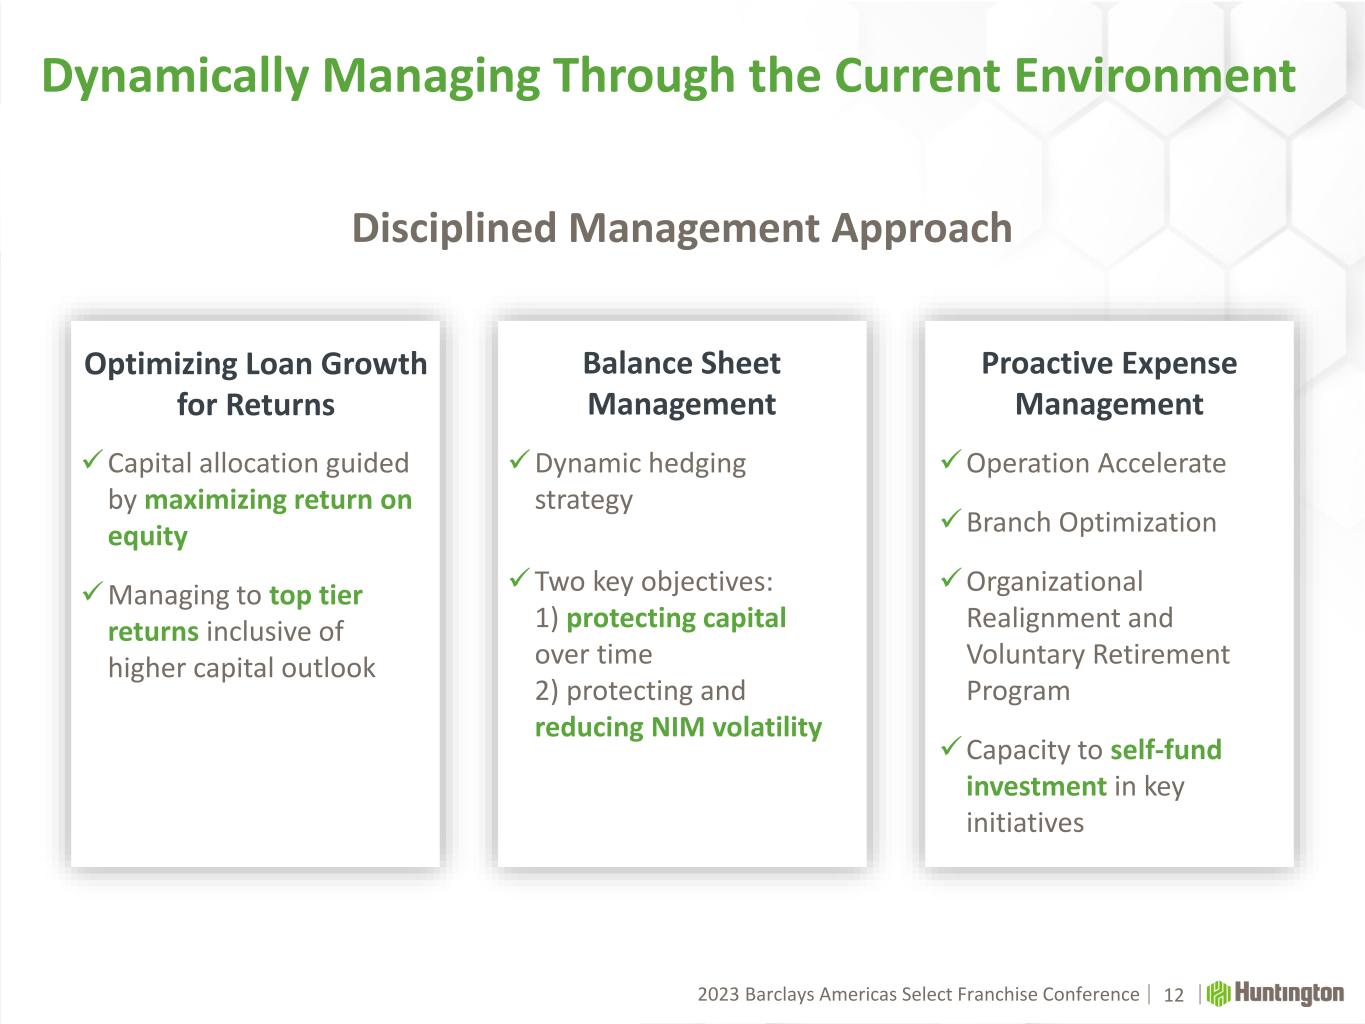
2023 Barclays America Select Franchise Conference2023 Barclays Americas Dynamically Managing Through the Current Environment 12 Disciplined Management Approach Optimizing Loan Growth for Returns Balance Sheet Management Proactive Expense Management Capital allocation guided by maximizing return on equity Managing to top tier returns inclusive of higher capital outlook Dynamic hedging strategy Two key objectives: 1) protecting capital over time 2) protecting and reducing NIM volatility Operation Accelerate Branch Optimization Organizational Realignment and Voluntary Retirement Program Capacity to self-fund investment in key initiatives
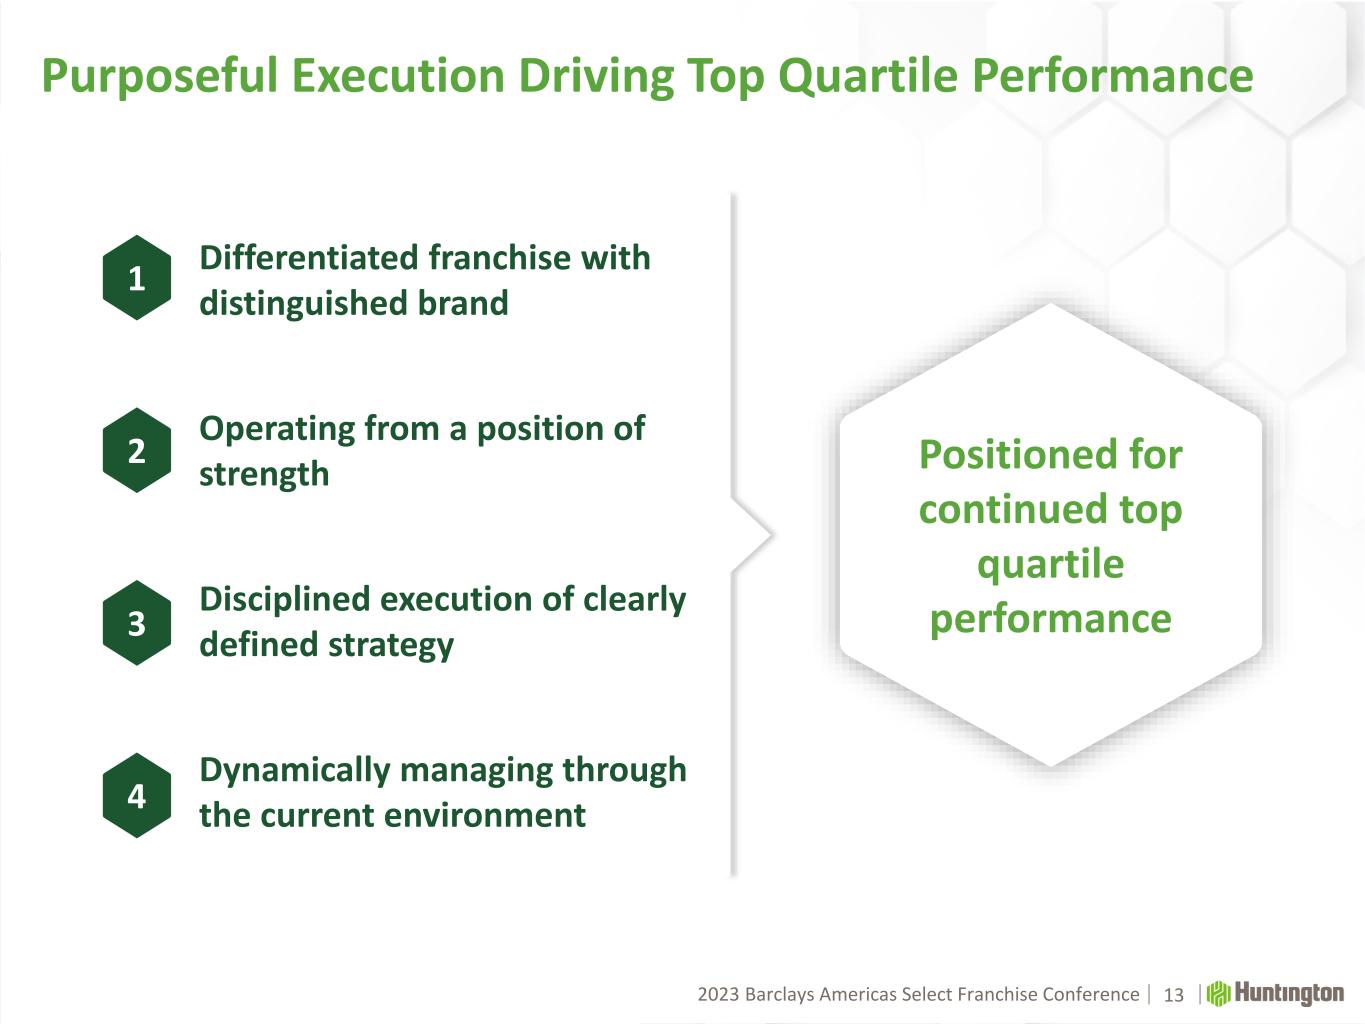
2023 Barclays America Select Franchise Conference2023 Barclays Americas Purposeful Execution Driving Top Quartile Performance 13 Differentiated franchise with distinguished brand Operating from a position of strength Disciplined execution of clearly defined strategy Dynamically managing through the current environment 1 2 3 4 Positioned for continued top quartile performance