EX-99.1
Published on April 19, 2023

Internal Use Welcome.® 2023 Annual Shareholders’ Meeting April 19, 2023 The Huntington National Bank is Member FDIC. ®, Huntington® and Huntington. Welcome.® are federally registered service marks of Huntington Bancshares Incorporated. ©2023 Huntington Bancshares Incorporated.
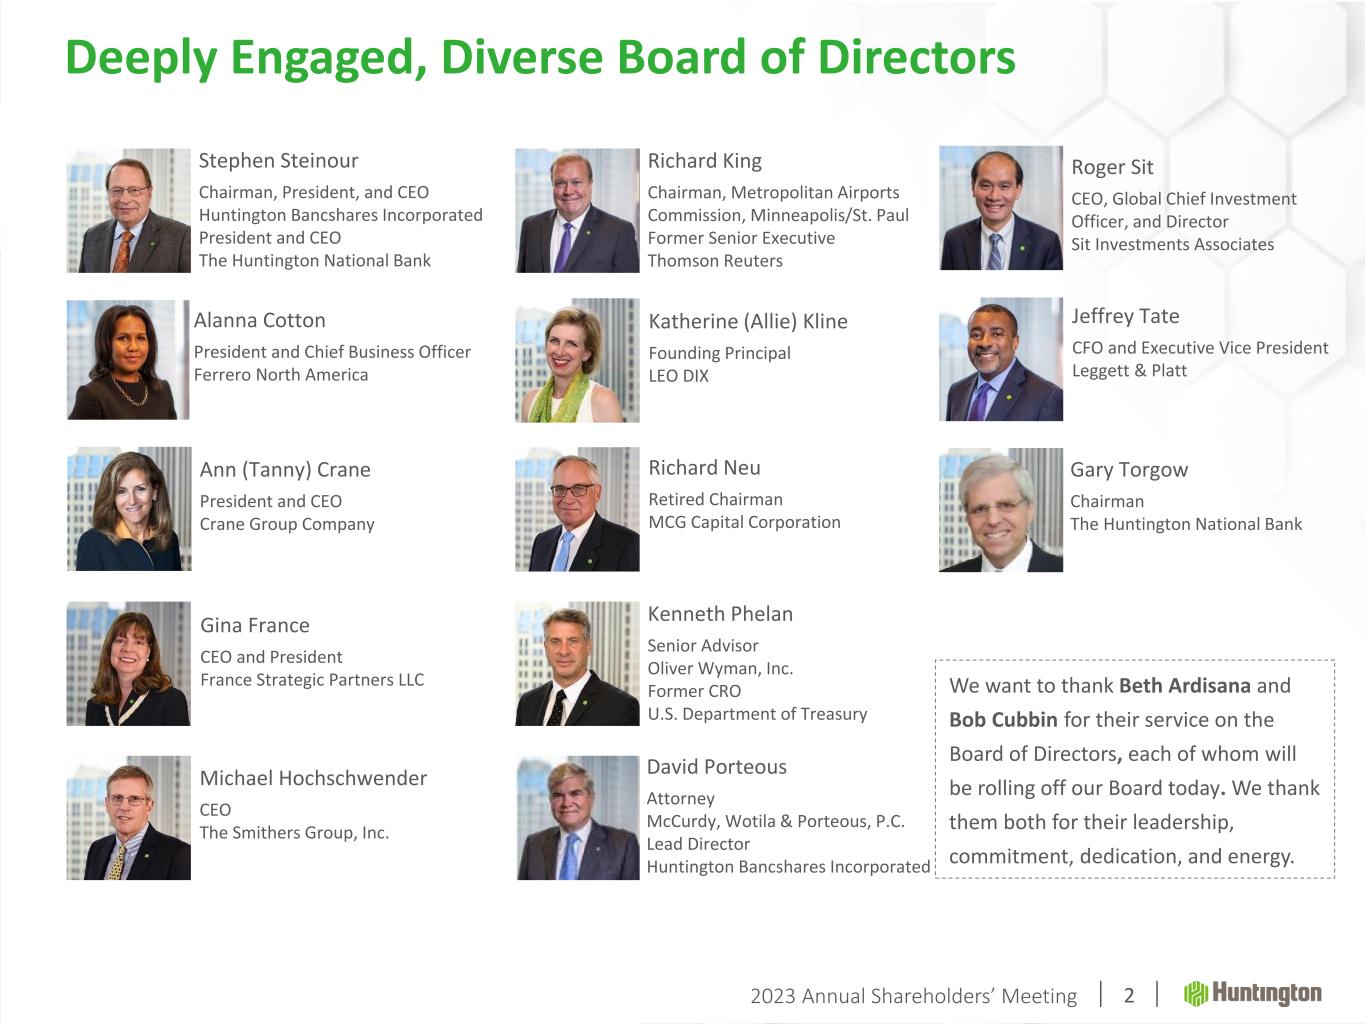
2023 Annual Shareholders’ Meeting 2 Deeply Engaged, Diverse Board of Directors Stephen Steinour Chairman, President, and CEO Huntington Bancshares Incorporated President and CEO The Huntington National Bank Ann (Tanny) Crane President and CEO Crane Group Company Gina France CEO and President France Strategic Partners LLC Katherine (Allie) Kline Founding Principal LEO DIX Kenneth Phelan Senior Advisor Oliver Wyman, Inc. Former CRO U.S. Department of Treasury Michael Hochschwender CEO The Smithers Group, Inc. Richard Neu Retired Chairman MCG Capital Corporation David Porteous Attorney McCurdy, Wotila & Porteous, P.C. Lead Director Huntington Bancshares Incorporated Alanna Cotton President and Chief Business Officer Ferrero North America Richard King Chairman, Metropolitan Airports Commission, Minneapolis/St. Paul Former Senior Executive Thomson Reuters Roger Sit CEO, Global Chief Investment Officer, and Director Sit Investments Associates Gary Torgow Chairman The Huntington National Bank Jeffrey Tate CFO and Executive Vice President Leggett & Platt We want to thank Beth Ardisana and Bob Cubbin for their service on the Board of Directors, each of whom will be rolling off our Board today. We thank them both for their leadership, commitment, dedication, and energy.

2023 Annual Shareholders’ Meeting 3 Welcome.® The Huntington National Bank is Member FDIC. ®, Huntington® and Huntington. Welcome.® are federally registered service marks of Huntington Bancshares Incorporated. ©2023 Huntington Bancshares Incorporated.
2023 Annual Shareholders’ Meeting 4 CAUTION REGARDING FORWARD-LOOKING STATEMENTS The information contained or incorporated by reference in this Current Report on Form 8-K contains certain forward-looking statements, including, but not limited to, certain plans, expectations, goals, projections, and statements, which are not historical facts and are subject to numerous assumptions, risks, and uncertainties. Statements that do not describe historical or current facts, including statements about beliefs and expectations, are forward-looking statements. Forward-looking statements may be identified by words such as expect, anticipate, believe, intend, estimate, plan, target, goal, or similar expressions, or future or conditional verbs such as will, may, might, should, would, could, or similar variations. The forward-looking statements are intended to be subject to the safe harbor provided by Section 27A of the Securities Act of 1933, Section 21E of the Securities Exchange Act of 1934, and the Private Securities Litigation Reform Act of 1995. While there is no assurance that any list of risks and uncertainties or risk factors is complete, below are certain factors which could cause actual results to differ materially from those contained or implied in the forward-looking statements: changes in general economic, political, or industry conditions; deterioration in business and economic conditions, including persistent inflation, supply chain issues or labor shortages; instability in global economic conditions and geopolitical matters, as well as volatility in financial markets; the impact of pandemics, including the COVID-19 pandemic and related variants and mutations, and their impact on the global economy and financial market conditions and our business, results of operations, and financial condition; cybersecurity risks; uncertainty in U.S. fiscal and monetary policy, including the interest rate policies of the Federal Reserve; volatility and disruptions in global capital and credit markets; movements in interest rates; transition away from LIBOR; competitive pressures on product pricing and services; success, impact, and timing of our business strategies, including market acceptance of any new products or services including those implementing our “Fair Play” banking philosophy; the nature, extent, timing, and results of governmental actions, examinations, reviews, reforms, regulations, and interpretations, including those related to the Dodd-Frank Wall Street Reform and Consumer Protection Act and the Basel III regulatory capital reforms, as well as those involving the OCC, Federal Reserve, FDIC, and CFPB; and other factors that may affect the future results of Huntington. Additional factors that could cause results to differ materially from those described above can be found in Huntington’s Annual Report on Form 10-K for the year ended December 31, 2022, which is on file with the Securities and Exchange Commission (the “SEC”) and available in the “Investor Relations” section of Huntington’s website http://www.huntington.com, under the heading “Publications and Filings” and in other documents Huntington files with the SEC. All forward-looking statements speak only as of the date they are made and are based on information available at that time. Huntington does not assume any obligation to update forward-looking statements to reflect circumstances or events that occur after the date the forward- looking statements were made or to reflect the occurrence of unanticipated events except as required by federal securities laws. As forward- looking statements involve significant risks and uncertainties, caution should be exercised against placing undue reliance on such statements. Disclaimer

Chairman’s Presentation: Discussion Topics 2022 Year in Review Business / Strategy Update
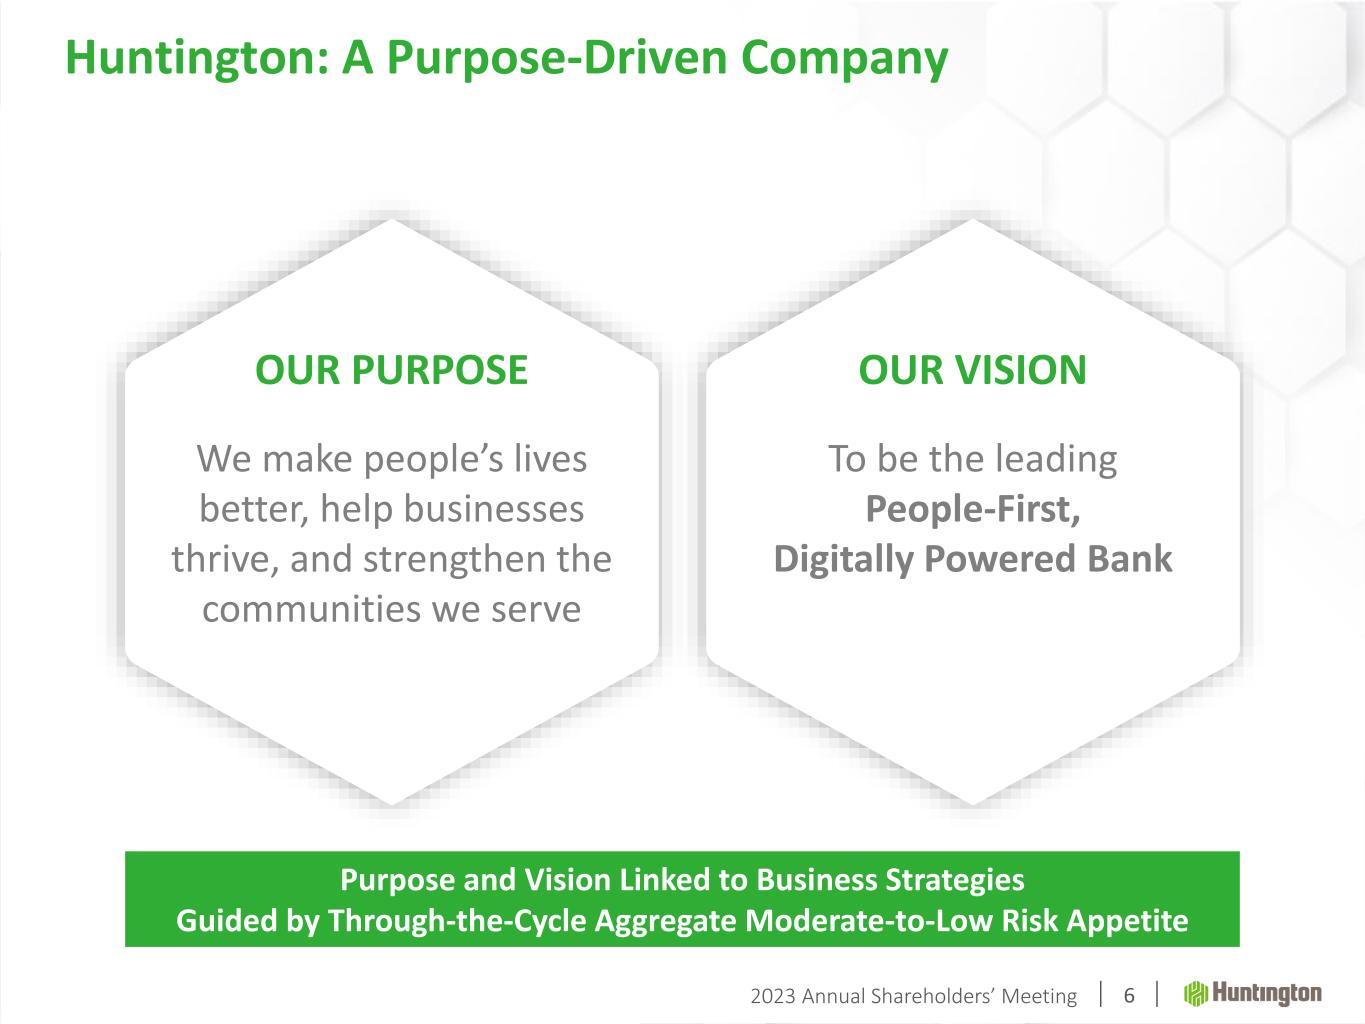
2023 Annual Shareholders’ Meeting 6 OUR PURPOSE We make people’s lives better, help businesses thrive, and strengthen the communities we serve OUR VISION To be the leading People-First, Digitally Powered Bank Purpose and Vision Linked to Business Strategies Guided by Through-the-Cycle Aggregate Moderate-to-Low Risk Appetite Huntington: A Purpose-Driven Company
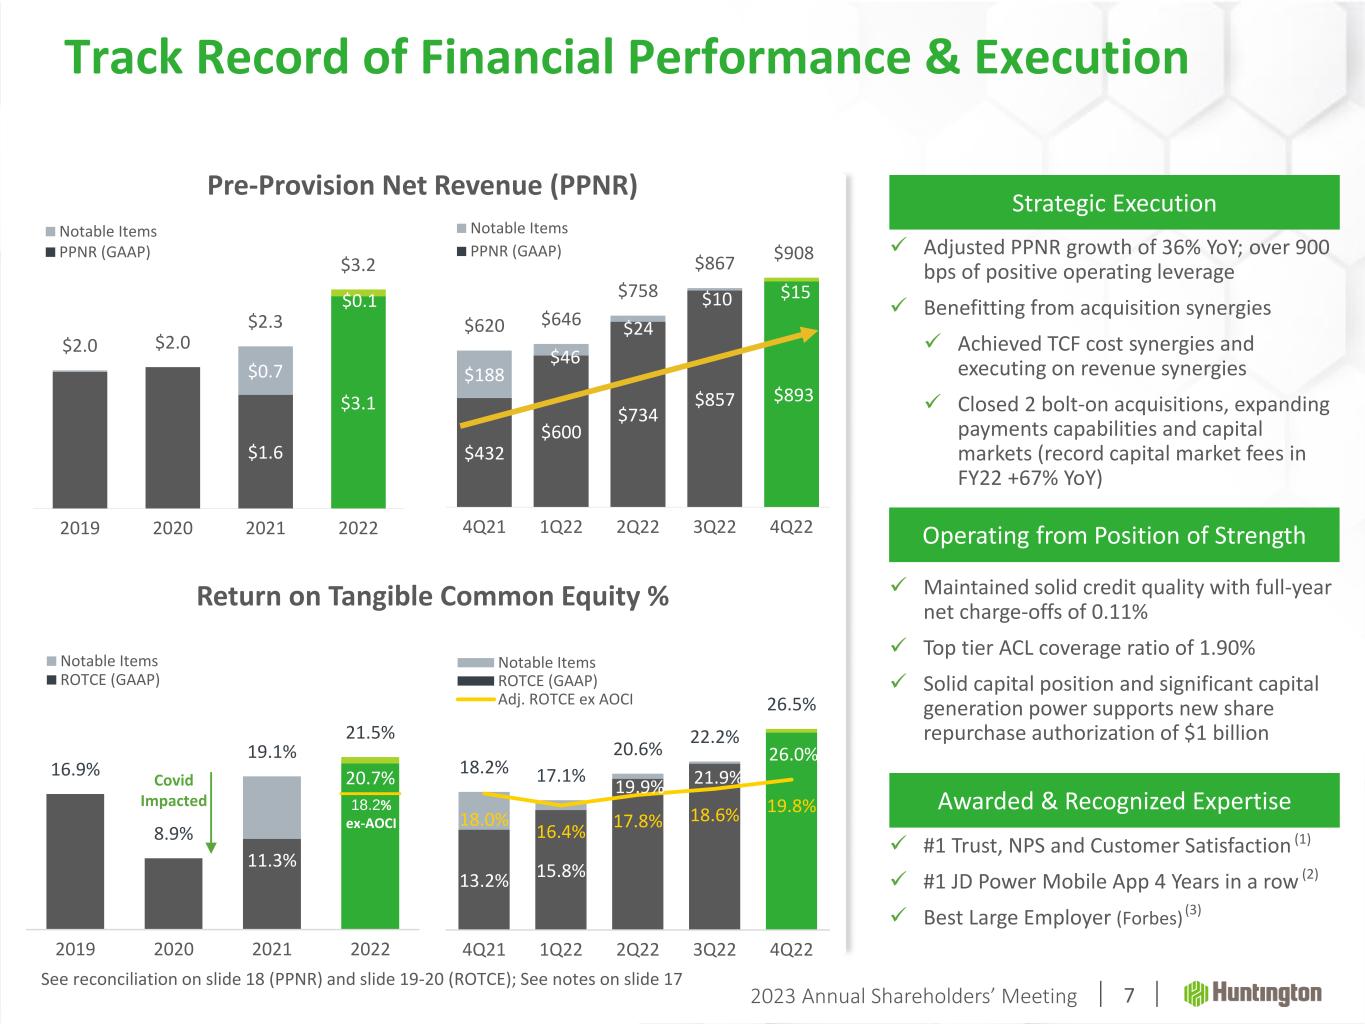
2023 Annual Shareholders’ Meeting 7 11.3% 20.7%16.9% 8.9% 19.1% 21.5% 2019 2020 2021 2022 Notable Items ROTCE (GAAP) Return on Tangible Common Equity % ✓ Maintained solid credit quality with full-year net charge-offs of 0.11% ✓ Top tier ACL coverage ratio of 1.90% ✓ Solid capital position and significant capital generation power supports new share repurchase authorization of $1 billion Strategic Execution Operating from Position of Strength ✓ Adjusted PPNR growth of 36% YoY; over 900 bps of positive operating leverage ✓ Benefitting from acquisition synergies ✓ Achieved TCF cost synergies and executing on revenue synergies ✓ Closed 2 bolt-on acquisitions, expanding payments capabilities and capital markets (record capital market fees in FY22 +67% YoY) Awarded & Recognized Expertise ✓ #1 Trust, NPS and Customer Satisfaction ✓ #1 JD Power Mobile App 4 Years in a row ✓ Best Large Employer (Forbes) 13.2% 15.8% 19.9% 21.9% 26.0% 18.2% 17.1% 20.6% 22.2% 26.5% 18.0% 16.4% 17.8% 18.6% 19.8% 4Q21 1Q22 2Q22 3Q22 4Q22 Notable Items ROTCE (GAAP) Adj. ROTCE ex AOCI Pre-Provision Net Revenue (PPNR) $1.6 $3.1 $0.7 $0.1 $2.0 $2.0 $2.3 $3.2 0.00 0.50 1.00 1.50 2.00 2.50 3.00 3.50 4.00 2019 2020 2021 2022 Notable Items PPNR (GAAP) $432 $600 $734 $857 $893 $188 $46 $24 $10 $15 $620 $646 $758 $867 $908 -100 100 300 500 700 900 1100 4Q21 1Q22 2Q22 3Q22 4Q22 Notable Items PPNR (GAAP) 18.2% ex-AOCI Covid Impacted (1) (2) (3) Track Record of Financial Performance & Execution See reconciliation on slide 18 (PPNR) and slide 19-20 (ROTCE); See notes on slide 17
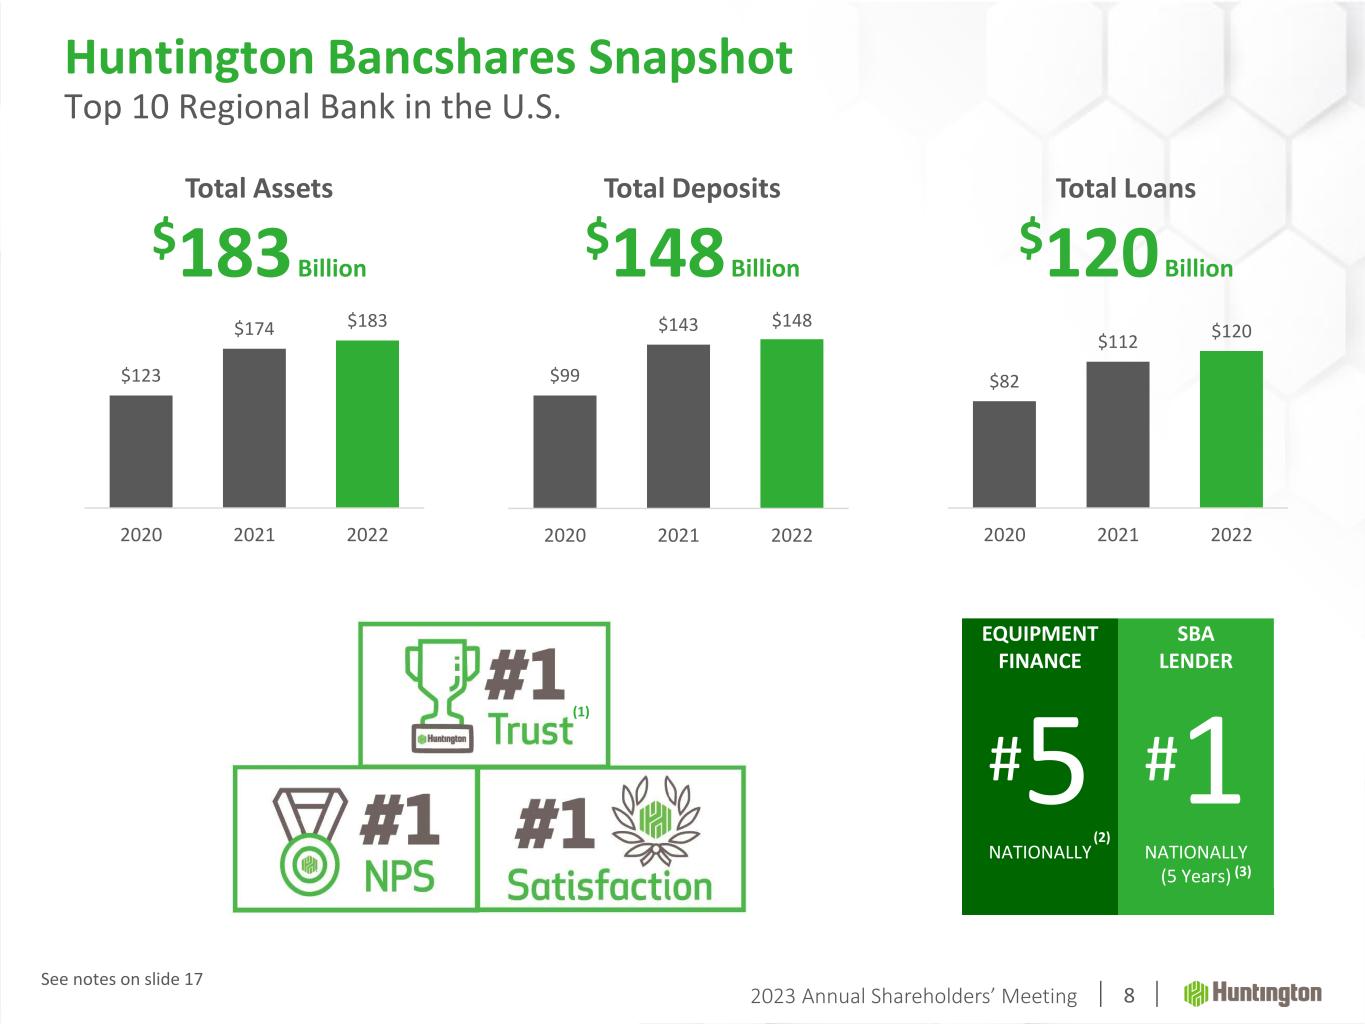
2023 Annual Shareholders’ Meeting 8 $123 $174 $183 2020 2021 2022 $99 $143 $148 2020 2021 2022 Total Assets $183 Billion Total Loans $120 Billion Total Deposits $148 Billion EQUIPMENT FINANCE SBA LENDER #5 #1 NATIONALLY NATIONALLY (5 Years) $82 $112 $120 2020 2021 2022 Huntington Bancshares Snapshot Top 10 Regional Bank in the U.S. (2) (3) (1) See notes on slide 17
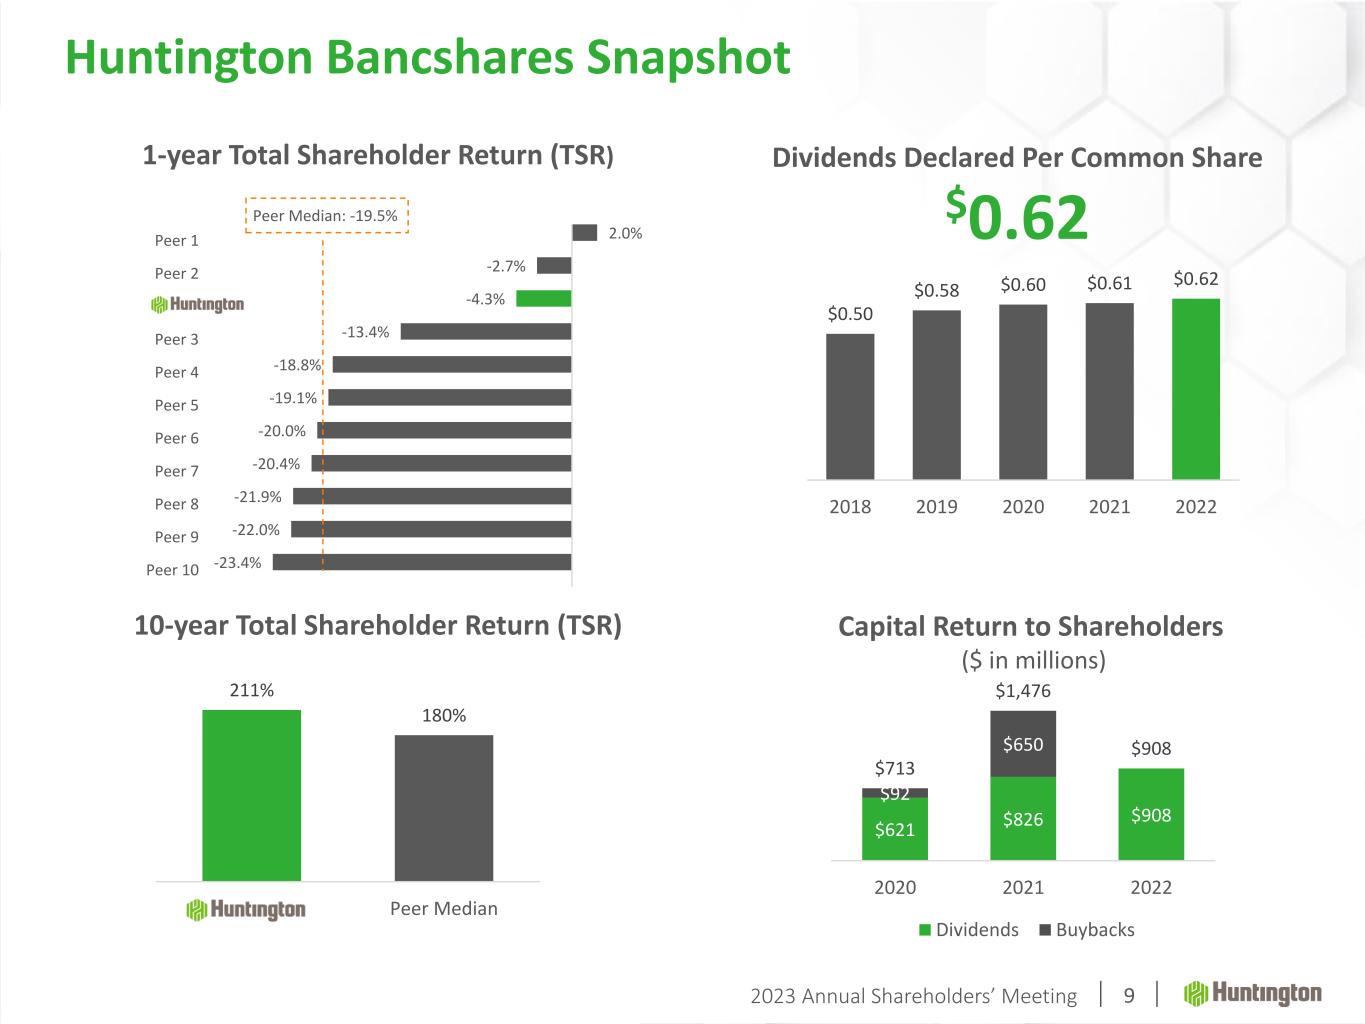
2023 Annual Shareholders’ Meeting 10-year Total Shareholder Return (TSR) 211% 180% HBAN Peer Median Capital Return to Shareholders ($ in millions) $621 $826 $908 $92 $650 $713 $1,476 $908 2020 2021 2022 Dividends Buybacks Dividends Declared Per Common Share $0.62 $0.50 $0.58 $0.60 $0.61 $0.62 2018 2019 2020 2021 2022 1-year Total Shareholder Return (TSR) 2.0% -2.7% -4.3% -13.4% -18.8% -19.1% -20.0% -20.4% -21.9% -22.0% -23.4% Peer 1 Peer 2 HBAN Peer 3 Peer 4 Peer 5 Peer 6 Peer 7 Peer 8 Peer 9 Peer 10 Peer Median: -19.5% Huntington Bancshares Snapshot 9
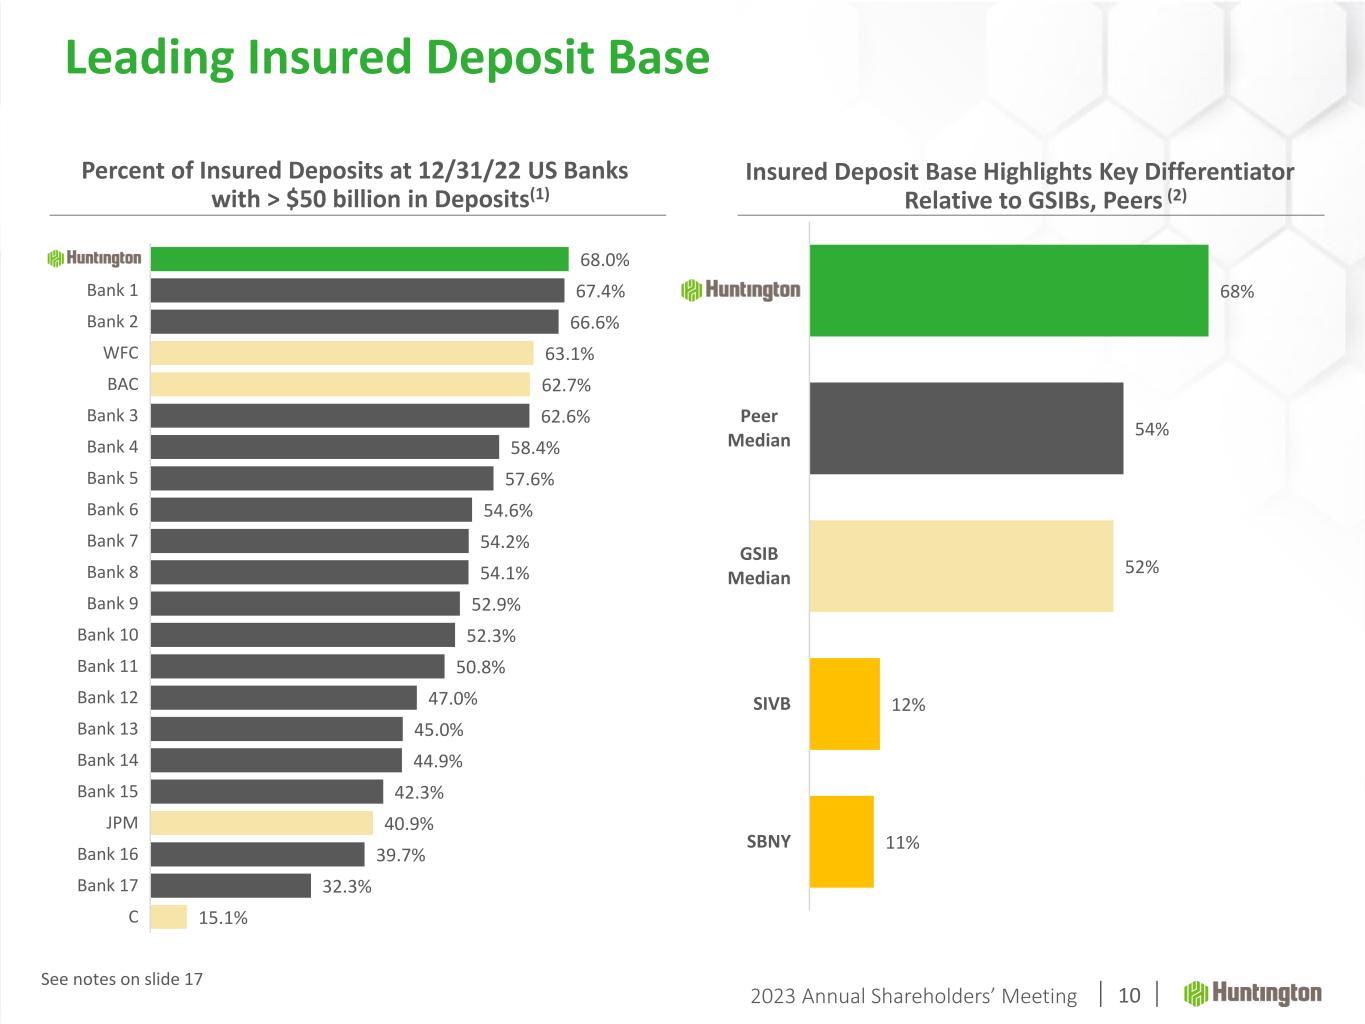
2023 Annual Shareholders’ Meeting 10 Leading Insured Deposit Base Percent of Insured Deposits at 12/31/22 US Banks with > $50 billion in Deposits(1) 68.0% 67.4% 66.6% 63.1% 62.7% 62.6% 58.4% 57.6% 54.6% 54.2% 54.1% 52.9% 52.3% 50.8% 47.0% 45.0% 44.9% 42.3% 40.9% 39.7% 32.3% 15.1% HBAN Bank 1 Bank 2 WFC BAC Bank 3 Bank 4 Bank 5 Bank 6 Bank 7 Bank 8 Bank 9 Bank 10 Bank 11 Bank 12 Bank 13 Bank 14 Bank 15 JPM Bank 16 Bank 17 C 68% 54% 52% 12% 11% HBAN Peer Median GSIB Median SIVB SBNY Insured Deposit Base Highlights Key Differentiator Relative to GSIBs, Peers (2) See notes on slide 17
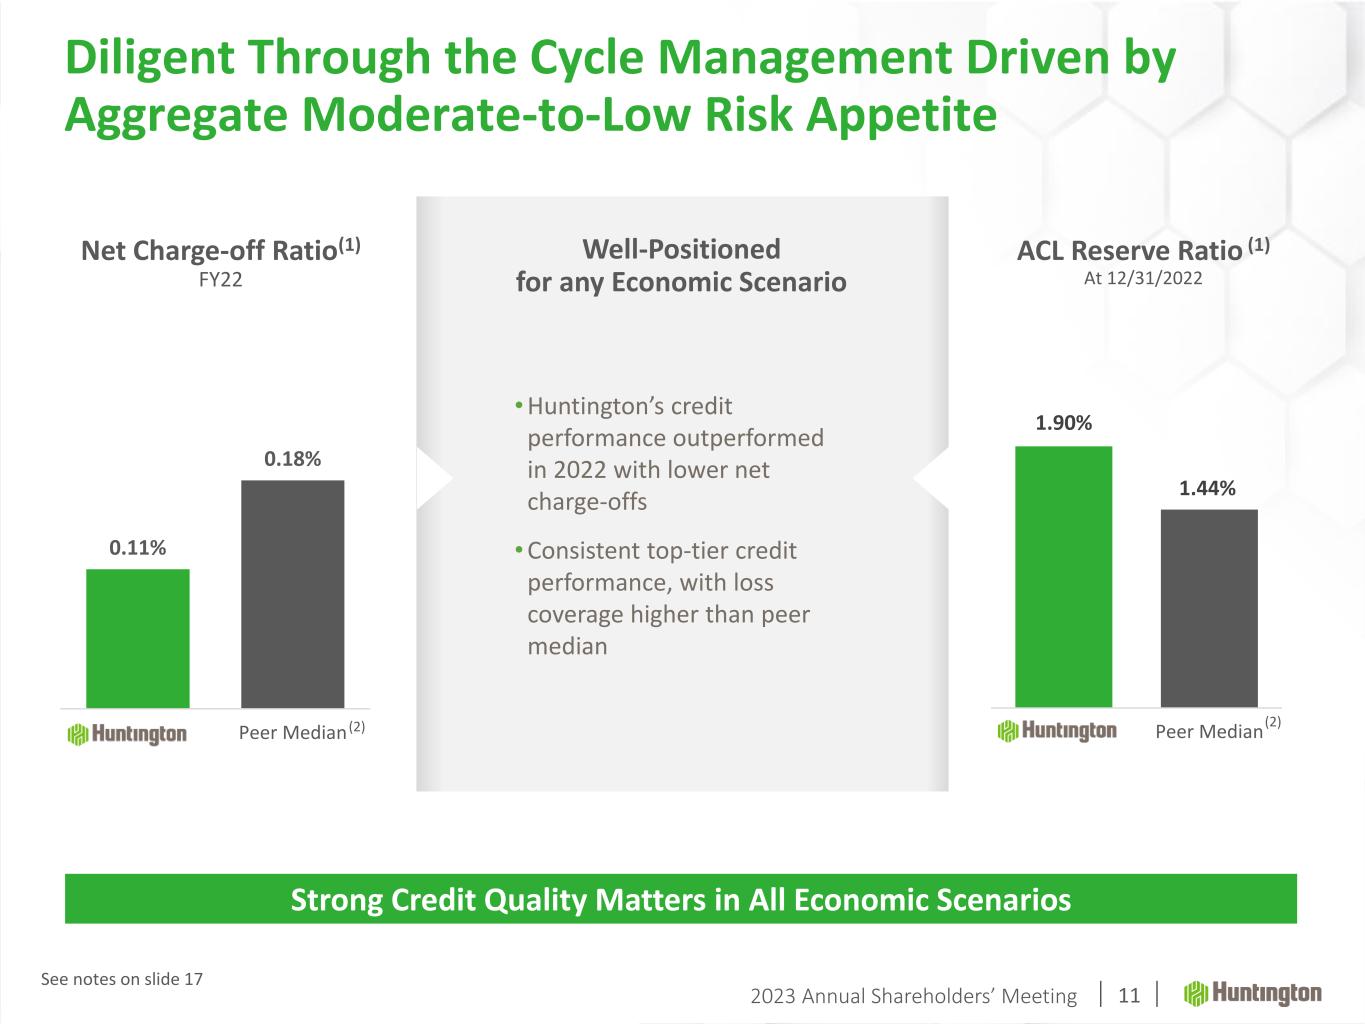
2023 Annual Shareholders’ Meeting 11 0.11% 0.18% HBAN Peer Median Net Charge-off Ratio(1) FY22 ACL Reserve Ratio (1) At 12/31/2022 1.90% 1.44% HBAN Peer Median •Huntington’s credit performance outperformed in 2022 with lower net charge-offs •Consistent top-tier credit performance, with loss coverage higher than peer median Well-Positioned for any Economic Scenario Diligent Through the Cycle Management Driven by Aggregate Moderate-to-Low Risk Appetite Strong Credit Quality Matters in All Economic Scenarios (2) (2) See notes on slide 17
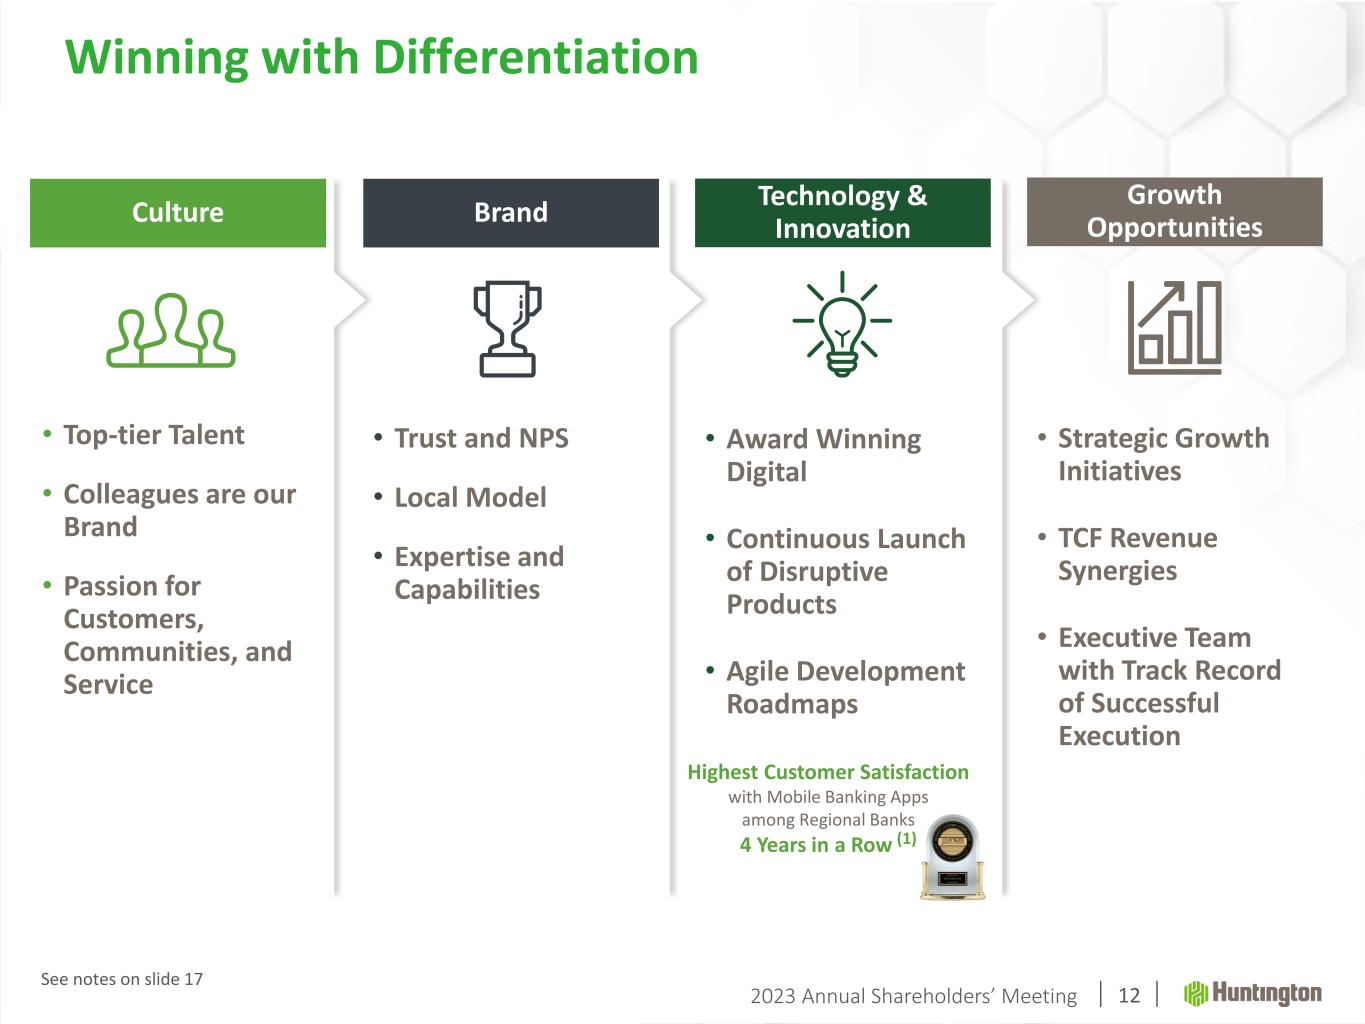
2023 Annual Shareholders’ Meeting 12 • Strategic Growth Initiatives • TCF Revenue Synergies • Executive Team with Track Record of Successful Execution • Award Winning Digital • Continuous Launch of Disruptive Products • Agile Development Roadmaps • Top-tier Talent • Colleagues are our Brand • Passion for Customers, Communities, and Service Culture Brand Technology & Innovation Growth Opportunities • Trust and NPS • Local Model • Expertise and Capabilities Highest Customer Satisfaction with Mobile Banking Apps among Regional Banks 4 Years in a Row (1) Winning with Differentiation See notes on slide 17
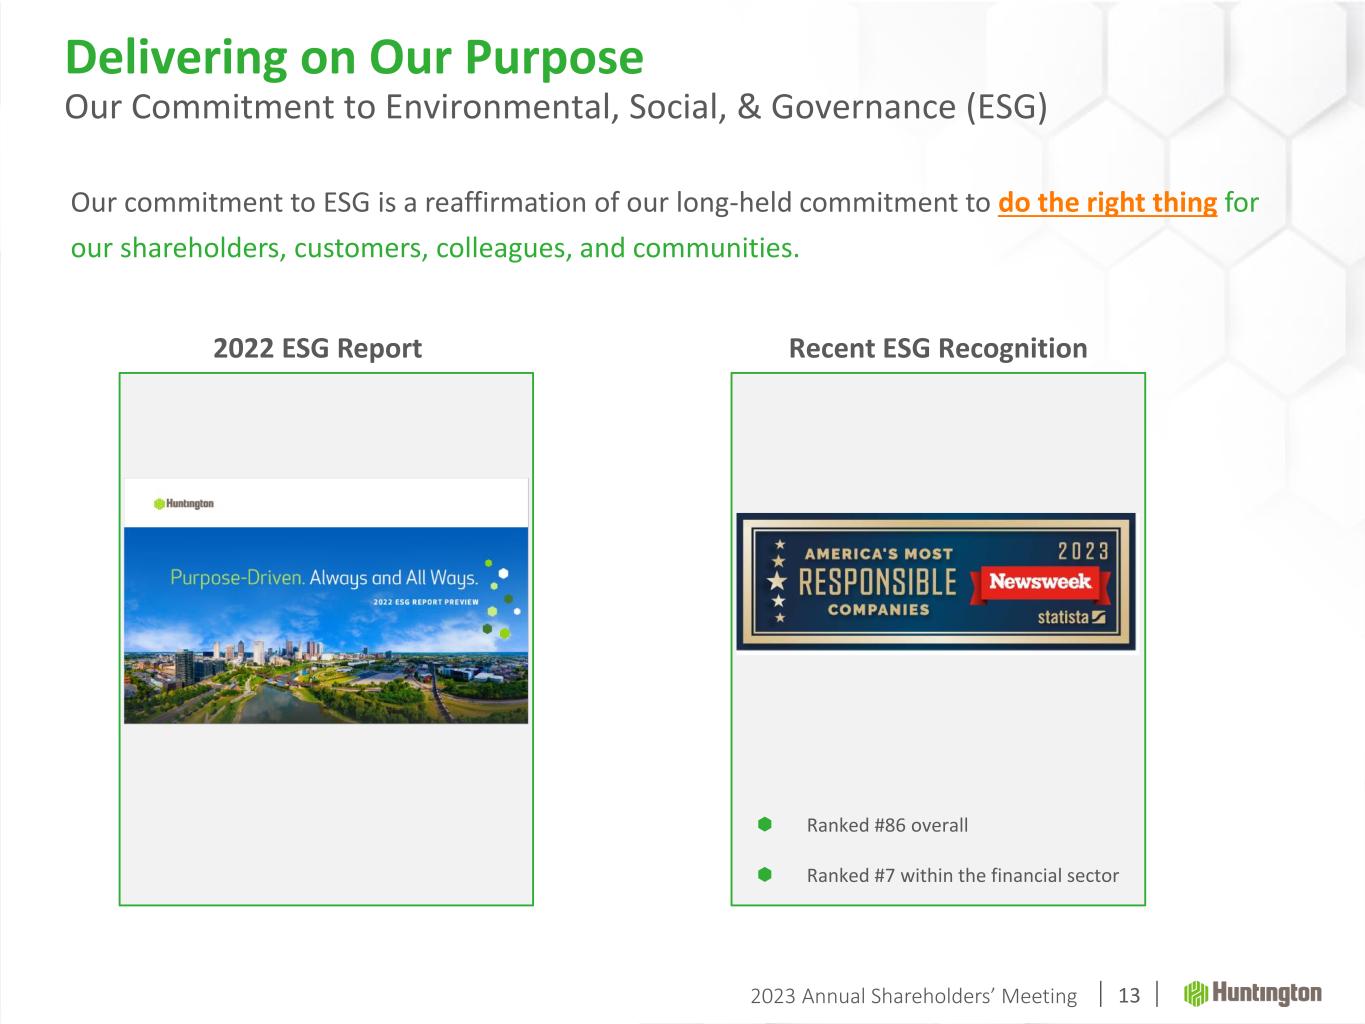
2023 Annual Shareholders’ Meeting 13 Ranked #86 overall Ranked #7 within the financial sector Recent ESG Recognition Our commitment to ESG is a reaffirmation of our long-held commitment to do the right thing for our shareholders, customers, colleagues, and communities. 2022 ESG Report Delivering on Our Purpose Our Commitment to Environmental, Social, & Governance (ESG)
2023 Annual Shareholders’ Meeting 14 First Quarter 2023 Earnings Call Thursday, April 20, 2023 11:00 a.m. ET Huntington’s management will host an earnings conference call the same day at 11:00 a.m. ET. The call, along with slides, may be accessed via a live Internet webcast in the Investor Relations section of Huntington’s website or through a dial-in telephone number at (877) 407-8029 conference ID #13737064.
2023 Annual Shareholders’ Meeting Use of Non-GAAP Financial Measures This document contains GAAP financial measures and non-GAAP financial measures where management believes it to be helpful in understanding Huntington’s results of operations or financial position. Where non-GAAP financial measures are used, the comparable GAAP financial measure, as well as the reconciliation to the comparable GAAP financial measure, can be found in this document, conference call slides, or the Form 8-K related to this document, all of which can be found in the Investor Relations section of Huntington’s website, http://www.huntington.com. Annualized Data Certain returns, yields, performance ratios, or quarterly growth rates are presented on an “annualized” basis. This is done for analytical and decision-making purposes to better discern underlying performance trends when compared to full-year or year-over- year amounts. For example, loan and deposit growth rates, as well as net charge-off percentages, are most often expressed in terms of an annual rate like 8%. As such, a 2% growth rate for a quarter would represent an annualized 8% growth rate. Fully-Taxable Equivalent Interest Income and Net Interest Margin Income from tax-exempt earning assets is increased by an amount equivalent to the taxes that would have been paid if this income had been taxable at statutory rates. This adjustment puts all earning assets, most notably tax-exempt municipal securities and certain lease assets, on a common basis that facilitates comparison of results to results of competitors. Earnings per Share Equivalent Data Notable income or expense items may be expressed on a per common share basis. This is done for analytical and decision-making purposes to better discern underlying trends in total corporate earnings per share performance excluding the impact of such items. Investors may also find this information helpful in their evaluation of our financial performance against published earnings per share mean estimate amounts, which typically exclude the impact of Notable Items. Earnings per share equivalents are usually calculated by applying an effective tax rate to a pre-tax amount to derive an after-tax amount, which is divided by the average shares outstanding during the respective reporting period. Occasionally, when the item involves special tax treatment, the after-tax amount is disclosed separately, with this then being the amount used to calculate the earnings per share equivalent. Basis of Presentation 15
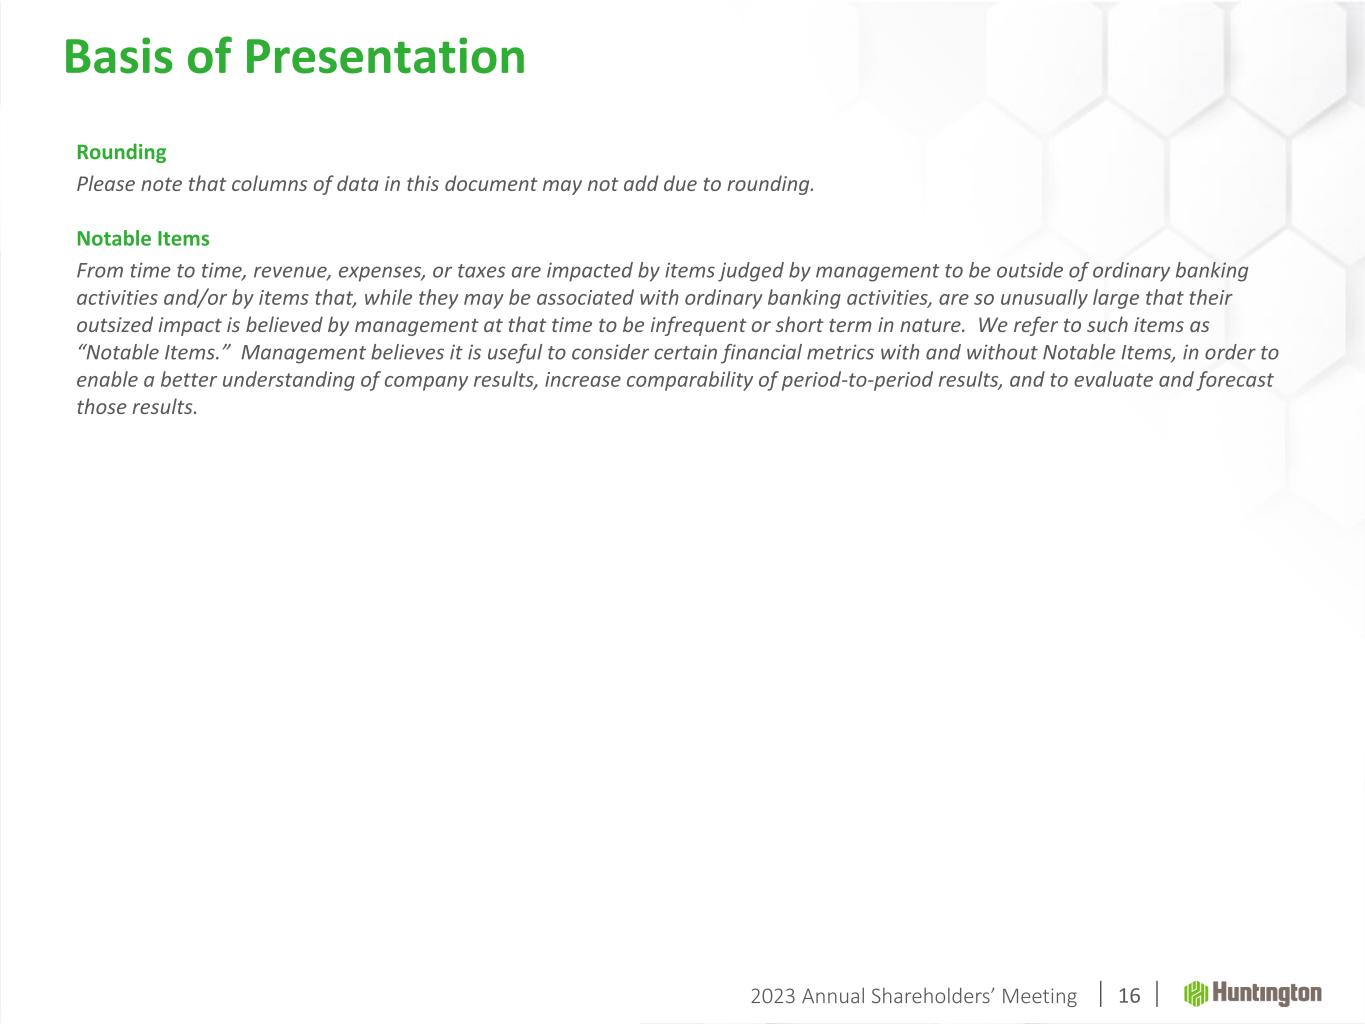
2023 Annual Shareholders’ Meeting Rounding Please note that columns of data in this document may not add due to rounding. Notable Items From time to time, revenue, expenses, or taxes are impacted by items judged by management to be outside of ordinary banking activities and/or by items that, while they may be associated with ordinary banking activities, are so unusually large that their outsized impact is believed by management at that time to be infrequent or short term in nature. We refer to such items as “Notable Items.” Management believes it is useful to consider certain financial metrics with and without Notable Items, in order to enable a better understanding of company results, increase comparability of period-to-period results, and to evaluate and forecast those results. Basis of Presentation 16
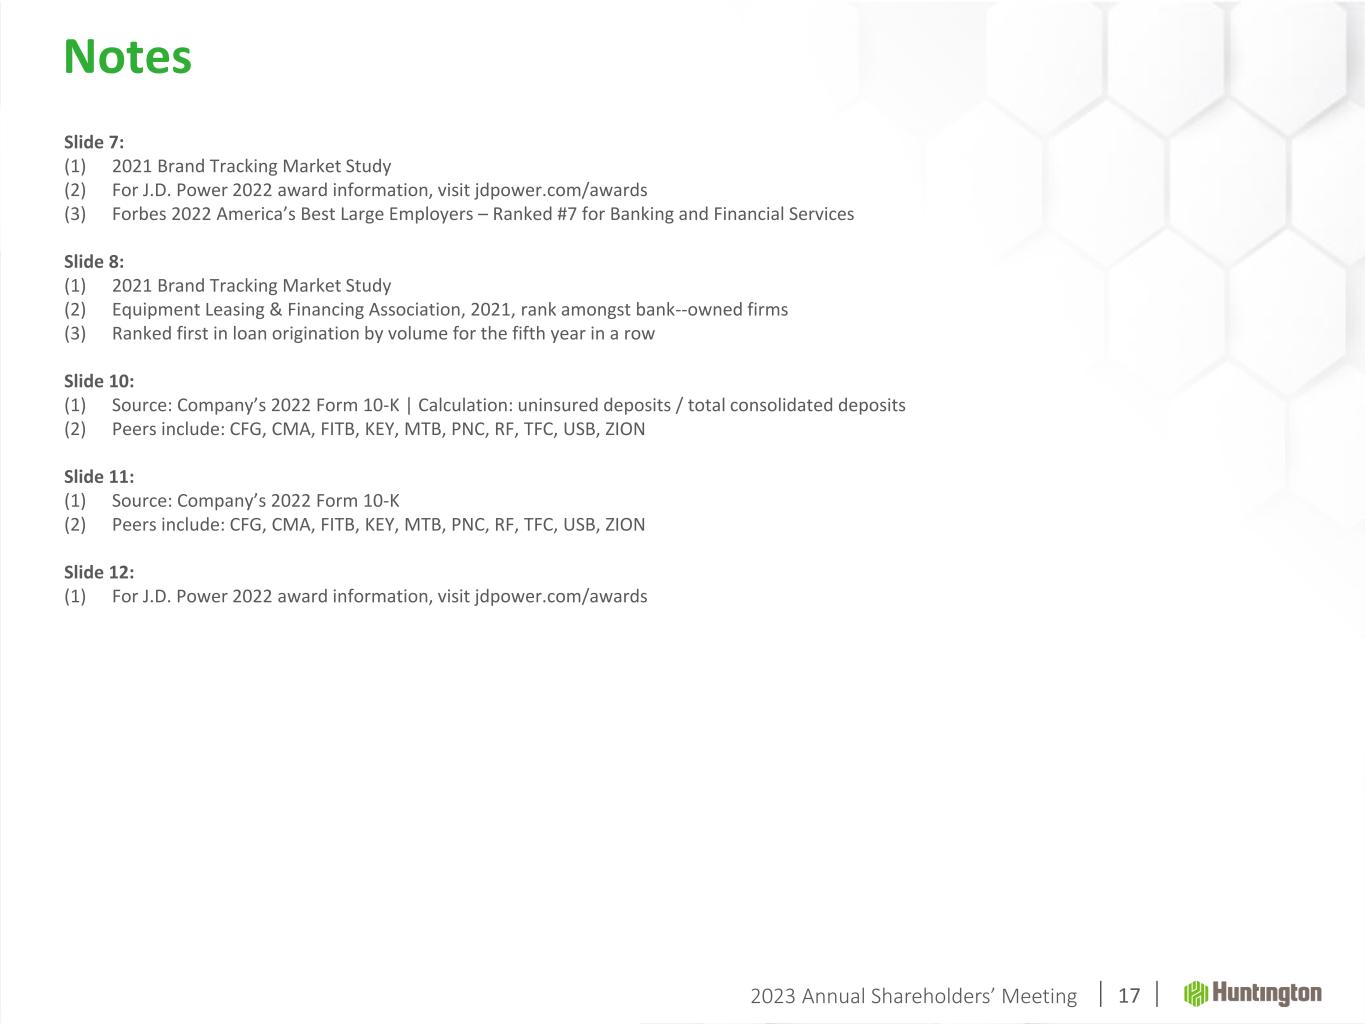
2023 Annual Shareholders’ Meeting Slide 7: (1) 2021 Brand Tracking Market Study (2) For J.D. Power 2022 award information, visit jdpower.com/awards (3) Forbes 2022 America’s Best Large Employers – Ranked #7 for Banking and Financial Services Slide 8: (1) 2021 Brand Tracking Market Study (2) Equipment Leasing & Financing Association, 2021, rank amongst bank--owned firms (3) Ranked first in loan origination by volume for the fifth year in a row Slide 10: (1) Source: Company’s 2022 Form 10-K | Calculation: uninsured deposits / total consolidated deposits (2) Peers include: CFG, CMA, FITB, KEY, MTB, PNC, RF, TFC, USB, ZION Slide 11: (1) Source: Company’s 2022 Form 10-K (2) Peers include: CFG, CMA, FITB, KEY, MTB, PNC, RF, TFC, USB, ZION Slide 12: (1) For J.D. Power 2022 award information, visit jdpower.com/awards Notes 17
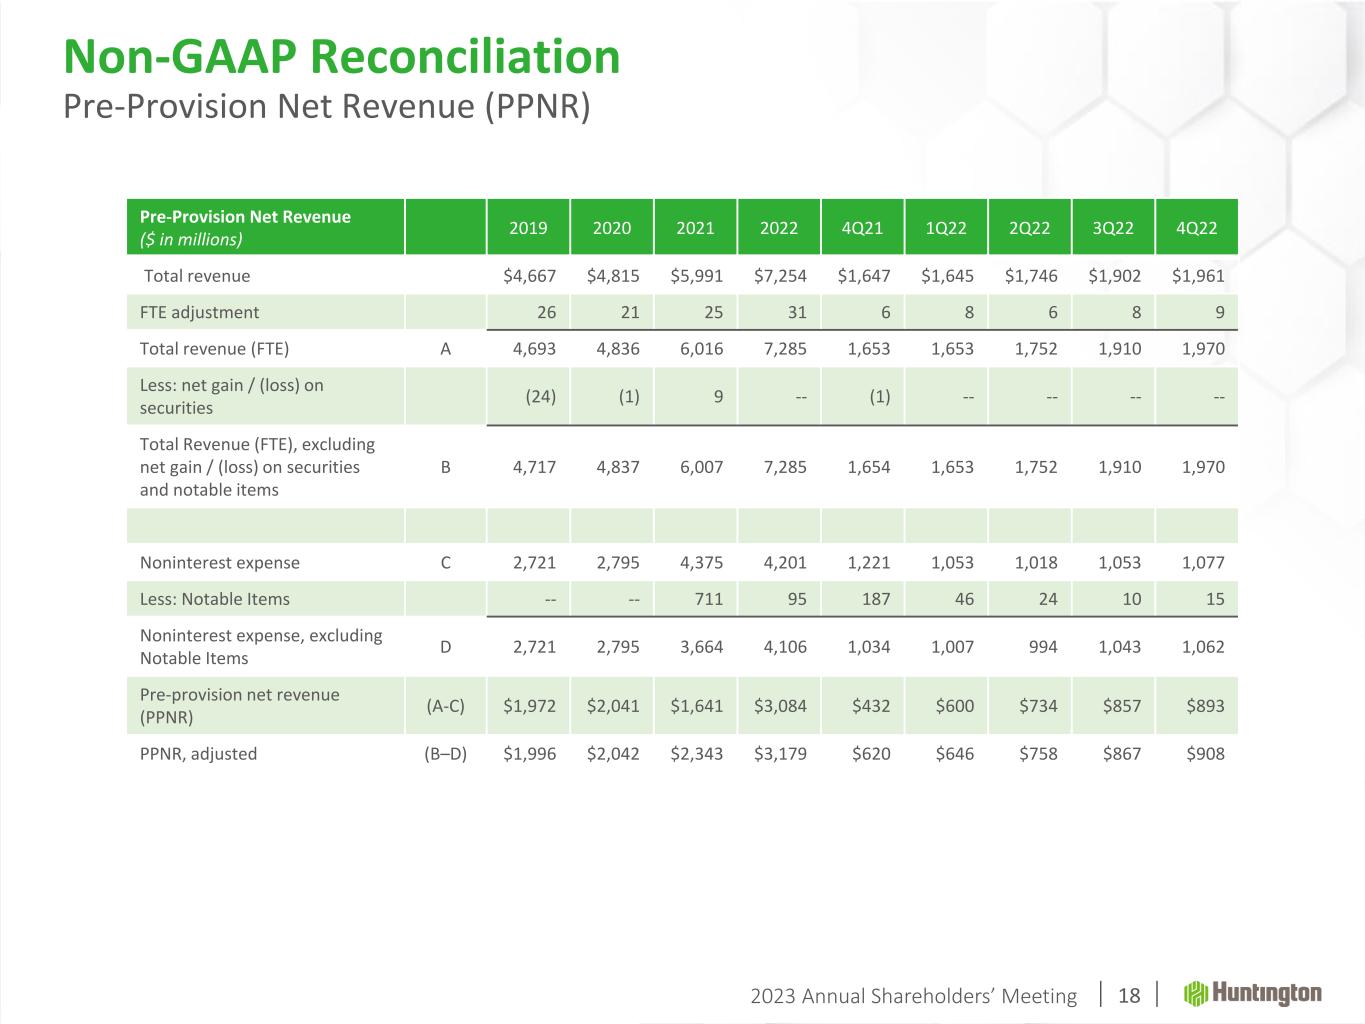
2023 Annual Shareholders’ Meeting Pre-Provision Net Revenue ($ in millions) 2019 2020 2021 2022 4Q21 1Q22 2Q22 3Q22 4Q22 Total revenue $4,667 $4,815 $5,991 $7,254 $1,647 $1,645 $1,746 $1,902 $1,961 FTE adjustment 26 21 25 31 6 8 6 8 9 Total revenue (FTE) A 4,693 4,836 6,016 7,285 1,653 1,653 1,752 1,910 1,970 Less: net gain / (loss) on securities (24) (1) 9 -- (1) -- -- -- -- Total Revenue (FTE), excluding net gain / (loss) on securities and notable items B 4,717 4,837 6,007 7,285 1,654 1,653 1,752 1,910 1,970 Noninterest expense C 2,721 2,795 4,375 4,201 1,221 1,053 1,018 1,053 1,077 Less: Notable Items -- -- 711 95 187 46 24 10 15 Noninterest expense, excluding Notable Items D 2,721 2,795 3,664 4,106 1,034 1,007 994 1,043 1,062 Pre-provision net revenue (PPNR) (A-C) $1,972 $2,041 $1,641 $3,084 $432 $600 $734 $857 $893 PPNR, adjusted (B–D) $1,996 $2,042 $2,343 $3,179 $620 $646 $758 $867 $908 Non-GAAP Reconciliation Pre-Provision Net Revenue (PPNR) 18
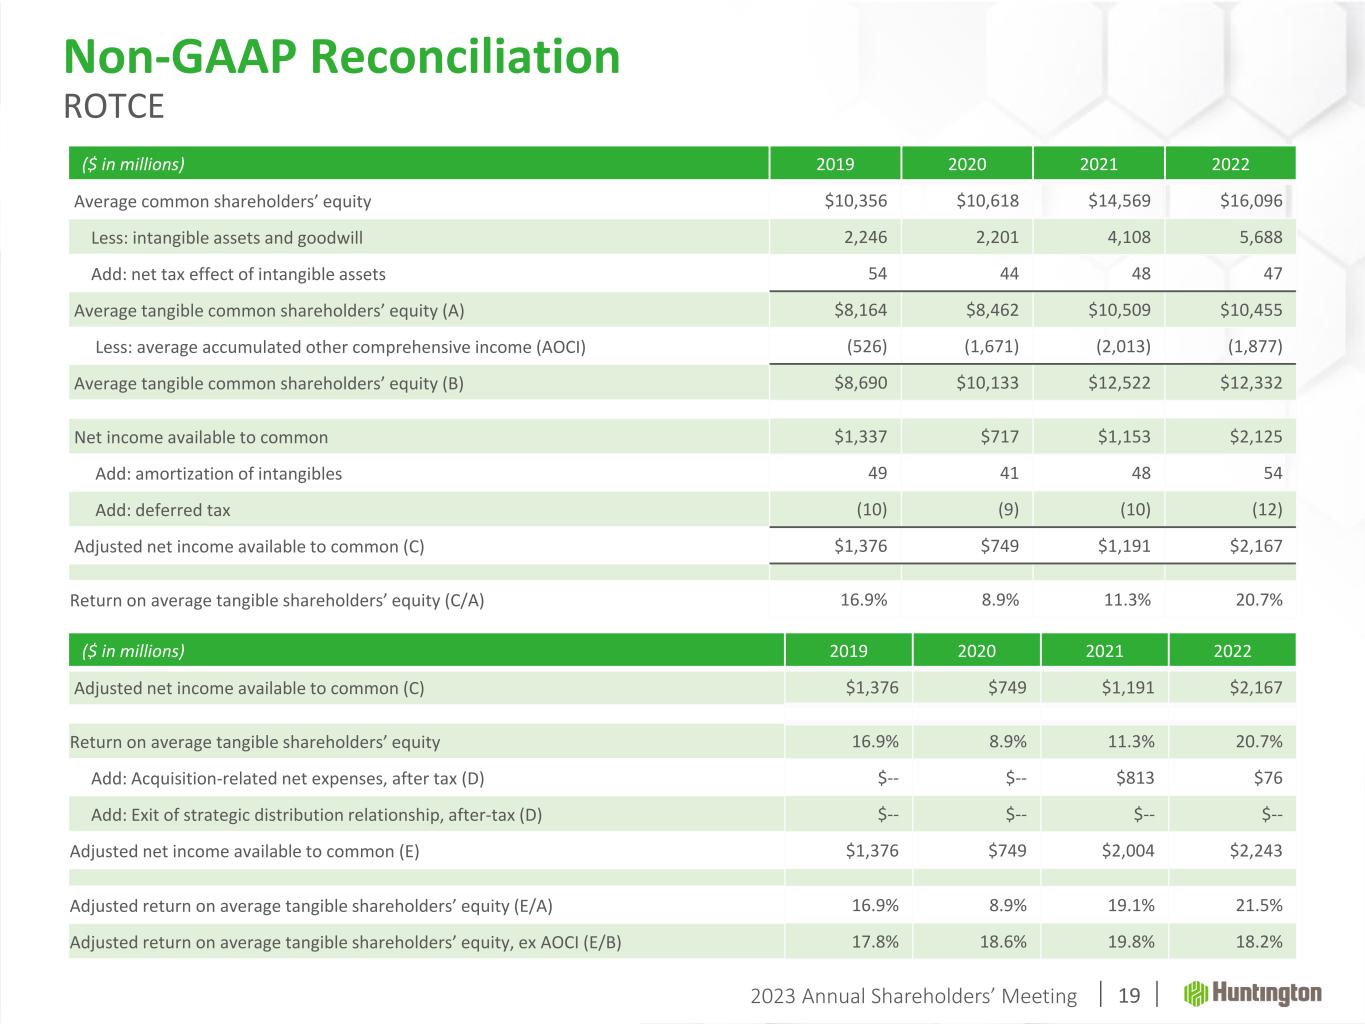
2023 Annual Shareholders’ Meeting ($ in millions) 2019 2020 2021 2022 Average common shareholders’ equity $10,356 $10,618 $14,569 $16,096 Less: intangible assets and goodwill 2,246 2,201 4,108 5,688 Add: net tax effect of intangible assets 54 44 48 47 Average tangible common shareholders’ equity (A) $8,164 $8,462 $10,509 $10,455 Less: average accumulated other comprehensive income (AOCI) (526) (1,671) (2,013) (1,877) Average tangible common shareholders’ equity (B) $8,690 $10,133 $12,522 $12,332 Net income available to common $1,337 $717 $1,153 $2,125 Add: amortization of intangibles 49 41 48 54 Add: deferred tax (10) (9) (10) (12) Adjusted net income available to common (C) $1,376 $749 $1,191 $2,167 Return on average tangible shareholders’ equity (C/A) 16.9% 8.9% 11.3% 20.7% ($ in millions) 2019 2020 2021 2022 Adjusted net income available to common (C) $1,376 $749 $1,191 $2,167 Return on average tangible shareholders’ equity 16.9% 8.9% 11.3% 20.7% Add: Acquisition-related net expenses, after tax (D) $-- $-- $813 $76 Add: Exit of strategic distribution relationship, after-tax (D) $-- $-- $-- $-- Adjusted net income available to common (E) $1,376 $749 $2,004 $2,243 Adjusted return on average tangible shareholders’ equity (E/A) 16.9% 8.9% 19.1% 21.5% Adjusted return on average tangible shareholders’ equity, ex AOCI (E/B) 17.8% 18.6% 19.8% 18.2% Non-GAAP Reconciliation ROTCE 19
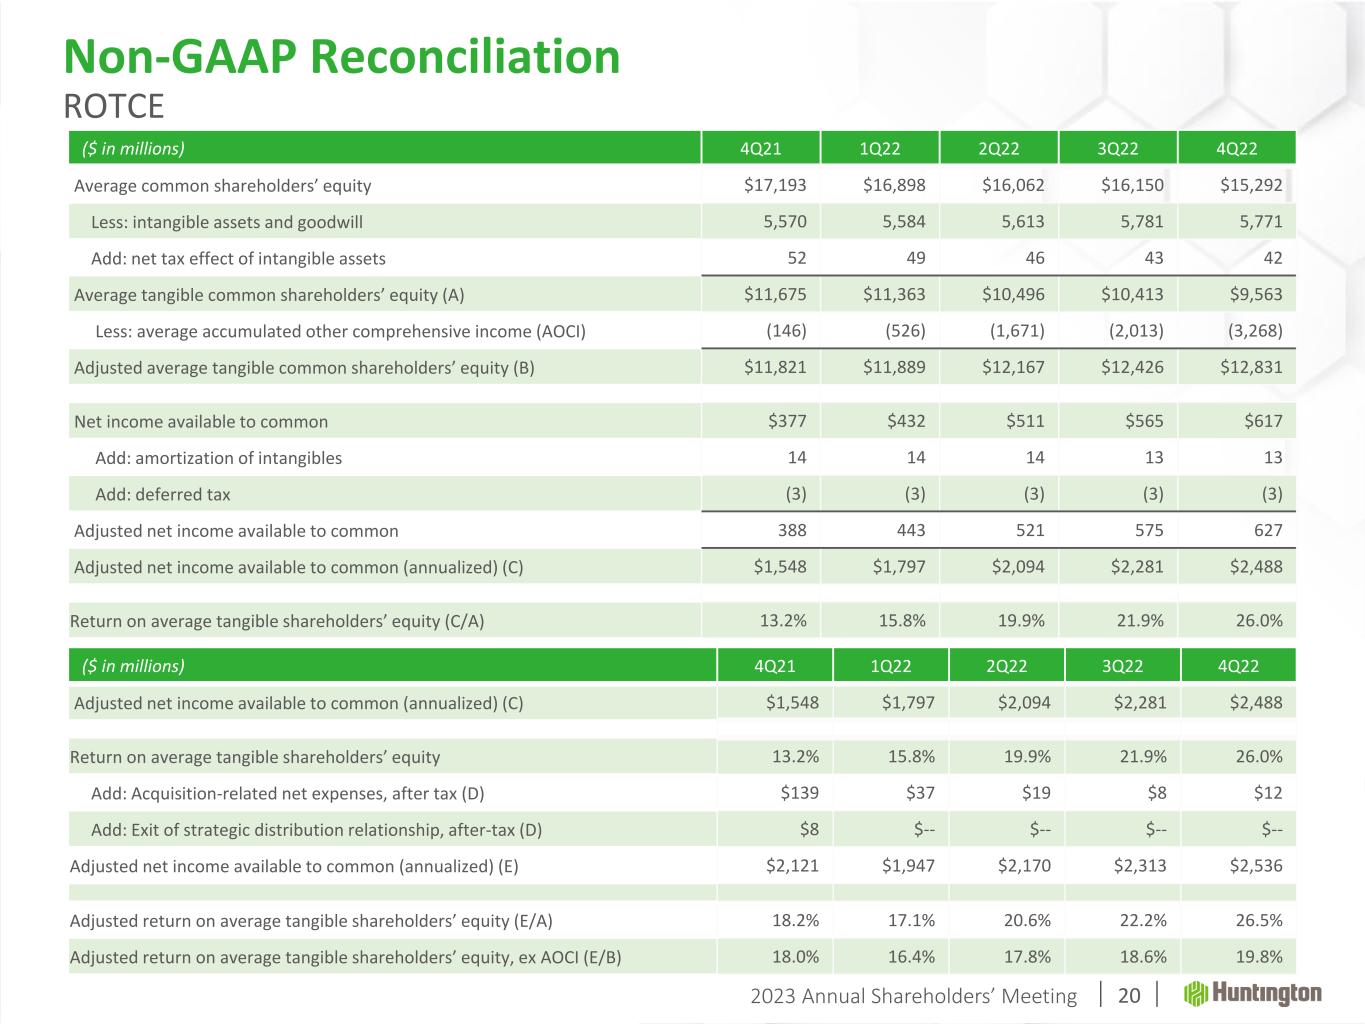
2023 Annual Shareholders’ Meeting ($ in millions) 4Q21 1Q22 2Q22 3Q22 4Q22 Average common shareholders’ equity $17,193 $16,898 $16,062 $16,150 $15,292 Less: intangible assets and goodwill 5,570 5,584 5,613 5,781 5,771 Add: net tax effect of intangible assets 52 49 46 43 42 Average tangible common shareholders’ equity (A) $11,675 $11,363 $10,496 $10,413 $9,563 Less: average accumulated other comprehensive income (AOCI) (146) (526) (1,671) (2,013) (3,268) Adjusted average tangible common shareholders’ equity (B) $11,821 $11,889 $12,167 $12,426 $12,831 Net income available to common $377 $432 $511 $565 $617 Add: amortization of intangibles 14 14 14 13 13 Add: deferred tax (3) (3) (3) (3) (3) Adjusted net income available to common 388 443 521 575 627 Adjusted net income available to common (annualized) (C) $1,548 $1,797 $2,094 $2,281 $2,488 Return on average tangible shareholders’ equity (C/A) 13.2% 15.8% 19.9% 21.9% 26.0% ($ in millions) 4Q21 1Q22 2Q22 3Q22 4Q22 Adjusted net income available to common (annualized) (C) $1,548 $1,797 $2,094 $2,281 $2,488 Return on average tangible shareholders’ equity 13.2% 15.8% 19.9% 21.9% 26.0% Add: Acquisition-related net expenses, after tax (D) $139 $37 $19 $8 $12 Add: Exit of strategic distribution relationship, after-tax (D) $8 $-- $-- $-- $-- Adjusted net income available to common (annualized) (E) $2,121 $1,947 $2,170 $2,313 $2,536 Adjusted return on average tangible shareholders’ equity (E/A) 18.2% 17.1% 20.6% 22.2% 26.5% Adjusted return on average tangible shareholders’ equity, ex AOCI (E/B) 18.0% 16.4% 17.8% 18.6% 19.8% Non-GAAP Reconciliation ROTCE 20

Welcome.®