10-K: Annual report pursuant to Section 13 and 15(d)
Published on February 17, 2023
UNITED STATES
SECURITIES AND EXCHANGE COMMISSION
WASHINGTON, D.C. 20549
_________________________________________________________________________________________________________________________________________________________________________
FORM 10-K
_________________________________________________________________________________________________________________________________________________________________________
Annual Report Pursuant to Section 13 or 15(d) of the Securities Exchange Act of 1934 |
|||||
For the fiscal year ended December 31 , 2022
Commission File Number 1-34073
_________________________________________________________________________________________________________________________________________________________________________

(Exact name of registrant as specified in its charter)
__________________________________________________________________________________________________________________________________________________________________________
| (State or other jurisdiction of incorporation or organization) | (I.R.S. Employer Identification No.) | |||||||||||||
| (Address of principal executive offices) | (Zip Code) | |||||||||||||
Registrant’s telephone number, including area code (614 ) 480-2265
Securities registered pursuant to Section 12(b) of the Act:
| Title of class |
Trading
Symbol(s)
|
Name of exchange on which registered | ||||||
Indicate by check mark if the registrant is a well-known seasoned issuer, as defined in Rule 405 of the Securities Exchange Act. x Yes ¨ No
Indicate by check mark if the registrant is not required to file reports pursuant to Section 13 or 15(d) of the Act. ¨ Yes x No
Indicate by check mark whether the registrant (1) has filed all reports required to be filed by Section 13 or 15(d) of the Securities Exchange Act of 1934 during the preceding 12 months (or for such shorter period that the registrant was required to file such reports), and (2) has been subject to such filing requirements for the past 90 days. x Yes ¨ No
Indicate by check mark whether the registrant has submitted electronically every Interactive Data File required to be submitted pursuant to Rule 405 of Regulation S-T (§232.405 of this chapter) during the preceding 12 months (or for such shorter period that the registrant was required to submit such files). x Yes ¨ No
Indicate by check mark whether the registrant is a large accelerated filer, an accelerated filer, a non-accelerated filer, a smaller reporting company, or an emerging growth company. See the definitions of “large accelerated filer”, “accelerated filer”, “smaller reporting company”, and “emerging growth company” in Rule 12b-2 of the Exchange Act.
| x | Accelerated filer | ☐ | |||||||||||||||
| Non-accelerated filer | ☐ | Smaller reporting company | |||||||||||||||
| Emerging growth company | |||||||||||||||||
If an emerging growth company, indicate by check mark if the registrant has elected not to use the extended transition period for complying with any new or revised financial accounting standards provided pursuant to Section 13(a) of the Exchange Act. ¨
Indicate by check mark whether the registrant has filed a report on and attestation to its management’s assessment of the effectiveness of its internal control over financial reporting under Section 404(b) of the Sarbanes-Oxley Act (15 U.S.C. 7262(b)) by the registered public accounting firm that prepared or issued its audit report. ☒
If securities are registered pursuant to Section 12(b) of the Act, indicate by check mark whether the financial statements of the registrant included in the filing reflect the correction of an error to previously issued financial statements. ¨
Indicate by check mark whether any of those error corrections are restatements that required a recovery analysis of incentive-based compensation received by any of the registrant’s executive officers during the relevant recovery period pursuant to §240.10D-1(b). ¨
Indicate by check mark whether the registrant is a shell company (as defined in Rule 12b-2 of the Act)
The aggregate market value of voting and non-voting common equity held by non-affiliates of the registrant as of June 30, 2022, determined by using a per share closing price of $12.03, as quoted by Nasdaq on that date, was $17,092,209,908 . As of January 31, 2023, there were 1,443,016,884 shares of common stock with a par value of $0.01 outstanding.
Documents Incorporated By Reference
HUNTINGTON BANCSHARES INCORPORATED
INDEX
| Part I. | ||||||||
| Part II. | ||||||||
| Part III. | ||||||||
| Part IV. | ||||||||
Glossary of Acronyms and Terms
The following listing provides a comprehensive reference of common acronyms and terms used throughout the document:
| ACL | Allowance for Credit Losses | ||||
| AFS | Available-for-Sale | ||||
| ALCO | Asset-Liability Management Committee | ||||
| ALLL | Allowance for Loan and Lease Losses | ||||
| AML | Anti-Money Laundering |
||||
| AOCI | Accumulated Other Comprehensive Income | ||||
| ASC | Accounting Standards Codification | ||||
| ATM | Automated Teller Machine | ||||
| AULC | Allowance for Unfunded Lending Commitments | ||||
| Bank Secrecy Act | Financial Recordkeeping and Reporting of Currency and Foreign Transactions Act of 1970 | ||||
| Basel III | Refers to the final rule issued by the Federal Reserve and OCC and published in the Federal Register on October 11, 2013 | ||||
| BHC | Bank Holding Company | ||||
| BHC Act | Bank Holding Company Act of 1956 |
||||
| Capstone Partners | Capstone Enterprises LLC | ||||
| CARES Act | Coronavirus Aid, Relief, and Economic Security Act, as amended | ||||
| C&I | Commercial and Industrial | ||||
| CCAR | Comprehensive Capital Analysis and Review | ||||
| CCB | Capital Conservation Buffer |
||||
| CCPA | California Consumer Privacy Act of 2018 | ||||
| CDs | Certificates of Deposit | ||||
| CDI | Core Deposit Intangible | ||||
| CECL | Current Expected Credit Losses | ||||
| CET1 | Common equity tier 1 on a transitional Basel III basis | ||||
| CFPB | Bureau of Consumer Financial Protection | ||||
| CISA | Cybersecurity Information Sharing Act |
||||
| CMO | Collateralized Mortgage Obligations | ||||
| COVID-19 | Coronavirus Disease 2019 | ||||
| CPPA | California Privacy Protection Act | ||||
| CPRA | California Privacy Rights Act | ||||
| CRA | Community Reinvestment Act |
||||
| CRE | Commercial Real Estate | ||||
| DEI | Diversity, Equity, and Inclusion | ||||
| DIF | Deposit Insurance Fund | ||||
| Dodd-Frank Act | Dodd-Frank Wall Street Reform and Consumer Protection Act | ||||
| EAD | Exposure at Default | ||||
| Economic Growth Act | Economic Growth, Regulatory Relief and Consumer Protection Act | ||||
| ELT | Executive Leadership Team | ||||
| EPS | Earnings Per Share | ||||
| ESG | Environmental, Social, and Governance | ||||
| EVE | Economic Value of Equity | ||||
| FASB | Financial Accounting Standards Board | ||||
4 Huntington Bancshares Incorporated
| FCRA | Fair Credit Reporting Act | ||||
| FDIA | Federal Deposit Insurance Act | ||||
| FDIC | Federal Deposit Insurance Corporation | ||||
| Federal Reserve | Board of Governors of the Federal Reserve System | ||||
| FHC | Financial Holding Company | ||||
| FHLB | Federal Home Loan Bank | ||||
| FICO | Fair Isaac Corporation | ||||
| FinCEN | Financial Crimes Enforcement Network | ||||
| FINRA | Financial Industry Regulatory Authority, Inc. |
||||
| FRG | Financial Recovery Group | ||||
| FTE | Fully-Taxable Equivalent or Full-Time Equivalent | ||||
| FTP | Funds Transfer Pricing | ||||
| FVO | Fair Value Option | ||||
| GAAP | Generally Accepted Accounting Principles in the United States of America | ||||
| GDP | Gross Domestic Product | ||||
| GLBA | Gramm-Leach-Bliley Act | ||||
| HIC | Huntington Investment Company | ||||
| HMDA | Home Mortgage Disclosure Act | ||||
| HPI | House Price Index | ||||
| HTM | Held-to-Maturity | ||||
| IRS | Internal Revenue Service | ||||
| Last-of-Layer | Last-of-layer is a fair value hedge of the interest rate risk of a portfolio of similar prepayable assets whereby the last dollar amount within the portfolio of assets is identified as the hedged item | ||||
| LCR | Liquidity Coverage Ratio | ||||
| LFI Rating System | Large Financial Institution Rating System | ||||
| LGD | Loss Given Default | ||||
| LIBOR | London Interbank Offered Rate | ||||
| LIHTC | Low Income Housing Tax Credit | ||||
| LTV | Loan-to-Value | ||||
| MBS | Mortgage-Backed Securities | ||||
| MD&A | Management’s Discussion and Analysis of Financial Condition and Results of Operations | ||||
| MSA | Metropolitan Statistical Area | ||||
| MSR | Mortgage Servicing Right | ||||
| NAICS | North American Industry Classification System | ||||
| NALs | Nonaccrual Loans | ||||
| NCO | Net Charge-off | ||||
| NII | Net Interest Income | ||||
| NIM | Net Interest Margin | ||||
| NM | Not Meaningful | ||||
| NPAs | Nonperforming Assets | ||||
| OCC | Office of the Comptroller of the Currency | ||||
| OCI | Other Comprehensive Income (Loss) | ||||
| OCR | Optimal Customer Relationship | ||||
| OFAC | Office of Foreign Assets Control | ||||
| OLEM | Other Loans Especially Mentioned | ||||
| OPEC | Organization of the Petroleum Exporting Countries | ||||
| OREO | Other Real Estate Owned | ||||
2022 Form 10-K 5
| Patriot Act | Uniting and Strengthening America by Providing Appropriate Tools Required to Intercept and Obstruct Terrorism Act of 2001 | ||||
| PCAOB | Public Company Accounting Oversight Board | ||||
| PCD | Purchased Credit Deteriorated | ||||
| PD | Probability of Default | ||||
| Plan | Huntington Bancshares Retirement Plan | ||||
| PPP | Paycheck Protection Program | ||||
| Problem Loans | Includes nonaccrual loans and leases, accruing loans and leases past due 90 days or more, troubled debt restructured loans, and criticized commercial loans | ||||
| Capital and Liquidity Tailoring Rule | Refers to the changes to applicability thresholds for regulatory and capital and liquidity requirements, issued by the OCC, the Federal Reserve, and the FDIC | ||||
| EPS Tailoring Rule | Refers to Prudential Standards for Large Bank Holding Companies and Savings and Loan Holding, issued by the Federal Reserve | ||||
| Tailoring Rules | Refers to the Capital and Liquidity Tailoring Rule and the EPS Tailoring Rule | ||||
| RBHPCG | Regional Banking and The Huntington Private Client Group | ||||
| REIT | Real Estate Investment Trust | ||||
| Riegle-Neal Act | The Riegle-Neal Interstate Banking and Branching Efficiency Act of 1994 | ||||
| ROC | Risk Oversight Committee |
||||
| RWA | Risk-Weighted Assets | ||||
| SBA | Small Business Administration | ||||
| SCB | Stress Capital Buffer | ||||
| SEC | Securities and Exchange Commission | ||||
| SOFR | Secured Overnight Financing Rate | ||||
| TCF | TCF Financial Corporation | ||||
| TDR | Troubled Debt Restructuring | ||||
| Torana | Digital Payments Torana, Inc. | ||||
| U.S. Treasury | U.S. Department of the Treasury | ||||
| UPB | Unpaid Principal Balance | ||||
| VIE | Variable Interest Entity | ||||
| XBRL | eXtensible Business Reporting Language | ||||
6 Huntington Bancshares Incorporated
Huntington Bancshares Incorporated
PART I
When we refer to “Huntington,” “we,” “our,” “us,” and “the Company” in this report, we mean Huntington Bancshares Incorporated and our consolidated subsidiaries, unless the context indicates that we refer only to the parent company, Huntington Bancshares Incorporated. When we refer to the “Bank” in this report, we mean our only bank subsidiary, The Huntington National Bank, and its subsidiaries.
Item 1: Business
We are a multi-state diversified regional bank holding company organized under Maryland law in 1966 and headquartered in Columbus, Ohio. Through the Bank, we are committed to making people’s lives better, helping businesses thrive, and strengthening the communities we serve and have over 150 years of servicing the financial needs of our customers. Through our subsidiaries, we provide full-service commercial and consumer deposit, lending, and other banking services. This includes, but not limited to, payments, mortgage banking, automobile, recreational vehicle and marine financing, investment banking, capital markets, advisory, equipment financing, distribution finance (formerly referred to as inventory finance), investment management, trust, brokerage, insurance and other financial products and services. As of December 31, 2022, our 1,032 full-service branches and private client group offices are primarily located in Ohio, Colorado, Illinois, Indiana, Kentucky, Michigan, Minnesota, Pennsylvania, West Virginia, and Wisconsin. Select financial services and other activities are also conducted in other states.
On June 9, 2021, Huntington closed the acquisition of TCF Financial Corporation in an all-stock transaction valued at $7.2 billion. TCF was a financial holding company headquartered in Detroit, Michigan with operations across the Midwest. The acquisition brought increased scale and market density, as well as added new markets and capabilities. Historical periods prior to June 9, 2021 reflect results of legacy Huntington operations. Subsequent to closing, results reflect all post-acquisition activity. For further information, refer to Note 3 “Business Combinations” of the Notes to the Condensed Consolidated Financial Statements.
In May 2022, Huntington completed the acquisition of Torana, now known as Huntington Choice Pay, a digital payments business focused on business to consumer payments. This acquisition along with the formation of our enterprise-wide payments group reflects one of our strategic priorities to accelerate our payments capabilities and expand the services provided to our customers.
In June 2022, Huntington completed the acquisition of Capstone Partners, a top tier middle market investment bank and advisory firm. The transaction brings a national scale to serve middle market business owners throughout the corporate lifecycle, building on Huntington’s regional banking foundation. Capstone Partners related revenue, including mergers and acquisitions, capital raising and other advisory-related fees, is recognized within capital markets fees in the Consolidated Statements of Income. For further information, refer to Note 3 “Business Combinations” of the Notes to the Condensed Consolidated Financial Statements.
Our business segments are based on our internally-aligned segment leadership structure, which is how we monitor results and assess performance. For each of our four business segments, we expect the combination of our business model, investment in products and capabilities, and exceptional service to provide a competitive advantage that supports revenue and earnings growth. Our business model emphasizes the delivery of a complete set of banking products and services offered by larger banks but distinguished by local delivery and customer service.
A key strategic emphasis has been for our business segments to operate in cooperation to provide products and services to our customers and to build stronger and more profitable relationships using our OCR sales and service process, which align to our vision to be the leading people-first, digitally powered bank. The objectives of OCR are to:
•Use a consultative and advisory sales approach to provide solutions that are specific to each customer.
•Leverage each business segment in terms of its products and expertise to benefit customers.
•Develop prospects who may want to have multiple products and services as part of their relationship with us.
2022 Form 10-K 7
Following is a description of our four business segments and the Treasury / Other function:
•Commercial Banking: The Commercial Banking segment provides expertise through bankers, capabilities, and digital channels, and includes a comprehensive set of product offerings. Our target clients span from mid-market to large corporate (greater than $2 billion in revenue) across a national footprint. The Commercial Banking segment leverages internal partnerships for wealth management, trust, insurance, payments, and treasury management capabilities. The segment is divided into five business units: (1) Middle Market Banking, (2) Corporate, Specialty, and Government Banking, (3) Asset Finance, (4) Commercial Real Estate Banking, and (5) Capital Markets.
Middle Market Banking serves the banking needs of mid-sized clients (greater than $20 million in revenue) who reside in our geographic footprint. We leverage our local presence to serve our clients, extending our full suite of banking products including lending, liquidity, treasury management, and capital markets.
Corporate, Specialty, and Government Banking serves medium to large enterprises. We focus on specific industry verticals such as government and non-profits, healthcare, technology and telecommunications, franchises, financial sponsors, and global services. Our expertise in these markets allows us to uniquely serve our clients’ sophisticated banking, capital markets, and payments requirements.
Asset Finance serves our clients’ capital expenditure and working capital needs through equipment financing, asset-based lending, distribution finance, structured lending, and municipal financing solutions. Our relationship with large manufacturers is bolstered by a strong commitment to their dealers and financing needs.
Commercial Real Estate Banking provides banking solutions to commercial real estate developers and institutional sponsors across the nation. Within this group, Huntington Community Development improves the quality of life for our communities and the residents of low-to-moderate income neighborhoods by developing and delivering innovative products and services to support affordable housing and neighborhood stabilization.
Capital Markets delivers corporate risk management, institutional sales and trading, capital and equity raising and advisory services to all Commercial Banking clients.
•Consumer and Business Banking: The Consumer and Business Banking segment provides a wide array of financial products and services to consumer and small business customers including, but not limited to, checking accounts, savings accounts, money market accounts, CDs, investments, consumer loans, credit cards, and small business loans. The Consumer and Business Banking segment leverages internal partnerships for mortgages, insurance, interest rate risk protection, foreign exchange, and treasury management. Huntington serves customers through our network of channels, including branches, online banking, mobile banking, telephone banking, and ATMs.
We have a “Fair Play” banking philosophy: providing differentiated products and services, built on a strong foundation of customer friendly products and advocacy. Our brand resonates with consumers and businesses, helping us acquire new customers and deepen relationships with current customers. Our Fair Play banking suite of products includes 24-Hour Grace®, Asterisk-Free Checking®, Money Scout℠, $50 Safety Zone℠, Standby Cash®, Early Pay, Instant Access, The Hub, and Huntington Heads Up®.
Business Banking is a dynamic part of our business, and we are committed to being the bank of choice for businesses in our markets. Business Banking is defined as serving companies with annual revenues up to $20 million. Beyond conventional lending solutions, Huntington offers access to capital markets, treasury management, practice finance and SBA lending capabilities. We are the #1 SBA lender in the nation in units as of federal fiscal year end September 30, 2022. Huntington continues to develop products and services that are designed specifically to meet the needs of small business and look for ways to help companies find solutions to their financing needs.
8 Huntington Bancshares Incorporated
Consumer Payments and Lending provides consumer and small business credit and debit cards primarily to our deposit customers as well as unsecured personal loans, personal lines, and other direct secured loans. The products are distributed through both branch and online channels. The product suite is aimed at meeting our customers’ borrowing and transacting needs. The team continues to explore ways to innovate and continue to meet the evolving and rapidly changing payment needs of customers.
Through Consumer and Business Banking, we originate consumer loans and mortgages for customers who are generally located in our primary banking markets. Consumer and mortgage lending products are primarily distributed through the Consumer and Business Banking and RBHPCG segments, as well as through commissioned loan originators. Consumer and Business Banking earns interest on portfolio loans and loans held-for-sale, earns fee income from the origination and servicing of mortgage loans, and recognizes gains or losses from the sale of mortgage loans. Consumer and Business Banking supports the origination of mortgage loans across all segments.
•Vehicle Finance: Our products and services include providing financing to consumers for the purchase of automobiles, light-duty trucks, recreational vehicles, marine craft, and powersports at franchised and other select dealerships, and providing financing to franchised dealerships for the acquisition of new and used inventory. Products and services are delivered through highly specialized relationship-focused bankers and product partners. Huntington creates well-defined relationship plans which identify needs where solutions are developed and customer commitments are obtained.
The Vehicle Finance team services automobile dealerships, their owners, and consumers buying automobiles through these franchised dealerships. Huntington has provided new and used automobile financing and dealer services throughout the Midwest since the early 1950s. This consistency in the market and our focus on working with strong dealerships has allowed us to expand into select markets outside of the Midwest and to actively deepen relationships in 30 states while building a strong reputation. Huntington also provides financing for the purchase by consumers of recreational vehicles and marine craft on an indirect basis through dealerships in 35 states and for the purchase of powersports on an indirect basis through dealerships in 17 states.
•Regional Banking and The Huntington Private Client Group: Regional Banking and The Huntington Private Client Group is closely aligned with our regional banking markets. A fundamental point of differentiation is our commitment to be actively engaged within our local markets - building connections with community and business leaders and offering a uniquely personal experience delivered by colleagues working within those markets.
The core business of The Huntington Private Client Group is The Huntington Private Bank, which consists of Private Banking, Wealth & Investment Management, and Retirement Plan Services. The Huntington Private Bank provides high net-worth customers with deposit, lending (including specialized lending options), and other banking services. The Huntington Private Bank also delivers wealth management and legacy planning through investment and portfolio management, fiduciary administration, and trust services. This group also provides retirement plan services to corporate businesses. The Huntington Private Client Group also provides corporate trust services and institutional and mutual fund custody services.
•Treasury / Other: The Treasury / Other function includes technology and operations, other unallocated assets, liabilities, revenue, and expense.
The financial results for each of these business segments are included in Note 25 - “Segment Reporting” of Notes to Consolidated Financial Statements and are discussed in the “Business Segment Discussion” of our MD&A.
2022 Form 10-K 9
ESG
ESG Oversight
With oversight from our Board of Directors, we are committed to implementing strong ESG practices by living out our Purpose of making people’s lives better, helping businesses thrive, and strengthening the communities we serve. The following represents how ESG is governed and integrated throughout the Company:
Board Nominating and ESG Committee |
Board Risk Oversight Committee |
||||||||||||||||||||||||||||||||||||||||
Executive Leadership Team | |||||||||||||||||||||||||||||||||||||||||
Chief ESG Officer |
Risk Management Committee |
||||||||||||||||||||||||||||||||||||||||
ESG Strategy Team |
ESG Enterprise Working Group | Climate Risk Management Team |
|||||||||||||||||||||||||||||||||||||||
ESG Strategy Team
The ESG Strategy Team, led by our Chief ESG Officer, is responsible for advancing the ESG strategy and facilitating implementation of the strategy at the segment- and business unit-level; ensuring consistent understanding of ESG strategy throughout the Company; and assisting with ESG goal setting, reporting, and monitoring. The Team also works to identify ESG-related innovation and advancement opportunities aligned with strategic planning for the enterprise. This group includes executive leaders across business segments and support units and meets regularly throughout the year.
ESG Enterprise Working Group
The ESG Enterprise Working Group is primarily responsible for driving the overarching ESG strategy for the Company and making strategy recommendations to the Board; reporting ESG strategy, goals, and progress to the Board (typically on a quarterly basis); and publishing our various ESG disclosures, including the annual ESG Report. The ESG Working Group is comprised of a core, cross-functional group with representatives from our ESG, Investor Relations, Public Affairs, Legal, Corporate Communications, and Corporate Governance functions. To keep abreast of matters throughout the year, this group typically meets on a weekly basis.
Climate Risk Management Team
The Climate Risk Management Team, led by our Climate Risk Director, is responsible for overseeing the development and maintenance of a comprehensive program to identify, measure, monitor, control, and report climate-related risks at Huntington.
Economic
Our economic impact begins with a commitment to delivering sustainable, long-term shareholder value through financial performance, while maintaining an aggregate moderate-to-low, through-the-cycle risk appetite and a well-capitalized position. We align our corporate strategy to our purpose of helping others and building upon our market-leading, purpose-driven bank through focused efforts on the environmental, social and governance issues most important to our business and our stakeholders.
10 Huntington Bancshares Incorporated
Following the acquisition of TCF, in June 2021, we committed $40 billion toward a Community Plan to strengthen small businesses and foster economic justice through our footprint over the next five years. The Community Plan builds on the goals of our previous community plans, with expanded commitments focusing on increasing lending and services to address economic, social, environmental, and racial equity areas of need as follows:
•Huntington committed to providing $24 billion in affordable housing financing and consumer lending.
•Huntington expanded its Small Business lending programs into its new footprint and committed $10 billion to the programs.
•Huntington committed $6.5 billion in loans and investments to establish programs and services that foster equity in areas such as affordable housing, small business financing, and community services.
•Embedded in the areas of need above is a $16 billion commitment for Diversity, Equity, and Inclusion initiatives, with allocation of funds to diverse borrowers and communities to advance systemic change.
Huntington has additionally developed a Lift Local Business® program, and made a commitment of $100 million, which supports minority-, woman-, and veteran-owned small businesses throughout the business life cycle. This program offers loans, business planning support, free financial education courses delivered through Operation HOPE, and other services to help small business owners achieve their goals.
Environmental
Huntington is committed to environmental stewardship. Our environmental strategy outlines our holistic approach to enhancing our environmental performance and reducing our carbon footprint. We demonstrate our commitment and transparency through our disclosures to CDP, a global initiative that allows us to track and submit data annually toward managing our carbon footprint and certain other aspects of our environmental impact, in addition to our reporting to the Task Force on Climate-Related Financial Disclosures framework.
In 2022, we appointed our first Chief ESG Officer, bringing focused leadership to all matters related to ESG. We have met and exceeded our target year 2022 goals we announced in 2017 to reduce our operational (Scope 1 and Scope 2) emissions, reduce our landfill waste, paper printing, and water consumption. We have also committed to shifting 50% of our electricity usage to renewable sources by 2035. In addition, we are developing an exploratory roadmap for achieving a net zero carbon future and are focused on understanding and analyzing the magnitude of our value chain emissions (Scope 3). We joined the Partnership for Carbon Accounting Financials, which will enable us to measure and assess emissions associated with our loans and investments.
Human Capital (Social)
Huntington aspires to be a Category of One financial services institution: an organization unique in the combination of its culture and performance. Huntington had 19,920 average full-time equivalent colleagues during 2022, all of whom are encouraged to live out a shared purpose of making our colleagues’ and customers’ lives better, helping businesses thrive, and strengthening the communities we serve. We believe that our diverse workforce, supported by a culture of inclusiveness, enriches the experience of colleagues, and enhances our ability to perform as a company.
We engage with our colleagues to gain valuable feedback on a wide range of subjects related to the experience of working at Huntington, with a strategic focus on culture, trust, and engagement. We value the feedback colleagues choose to share and use the information to drive our talent management strategy, which focuses on four key areas and a commitment to diversity, equity, and inclusion:
•Engagement
•Development
•Retention, and
•Attraction of top talent
2022 Form 10-K 11
Engagement
At Huntington, we have taken steps to ensure our values, beliefs, and behaviors align with those of our colleagues. We have highly engaged colleagues committed to looking out for each other and our customers with a balanced focus on “what we do” and “how we do it.” This synergy has proven to positively impact colleague performance and satisfaction. 2022 marked the ninth consecutive year we conducted a company-wide engagement survey to measure our colleagues’ experience with a strategic focus on culture, trust, and engagement – and the results were reaffirming. In 2022, 87%, 85%, and 84% of colleagues responded favorably on trust, culture, and engagement, respectively. 82% of colleagues responded they would recommend Huntington as a great place to work.
The annual company-wide engagement survey is just one element of our continual colleague feedback program, which includes quick colleague pulse, new hire, manager-specific, and exit surveys. These surveys enhance leader understanding of the colleague experience, position Huntington to respond to colleague needs, and provide strong support to colleagues as they deliver performance in the spirit of our Purpose and Values.
At Huntington, living our shared Purpose extends beyond our daily work. We believe that building connections between colleagues, their families and our communities create a meaningful, fulfilling, and enjoyable colleague experience. During 2022, Huntington colleagues provided over 35,000 volunteer hours to over 1,300 organizations across our footprint, including foodbanks, homeless shelters, local schools, senior housing, and afterschool programs.
Development
We have created specialized programs to help our colleagues grow and develop. These programs include an online library which allows colleagues to take ownership of their development via direct access to role-based content. The content is divided into three key areas of development: learning and growth, maximizing performance, and protecting the company. All of the programming offered includes diversity, equity, and inclusion content. During 2022, colleagues at Huntington completed approximately 35 training hours per average full-time equivalent colleague, a 14% increase year over year. Huntington also provided a High-Potential Talent Development Program to top talent colleagues, so that they may further develop and accelerate their career growth. Additionally, we offer all colleagues the ability to obtain post-secondary education with reimbursement of tuition.
Retention
Huntington is committed to creating an environment where colleagues are valued, supported, and empowered. We offer competitive rewards programs that further strengthen our employment value proposition and encourages colleague retention. Our compensation structure includes benefit plans and programs focused on multiple facets of well-being, including physical, mental, and financial wellness. Effective January 1, 2022 we increased the minimum hourly pay rate to $19 and further increased this rate to $20 effective January 1, 2023. We also offer Workplace Flex, a program of practices for colleagues, so that they can achieve a healthy balance between work and life outside of work. The program includes practices that enable colleagues multiple paths to achieving balance, including: flexible scheduling (staggered hours, compressed workweeks, part-time schedules, and job-sharing), flexible work location (remote, hybrid, and on-site), and both health and financial wellness support beyond the typical medical/visual/dental programs (adoption and fertility, parental leave, on-site fitness and fitness discounts, mental health and financial counseling services, support for chronic conditions). Collectively, these practices position colleagues to be their best self both at work and outside of work.
Huntington’s commitment to pay equity is unwavering to ensure that gender, race, and ethnicity are not determining factors in salaries, bonuses, and stock-based awards. We continue to identify and implement effective practices to promote pay equity, including pay analyses, additional hiring practices that protect pay equity, and training managers on explicit and implicit bias in compensation and promotion decisions. Huntington seeks to maintain approximately 100% pay equity.
Collectively, these strategies create a colleague experience that entices colleagues to stay and fulfill their goals with Huntington.
12 Huntington Bancshares Incorporated
Attraction of top talent
We are dedicated to attracting top talent with an emphasis on experience and behaviors that align with our Purpose and our core values of ‘Can Do Attitude, Forward Thinking, and Service Heart.’
The diversity of our colleagues is a key component of our success as an organization as it allows us to have a workforce that is representative of the communities we serve and is critical to our sustained success and growth. We proactively seek out a diverse candidate pool during the recruitment process across all levels. We are focused on identifying, supporting, and promoting qualified diverse candidates in leadership roles. As of December 31, 2022, our combined middle, senior, and executive management levels were 47% diverse and our total workforce was 67% diverse. For the purpose of reporting the aforementioned data, we acknowledge diverse individuals as those who are identified as women, or as being racially/ethnically diverse.
Our commitment to creating an inclusive, diverse environment through embracing different skills, backgrounds, and perspectives, both in our communities and at work is demonstrated through our DEI Strategy and Operating Plan. This plan encompasses four focus areas, workplace inclusion, workforce diversity, community engagement, and supplier diversity. We execute this strategy and operating plan in multiple ways. Our Chief Diversity, Equity, Inclusion and Culture Officer ensures Diversity, Equity, and Inclusion perspectives are an integral part of executive decisions made at Huntington. This is achieved by measuring and socializing progress on diversity across our footprint and providing diversity and inclusion programs to our colleagues. In addition, we have Inclusion Councils, Business Resource Groups and Communities of Practice to support our commitment to engage, develop, retain, and attract top diverse talent. Inclusion Councils are voluntary, colleague driven regional and office-specific councils that focus on an inclusive, respectful, and supportive environment for all colleagues. The Business Resource Groups are voluntary, colleague-driven groups organized around a shared interest or common diversity dimension, each sponsored by a senior executive. The Communities of Practice are colleague-led, volunteer affinity groups which share information and experiences with fellow members. All of these are important components to our inclusion strategy and deliver content throughout the year.
Governance
Our Board of Directors and ELT are committed to executing on our long-term vision and aligning our strategic objectives with the interests of our stakeholders. Our Board members are accomplished leaders from diverse backgrounds, bringing the perspectives, skills, and experience necessary to use independent judgment that will effectively challenge and drive continued success. Our Board members approve the strategy, risk appetite, and ethical standards for the entire organization, and our ELT ensures our business and enterprise functions operate with high legal, ethical, and moral standards through clearly stated policies and procedures. Additionally, our leaders set the tone at the top and oversee compliance with our standards and direct the company’s financial reporting and internal controls.
At the end of 2022, our Board consisted of 15 directors, comprised of our Chairman/President/CEO as well as our Huntington National Bank Chairman, and 13 independent directors. Our key risk and governance committees require at least three directors who are independent and are chaired by an independent director with the knowledge and expertise to lead the committee. As of December 31, 2022, our ELT and Board were 50% and 47% diverse, respectively.
Competition
We compete with other banks and financial services companies such as savings and loans, credit unions, and finance and trust companies, as well as mortgage banking companies, equipment and automobile financing companies (including captive automobile finance companies), insurance companies, mutual funds, investment advisors, brokerage firms, and non-bank lenders both within and outside of our primary market areas. Financial Technology Companies, or FinTechs, are also providing nontraditional, but increasingly strong, competition for our borrowers, depositors, and other customers.
We compete for loans primarily on the basis of value and service by building customer relationships through addressing our customers’ entire suite of banking needs, demonstrating expertise, and providing convenience. We also consider the competitive pricing pressures in each of our markets.
2022 Form 10-K 13
We compete for deposits similarly on the basis of value and service and by providing convenience through a banking network of branches and ATMs within our markets and our website at www.huntington.com. We employ customer friendly practices, such as a $50 Safety Zonesm, which prevents customers from being charged an overdraft fee if they overdraw by $50 or less, 24-Hour Grace® account feature for both commercial and consumer accounts, which gives customers an additional business day to cover overdrafts to their account without being charged overdraft fees, Early Pay, which allows customers with direct deposit availability to their paycheck up to two days early, Instant Access, which allows up to $500 of a check deposit available to customers immediately, and Asterisk-free checking where there is no cost to open and no monthly maintenance fees. In addition, customers can qualify for Standby Cash® based primarily on their checking deposit history, not their credit score, which provides a $100 to $500 short-term line of credit free with automatic payments, or a 1% monthly interest charge without automatic payments. Huntington also has created a feature called Money Scoutsm, which is a tool that analyzes a customer’s spending habits and moves money that is not being used into that customer’s savings account and have introduced tools including The Hub and Huntington Heads Up® to provide customers greater visibility and control over their financial future. These measures fall under our approach of “Fair Play Banking.”
The table below shows our competitive ranking and market share based on deposits of FDIC-insured institutions as of June 30, 2022, in the top 10 MSAs in which we compete:
| MSA | Rank |
Deposits
(in millions)
|
Market Share | |||||||||||||||||
| Columbus, OH | 1 | $ | 36,779 | 37 | % | |||||||||||||||
| Detroit, MI | 4 | 17,394 | 9 | |||||||||||||||||
| Cleveland, OH | 2 | 14,486 | 12 | |||||||||||||||||
| Chicago, IL | 12 | 9,112 | 2 | |||||||||||||||||
| Minneapolis-St. Paul, MN | 5 | 6,523 | 3 | |||||||||||||||||
| Grand Rapids, MI | 1 | 6,268 | 20 | |||||||||||||||||
| Akron, OH | 1 | 5,487 | 27 | |||||||||||||||||
| Indianapolis, IN | 5 | 5,329 | 6 | |||||||||||||||||
| Cincinnati, OH | 4 | 4,649 | 3 | |||||||||||||||||
| Pittsburgh, PA | 9 | 4,265 | 2 | |||||||||||||||||
| Source: FDIC.gov, based on June 30, 2022 survey. | ||||||||||||||||||||
Many of our nonfinancial institution competitors have fewer regulatory constraints, broader geographic service areas, greater capital, and, in some cases, lower cost structures. In addition, competition for quality customers has intensified as a result of changes in regulation, advances in technology and product delivery systems, and consolidation among financial service providers.
FinTechs continue to emerge in key areas of banking. In addition, larger established technology platform companies continue to evaluate, and in some cases, create businesses focused on banking products. We are closely monitoring activity in the marketplace to ensure that our products and services are technologically competitive. Further, we continue to invest in and evolve our innovation program to develop, incubate, and launch new products and services driving ongoing differentiated value for our customers. Our overall strategy involves an active corporate development program that seeks to identify partnership and possible investment opportunities in technology-driven companies that can augment our distribution and product capabilities.
Regulatory Matters
Regulatory Environment
The banking industry is highly regulated. We are subject to supervision, regulation, and examination by various federal and state regulators, including the Federal Reserve, OCC, SEC, CFPB, FDIC, FINRA, and various state regulatory agencies. The statutory and regulatory framework that governs us is generally intended to protect depositors and customers, the DIF, the U.S. banking and financial system, and financial markets as a whole.
14 Huntington Bancshares Incorporated
Banking statutes, regulations, and policies are continually under review by Congress, state legislatures, and federal and state regulatory agencies. In addition to laws and regulations, state and federal bank regulatory agencies may issue policy statements, interpretive letters, and similar written guidance applicable to Huntington and its subsidiaries. Any change in the statutes, regulations, or regulatory policies applicable to us, including changes in their interpretation or implementation, could have a material effect on our business or organization.
Under the Tailoring Rules, Huntington and the Bank each qualify as a Category IV banking organization subject to the least restrictive of the requirements applicable to firms with $100 billion or more in total consolidated assets.
Our business, however, remains subject to extensive regulation and supervision. Furthermore, the U.S. banking agencies may issue additional rules to tailor the application of certain other regulatory requirements to BHCs and banks, including Huntington and the Bank.
We are also subject to the disclosure and regulatory requirements of the Securities Act of 1933, as amended, and the Securities Exchange Act of 1934, as amended, both as administered by the SEC, as well as the rules of Nasdaq that apply to companies with securities listed on the Nasdaq Global Select Market.
The following discussion describes certain elements of the comprehensive regulatory framework applicable to us. This discussion is not intended to describe all laws and regulations applicable to Huntington, the Bank, and Huntington’s other subsidiaries.
Huntington as a Bank Holding Company
Huntington is registered as a BHC with the Federal Reserve under the BHC Act and qualifies for and has elected to become a FHC under the GLBA. As an FHC, Huntington is permitted to engage in, and be affiliated with companies engaging in, a broader range of activities than those permitted for a BHC. BHCs are generally restricted to engaging in the business of banking, managing, or controlling banks, and certain other activities determined by the Federal Reserve to be closely related to banking. FHCs may also engage in activities that are considered to be financial in nature, as well as those incidental or complementary to financial activities, including underwriting, dealing, and making markets in securities, and making merchant banking investments in non-financial companies. Huntington and the Bank must each remain “well-capitalized” and “well managed” in order for Huntington to maintain its status as an FHC. In addition, the Bank must receive a CRA rating of at least “Satisfactory” at its most recent examination for Huntington to engage in the full range of activities permissible for FHCs.
Huntington is subject to primary supervision, regulation, and examination by the Federal Reserve, which serves as the primary regulator of our consolidated organization. The primary regulators of our non-bank subsidiaries directly regulate the activities of those subsidiaries, with the Federal Reserve exercising a supervisory role. Such non-bank subsidiaries include, for example, broker-dealers and investment advisers both registered with the SEC.
The Bank as a National Bank
The Bank is a national banking association chartered under the laws of the United States. As a national bank, the activities of the Bank are limited to those specifically authorized under the National Bank Act and OCC regulations. The Bank is subject to comprehensive primary supervision, regulation, and examination by the OCC. As a member of the DIF, the Bank is also subject to regulation and examination by the FDIC.
Supervision, Examination and Enforcement
A principal objective of the U.S. bank regulatory regime is to protect depositors and customers, the DIF, the U.S. banking and financial system, and financial markets as a whole by ensuring the financial safety and soundness of BHCs and banks, including Huntington and the Bank. Bank regulators regularly examine the operations of BHCs and banks. In addition, BHCs and banks are subject to periodic reporting and filing requirements.
2022 Form 10-K 15
The Federal Reserve, OCC, and FDIC have broad supervisory and enforcement authority with regard to BHCs and banks, including the power to conduct examinations and investigations, impose nonpublic supervisory agreements, issue cease and desist orders, impose fines and other civil and criminal penalties, terminate deposit insurance, and appoint a conservator or receiver. In addition, Huntington, the Bank, and other Huntington subsidiaries are subject to supervision, regulation, and examination by the CFPB, which is the primary administrator of most federal consumer financial statutes and Huntington’s primary consumer financial regulator. Supervision and examinations are confidential, and the outcomes of these actions may not be made public.
Bank regulators have various remedies available if they determine that the financial condition, capital resources, asset quality, earnings prospects, management, liquidity, or other aspects of a banking organization’s operations are unsatisfactory. The regulators may also take action if they determine that the banking organization or its management is violating or has violated any law or regulation. The regulators have the power to, among other things, prohibit unsafe or unsound practices, require affirmative actions to correct any violation or practice, issue administrative orders that can be judicially enforced, direct increases in capital, direct the sale of subsidiaries or other assets, limit dividends and distributions, restrict growth, assess civil monetary penalties, remove officers and directors, and terminate deposit insurance.
Engaging in unsafe or unsound practices or failing to comply with applicable laws, regulations, and supervisory agreements could subject the Company, its subsidiaries, and their respective officers, directors, and institution-affiliated parties to the remedies described above, and other sanctions. In addition, the FDIC may terminate a bank’s deposit insurance upon a finding that the bank’s financial condition is unsafe or unsound or that the bank has engaged in unsafe or unsound practices or has violated an applicable rule, regulation, order, or condition enacted or imposed by the bank’s regulatory agency.
Huntington is subject to the Federal Reserve’s LFI Rating System, to align its supervisory rating system, which places a greater emphasis on capital and liquidity, including related planning and risk management practices as compared to the supervisory rating system applicable to smaller BHCs. These ratings will remain confidential.
Bank Acquisitions by Huntington
BHCs, such as Huntington, must obtain prior approval of the Federal Reserve in connection with any acquisition that results in the BHC owning or controlling 5% or more of any class of voting securities of a bank or another BHC.
Acquisitions of Ownership of the Company
Acquisitions of Huntington’s voting stock above certain thresholds are subject to prior regulatory notice or approval under federal banking laws, including the BHC Act and the Change in Bank Control Act of 1978. Under the Change in Bank Control Act, a person or entity generally must provide prior notice to the Federal Reserve before acquiring the power to vote 10% or more of our outstanding common stock. Investors should be aware of these requirements when acquiring shares in our stock.
Interstate Banking
Under the Riegle-Neal Act, a BHC may acquire banks in states other than its home state, subject to any state requirement that the bank has been organized and operating for a minimum period of time, not to exceed five years, and the requirement that the BHC not control, prior to or following the proposed acquisition, more than 10% of the total amount of deposits of insured depository institutions nationwide or, unless the acquisition is the BHC’s initial entry into the state, more than 30% of such deposits in the state (or such lesser or greater amount set by the state). The Riegle-Neal Act also authorizes banks to merge across state lines, thereby creating interstate branches. A national bank, such as the Bank, with the approval of the OCC may open a branch in any state if the law of that state would permit a state bank chartered in that state to establish the branch.
16 Huntington Bancshares Incorporated
Regulatory Capital Requirements
Huntington and the Bank are subject to certain risk-based capital and leverage ratio requirements under the U.S. Basel III capital rules adopted by the Federal Reserve, for Huntington, and by the OCC, for the Bank. These rules implement the Basel III international regulatory capital standards in the United States, as well as certain provisions of the Dodd-Frank Act. These quantitative calculations are minimums, and the Federal Reserve and OCC may determine that a banking organization, based on its size, complexity, or risk profile, must maintain a higher level of capital in order to operate in a safe and sound manner.
Under the U.S. Basel III capital rules, Huntington’s and the Bank’s assets, exposures, and certain off-balance sheet items are subject to risk weights used to determine the institutions’ risk-weighted assets. These risk-weighted assets are used to calculate the following minimum capital ratios for Huntington and the Bank:
•CET1 Risk-Based Capital Ratio, equal to the ratio of CET1 capital to risk-weighted assets. CET1 capital primarily includes common shareholders’ equity subject to certain regulatory adjustments and deductions, including goodwill, intangible assets, certain deferred tax assets, and AOCI.
•Tier 1 Risk-Based Capital Ratio, equal to the ratio of Tier 1 capital to risk-weighted assets. Tier 1 capital is primarily comprised of CET1 capital, perpetual preferred stock, and certain qualifying capital instruments.
•Total Risk-Based Capital Ratio, equal to the ratio of total capital, including CET1 capital, Tier 1 capital, and Tier 2 capital, to risk-weighted assets. Tier 2 capital primarily includes qualifying subordinated debt and qualifying ALLL. Tier 2 capital also includes, among other things, certain trust preferred securities.
•Tier 1 Leverage Ratio, equal to the ratio of Tier 1 capital to quarterly average assets (net of goodwill, certain other intangible assets, and certain other deductions).
Huntington and the Bank elected to temporarily delay certain effects of CECL on regulatory capital until January 1, 2022 pursuant to a rule that allowed BHCs and banks to delay for two years 100% of the day-one impact of adopting CECL and 25% of the cumulative change in the reported allowance for credit losses since adopting CECL. As of December 31, 2022, we have phased in 25% of the cumulative CECL deferral with the remaining impact to be recognized through the first quarter 2025.
The total minimum regulatory capital ratios and well-capitalized minimum ratios are reflected in the table below in this section. The Federal Reserve has not yet revised the well-capitalized standard for BHCs to reflect the higher capital requirements imposed under the U.S. Basel III capital rules. For purposes of the Federal Reserve’s Regulation Y, including determining whether a BHC meets the requirements to be an FHC, BHCs, such as Huntington, must maintain a Tier 1 Risk-Based Capital Ratio of 6.0% or greater and a Total Risk-Based Capital Ratio of 10.0% or greater. If the Federal Reserve were to apply the same or a very similar well-capitalized standard to BHCs as that applicable to the Bank, Huntington’s capital ratios as of December 31, 2022, would exceed such revised well-capitalized standard. The Federal Reserve may require BHCs, including Huntington, to maintain capital ratios substantially in excess of mandated minimum levels, depending upon general economic conditions and a BHC’s particular condition, risk profile, and growth plans.
Failure to be well-capitalized or to meet minimum capital requirements could result in certain mandatory and possible additional discretionary actions by regulators that, if undertaken, could have an adverse material effect on our operations or financial condition. Failure to be well-capitalized or to meet minimum capital requirements could also result in restrictions on Huntington’s or the Bank’s ability to pay dividends or otherwise distribute capital or to receive regulatory approval of applications.
In addition to meeting the minimum capital requirements, under the U.S. Basel III capital rules, Huntington and the Bank must maintain the applicable capital buffer (SCB or CCB) requirements to avoid becoming subject to restrictions on capital distributions and certain discretionary bonus payments to management. Huntington is subject to a SCB of 3.3% effective for the period October 1, 2022 through September 30, 2023. Please refer to the SCB Requirements section below for further details. The Bank is subject to a CCB of 2.5%. The Tier 1 Leverage Ratio is not impacted by the SCB or CCB, and a banking institution may be considered well-capitalized while remaining out of compliance with the SCB or CCB.
2022 Form 10-K 17
The following table presents the minimum regulatory capital ratios, minimum ratio plus the capital buffer, and well-capitalized minimums compared with Huntington’s and the Bank’s regulatory capital ratios as of December 31, 2022, calculated using the regulatory capital methodology applicable as of the end of 2022.
| Minimum Regulatory Capital Ratio | Minimum Ratio + Capital Buffer (1) |
Well-Capitalized
Minimums (2)
|
At December 31, 2022 | |||||||||||||||||
| Actual | ||||||||||||||||||||
| Ratios: | ||||||||||||||||||||
| CET1 risk-based capital ratio | Consolidated | 4.50 | % | 7.80 | % | N/A | 9.36 | % | ||||||||||||
| Bank | 4.50 | 7.00 | 6.50 | % | 9.98 | |||||||||||||||
| Tier 1 risk-based capital ratio | Consolidated | 6.00 | 9.30 | 6.00 | 10.90 | |||||||||||||||
| Bank | 6.00 | 8.50 | 8.00 | 10.83 | ||||||||||||||||
| Total risk-based capital ratio | Consolidated | 8.00 | 11.30 | 10.00 | 13.09 | |||||||||||||||
| Bank | 8.00 | 10.50 | 10.00 | 12.47 | ||||||||||||||||
| Tier 1 leverage ratio | Consolidated | 4.00 | N/A | N/A | 8.60 | |||||||||||||||
| Bank | 4.00 | N/A | 5.00 | 8.54 | ||||||||||||||||
(1) Reflects a SCB of 3.3% for Huntington and CCB of 2.5% for the Bank.
(2) Reflects the well-capitalized standard applicable to Huntington under Federal Reserve Regulation Y and the well-capitalized standard applicable to the Bank.
Huntington has the ability to provide additional capital to the Bank to maintain the Bank’s risk-based capital ratios at levels which would be considered well-capitalized.
As of December 31, 2022, Huntington’s and the Bank’s regulatory capital ratios were above the well-capitalized standards and met the applicable capital buffer requirements.
Liquidity Requirements
Under the Capital and Liquidity Tailoring Rule, Huntington, as a Category IV banking organization with less than $50 billion in weighted short-term wholesale funding, is exempt from the LCR and net stable funding ratio requirements but will continue to be subject to internal liquidity stress tests and standards.
Enhanced Prudential Standards
Under the Dodd-Frank Act, as modified by the Economic Growth Act, BHCs with consolidated assets of more than $100 billion, such as Huntington, are currently subject to certain enhanced prudential standards. As a result, Huntington is subject to more stringent standards, including liquidity and capital requirements, leverage limits, stress testing, resolution planning, and risk management standards, than those applicable to smaller institutions. Certain larger banking organizations are subject to additional enhanced prudential standards.
As discussed in the Regulatory Environment section above, under the EPS Tailoring Rule, Huntington, as a Category IV banking organization, is subject to the least restrictive enhanced prudential standards applicable to firms with $100 billion or more in total consolidated assets. As compared to enhanced prudential standards that were applicable to Huntington, under the EPS Tailoring Rule, Huntington is no longer subject to company-run stress testing requirements and is subject to supervisory stress tests every other year (as opposed to annually), less frequent internal liquidity stress tests, and reduced liquidity risk management requirements.
Capital Planning and Stress Testing
Huntington is required to develop, maintain, and submit to the Federal Reserve a capital plan every year, which is subject to supervisory review in connection with the Federal Reserve’s CCAR process. Huntington is required to include within its capital plan an assessment of the expected uses and sources of capital and a description of all planned capital actions over the nine-quarter planning horizon, a detailed description of the process for assessing capital adequacy, its capital policy, and a discussion of any expected changes to its business plan that are likely to have a material impact on its capital adequacy. Under the stress buffer requirements final rule adopted in 2020, the CCAR process is used to determine a BHC’s SCB requirement. Please refer to the SCB Requirements section below for further details.
18 Huntington Bancshares Incorporated
The Federal Reserve expects BHCs subject to CCAR, such as Huntington, to have sufficient capital to withstand a highly adverse operating environment and to be able to continue operations, maintain ready access to funding, meet obligations to creditors and counterparties, and serve as credit intermediaries. In addition, the Federal Reserve evaluates the planned capital actions of these BHCs, including planned capital distributions such as dividend payments or stock repurchases. This involves a quantitative assessment of capital based on supervisory-run stress tests that assess the ability to maintain capital levels above certain minimum ratios, after taking all capital actions included in a BHC’s capital plan, under baseline and stressful conditions throughout the nine-quarter planning horizon. As part of CCAR, the Federal Reserve evaluates whether BHCs have sufficient capital to continue operations throughout times of economic and financial market stress and whether they have robust, forward-looking capital planning processes that account for their unique risks. We are generally prohibited from making a capital distribution unless, after giving effect to the distribution, we will meet all minimum regulatory capital ratios. Huntington may increase its capital distributions in excess of the amount included in their capital plan without seeking prior approval from the Federal Reserve as long as it otherwise complies with the automatic restrictions on distributions under the Federal Reserve’s capital rules.
While the Federal Reserve is no longer allowed to object to the capital plan of a large and non-complex BHC, such as Huntington, on a qualitative, as opposed to quantitative, basis, the Federal Reserve may evaluate the strength of Huntington’s qualitative capital planning process through the regular supervisory process and targeted horizontal reviews of particular aspects of capital planning. In addition, under the stress buffer requirements final rule adopted in 2020, the Federal Reserve may no longer object to capital plans of BHCs, including Huntington, on a quantitative basis. Please refer to the SCB Requirements section below for further details.
SCB Requirements
In 2020, the Federal Reserve issued a final rule to integrate its annual capital planning and stress testing requirements with certain ongoing regulatory capital requirements. The final rule applies to certain BHCs, including Huntington, and introduces a stress capital buffer and related changes to the capital planning and stress testing processes.
For risk-based capital requirements, Huntington, as a large BHC, is provided an SCB by the Federal Reserve that is determined annually based on the greater of (i) the difference between its starting and minimum projected CET1 Risk-Based Capital Ratio under the severely adverse scenario in the supervisory stress test, plus the sum of the dollar amount of Huntington’s planned common stock dividends for each of the fourth through seventh quarters of the planning horizon as a percentage of risk-weighted assets, or (ii) 2.5%. Effective for the period of October 1, 2022 through September 20, 2023, Huntington’s SCB is 3.3%, an increase from its previous SCB of 2.5%.
The final rule also makes related changes to the capital planning and stress testing process. Among other changes, the revised capital plan rule eliminates the assumption that Huntington’s balance sheet assets would increase over the planning horizon. In addition, provided that Huntington is otherwise in compliance with automatic restrictions on distributions under the Federal Reserve’s capital rules, Huntington will no longer be required to seek prior approval to make capital distributions in excess of those included in its capital plan.
Restrictions on Dividends
Huntington is a legal entity separate and distinct from its banking and non-banking subsidiaries. Since our consolidated net income consists largely of net income of Huntington’s subsidiaries, our ability to make capital distributions, including paying dividends and repurchasing shares, depends upon our receipt of dividends from these subsidiaries. Under federal law, there are various limitations on the extent to which the Bank can declare and pay dividends to Huntington, including those related to regulatory capital requirements, general regulatory oversight to prevent unsafe or unsound practices, and federal banking law requirements concerning the payment of dividends out of net profits, surplus, and available earnings. Certain contractual restrictions also may limit the ability of the Bank to pay dividends to Huntington. No assurances can be given that the Bank will, in any circumstances, pay dividends to Huntington.
2022 Form 10-K 19
Huntington’s ability to declare and pay dividends to our shareholders is similarly limited by federal banking law and Federal Reserve regulations and policy. As discussed in the Capital Planning section above, a BHC may pay dividends and repurchase stock only in accordance with a capital plan that has been reviewed by the Federal Reserve and as to which the Federal Reserve has not objected.
Huntington and the Bank must maintain the applicable capital buffer requirements to avoid becoming subject to restrictions on capital distributions, including dividends. For more information on the capital buffer requirements, see the SCB Requirements and the Regulatory Capital Requirements sections above.
Federal Reserve policy provides that a BHC generally should not pay dividends unless (1) the BHC’s net income over the last four quarters (net of dividends paid) is sufficient to fully fund the dividends, (2) the prospective rate of earnings retention appears consistent with the capital needs, asset quality, and overall financial condition of the BHC and its subsidiaries, and (3) the BHC will continue to meet minimum required capital adequacy ratios. Accordingly, a BHC should not pay cash dividends that can only be funded in ways that weaken the BHC’s financial health, such as by borrowing. A BHC should inform the Federal Reserve reasonably in advance of declaring or paying a dividend that exceeds earnings for the period for which the dividend is being paid or that could result in a material adverse change to the BHC’s capital structure. BHCs should also consult with the Federal Reserve before increasing dividends or redeeming or repurchasing capital instruments. Additionally, the Federal Reserve could prohibit or limit the payment of dividends by a BHC if it determines that payment of the dividend would constitute an unsafe or unsound practice.
Volcker Rule
Under the Volcker Rule, we are prohibited from (1) engaging in short-term proprietary trading for our own account and (2) having certain ownership interests in and relationships with hedge funds or private equity funds (covered funds). The Volcker Rule regulations contain exemptions for market-making, hedging, underwriting, trading in U.S. government and agency obligations, and also permit certain ownership interests in certain types of covered funds to be retained. They also permit the offering and sponsoring of covered funds under certain conditions. The Volcker Rule regulations impose significant compliance and reporting obligations on banking entities, such as Huntington. We have put in place the compliance programs required by the Volcker Rule and have either divested or received extensions for any holdings in illiquid covered funds.
Resolution Planning
As a Category IV banking organization, Huntington is not required to submit a resolution plan to the Federal Reserve. As an insured depository institution, the Bank is required by FDIC regulation to file a resolution plan on a triennial basis. This requirement had been suspended since 2018, but the FDIC announced in June 2021 that it would resume requiring bank level resolution plans for large banks, including the Bank, and bank-level resolution plans will have more streamlined content requirements. During 2021, the Bank was informed by the FDIC that its next resolution plan was due on or before December 1, 2022. The Bank submitted its resolution plan to the FDIC on November 30, 2022, which is currently under review.
Source of Strength
Huntington is required to serve as a source of financial and managerial strength to the Bank and, under appropriate conditions, to commit resources to support the Bank. This support may be required by the Federal Reserve at times when we might otherwise determine not to provide it or when doing so is not otherwise in the interests of Huntington or our shareholders or creditors. The Federal Reserve may require a BHC to make capital injections into a troubled subsidiary bank and may charge the BHC with engaging in unsafe and unsound practices if the BHC fails to commit resources to such a subsidiary bank or if it undertakes actions that the Federal Reserve believes might jeopardize the BHC’s ability to commit resources to such subsidiary bank.
Under these requirements, Huntington may in the future be required to provide financial assistance to the Bank should it experience financial distress. Capital loans by Huntington to the Bank would be subordinate in right of payment to deposits and certain other debts of the Bank. In the event of Huntington’s bankruptcy, any commitment by Huntington to a federal bank regulatory agency to maintain the capital of the Bank would be assumed by the bankruptcy trustee and entitled to a priority of payment.
20 Huntington Bancshares Incorporated
FDIC as Receiver or Conservator of Huntington
Upon the insolvency of an insured depository institution, such as the Bank, the FDIC may be appointed as the conservator or receiver of the institution. Under the Orderly Liquidation Authority, upon the insolvency of a BHC, such as Huntington, the FDIC may be appointed as conservator or receiver of the BHC, if certain findings are made by the FDIC, the Federal Reserve, and the Secretary of the Treasury, in consultation with the President. Acting as a conservator or receiver, the FDIC would have broad powers to transfer any assets or liabilities of the institution without the approval of the institution’s creditors.
Depositor Preference
The FDIA provides that, in the event of the liquidation or other resolution of an insured depository institution, including the Bank, the claims of depositors of the institution (including the claims of the FDIC as subrogee of insured depositors) and certain claims for administrative expenses of the FDIC as a receiver would have priority over other general unsecured claims against the institution. If the Bank were to fail, insured and uninsured depositors, along with the FDIC, would have priority in payment ahead of unsecured, non-deposit creditors, including Huntington, with respect to any extensions of credit they have made to such insured depository institution.
Transactions between a Bank and its Affiliates
Federal banking laws and regulations impose qualitative standards and quantitative limitations upon certain transactions between a bank and its affiliates, including between a bank and its holding company and companies that the BHC may be deemed to control for these purposes. Transactions covered by these provisions must be on arm’s-length terms and cannot exceed certain amounts which are determined with reference to the Bank’s regulatory capital. Moreover, if the transaction is a loan or other extension of credit, it must be secured by collateral in an amount and quality expressly prescribed by statute, and if the affiliate is unable to pledge sufficient collateral, the BHC may be required to provide it. The Dodd-Frank Act expanded the coverage and scope of these regulations, including by applying them to the credit exposure arising under derivative transactions, repurchase and reverse repurchase agreements, and securities borrowing and lending transactions. Federal banking laws also place similar restrictions on loans and other extensions of credit by FDIC-insured banks, such as the Bank, and their subsidiaries to their directors, executive officers, and principal shareholders.
Lending Standards and Guidance
The federal bank regulatory agencies have adopted uniform regulations prescribing standards for extensions of credit that are secured by liens or interests in real estate or made for the purpose of financing permanent improvements to real estate. Under these regulations, all insured depository institutions, such as the Bank, must adopt and maintain written policies establishing appropriate limits and standards for extensions of credit that are secured by liens or interests in real estate or are made for the purpose of financing permanent improvements to real estate. These policies must establish loan portfolio diversification standards, prudent underwriting standards (including loan-to-value limits) that are clear and measurable, loan administration procedures, and documentation, approval, and reporting requirements. The real estate lending policies must reflect consideration of the federal bank regulatory agencies’ Interagency Guidelines for Real Estate Lending Policies.
Heightened Governance and Risk Management Standards
The OCC has published guidelines to set expectations for the governance and risk management practices of certain large financial institutions, including the Bank. The guidelines require covered institutions to establish and adhere to a written governance framework in order to manage and control their risk-taking activities. In addition, the guidelines provide standards for the institutions’ boards of directors to oversee the risk governance framework. As discussed in the “Risk Management and Capital” section of the MD&A, the Bank currently has a written governance framework and associated controls.
2022 Form 10-K 21
Anti-Money Laundering
The Bank Secrecy Act and the Patriot Act contain anti-money laundering and financial transparency provisions intended to detect and prevent the use of the U.S. financial system for money laundering and terrorist financing activities. The Bank Secrecy Act, as amended by the Patriot Act, requires depository institutions and their holding companies to undertake activities including maintaining an AML program, verifying the identity of customers, verifying the identity of certain beneficial owners for legal entity customers, monitoring for and reporting suspicious transactions, reporting on cash transactions exceeding specified thresholds, and responding to requests for information by regulatory authorities and law enforcement agencies. The Bank is subject to the Bank Secrecy Act and, therefore, is required to provide its employees with AML training, designate an AML compliance officer, and undergo an annual, independent audit to assess the effectiveness of its AML program. The Bank has implemented policies, procedures, and internal controls that are designed to comply with these AML requirements. Bank regulators are focusing their examinations on AML compliance, and we will continue to monitor and augment, where necessary, our AML compliance programs. The federal banking agencies are required, when reviewing bank and BHC acquisition or merger applications, to take into account the effectiveness of the AML activities of the applicant.
The Anti-Money Laundering Act of 2020, enacted on January 1, 2021 as part of the National Defense Authorization Act, does not directly impose new requirements on banks, but requires the U.S. Treasury to issue National Anti-Money Laundering and Countering the Financing of Terrorism Priorities, and conduct studies and issue regulations that may, over the next few years, significantly alter some of the due diligence, recordkeeping and reporting requirements that the Bank Secrecy Act and Patriot Act impose on banks. The Anti-Money Laundering Act of 2020 also contains provisions that promote increased information-sharing and use of technology and increases penalties for violations of the Bank Secrecy Act and includes whistleblower incentives, both of which could increase the prospect of regulatory enforcement.
OFAC Regulation
OFAC is responsible for administering economic sanctions that affect transactions with designated foreign countries, nationals, and others, as defined by various Executive Orders and in various legislation. OFAC-administered sanctions take many different forms. For example, sanctions may include: (1) restrictions on trade with or investment in a sanctioned country, including prohibitions against direct or indirect imports from and exports to a sanctioned country and prohibitions on U.S. persons engaging in financial transactions relating to, making investments in, or providing investment-related advice or assistance to, a sanctioned country; and (2) a blocking of assets in which the government or “specially designated nationals” of the sanctioned country have an interest, by prohibiting transfers of property subject to U.S. jurisdiction, including property in the possession or control of U.S. persons. OFAC also publishes lists of persons, organizations, and countries suspected of aiding, harboring, or engaging in terrorist acts, known as Specially Designated Nationals and Blocked Persons. Blocked assets, for example property and bank deposits, cannot be paid out, withdrawn, set off, or transferred in any manner without a license from OFAC. Failure to comply with these sanctions could have serious legal and reputational consequences.
Data Privacy
Federal and state law contains extensive consumer privacy protection provisions. The GLBA requires financial institutions to periodically disclose their privacy policies and practices relating to sharing such information and enables retail customers to opt out of our ability to share information with unaffiliated third parties under certain circumstances. Other federal and state laws and regulations impact our ability to share certain information with affiliates and non-affiliates for marketing and/or non-marketing purposes, or to contact customers with marketing offers. These security and privacy policies and procedures for the protection of personal and confidential information are in effect across all businesses and geographic locations as applicable. Federal law also makes it a criminal offense, except in limited circumstances, to obtain or attempt to obtain customer information of a financial nature by fraudulent or deceptive means.
22 Huntington Bancshares Incorporated
Data privacy and data protection are areas of increasing state legislative focus. For example, in June 2018, the Governor of California signed into law the CCPA. The CCPA, which became effective on January 1, 2020, applies to for-profit businesses that conduct business in California and meet certain revenue or data collection thresholds. The CCPA gives consumers the right to request disclosure of information collected about them, and whether that information has been sold or shared with others, the right to request deletion of personal information (subject to certain exceptions), the right to opt out of the sale of the consumer’s personal information, and the right not to be discriminated against for exercising these rights. The CCPA contains several exemptions, including that many, but not all, requirements of the CCPA are inapplicable to information that is collected, processed, sold, or disclosed pursuant to the GLBA. California voters also recently passed the CPRA, which took effect on January 1, 2023, and significantly modifies the CCPA, including imposing additional obligations on covered companies and expanding California consumers’ rights with respect to certain sensitive personal information. On July 8, 2022, the CPPA commenced formal rulemaking to adopt regulations to implement the CPRA. However, regulations did not come into effect prior to the CPRA’s effective date. The CPPA has stated that the earliest proposed regulations could be in effect is April 2023, potentially resulting in further uncertainty and requiring us to incur additional costs and expenses in an effort to comply with the regulations. In California, the CCPA, the CPRA, and upcoming regulations may be interpreted or applied in a manner inconsistent with our understanding. Numerous other states have also enacted or are in the process of enacting state-level privacy, data protection and/or data security laws and regulations. The federal government may also pass additional data privacy or data protection legislation, including possible amendment of the GLBA.
Like other lenders, the Bank and other of our subsidiaries use credit bureau data in their underwriting activities. Use of such data is regulated under the FCRA, and the FCRA also regulates reporting information to credit bureaus, prescreening individuals for credit offers, sharing of information between affiliates, and using affiliate data for marketing purposes. Similar state laws may impose additional requirements on us and our subsidiaries.
FDIC Insurance
The DIF provides insurance coverage for certain deposits, up to a standard maximum deposit insurance amount of $250,000 per depositor and is funded through assessments on insured depository institutions, based on the risk each institution poses to the DIF. The Bank accepts customer deposits that are insured by the DIF and, therefore, must pay insurance premiums. The FDIC may increase the Bank’s insurance premiums based on various factors, including the FDIC’s assessment of its risk profile.
The FDIC also requires large insured depository institutions, including the Bank, to maintain enhanced deposit account recordkeeping and related information technology system capabilities to facilitate prompt payment of insured deposits if such an institution were to fail.
The FDIC, as required under the FDIA, established a plan on September 15, 2020, to restore the DIF reserve ratio to meet or exceed the statutory minimum of 1.35% within eight years. This plan did not include an increase in the deposit insurance assessment rate. Based on the FDIC’s recent projections, however, the FDIC determined that the DIF reserve ratio is at risk of not reaching the statutory minimum by the statutory deadline of September 30, 2028 without increasing the deposit insurance assessment rates. In October 2022, the FDIC adopted a final rule to increase initial base deposit insurance assessment rate schedules uniformly by 2 basis points, beginning on January 1, 2023. The FDIC also concurrently maintained the Designated Reserve Ratio for the DIF at 2%.
Compensation
Our compensation practices are subject to oversight by the Federal Reserve and, with respect to some of our subsidiaries and employees, by other financial regulatory bodies. The scope and content of compensation regulation in the financial industry are continuing to develop, and we expect that these regulations and resulting market practices will continue to evolve over a number of years.
2022 Form 10-K 23
The federal bank regulatory agencies have issued joint guidance on executive compensation designed to ensure that the incentive compensation policies of banking organizations, such as Huntington and the Bank, do not encourage imprudent risk taking and are consistent with the safety and soundness of the organization. The SEC also finalized a rule that directs stock exchanges to require listed companies to implement clawback policies to recover incentive-based compensation from current or former executive officers in the event of certain financial restatements and requires companies to disclose their clawback policies and their actions under those policies.
Cybersecurity
The GLBA requires financial institutions to implement a comprehensive information security program that includes administrative, technical, and physical safeguards to ensure the security and confidentiality of customer records and information.
The CISA is intended to improve cybersecurity in the United States by enhanced sharing of information about security threats among the U.S. government and private sector entities, including financial institutions. The CISA also authorizes companies to monitor their own systems notwithstanding any other provision of law and allows companies to carry out defensive measures on their own systems from cyber-attacks. The law includes liability protections for companies that share cyber threat information with third parties so long as such sharing activity is conducted in accordance with CISA.
In addition, effective April 1, 2022, the Federal Reserve, OCC and FDIC issued a rule that, among other things, requires a banking organization to notify its primary federal regulators within 36 hours after identifying a “computer-security incident” that the banking organization believes in good faith could materially disrupt, degrade or impair its business or operations in a manner that would, among other things, jeopardize the viability of its operations, result in customers being unable to access their deposit and other accounts, result in a material loss of revenue, profit or franchise value, or pose a threat to the financial stability of the United States.
Community Reinvestment Act
The CRA is intended to encourage banks to help meet the credit needs of their service areas, including low- and moderate-income neighborhoods, consistent with safe and soundness practices. The relevant federal bank regulatory agency, the OCC in the Bank’s case, examines each bank and assigns it a public CRA rating. A bank’s record of fair lending compliance is part of the resulting CRA examination report.
The CRA requires the relevant federal bank regulatory agency to consider a bank’s CRA assessment when considering the bank’s application to conduct certain mergers or acquisitions or to open or relocate a branch office. The Federal Reserve also must consider the CRA record of each subsidiary bank of a BHC in connection with any acquisition or merger application filed by the BHC. An unsatisfactory CRA record could substantially delay or result in the denial of an approval or application by Huntington or the Bank. The Bank received the highest possible overall CRA rating of “Outstanding” in its most recent examination.
In June 2022, the Federal Reserve, FDIC, and OCC issued a joint proposal to amend their regulations implementing the CRA. The proposed rules would materially revise the current CRA framework, including new assessment area requirements, new methods of calculating credit for lending, investment, and service activities, and additional data collection and reporting requirements. The proposed rule included analysis indicating a significant increase in the thresholds for large banks to receive “Outstanding” ratings in the future.
Debit Interchange Fees
We are subject to a statutory requirement that interchange fees for electronic debit transactions that are paid to or charged by payment card issuers, including the Bank, be reasonable and proportional to the cost incurred by the issuer. Interchange fees for electronic debit transactions are limited to 21 cents plus 0.05% of the transaction, plus an additional one cent per transaction fraud adjustment. These fees impose requirements regarding routing and exclusivity of electronic debit transactions. On October 3, 2022, the Federal Reserve finalized a rule that amends Regulation II to, among other things, specify that debit card issuers should enable all debit card transactions, including card-not-present transactions such as online payments, to be processed on at least two unaffiliated payment card networks. The final rule becomes effective July 1, 2023. As an issuer with over $10 billion in assets, Huntington is subject to Regulation II and will work to implement these new requirements.
24 Huntington Bancshares Incorporated
Consumer Protection Regulation and Supervision
We are subject to supervision and regulation by the CFPB with respect to federal consumer protection laws. We are also subject to certain state consumer protection laws, and under the Dodd-Frank Act, state attorneys general and other state officials are empowered to enforce certain federal consumer protection laws and regulations. State authorities have increased their focus on and enforcement of consumer protection rules. These federal and state consumer protection laws apply to a broad range of our activities and to various aspects of our business and include laws relating to interest rates, fair lending, disclosures of credit terms and estimated transaction costs to consumer borrowers, debt collection practices, the use of and the provision of information to consumer reporting agencies, and the prohibition of unfair, deceptive, or abusive acts or practices in connection with the offer, sale, or provision of consumer financial products and services.
The CFPB has promulgated many mortgage-related final rules since it was established under the Dodd-Frank Act, including rules related to the ability to repay and qualified mortgage standards, mortgage servicing standards, loan originator compensation standards, high-cost mortgage requirements, HMDA requirements, and appraisal and escrow standards for higher priced mortgages. The mortgage-related final rules issued by the CFPB have materially restructured the origination, servicing, and securitization of residential mortgages in the United States. These rules have impacted, and will continue to impact, the business practices of mortgage lenders, including the Company.
In January 2021, the OCC released a final rule that would require certain OCC-supervised banks to provide access to services, capital, and credit based on their risk assessment of individual customers, rather than broad-based decisions affecting whole categories or classes of customers, which includes requiring banks to make each financial service they offer available to all persons in the geographic market served by them on proportionally equal terms. The rule was scheduled to take effect on April 1, 2021, but the OCC has delayed the effective date indefinitely. However, the OCC announced that the next confirmed Comptroller of the Currency will review the final rule, and its future remains uncertain.
Available Information
We are subject to the informational requirements of the Exchange Act and, in accordance with the Exchange Act, we file annual, quarterly, and current reports, proxy statements, and other information with the SEC. The SEC maintains an Internet web site that contains reports, proxy statements, and other information about issuers, like us, who file electronically with the SEC. The address of the site is http://www.sec.gov. The reports and other information, including any related amendments, filed by us with, or furnished by us to, the SEC are also available free of charge at our Internet web site as soon as reasonably practicable after such material is electronically filed with, or furnished to, the SEC. The address of the site is http://www.huntington.com. Except as specifically incorporated by reference into this Annual Report on Form 10-K, information on those web sites is not part of this report. You also should be able to inspect reports, proxy statements, and other information about us at the offices of the Nasdaq National Market at 33 Whitehall Street, New York, New York 10004.
2022 Form 10-K 25
Item 1A: Risk Factors
The risks and uncertainties listed below present risks that could have a material impact on Huntington’s financial condition, the results of operations or its business. Some of these risks and uncertainties are interrelated and the occurrence of one or more of them may exacerbate the effect of others. The risks and uncertainties described below are not the only ones Huntington faces. Additional risks and uncertainties not presently known to Huntington or that Huntington believes to be immaterial may also adversely affect its business. Additionally refer to factors set forth under the caption “Forward-Looking Statements.” For more information on how we manage risks, see discussion in the “Risk Governance” section of our MD&A.
In addition to the other information included or incorporated by reference into this report, readers should carefully consider that the following important factors, among others, could negatively impact our business, future results of operations, and future cash flows materially.
Credit Risks:
Our ACL level may prove to not be adequate or be negatively affected by credit risk exposures which could adversely affect our net income and capital.
Our business depends on the creditworthiness of our customers. Our ACL of $2.3 billion at December 31, 2022, represented management’s estimate of the current expected losses in our loan and lease portfolio (ALLL) as well as our unfunded lending commitments (AULC). We regularly review our ACL for appropriateness. In doing so, we consider probability of default, loss given default and exposure at default depending on economic parameters for each month of the remaining contractual term of the credit exposure. The economic parameters are developed using available information relating to past events, current conditions, and reasonable and supportable forecasts. There is no certainty that our ACL will be appropriate over time to cover lifetime losses of the portfolio because of unanticipated adverse changes in the economy, market conditions, or events adversely affecting specific customers, industries, or markets. If the credit quality of our customer base materially decreases, if the risk profile of a market, industry, or group of customers changes materially, or if the ACL is not appropriate, our net income and capital could be materially adversely affected, which could have a material adverse effect on our financial condition and results of operations.
In addition, regulatory review of risk ratings and loan and lease losses may impact the level of the ACL and could have a material adverse effect on our financial condition and results of operations.
Weakness in economic conditions could adversely affect our business.
Continued economic uncertainty and a recessionary or stagnant economy could adversely affect our business, financial condition, and results of operations. Our performance could be negatively affected to the extent there is deterioration in business and economic conditions, including persistent inflation, rising interest rates, supply chain issues or labor shortages, which have direct or indirect material adverse impacts on us, our customers, and our counterparties. These conditions could result in one or more of the following:
•A decrease in the demand for loans and other products and services offered by us;
•A decrease in customer savings generally and in the demand for savings and investment products offered by us; and
•An increase in the number of customers and counterparties who become delinquent, file for protection under bankruptcy laws, or default on their loans or other obligations to us.
•An increase in the number of delinquencies, bankruptcies, or defaults could result in a higher level of NPAs, NCOs, provision for credit losses, and valuation adjustments on loans held for sale.
The markets we serve are dependent on industrial and manufacturing businesses and, thus, are particularly vulnerable to adverse changes in economic conditions affecting these sectors.
26 Huntington Bancshares Incorporated
A U.S. government debt default would have a material adverse impact on our business and financial performance, including a decrease in the value of Treasury bonds and other government securities held by us, which could negatively impact the Bank’s capital position and its ability to meet regulatory requirements. Other negative impacts could be volatile capital markets, an adverse impact on the U.S. economy and the U.S. dollar, as well as increased default rates among borrowers in light of increased economic uncertainty. Some of these impacts might occur even in the absence of an actual default but as a consequence of extended political negotiations around the threat of such a default and a government shutdown.
Market Risks:
Changes in interest rates could reduce our net interest income, reduce transactional income, and negatively impact the value of our loans, securities, and other assets. This could have an adverse impact on our cash flows, financial condition, results of operations, and capital.
Our results of operations depend substantially on net interest income, which is the difference between interest earned on interest earning assets (such as investments and loans) and interest paid on interest bearing liabilities (such as deposits and borrowings). Interest rates are highly sensitive to many factors, including governmental monetary policies, inflation, and domestic and international economic and political conditions. Conditions such as inflation, deflation, recession, unemployment, money supply, and other factors beyond our control may also affect interest rates. In addition, decisions by the Federal Reserve to increase or reduce the size of its balance sheet or to engage in tapering its purchase of assets may also affect interest rates. If our interest earning assets mature or reprice faster than interest bearing liabilities in a declining interest rate environment, net interest income could be materially adversely impacted. Likewise, if interest bearing liabilities mature or reprice more quickly than interest earning assets in a rising interest rate environment, net interest income could be adversely impacted.
Changes in interest rates can affect the value of loans, securities, assets under management, and other assets, including mortgage servicing rights. An increase in interest rates that adversely affects the ability of borrowers to pay the principal or interest on loans and leases may lead to an increase in NPAs and a reduction of income recognized, which could have a material adverse effect on our results of operations and cash flows. When we place a loan on nonaccrual status, we reverse any accrued but unpaid interest receivable, which decreases interest income. However, we continue to incur interest expense as a cost of funding NALs without any corresponding interest income. In addition, transactional income, including trust income, brokerage income, and gain on sales of loans can vary significantly from period-to-period based on a number of factors, including the interest rate environment. A decline in interest rates along with a flattening yield curve limits our ability to reprice deposits given the current historically low level of interest rates and could result in declining net interest margins if longer duration assets reprice faster than deposits.
Rising interest rates reduce the value of our fixed-rate securities. Any unrealized loss from these portfolios impacts OCI, shareholders’ equity, and the Tangible Common Equity ratio. Any realized loss from these portfolios impacts regulatory capital ratios. In a rising interest rate environment, pension and other post-retirement obligations somewhat mitigate negative OCI impacts from securities and financial instruments. For more information, refer to “Market Risk” of the MD&A.
Certain investment securities, notably mortgage-backed securities, are sensitive to rising and falling rates. Generally, when rates rise, prepayments of principal and interest will decrease, and the duration of mortgage-backed securities will increase. Conversely, when rates fall, prepayments of principal and interest will increase, and the duration of mortgage-backed securities will decrease. In either case, interest rates have a significant impact on the value of mortgage-backed securities.
MSR fair values are sensitive to movements in interest rates, as expected future net servicing income depends on the projected outstanding principal balances of the underlying loans, which can be reduced by prepayments. Prepayments usually increase when mortgage interest rates decline and decrease when mortgage interest rates rise.
In addition to volatility associated with interest rates, the Company also has exposure to equity markets related to the investments within the benefit plans and other income from client-based transactions.
2022 Form 10-K 27
Inflation could negatively impact our business, our profitability, and our stock price.
Prolonged periods of inflation may impact our profitability by negatively impacting our fixed costs and expenses, including increasing funding costs and expense related to talent acquisition and retention. Additionally, inflation may lead to a decrease in consumer and clients’ purchasing power and negatively affect the need or demand for our products and services. If significant inflation continues, our business could be negatively affected by, among other things, increased default rates leading to credit losses which could decrease our appetite for new credit extensions. These inflationary pressures could result in missed earnings and budgetary projections causing our stock price to suffer.
Industry competition may have an adverse effect on our success.
Our profitability depends on our ability to compete successfully. We operate in a highly competitive environment, and we expect competition to intensify. Certain of our competitors are larger and have more resources than we do, enabling them to be more aggressive than us in competing for loans and deposits. In our market areas, we face competition from other banks and financial service companies that offer similar services. Some of our non-bank competitors are not subject to the same extensive regulations we are and, therefore, may have greater flexibility in competing for business. Technological advances have made it possible for our non-bank competitors to offer products and services that traditionally were banking products and for financial institutions and other companies to provide electronic and internet-based financial solutions, including mobile payments, online deposit accounts, electronic payment processing, and marketplace lending, without having a physical presence where their customers are located. Legislative or regulatory changes also could lead to increased competition in the financial services sector. For example, the Economic Growth Act and the Tailoring Rules reduce the regulatory burden of certain large BHCs and raise the asset thresholds at which more onerous requirements apply, which could cause certain large BHCs to become more competitive or to more aggressively pursue expansion. Our ability to compete successfully depends on a number of factors, including customer convenience, quality of service by investing in new products and services, electronic platforms, personal contacts, pricing, and range of products. If we are unable to successfully compete for new customers and retain our current customers, our business, financial condition, or results of operations may be adversely affected. In particular, if we experience an outflow of deposits as a result of our customers seeking investments with higher yields or greater financial stability, or a desire to do business with our competitors, we may be forced to rely more heavily on borrowings and other sources of funding to operate our business and meet withdrawal demands, thereby adversely affecting our net interest margin. For more information, refer to “Competition” section of Item 1: Business.
The transition away from LIBOR may adversely affect our business.
Central banks around the world, including the Federal Reserve, have commissioned committees and working groups of market participants and official sector representatives to replace LIBOR and replace or reform other interest rate benchmarks. The publication of most LIBOR rates ceased as of the end of December 2021, while certain U.S. dollar LIBOR tenors are expected to continue to be published until June 30, 2023.
A transition away from the widespread use of LIBOR to alternative rates and other potential interest rate benchmark reforms has begun and will continue over the course of the next few years. These reforms may cause such rates to perform differently than in the past, or to disappear entirely, or have other consequences which cannot be predicted.
A group of market participants convened by the Federal Reserve, the Alternative Reference Rate Committee (ARRC), has selected SOFR as its recommended alternative to LIBOR. The Federal Reserve Bank of New York started to publish SOFR in April 2018. SOFR is a broad measure of the cost of overnight borrowings collateralized by Treasury securities that was selected by the ARRC due to the depth and robustness of the U.S. Treasury repurchase market. In January of 2020, Huntington was added as an ARRC member. The passage of the Adjustable Interest Rate (LIBOR) Act by Congress, and the Federal Reserve’s implementing rule, should decrease the risk of contracts that are not remediated prior to the cessation deadline by providing the terms for a transition to SOFR.
28 Huntington Bancshares Incorporated
The market transition away from LIBOR to an alternative reference rate, such as SOFR, is complex and could have a range of adverse effects on our business, financial condition, and results of operations. In particular, any such transition could:
•Adversely affect the interest rates paid or received on, the revenue and expenses associated with or the value of Huntington’s LIBOR-based assets and liabilities, which include certain variable rate loans, Huntington’s Series B preferred stock, certain of Huntington’s junior subordinated debentures, certain of the Bank’s senior notes and certain other securities or financial arrangements;
•Adversely affect the interest rates paid or received on, the revenue and expenses associated with or the value of other securities or financial arrangements, given LIBOR’s role in determining market interest rates globally;
•Prompt inquiries or other actions from regulators in respect of Huntington’s preparation and readiness for the replacement of LIBOR with an alternative reference rate; and
•Result in disputes, litigation, or other actions with counterparties regarding the interpretation and enforceability of certain fallback language in LIBOR-based contracts and securities.
Huntington implemented a LIBOR transition plan in 2018. As of December 31, 2021, the company ceased issuance of new LIBOR loans. Alternative reference rates at this time are predominantly SOFR-based. Systems, products, and analytics have been effectively transitioned away from LIBOR and are utilizing alternative reference rates. Remaining LIBOR transition project activities include remediation of remaining LIBOR products, including acquired products from TCF by June of 2023. We continue to assess the impact on our customers, with any needed LIBOR exceptions escalated to ELT for approval.
The manner and impact of the transition from LIBOR to an alternative reference rate, as well as the effect of these developments on our funding costs, loan, and investment and trading securities portfolios, asset-liability management, and business, is uncertain.
Liquidity Risks:
Changes in Huntington’s financial condition or in the general banking industry, or changes in interest rates, could result in a loss of depositor confidence.
Liquidity is the ability to meet cash flow needs on a timely basis at a reasonable cost. The Bank uses its liquidity to extend credit and to repay liabilities as they become due or as demanded by customers.
Our primary source of liquidity is our large supply of deposits from consumer and commercial customers. The continued availability of this supply depends on customer willingness to maintain deposit balances with banks in general and us in particular. The availability of deposits can also be impacted by regulatory changes (e.g., changes in FDIC insurance, liquidity requirements, etc.), changes in the financial condition of Huntington, other banks, or the banking industry in general, changes in the interest rates our competitors pay on their deposits, and other events which can impact the perceived safety or economic benefits of bank deposits. While we make significant efforts to consider and plan for hypothetical disruptions in our deposit funding, market-related, geopolitical, or other events could impact the liquidity derived from deposits.
We are a holding company and depend on dividends by our subsidiaries for most of our funds.
Huntington is an entity separate and distinct from the Bank. The Bank conducts most of our operations, and Huntington depends upon dividends from the Bank to service Huntington’s debt and to pay dividends to Huntington’s shareholders. The availability of dividends from the Bank is limited by various statutes and regulations. It is possible, depending upon the financial condition including liquidity and capital adequacy of the Bank and other factors, that the OCC could limit the payment of dividends or other payments to Huntington by the Bank. In addition, the payment of dividends by our other subsidiaries is also subject to the laws of the subsidiary’s state of incorporation, and regulatory capital and liquidity requirements applicable to such subsidiaries. In the event that the Bank was unable to pay dividends to us, we in turn would likely have to reduce or stop paying dividends on our Preferred and Common Stock. Our failure to pay dividends on our Preferred and Common Stock could have a material adverse effect on the market price of our Preferred and Common Stock. Additional information regarding dividend restrictions is provided in Item 1: Business - Regulatory Matters.
2022 Form 10-K 29
If we lose access to capital markets, we may not be able to meet the cash flow requirements of our depositors, creditors, and borrowers, or have the operating cash needed to fund corporate expansion and other corporate activities.
Wholesale funding sources can include securitization, federal funds purchased, securities sold under repurchase agreements, non-core deposits, and long-term debt. The Bank is also a member of the FHLB, which provides members access to funding through advances collateralized with mortgage-related assets. We maintain a portfolio of highly-rated, marketable securities that is available as a source of liquidity.
Capital markets disruptions can directly impact the liquidity of Huntington and the Bank. The inability to access capital markets funding sources as needed could adversely impact our financial condition, results of operations, cash flows, and level of regulatory-qualifying capital. We may, from time-to-time, consider using our existing liquidity position to opportunistically retire outstanding securities in privately negotiated or open market transactions.
A reduction in our credit rating could adversely affect our access to capital and could increase our cost of funds.
The credit rating agencies regularly evaluate Huntington and the Bank, and credit ratings are based on a number of factors, including our financial strength and ability to generate earnings, as well as factors not entirely within our control, including conditions affecting the financial services industry, the economy, and changes in rating methodologies. There can be no assurance that we will maintain our current credit ratings. A downgrade of the credit ratings of Huntington or the Bank could adversely affect our access to liquidity and capital, and could significantly increase our cost of funds, trigger additional collateral or funding requirements, and decrease the number of investors and counterparties willing to lend to us or purchase our securities. This could affect our growth, profitability, and financial condition, including liquidity.
Instability in global economic conditions and geopolitical matters, as well as volatility in financial markets, could have a material adverse effect on our results of operations and financial condition.
Instability in global economic conditions and geopolitical matters, as well as volatility in financial markets, could have a material adverse effect on our results of operations and financial condition. The macroeconomic environment in the United States is susceptible to global events and volatility in financial markets. For example, trade negotiations between the U.S. and other nations remain uncertain and could adversely impact economic and market conditions for the Company and its clients and counterparties. In addition, global demand for products may exceed supply during the economic recovery from the COVID-19 pandemic, and such shortages may cause prolonged inflation, adversely impact consumer and business confidence, and adversely affect the economy as well as our financial condition and results.
30 Huntington Bancshares Incorporated
Operational Risks:
Our operational or security systems or infrastructure, or those of third parties, could fail or be breached, which could disrupt our business and adversely impact our operations, liquidity, and financial condition, as well as cause legal or reputational harm.
The potential for operational risk exposure exists throughout our business and, as a result of our interactions with, and reliance on, third parties, is not limited to our own internal operational functions. Our operational and security systems and infrastructure, including our computer systems, data management, and internal processes, as well as those of third parties, are integral to our performance. We rely on our employees and third parties in our day-to-day and ongoing operations, who may, as a result of human error, misconduct, malfeasance, failure, or breach of our or of third-party systems or infrastructure, expose us to risk. For example, our ability to conduct business may be adversely affected by any significant disruptions to us or to third parties with whom we interact or upon whom we rely. Our financial, accounting, data processing, backup, or other operating or security systems and infrastructure may fail to operate properly or become disabled or damaged as a result of a number of factors, including events that are wholly or partially beyond our control, which could adversely affect our ability to process transactions or provide services. Such events may include: sudden increases in customer transaction volume; electrical, telecommunications, or other major physical infrastructure outages; disease pandemics; cyber-attacks; and events arising from local or larger scale political or social matters, including wars and terrorist attacks. Additional events beyond our control that could impact our business directly or indirectly include natural disasters such as earthquakes and weather events, including tornadoes, hurricanes, and floods. Neither the occurrence nor the potential impact of these events can be predicted, and the frequency and severity of weather events may be impacted by climate changes. In addition, we may need to take our systems off-line if they become infected with malware or a computer virus or as a result of another form of cyber-attack. In the event that backup systems are utilized, they may not process data as quickly as our primary systems and some data might not have been saved to backup systems, potentially resulting in a temporary or permanent loss of such data. In addition, our ability to implement backup systems and other safeguards with respect to third-party systems is more limited than with respect to our own systems. We frequently update our systems to support our operations and growth and to remain compliant with applicable laws, rules, and regulations. This updating entails significant costs and creates risks associated with implementing new systems and integrating them with existing ones, including business interruptions. Implementation and testing of controls related to our computer systems, security monitoring, and retaining and training personnel required to operate our systems also entail significant costs. Operational risk exposures could adversely impact our operations, liquidity, and financial condition, as well as cause reputational harm. In addition, we may not have adequate insurance coverage to compensate for losses from a major interruption.
We face security risks, including denial of service attacks, hacking, social engineering attacks targeting our colleagues and customers, malware intrusion or data corruption attempts, and identity theft that could result in the disclosure of confidential information, adversely affect our business or reputation, and create significant legal and financial exposure.
Our computer systems and network infrastructure and those of third parties, on which we are highly dependent, are subject to security risks and could be susceptible to cyber-attacks, such as denial of service attacks, hacking, terrorist activities, or identity theft. Our business relies on the secure processing, transmission, storage, and retrieval of confidential, proprietary, and other information in our computer and data management systems and networks, and in the computer and data management systems and networks of third parties. In addition, to access our network, products, and services, our customers and other third parties may use personal mobile devices or computing devices that are outside of our network environment and are subject to their own cybersecurity risks.
2022 Form 10-K 31
We, our customers, regulators, and other third parties, including other financial services institutions and companies engaged in data processing, have been subject to, and are likely to continue to be the target of, cyber-attacks. These cyber-attacks include computer viruses, malicious or destructive code, phishing attacks, denial of service or information, ransomware, improper access by employees or vendors, attacks on personal email of employees, ransom demands to not expose security vulnerabilities in our systems or the systems of third parties or other security breaches that could result in the unauthorized release, gathering, monitoring, misuse, loss, or destruction of confidential, proprietary, and other information of ours, our employees, our customers, or of third parties, damage our systems or otherwise materially disrupt our or our customers’ or other third parties’ network access or business operations. As cyber-threats continue to evolve, we may be required to expend significant additional resources to continue to modify or enhance our protective measures or to investigate and remediate any information security vulnerabilities or incidents. Despite efforts to ensure the integrity of our systems and implement controls, processes, policies, and other protective measures, we may not be able to anticipate all security breaches, nor may we be able to implement sufficient preventive measures against such security breaches, which may result in material losses or consequences for us.
Cybersecurity risks for banking organizations have significantly increased in recent years in part because of the proliferation of new technologies, and the use of the internet and telecommunications technologies to conduct financial transactions. For example, cybersecurity risks may increase in the future as we continue to increase our mobile-payment and other internet-based product offerings and expand our internal usage of web-based products and applications. In addition, cybersecurity risks have significantly increased in recent years in part due to the increased sophistication and activities of organized crime affiliates, terrorist organizations, hostile foreign governments, disgruntled employees or vendors, activists, and other external parties, including those involved in corporate espionage. Even the most advanced internal control environment may be vulnerable to compromise. Due to increasing geopolitical tensions, nation state cyber-attacks and ransomware are both increasing in sophistication and prevalence. Targeted social engineering and email attacks (i.e., “spear phishing” attacks) are becoming more sophisticated and are extremely difficult to prevent. In such an attack, an attacker will attempt to fraudulently induce colleagues, customers, or other users of our systems to disclose sensitive information in order to gain access to our data or that of our clients. Persistent attackers may succeed in penetrating defenses given enough resources, time, and motive. The techniques used by cyber criminals change frequently, may not be recognized until launched, and may not be recognized until well after a breach has occurred. The speed at which new vulnerabilities are discovered and exploited often before security patches are published continues to rise. Remote work further increases the risk that we may experience cyber incidents as a result of our employees, vendors, and other third parties with which we interact working remotely on less secure systems and environments.
The risk of a security breach caused by a cyber-attack at a vendor or by unauthorized vendor access has also increased in recent years. Additionally, the existence of cyber-attacks or security breaches at third-party vendors with access to our data may not be disclosed to us in a timely manner. Further, our ability to monitor our vendors’ cybersecurity practices is limited. Although we generally have agreements relating to cybersecurity and data privacy in place with our vendors, we cannot guarantee that such agreements will prevent a cyber-incident impacting our systems or information or enable us to obtain adequate or any reimbursement from our service providers in the event we should suffer any such incidents. Due to applicable laws and regulations or contractual obligations, we may be held responsible for cyber-incidents attributed to our vendors as they relate to the information we share with them.
We also face indirect technology, cybersecurity, and operational risks relating to the customers, clients, and other third parties with whom we do business or upon whom we rely to facilitate or enable our business activities, including, for example, financial counterparties, regulators, and providers of critical infrastructure such as internet access and electrical power. As a result of increasing consolidation, interdependence, and complexity of financial entities and technology systems, a technology failure, cyber-attack, or other information or security breach that significantly degrades, deletes, or compromises the systems or data of one or more financial entities could have a material impact on counterparties or other market participants, including us. This consolidation, interconnectivity, and complexity increases the risk of operational failure. Any third-party technology failure, cyber-attack, or other information or security breach, termination, or constraint could, among other things, adversely affect our ability to effect transactions, service our clients, manage our exposure to risk, or expand our business.
32 Huntington Bancshares Incorporated
Cyber-attacks or other information or security breaches, whether directed at us or third parties, may result in a material loss or have material consequences. Furthermore, the public perception that a cyber-attack on our systems has been successful, whether or not this perception is correct, may damage our reputation with customers and third parties with whom we do business. Hacking of personal information and identity theft risks, in particular, could cause serious reputational harm. A successful penetration or circumvention of system security could cause us serious negative consequences, including our loss of customers and business opportunities, costs associated with maintaining business relationships after an attack or breach; significant business disruption to our operations and business, misappropriation, exposure, or destruction of our confidential information, intellectual property, funds, and/or those of our customers; or damage to our or our customers’ and/or third parties’ computers or systems, and could result in a violation of applicable privacy laws and other laws, litigation exposure, regulatory fines, penalties or intervention, loss of confidence in our security measures, reputational damage, reimbursement or other compensatory costs, additional compliance costs, and could adversely impact our results of operations, liquidity and financial condition. In addition, we may not have adequate insurance coverage to compensate for losses from a cybersecurity event.
Cybersecurity and data privacy are areas of heightened legislative and regulatory focus.
As cybersecurity and data privacy risks for banking organizations and the broader financial system have significantly increased in recent years, cybersecurity and data privacy issues have become the subject of increasing legislative and regulatory focus. The federal bank regulatory agencies have proposed regulations that would enhance cyber risk management standards, which would apply to a wide range of large financial institutions and their third-party service providers, including us and the Bank, and would focus on cyber risk governance and management, management of internal and external dependencies, and incident response, cyber resilience, and situational awareness. Several states have also proposed or adopted cybersecurity legislation and regulations, which require, among other things, notification to affected individuals when there has been a security breach of their personal data. For more information regarding cybersecurity and data privacy, refer to Item 1: Business - “Regulatory Matters.”
We receive, maintain, and store non-public personal information of our customers and counterparties, including, but not limited to, personally identifiable information and personal financial information. The sharing, use, disclosure, and protection of these types of information are governed by federal and state law. Both personally identifiable information and personal financial information are increasingly subject to legislation and regulation, the intent of which is to protect the privacy of personal information and personal financial information that is collected and handled. For example, in June of 2018, the Governor of California signed into law the CCPA. The CCPA, which became effective on January 1, 2020, applies to for-profit businesses that conduct business in California and meet certain revenue or data collection thresholds. Numerous other states have also enacted or are in the process of enacting state-level privacy, data protection and/or data security laws and regulations. For more information regarding data privacy laws and regulations, refer to Item 1: Business - “Regulatory Matters.”
Further, we make public statements about our use, collection, disclosure, and other processing of personal information through our privacy policies, information provided on our website and press statements. Although we endeavor to comply with our public statements and documentation, we may at times fail to do so or be alleged to have failed to do so. The publication of our privacy policies and other statements that provide promises and assurances about privacy, data protection, and data security can subject us to potential government or legal action if they are found to be deceptive, unfair, or misrepresentative of our actual practices.
We may become subject to new legislation or regulation concerning cybersecurity or the privacy of personally identifiable information and personal financial information or of any other information we may store or maintain. We could be adversely affected if new legislation or regulations are adopted or if existing legislation or regulations are modified such that we are required to alter our systems or require changes to our business practices or privacy policies. If cybersecurity, data privacy, data protection, data transfer, or data retention laws are implemented, interpreted, or applied in a manner inconsistent with our current practices, we may be subject to fines, litigation, or regulatory enforcement actions or ordered to change our business practices, policies, or systems in a manner that adversely impacts our operating results.
2022 Form 10-K 33
We face significant operational risks which could lead to financial loss, expensive litigation, and loss of confidence by our customers, regulators, and capital markets.
We are exposed to many types of operational risks, including the risk of fraud or theft by colleagues or outsiders, unauthorized transactions by colleagues or outsiders, operational errors by colleagues, business disruption, and system failures. Huntington executes against a significant number of controls, a large percent of which are manual and dependent on adequate execution by colleagues and third-party service providers. There is inherent risk that unknown single points of failure through the execution chain could give rise to material loss through inadvertent errors or malicious attack. These operational risks could lead to financial loss, expensive litigation, and loss of confidence by our customers, regulators, and the capital markets.
Moreover, negative public opinion can result from our actual or alleged conduct in any number of activities, including clients, products, and business practices; corporate governance; acquisitions; and from actions taken by government regulators and community organizations in response to those activities. Negative public opinion can adversely affect our ability to attract and retain customers and can also expose us to litigation and regulatory action.
Relative to acquisitions, we incur risks and challenges associated with the integration of employees, accounting systems, and technology platforms from acquired businesses and institutions in a timely and efficient manner, and we cannot guarantee that we will be successful in retaining existing customer relationships or achieving anticipated operating efficiencies expected from such acquisitions. Acquisitions may be subject to the receipt of approvals from certain governmental authorities, including the Federal Reserve, the OCC, and the United States Department of Justice, as well as the approval of our shareholders and the shareholders of companies that we seek to acquire. These approvals for acquisitions may not be received, may take longer than expected, or may impose conditions that are not presently anticipated or that could have an adverse effect on the combined company following the acquisitions. Subject to requisite regulatory approvals, future business acquisitions may result in the issuance and payment of additional shares of stock, which would dilute current shareholders’ ownership interests. Additionally, acquisitions may involve the payment of a premium over book and market values. Therefore, dilution of our tangible book value and net income per common share could occur in connection with any future transaction.
Failure to maintain effective internal controls over financial reporting could impair our ability to accurately and timely report our financial results or prevent fraud, resulting in loss of investor confidence and adversely affecting our business and our stock price.
Effective internal controls over financial reporting are necessary to provide reliable financial reports and prevent fraud. We are subject to regulation that focuses on effective internal controls and procedures. Such controls and procedures are modified, supplemented, and changed from time-to-time as necessitated by our growth and in reaction to external events and developments. Any failure to maintain an effective internal control environment could impact our ability to report our financial results on an accurate and timely basis, which could result in regulatory actions, loss of investor confidence, and an adverse impact on our business and our stock price.
We rely on quantitative models to measure risks and to estimate certain financial values.
Quantitative models may be used to help manage certain aspects of our business and to assist with certain business decisions, including estimating expected lifetime credit losses, measuring the fair value of financial instruments when reliable market prices are unavailable, estimating the effects of changing interest rates and other market measures on our financial condition and results of operations, managing risk, and for capital planning purposes (including during the CCAR capital planning and capital adequacy process). Our measurement methodologies rely on many assumptions, historical analyses, and correlations. These assumptions may not capture or fully incorporate conditions leading to losses, particularly in times of market distress, and the historical correlations on which we rely may no longer be relevant. Additionally, as businesses and markets evolve, our measurements may not accurately reflect this evolution. Even if the underlying assumptions and historical correlations used in our models are adequate, our models may be deficient due to errors in computer code, inaccurate data, misuse of data, or the use of a model for a purpose outside the scope of the model’s design.
34 Huntington Bancshares Incorporated
All models have certain limitations. Reliance on models presents the risk that our business decisions based on information incorporated from models will be adversely affected due to incorrect, missing, or misleading information. In addition, our models may not capture or fully express the risks we face, may suggest that we have sufficient capitalization when we do not, or may lead us to misjudge the business and economic environment in which we will operate. If our models fail to produce reliable results on an ongoing basis, we may not make appropriate risk management, capital planning, or other business or financial decisions. Strategies that we employ to manage and govern the risks associated with our use of models may not be effective or fully reliable. Also, information that we provide to the public or regulators based on poorly designed models could be inaccurate or misleading.
Banking regulators continue to focus on the models used by banks and bank holding companies in their businesses. Some of our decisions that the regulators evaluate, including distributions to our shareholders, could be affected adversely due to their perception that the quality of the models used to generate the relevant information are insufficient.
We rely on third parties to provide key components of our business infrastructure.
We rely on third-party service providers to leverage subject matter expertise and industry best practice, provide enhanced products and services, and reduce costs. Although there are benefits in entering into third-party relationships with vendors and others, there are risks associated with such activities. When entering a third-party relationship, the risks associated with that activity are not passed to the third-party but remain our responsibility. The Technology Committee of the board of directors provides oversight related to the overall risk management process associated with third-party relationships. Management is accountable for the review and evaluation of all new and existing third-party relationships. Management is responsible for ensuring that adequate controls are in place to protect us and our customers from the risks associated with vendor relationships.
Increased risk could occur based on poor planning, oversight, control, and inferior performance or service on the part of the third-party and may result in legal costs or loss of business. While we have implemented a vendor management program to actively manage the risks associated with the use of third-party service providers, any problems caused by third-party service providers could adversely affect our ability to deliver products and services to our customers and to conduct our business. Replacing a third-party service provider could also take a long period of time and result in increased expenses.
Changes in accounting policies, standards, and interpretations could affect how we report our financial condition and results of operations.
The FASB, regulatory agencies, and other bodies that establish accounting standards periodically change the financial accounting and reporting standards governing the preparation of our financial statements. Additionally, those bodies that establish and interpret the accounting standards (such as the FASB, SEC, and banking regulators) may change prior interpretations or positions on how these standards should be applied.
For further discussion, see Note 2 - “Accounting Standards Update” to the Consolidated Financial Statements.
2022 Form 10-K 35
Impairment of goodwill could require charges to earnings, which could result in a negative impact on our results of operations.
Our goodwill could become impaired in the future. If goodwill were to become impaired, it could limit the ability of the Bank to pay dividends to Huntington, adversely impacting Huntington liquidity and ability to pay dividends or repay debt. Assumptions affecting our goodwill impairment evaluation include earnings projections, the discount rates used in the income approach to measure fair value, and observed peer multiples used in estimating the fair value under the market approach. We are required to test goodwill for impairment at least annually or when impairment indicators are present. If an impairment determination is made in a future reporting period, our earnings and book value of goodwill will be reduced by the amount of the impairment. If an impairment loss is recorded, it will have little or no impact on the tangible book value of our Common Stock, or our regulatory capital levels, but such an impairment loss could significantly reduce the Bank’s earnings and thereby restrict the Bank’s ability to make dividend payments to us without prior regulatory approval, because Federal Reserve policy states the bank holding company dividends should be paid from current earnings. At December 31, 2022, the book value of our goodwill was $5.6 billion, substantially all of which was recorded at the Bank. Any such write down of goodwill or other acquisition related intangibles will reduce Huntington’s earnings, as well.
Climate change manifesting as physical or transition risks could adversely affect our operations, businesses, and customers.
There is an increasing concern over the risks of climate change and related environmental sustainability matters. The physical risks of climate change include discrete events, such as flooding and wildfires, and longer-term shifts in climate patterns, such as extreme heat, sea level rise, and more frequent and prolonged drought. Under medium or longer-term scenarios, such events, if uninterrupted or unaddressed, could disrupt our operations or those of our customers or third parties on which we rely, including through direct damage to assets and indirect impacts from supply chain disruption and market volatility. Additionally, transitioning to a low-carbon economy may entail extensive policy, legal, technology and market initiatives. Transition risks, including changes in consumer preferences and additional regulatory requirements or supervisory expectations or taxes, could increase our expenses and undermine our strategies. In addition, our reputation and client relationships may be damaged as a result of our practices related to climate change, including our involvement, or our customers’ involvement, in certain industries or projects, in the absence of mitigation and/or transition measures, associated with causing or exacerbating climate change, as well as any decisions we make to continue to conduct or change our activities in response to considerations relating to climate change. As climate risk is interconnected with all key risk types, we have established a formal climate risk program to embed climate risk considerations into our risk management processes across all established risk pillars, such as market, credit, and operational risks. While the timing and severity of climate change may not be entirely predictable and our risk management processes may not be effective in mitigating climate risk exposure, we continue to build capabilities to identify, assess, and manage climate risks.
The effects of COVID-19 have adversely impacted our operations and financial performance, and it, or a similar health crisis or pandemic, could have similar adverse impacts in future periods.
Although U.S. and global economies have begun to recover from the COVID-19 pandemic as many health and safety restrictions have been lifted and vaccine distribution has increased, certain adverse consequences of the pandemic, including labor shortages, disruptions of global supply chains, and inflationary pressures, continue to impact the macroeconomic environment and could adversely affect our business.
The pandemic has caused us, and could continue to cause us, to recognize credit losses in our loan portfolios and increases in our allowance for credit losses should the effects of the pandemic continue for an extended period of time or worsen. Furthermore, the pandemic could cause us to recognize impairment of our goodwill and our financial assets. Sustained adverse effects may also increase our cost of capital, prevent us from satisfying our minimum regulatory capital ratios and other supervisory requirements, or result in downgrades in our credit ratings.
36 Huntington Bancshares Incorporated
The COVID-19 pandemic has resulted in heightened operational risks. Many of our colleagues continue to work remotely at least on a part-time basis, which may create additional cybersecurity risk and opportunities for cybercriminals to exploit vulnerabilities. Cybercriminals have increased their attempts to compromise business emails, including an increase in phishing attempts, and fraudulent vendors or other parties may view the pandemic as an opportunity to prey upon consumers and businesses during this time. The increase in online and remote banking activities may also increase the risk of fraud in certain instances.
Compliance Risks:
We operate in a highly regulated industry, and the laws and regulations that govern our operations, corporate governance, executive compensation and financial accounting, or reporting, including changes in them, or our failure to comply with them, may adversely affect us.
The banking industry is highly regulated. We are subject to supervision, regulation, and examination by various federal and state regulators, including the Federal Reserve, OCC, SEC, CFPB, FDIC, FINRA, and various state regulatory agencies. The statutory and regulatory framework that governs us is generally intended to protect depositors and customers, the DIF, the U.S. banking and financial system, and financial markets as a whole - not to protect shareholders. These laws and regulations, among other matters, prescribe minimum capital requirements, impose limitations on our business activities (including foreclosure and collection practices), limit the dividend or distributions that we can pay, restrict the ability of institutions to guarantee our debt, and impose certain specific accounting requirements that may be more restrictive and may result in greater or earlier charges to earnings or reductions in our capital than accounting principles generally accepted in the United States. Compliance with laws and regulations can be difficult and costly, and changes to laws and regulations often impose additional compliance costs. Such regulation and supervision may increase our costs and limit our ability to pursue business opportunities. Further, our failure to comply with these laws and regulations, even if the failure was inadvertent or reflects a difference in interpretation, could subject us to restrictions on our business activities, fines, and other penalties, any of which could adversely affect our results of operations, capital base, and the price of our securities. Further, any new laws, rules, and regulations could make compliance more difficult or expensive or otherwise adversely affect our business and financial condition.
Legislative and regulatory actions taken now or in the future that impact the financial industry may materially adversely affect us by increasing our costs, adding complexity in doing business, impeding the efficiency of our internal business processes, negatively impacting the recoverability of certain of our recorded assets, requiring us to increase our regulatory capital, limiting our ability to pursue business opportunities, and otherwise resulting in a material adverse impact on our financial condition, results of operation, liquidity, or stock price.
Both the scope of the laws and regulations and the intensity of the supervision to which we are subject increased in response to the financial crisis, as well as other factors such as technological and market changes. Regulatory enforcement and fines have also increased across the banking and financial services sector. Compliance with these laws and regulations have resulted in and will continue to result in additional costs, which could be significant, and may have a material and adverse effect on our results of operations. In addition, if we do not appropriately comply with current or future legislation and regulations, especially those that apply to our consumer operations, which has been an area of heightened focus, we may be subject to fines, penalties or judgments, or material regulatory restrictions on our businesses, which could adversely affect operations and, in turn, financial results.
We expect the current administration will continue to implement a regulatory reform agenda that is significantly different than that of the former administration. This reform agenda could include a heightened focus on consumer protection, fair lending, the regulation of loan portfolios and credit concentrations to borrowers impacted by climate change, heightened scrutiny on Bank Secrecy Act and AML requirements, topics related to social equity, executive compensation, and increased capital and liquidity, as well as limits on share buybacks and dividends. In addition, mergers and acquisitions could be dampened by increased antitrust scrutiny. We also expect reform proposals for the short-term wholesale markets. It is too early for us to assess the extent to which these policies would be implemented and what their impact on our business will be.
2022 Form 10-K 37
The resolution of significant pending litigation, if unfavorable, could have an adverse effect on our results of operations for a particular period.
We face legal risks in our businesses, and the volume of claims and amount of damages and penalties claimed in litigation and regulatory proceedings against financial institutions remain high. Substantial legal liability against us could have material adverse financial effects or cause significant reputational harm to us, which in turn could seriously harm our business prospects. It is possible that the ultimate resolution of these matters, if unfavorable, may be material to the results of operations for a particular reporting period.
For more information on litigation risks, see Note 22 - “Commitments and Contingent Liabilities” to the Consolidated Financial Statements.
Noncompliance with the Bank Secrecy Act and other anti-money laundering statutes and regulations could cause us material financial loss.
The Bank Secrecy Act and the Patriot Act contain anti-money laundering and financial transparency provisions intended to detect and prevent the use of the U.S. financial system for money laundering and terrorist financing activities. The Bank Secrecy Act, as amended by the Patriot Act, requires depository institutions and their holding companies to undertake activities including maintaining an anti-money laundering program, verifying the identity of clients, monitoring for and reporting suspicious transactions, reporting on cash transactions exceeding specified thresholds, and responding to requests for information by regulatory authorities and law enforcement agencies. FinCEN, a unit of the Treasury Department that administers the Bank Secrecy Act, is authorized to impose significant civil money penalties for violations of those requirements and has recently engaged in coordinated enforcement efforts with the federal bank regulatory agencies, as well as the United States Department of Justice, Drug Enforcement Administration, and IRS.
There is also increased scrutiny of compliance with the rules enforced by the OFAC. If our policies, procedures, and systems are deemed deficient or the policies, procedures, and systems of the financial institutions that we have already acquired or may acquire in the future are deficient, we would be subject to liability, including fines and regulatory actions such as restrictions on our ability to pay dividends and the necessity to obtain regulatory approvals to proceed with certain planned business activities, including acquisition plans, which would negatively impact our business, financial condition, and results of operations. Failure to maintain and implement adequate programs to combat money laundering and terrorist financing could also have serious reputational consequences for us.
For more information regarding the Bank Secrecy Act, Patriot Act, anti-money laundering requirements and OFAC-administered sanctions, refer to Item 1: Business - “Regulatory Matters.”
Strategic Risk:
We operate in a highly competitive industry which depends on our ability to successfully execute our strategic plan and adapt our products and services to evolving industry standards and consumer preferences.
We are subject to intense competition from both other financial institutions and from non-bank entities, including FinTech companies. Technology has lowered the barriers to entry, with customers having a growing variety of traditional and nontraditional alternatives, including crowdfunding, digital wallets, and money transfer services. The continuous widespread adoption of new technologies, including internet services and mobile applications, and advanced ATM functionality, is influencing how individuals and firms conduct their financial affairs and is changing the delivery channels for financial services. Our “People-First, Digitally-Powered” strategic plan considers the implications of these changes in technology. Additionally, these changes require us to adapt our product and services, as well as our distribution of them, to evolving industry standards and customer preferences. Failure to address competitive pressures could make it more difficult for us to attract and retain customers across our businesses.
38 Huntington Bancshares Incorporated
Our success depends, in part, on our ability to successfully implement our strategic plan as well as adapt existing products and services and develop competitive new products and services demanded by our customers. The widespread adoption of technologies will continue to require substantial investments to modify or adapt existing products and services and to develop new product or services. Additionally, we may not be successful in executing our strategic plan, introducing new products or services, achieving market acceptance of new product or services, anticipating or reacting to customers changing preferences, or attracting and retaining loyal customers.
We depend on our executive officers and key personnel to continue the implementation of our long-term business strategy and could be harmed by the loss of their services.
We believe that our continued growth and future success will depend in large part on the skills of our management team and our ability to motivate and retain these individuals and other key personnel. The loss of service of one or more of our executive officers or key personnel could reduce our ability to successfully implement our long-term business strategy, our business could suffer, and the value of our stock could be materially adversely affected. Leadership changes will occur from time to time, and we cannot predict whether significant resignations will occur or whether we will be able to recruit additional qualified personnel. We believe our management team possesses valuable knowledge about the banking industry and that their knowledge and relationships would be very difficult to replicate. Our success also depends on the experience of our branch managers and lending officers and on their relationships with the customers and communities they serve. The loss of these key personnel could negatively impact our banking operations. The loss of key personnel, or the inability to recruit and retain qualified personnel in the future, could have an adverse effect on our business, financial condition, or operating results.
Bank regulations regarding capital and liquidity, including the CCAR assessment process and the U.S. Basel III capital and liquidity standards, could require higher levels of capital and liquidity. Among other things, these regulations could impact our ability to pay common stock dividends, repurchase common stock, attract cost-effective sources of deposits, or require the retention of higher amounts of low yielding securities.
The Federal Reserve administers CCAR, a periodic forward-looking quantitative assessment of Huntington’s capital adequacy and planned capital distributions and a review of the strength of Huntington’s practices to assess capital needs. The Federal Reserve makes a quantitative assessment of capital based on supervisory-run stress tests that assess the ability to maintain capital levels above each minimum regulatory capital ratio after making all capital actions included in Huntington’s capital plan, under baseline and stressful conditions throughout a nine-quarter planning horizon. The CCAR process is also used to determine Huntington’s SCB requirement. There can be no assurance that the Federal Reserve or OCC will respond favorably to our capital plans, planned capital actions, or stress test results, and the Federal Reserve, OCC, or other regulatory capital requirements may limit or otherwise restrict how we utilize our capital, including common stock dividends and stock repurchases.
We are also required to maintain minimum capital ratios and the Federal Reserve and OCC may determine that Huntington and/or the Bank, based on size, complexity, or risk profile, must maintain capital ratios above these minimums in order to operate in a safe and sound manner. In the event we are required to raise capital to maintain required minimum capital and leverage ratios or ratios above the required applicable minimums, we may be forced to do so when market conditions are undesirable or on terms that are less favorable to us than we would otherwise require. Furthermore, in order to prevent becoming subject to restrictions on our ability to distribute capital or make certain discretionary bonus payments to management, the Bank must maintain a CCB of 2.5%, and Huntington must maintain the applicable SCB determined as part of the CCAR process, which are in addition to our required minimum capital ratios.
For more information regarding CCAR, stress testing, and capital and liquidity requirements, refer to Item 1: Business - “Regulatory Matters.”
2022 Form 10-K 39
If our regulators deem it appropriate, they can take regulatory actions that could result in a material adverse impact on our financial results, ability to compete for new business, or preclude mergers or acquisitions. In addition, regulatory actions could constrain our ability to fund our liquidity needs or pay dividends. Any of these actions could increase the cost of our services.
We are subject to the supervision and regulation of various state and federal regulators, including the OCC, Federal Reserve, FDIC, SEC, CFPB, FINRA, and various state regulatory agencies. As such, we are subject to a wide variety of laws and regulations, many of which are discussed in Item 1: Business - “Regulatory Matters.” As part of their supervisory process, which includes periodic examinations and continuous monitoring, the regulators have the authority to impose restrictions or conditions on our activities and the manner in which we manage the organization. Such actions could negatively impact us in a variety of ways, including charging monetary fines, impacting our ability to pay dividends, precluding mergers or acquisitions, limiting our ability to offer certain products or services, or imposing additional capital requirements.
Under the supervision of the CFPB, our Consumer and Business Banking products and services are subject to heightened regulatory oversight and scrutiny with respect to compliance under consumer laws and regulations. We may face a greater number or wider scope of investigations, enforcement actions, and litigation in the future related to consumer practices, thereby increasing costs associated with responding to or defending such actions. Also, federal and state regulators have been increasingly focused on sales practices of branch personnel, including taking regulatory action against other financial institutions. In addition, increased regulatory inquiries and investigations, as well as any additional legislative or regulatory developments affecting our consumer businesses, and any required changes to our business operations resulting from these developments, could result in significant loss of revenue, require remuneration to our customers, trigger fines or penalties, limit the products or services we offer, require us to increase our prices and, therefore, reduce demand for our products, impose additional compliance costs on us, increase the cost of collection, cause harm to our reputation, or otherwise adversely affect our consumer businesses.
In addition, we are allowed to conduct certain activities that are financial in nature by virtue of Huntington’s status as an FHC, as discussed in more detail in Item 1. Regulatory Matters. If Huntington or the Bank cease to meet the requirements necessary for Huntington to continue to qualify as an FHC, the Federal Reserve may impose upon us corrective capital and managerial requirements, and may place limitations on our ability to conduct all of the business activities that we conduct as an FHC. If the failure to meet these standards persists, we could be required to divest our Bank, or cease all activities other than those activities that may be conducted by a BHC but not an FHC.
Reputation Risk:
Damage to our reputation could significantly harm our business, including our competitive position and business prospects.
Our ability to attract and retain customers, clients, investors, and employees is affected by our reputation. Significant harm to our reputation can arise from various sources, including officer, director, or employee misconduct, actual or perceived unethical behavior, conflicts of interest, security breaches, litigation or regulatory outcomes, compensation practices, failing to deliver minimum or required standards of service and quality, failing to address customer and agency complaints, compliance failures, unauthorized release of personal, proprietary or confidential information due to cyber-attacks or otherwise, perception of our environmental, social, and governance practices and disclosures, and the activities of our clients, customers, and counterparties, including vendors. Actions by the financial service industry generally or by institutions or individuals in the industry can adversely affect our reputation indirectly by association. In addition, adverse publicity or negative information posted on social media, whether or not factually correct, may affect our business prospects. All of these could adversely affect our growth, results of operation, and financial condition.
Item 1B: Unresolved Staff Comments
None.
40 Huntington Bancshares Incorporated
Item 2: Properties
Our headquarters, as well as the Bank’s, is located in the Huntington Center, a thirty-seven story office building located in Columbus, Ohio. Of the building’s total office space available, we lease approximately 22%. The lease term expires in 2030, with six five-year renewal options for up to 30 years but with no purchase option. The Bank has an indirect minority equity interest of 18% in the building. Our commercial headquarters is located in the Detroit Tower, a twenty story office building, located in Detroit, Michigan. We lease the entirety of the building’s total office space available. The lease term expires in 2044, with four seven-year renewal options for up to 28 years with no purchase option. The Bank has no ownership interest in the building.
We own or lease numerous other premises for use in conducting business activities, including operations centers, offices, and branches and other facilities. We consider the facilities owned or occupied under lease by our subsidiaries to be adequate for the purposes of our business operations. Additional information regarding our properties is set forth in Note 9 - “Premises and Equipment” and Note 10 - “Operating Leases” of the Notes to Consolidated Financial Statements and is incorporated into this item by reference.
Item 3: Legal Proceedings
Information required by this item is set forth in Note 22 - “Commitments and Contingent Liabilities” of the Notes to Consolidated Financial Statements under the caption “Litigation and Regulatory Matters” and is incorporated into this Item by reference.
Item 4: Mine Safety Disclosures
Not applicable.
2022 Form 10-K 41
PART II
Item 5: Market for Registrant’s Common Equity, Related Shareholder Matters and Issuer Purchases of Equity Securities
The common stock of Huntington Bancshares Incorporated is traded on the Nasdaq Global Stock Market under the symbol “HBAN.” As of January 31, 2023, we had 30,985 shareholders of record.
Information regarding restrictions on dividends, as required by this Item, is set forth in Item 1: “Business - Regulatory Matters” and in Note 23 - “Other Regulatory Matters” of the Notes to Consolidated Financial Statements and incorporated into this Item by reference.
The following graph shows the changes, over the five-year period, in the value of $100 invested in (i) shares of Huntington’s Common Stock; (ii) the Standard & Poor’s 500 Stock Index (the S&P 500 Index) and (iii) Keefe, Bruyette & Woods Bank Index, for the period December 31, 2017, through December 31, 2022. The KBW Bank Index is a market capitalization-weighted bank stock index published by Keefe, Bruyette & Woods. The index is composed of the largest banking companies and includes all money center banks and regional banks, including Huntington. An investment of $100 on December 31, 2017, and the reinvestment of all dividends, are assumed. The plotted points represent the cumulative total return on the last trading day of the fiscal year indicated.
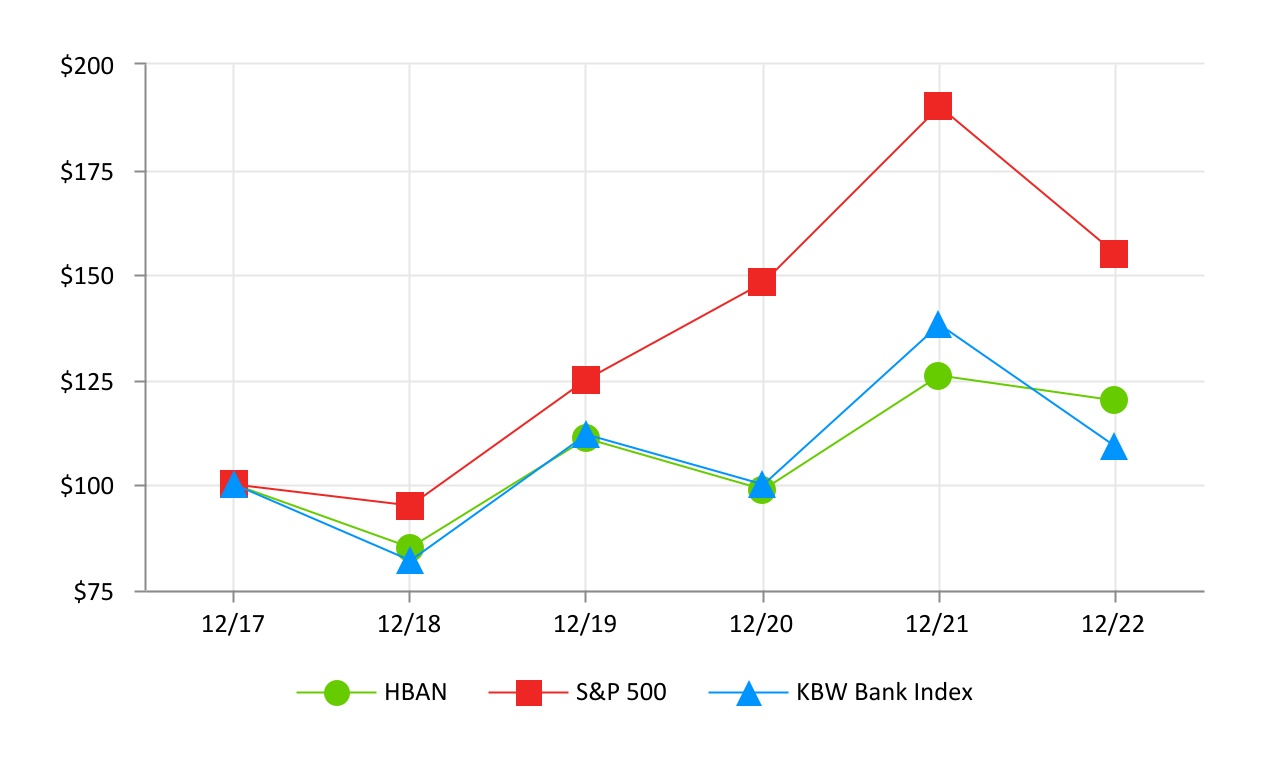
| 2017 | 2018 | 2019 | 2020 | 2021 | 2022 | ||||||||||||||||||||||||||||||
| HBAN | $100 | $85 | $111 | $99 | $126 | $120 | |||||||||||||||||||||||||||||
| S&P 500 | 100 | 95 | 125 | 148 | 190 | 155 | |||||||||||||||||||||||||||||
| KBW Bank Index | 100 | 82 | 112 | 100 | 138 | 109 | |||||||||||||||||||||||||||||
For information regarding securities authorized for issuance under Huntington’s equity compensation plans, see Part III, Item 12.
Item 6:
[Reserved]
42 Huntington Bancshares Incorporated
Item 7: Management’s Discussion and Analysis of Financial Condition and Results of Operations
INTRODUCTION
This MD&A provides information we believe necessary for understanding our financial condition, changes in financial condition, results of operations, and cash flows. The MD&A should be read in conjunction with the Consolidated Financial Statements, Notes to Consolidated Financial Statements, and other information contained in this report. The forward-looking statements in this section and other parts of this report involve assumptions, risks, uncertainties, and other factors, including statements regarding our plans, objectives, goals, strategies, and financial performance. Our actual results could differ materially from the results anticipated in these forward-looking statements as a result of factors set forth under the caption “Forward-Looking Statements” and those set forth in Item 1A.
EXECUTIVE OVERVIEW
Acquisitions
In June 2021, Huntington closed the acquisition of TCF Financial Corporation. Historical periods prior to June 9, 2021 reflect results of legacy Huntington operations. Subsequent to closing, results reflect all post-acquisition activity. For further information, refer to Note 3 “Business Combinations” of the Notes to Consolidated Financial Statements.
In May 2022, Huntington completed the acquisition of Torana, now known as Huntington Choice Pay, a digital
payments business focused on business to consumer payments. This acquisition, along with the formation of our
enterprise-wide payments group, reflects one of our strategic priorities to accelerate our payments capabilities and expand the services provided to our customers.
In June 2022, Huntington completed the acquisition of Capstone Partners, a top tier middle market investment bank and advisory firm. The transaction brings a national scale to serve middle market business owners throughout the corporate lifecycle, building on Huntington’s regional banking foundation. Capstone Partners related revenue, including mergers and acquisitions, capital raising and other advisory-related fees, is recognized within capital markets fees in the Consolidated Statements of Income. For further information, refer to Note 3 “Business Combinations” of the Notes to Consolidated Financial Statements.
2022 Financial Performance Review
In 2022, we reported net income of $2.2 billion, a $943 million, or 73%, increase from the prior year. Earnings per common share on a diluted basis for the year were $1.45, up 61% from the prior year. The current year reported net income was negatively impacted by acquisition-related expenses totaling $95 million, or $76 million after tax ($0.05 per common share), compared to $701 million, or $566 million after tax ($0.44 per common share) in the prior year.
Net interest income for 2022 was $5.3 billion, up $1.2 billion, or 29%, from 2021. FTE net interest income, a non-GAAP financial measure, increased $1.2 billion, or 29%, from 2021. The increase in FTE net interest income reflected the benefit of a $23.3 billion, or 17%, increase in average earning assets in addition to a 30 basis point increase in the FTE NIM to 3.25%. Average earning asset growth included an $18.4 billion, or 19%, increase in average loans and leases and an $8.9 billion, or 27%, increase in average securities. Average balances across earning asset categories reflect organic growth in addition to the late second-quarter 2021 TCF acquisition. The increase in average securities was additionally driven by the redeployment of excess liquidity into securities in the second half of 2021. The NIM expansion was driven by the higher rate environment driving an increase in loan and lease and investment security yields, partially offset by higher cost of funds and the impact of lower accelerated PPP loan fees recognized upon forgiveness payments from the SBA in 2022.
The provision for credit losses increased $264 million to $289 million, primarily due to loan and lease growth and the likelihood of a worsening economic scenario throughout 2022. The reduction in ACL coverage ratios over the course of 2021 reflected more clarity relating to the economic impacts of COVID-19. The ACL was $2.3 billion, or 1.90% of total loans and leases, at December 31, 2022, compared to $2.1 billion, or 1.89% of total loans and leases, at December 31, 2021. The increase in the total ACL was primarily driven by loan and lease growth, but also recognizes the increased near-term recessionary risks at the end of 2022.
2022 Form 10-K 43
Noninterest income was $2.0 billion, up $92 million, or 5%, from the prior year. Noninterest expense was $4.2 billion, down $174 million, or 4%, from the prior year. The changes in noninterest income and noninterest expense were impacted by the full-period impact of the TCF acquisition, completed in June 2021, in addition to the capital markets activity associated with the Capstone Partners acquisition, completed in June 2022. Noninterest expense was additionally impacted by a decrease in acquisition-related expenses of $606 million and the execution of cost reduction initiatives associated with the TCF acquisition.
The tangible common equity to tangible assets ratio was 5.55% at December 31, 2022, down 133 basis points from December 31, 2021, primarily due to a decrease in tangible common equity related to the higher interest rates causing an increase in accumulated other comprehensive loss, partially offset by earnings. CET1 risk-based capital ratio was 9.36%, up from 9.33% at December 31, 2021. The increase in regulatory capital ratios was primarily driven by earnings.
Business Overview
General
Our general business objectives are to:
•Build on our vision to be the country’s leading people-first, digitally powered bank
•Drive sustainable long-term revenue growth and efficiency
•Deliver a Category of One customer experience through our distinguished brand and culture
•Extend our digital leadership with focus on ease of use, access to information, and self-service across products and services
•Leverage expertise and capabilities to acquire and deepen relationships and launching of select partnerships
•Maintain positive operating leverage and execute disciplined capital management
•Stability and resilience through risk management, maintaining an aggregate moderate-to-low, through-the-cycle risk appetite
Economy
Growth in economic activity and demand for goods and services, alongside labor shortages, supply chain complications and geopolitical matters, have contributed to rising inflation. In response, the Federal Reserve has raised interest rates and has been reducing the size of its balance sheet. Furthermore, the Federal Reserve has signaled that it would continue to implement these policy actions in order to bring inflation down. The timing and impact of inflation and rising interest rates on our business and related financial results will depend on future developments, which are highly uncertain and difficult to predict. Our businesses and financial results may be impacted by a variety of other factors as well, such as an economic slowdown or recession. Our baseline economic forecast assumes a mild recession in 2023 with modest GDP growth for the full year. We expect the economy to exit the year on the path toward recovery with inflation gradually subsiding.
We delivered positive results in 2022, driven by broad-based loan and lease growth, growth in our deposit base, higher revenue, and disciplined expense management which were marked by the execution of strategic initiatives and acquisition synergies to further expand our capabilities. The addition of Capstone Partners has expanded the expertise we bring to customers, is benefiting our continued efforts to deepen relationships with commercial customers, and is increasing our fee income opportunities. Credit continues to perform well in keeping with our aggregate moderate-to-low, through the-cycle risk appetite. With our disciplined and proactive approach, we believe Huntington is well positioned to manage through the uncertain economic outlook on the horizon. We remain focused on delivering profitable growth and driving value for our shareholders.
Legislative and Regulatory
A comprehensive discussion of legislative and regulatory matters affecting us can be found in Item 1: Business - “Regulatory Matters” section of this Form 10-K.
44 Huntington Bancshares Incorporated
| Table 1 - Selected Year to Date Income Statement Data | |||||||||||||||||||||||||||||||||||||||||
| Year Ended December 31, | |||||||||||||||||||||||||||||||||||||||||
| Change from 2021 | Change from 2020 | ||||||||||||||||||||||||||||||||||||||||
| (amounts in millions, except per share data) | 2022 | Amount | Percent | 2021 | Amount | Percent | 2020 | ||||||||||||||||||||||||||||||||||
| Interest income | $ | 5,969 | $ | 1,778 | 42 | % | $ | 4,191 | $ | 544 | 15 | % | $ | 3,647 | |||||||||||||||||||||||||||
| Interest expense | 696 | 607 | NM | 89 | (334) | (79) | 423 | ||||||||||||||||||||||||||||||||||
| Net interest income | 5,273 | 1,171 | 29 | 4,102 | 878 | 27 | 3,224 | ||||||||||||||||||||||||||||||||||
| Provision for credit losses | 289 | 264 | NM | 25 | (1,023) | (98) | 1,048 | ||||||||||||||||||||||||||||||||||
| Net interest income after provision for credit losses | 4,984 | 907 | 22 | 4,077 | 1,901 | 87 | 2,176 | ||||||||||||||||||||||||||||||||||
| Service charges on deposit accounts | 384 | 12 | 3 | 372 | 71 | 24 | 301 | ||||||||||||||||||||||||||||||||||
| Card and payment processing income | 374 | 40 | 12 | 334 | 86 | 35 | 248 | ||||||||||||||||||||||||||||||||||
| Capital markets fees | 252 | 101 | 67 | 151 | 26 | 21 | 125 | ||||||||||||||||||||||||||||||||||
| Trust and investment management services | 249 | 17 | 7 | 232 | 43 | 23 | 189 | ||||||||||||||||||||||||||||||||||
| Mortgage banking income | 144 | (165) | (53) | 309 | (57) | (16) | 366 | ||||||||||||||||||||||||||||||||||
| Leasing revenue | 126 | 27 | 27 | 99 | 78 | NM | 21 | ||||||||||||||||||||||||||||||||||
| Insurance income | 117 | 12 | 11 | 105 | 8 | 8 | 97 | ||||||||||||||||||||||||||||||||||
| Gain on sale of loans | 57 | 48 | NM | 9 | (33) | (79) | 42 | ||||||||||||||||||||||||||||||||||
| Bank owned life insurance income | 56 | (13) | (19) | 69 | 5 | 8 | 64 | ||||||||||||||||||||||||||||||||||
| Net gains (losses) on sales of securities | — | (9) | NM | 9 | 10 | NM | (1) | ||||||||||||||||||||||||||||||||||
| Other noninterest income | 222 | 22 | 11 | 200 | 61 | 44 | 139 | ||||||||||||||||||||||||||||||||||
| Total noninterest income | 1,981 | 92 | 5 | 1,889 | 298 | 19 | 1,591 | ||||||||||||||||||||||||||||||||||
| Personnel costs | 2,401 | 66 | 3 | 2,335 | 643 | 38 | 1,692 | ||||||||||||||||||||||||||||||||||
| Outside data processing and other services | 610 | (240) | (28) | 850 | 466 | 121 | 384 | ||||||||||||||||||||||||||||||||||
| Equipment | 269 | 21 | 8 | 248 | 68 | 38 | 180 | ||||||||||||||||||||||||||||||||||
| Net occupancy | 246 | (31) | (11) | 277 | 119 | 75 | 158 | ||||||||||||||||||||||||||||||||||
| Marketing | 91 | 2 | 2 | 89 | 51 | 134 | 38 | ||||||||||||||||||||||||||||||||||
| Professional services | 77 | (36) | (32) | 113 | 58 | 105 | 55 | ||||||||||||||||||||||||||||||||||
| Deposit and other insurance expense | 67 | 16 | 31 | 51 | 19 | 59 | 32 | ||||||||||||||||||||||||||||||||||
| Amortization of intangibles | 53 | 5 | 10 | 48 | 7 | 17 | 41 | ||||||||||||||||||||||||||||||||||
| Lease financing equipment depreciation | 45 | 4 | 10 | 41 | 40 | NM | 1 | ||||||||||||||||||||||||||||||||||
| Other noninterest expense | 342 | 19 | 6 | 323 | 109 | 51 | 214 | ||||||||||||||||||||||||||||||||||
| Total noninterest expense | 4,201 | (174) | (4) | 4,375 | 1,580 | 57 | 2,795 | ||||||||||||||||||||||||||||||||||
| Income before income taxes | 2,764 | 1,173 | 74 | 1,591 | 619 | 64 | 972 | ||||||||||||||||||||||||||||||||||
| Provision for income taxes | 515 | 221 | 75 | 294 | 139 | 90 | 155 | ||||||||||||||||||||||||||||||||||
| Income after income taxes | 2,249 | 952 | 73 | 1,297 | 480 | 59 | 817 | ||||||||||||||||||||||||||||||||||
| Income attributable to non-controlling interest | 11 | 9 | NM | 2 | 2 | NM | — | ||||||||||||||||||||||||||||||||||
| Net income attributable to Huntington Bancshares Inc | 2,238 | 943 | 73 | 1,295 | 478 | 59 | 817 | ||||||||||||||||||||||||||||||||||
| Dividends on preferred shares | 113 | (18) | (14) | 131 | 31 | 31 | 100 | ||||||||||||||||||||||||||||||||||
| Impact of preferred stock redemption | — | (11) | NM | 11 | 11 | NM | — | ||||||||||||||||||||||||||||||||||
| Net income applicable to common shares | $ | 2,125 | $ | 972 | 84 | % | $ | 1,153 | $ | 436 | 61 | % | $ | 717 | |||||||||||||||||||||||||||
| Average common shares—basic | 1,441 | 179 | 14 | % | 1,262 | 245 | 24 | % | 1,017 | ||||||||||||||||||||||||||||||||
| Average common shares—diluted | 1,465 | 178 | 14 | 1,287 | 254 | 25 | 1,033 | ||||||||||||||||||||||||||||||||||
| Net income per common share—basic | $ | 1.47 | $ | 0.56 | 62 | % | $ | 0.91 | $ | 0.20 | 28 | % | $ | 0.71 | |||||||||||||||||||||||||||
| Net income per common share—diluted | 1.45 | 0.55 | 61 | 0.90 | 0.21 | 30 | 0.69 | ||||||||||||||||||||||||||||||||||
| Cash dividends declared | 0.62 | 0.015 | 2 | 0.605 | 0.005 | 1 | 0.60 | ||||||||||||||||||||||||||||||||||
| Revenue and Net Interest Income—FTE (Non-GAAP) | |||||||||||||||||||||||||||||||||||||||||
| Net interest income | $ | 5,273 | $ | 1,171 | 29 | % | $ | 4,102 | $ | 878 | 27 | % | $ | 3,224 | |||||||||||||||||||||||||||
FTE adjustment(1)
|
31 | 6 | 24 | 25 | 4 | 19 | 21 | ||||||||||||||||||||||||||||||||||
Net interest income, FTE (non-GAAP)(1) |
5,304 | 1,177 | 29 | 4,127 | 882 | 27 | 3,245 | ||||||||||||||||||||||||||||||||||
| Noninterest income | 1,981 | 92 | 5 | 1,889 | 298 | 19 | 1,591 | ||||||||||||||||||||||||||||||||||
Total revenue, FTE (non-GAAP)(1) |
$ | 7,285 | $ | 1,269 | 21 | % | $ | 6,016 | $ | 1,180 | 24 | % | $ | 4,836 | |||||||||||||||||||||||||||
(1) On an FTE basis assuming a 21% tax rate.
2022 Form 10-K 45
DISCUSSION OF RESULTS OF OPERATIONS
This section provides a review of financial performance on a consolidated basis. Key consolidated balance sheet and income statement trends are discussed. All earnings per share data are reported on a diluted basis. For additional insight on financial performance, please read this section in conjunction with the “Business Segment Discussion.”
For a discussion of our results of operations for 2021 versus 2020, see “Part II, Item 7: Management’s Discussion and Analysis of Financial Condition and Results of Operations” Discussion of Results of Operations included in our 2021 Form 10-K, filed with the SEC on February 18, 2022.
Average Balance Sheet / Net Interest Income
Our primary source of revenue is net interest income, which is the difference between interest income from earning assets (primarily loans, leases, and securities), and interest expense of funding sources (primarily interest-bearing deposits and borrowings). Earning asset balances and related funding sources, as well as changes in the levels of interest rates, impact net interest income. The difference between the average yield on earning assets and the average rate paid for interest-bearing liabilities is the net interest spread. Noninterest-bearing sources of funds, such as demand deposits and shareholders’ equity, also support earning assets. The impact of the noninterest-bearing sources of funds, often referred to as “free” funds, is captured in the net interest margin, which is calculated as net interest income divided by average earning assets. Both the net interest margin and net interest spread are presented on an FTE basis, which means that tax-free interest income has been adjusted to a pretax equivalent income, assuming a 21% tax rate.
The following table shows changes in fully-taxable equivalent interest income, interest expense, and net interest income due to volume and rate variances for major categories of earning assets and interest-bearing liabilities:
| Table 2 - Change in Net Interest Income Due to Changes in Average Volume and Interest Rates (1) | |||||||||||||||||||||||||||||||||||
| 2022 | 2021 | ||||||||||||||||||||||||||||||||||
| (dollar amounts in millions) | Increase (Decrease) From Previous Year Due To |
Increase (Decrease) From Previous Year Due To |
|||||||||||||||||||||||||||||||||
| FTE basis (2) | Volume | Yield/ Rate |
Total | Volume | Yield/ Rate |
Total | |||||||||||||||||||||||||||||
| Loans and leases | $ | 744 | $ | 437 | $ | 1,181 | $ | 659 | $ | (102) | $ | 557 | |||||||||||||||||||||||
| Investment securities | 165 | 367 | 532 | 174 | (195) | (21) | |||||||||||||||||||||||||||||
| Other earning assets | (30) | 101 | 71 | 30 | (18) | 12 | |||||||||||||||||||||||||||||
| Total interest income from earning assets | 879 | 905 | 1,784 | 863 | (315) | 548 | |||||||||||||||||||||||||||||
| Deposits | 11 | 307 | 318 | 46 | (199) | (153) | |||||||||||||||||||||||||||||
| Short-term borrowings | 30 | 15 | 45 | (6) | (6) | (12) | |||||||||||||||||||||||||||||
| Long-term debt | 8 | 236 | 244 | (38) | (131) | (169) | |||||||||||||||||||||||||||||
| Total interest expense of interest-bearing liabilities | 49 | 558 | 607 | 2 | (336) | (334) | |||||||||||||||||||||||||||||
| Net interest income | $ | 830 | $ | 347 | $ | 1,177 | $ | 861 | $ | 21 | $ | 882 | |||||||||||||||||||||||
(1)The change in interest income or expense due to both rate and volume has been allocated between the factors in proportion to the relationship of the absolute dollar amounts of the change in each.
(2)Calculated assuming a 21% tax rate.
46 Huntington Bancshares Incorporated
| Table 3 - Consolidated Average Balance Sheet and Net Interest Margin Analysis | |||||||||||||||||||||||||||||||||||||||||||||||
| Year ended | |||||||||||||||||||||||||||||||||||||||||||||||
| 2022 | 2021 | Change from 2021 |
|||||||||||||||||||||||||||||||||||||||||||||
| Average | Interest | Yield/ | Average | Interest | Yield/ | Average Balances | |||||||||||||||||||||||||||||||||||||||||
| (dollar amounts in millions) | Balances | Income (FTE) (1) | Rate (2) | Balances | Income (FTE) (1) | Rate (2) | Amount | Percent | |||||||||||||||||||||||||||||||||||||||
| Assets: | |||||||||||||||||||||||||||||||||||||||||||||||
| Interest-bearing deposits at Federal Reserve Bank | $ | 4,626 | $ | 75 | 1.63 | % | $ | 8,129 | $ | 11 | 0.14 | % | $ | (3,503) | (43) | % | |||||||||||||||||||||||||||||||
| Interest-bearing deposits in banks | 226 | 8 | 3.15 | 372 | 1 | 0.04 | (146) | (39) | |||||||||||||||||||||||||||||||||||||||
| Securities: | |||||||||||||||||||||||||||||||||||||||||||||||
| Trading account securities | 32 | 1 | 4.14 | 50 | 1 | 3.32 | (18) | (36) | |||||||||||||||||||||||||||||||||||||||
| Available-for-sale securities: | |||||||||||||||||||||||||||||||||||||||||||||||
| Taxable | 21,994 | 576 | 2.62 | 19,767 | 261 | 1.32 | 2,227 | 11 | |||||||||||||||||||||||||||||||||||||||
| Tax-exempt | 2,842 | 94 | 3.32 | 2,916 | 71 | 2.42 | (74) | (3) | |||||||||||||||||||||||||||||||||||||||
| Total available-for-sale securities | 24,836 | 670 | 2.70 | 22,683 | 332 | 1.46 | 2,153 | 9 | |||||||||||||||||||||||||||||||||||||||
| Held-to-maturity securities—taxable | 16,509 | 351 | 2.13 | 10,000 | 174 | 1.74 | 6,509 | 65 | |||||||||||||||||||||||||||||||||||||||
| Other securities | 845 | 27 | 3.16 | 556 | 10 | 1.75 | 289 | 52 | |||||||||||||||||||||||||||||||||||||||
| Total securities | 42,222 | 1,049 | 2.48 | 33,289 | 517 | 1.55 | 8,933 | 27 | |||||||||||||||||||||||||||||||||||||||
| Loans held for sale | 973 | 41 | 4.24 | 1,398 | 41 | 2.96 | (425) | (30) | |||||||||||||||||||||||||||||||||||||||
| Loans and leases: (3) | |||||||||||||||||||||||||||||||||||||||||||||||
| Commercial: | |||||||||||||||||||||||||||||||||||||||||||||||
| Commercial and industrial | 43,118 | 1,875 | 4.35 | 36,898 | 1,446 | 3.92 | 6,220 | 17 | |||||||||||||||||||||||||||||||||||||||
| Commercial real estate | 15,768 | 683 | 4.33 | 11,412 | 362 | 3.17 | 4,356 | 38 | |||||||||||||||||||||||||||||||||||||||
| Lease financing | 4,974 | 251 | 5.04 | 3,739 | 186 | 4.98 | 1,235 | 33 | |||||||||||||||||||||||||||||||||||||||
| Total commercial | 63,860 | 2,809 | 4.40 | 52,049 | 1,994 | 3.83 | 11,811 | 23 | |||||||||||||||||||||||||||||||||||||||
| Consumer: | |||||||||||||||||||||||||||||||||||||||||||||||
| Residential mortgage | 20,907 | 661 | 3.16 | 15,953 | 479 | 3.00 | 4,954 | 31 | |||||||||||||||||||||||||||||||||||||||
| Automobile | 13,454 | 472 | 3.51 | 13,008 | 471 | 3.62 | 446 | 3 | |||||||||||||||||||||||||||||||||||||||
| Home equity | 10,409 | 532 | 5.11 | 10,018 | 391 | 3.90 | 391 | 4 | |||||||||||||||||||||||||||||||||||||||
| RV and marine | 5,322 | 227 | 4.26 | 4,672 | 199 | 4.27 | 650 | 14 | |||||||||||||||||||||||||||||||||||||||
| Other consumer | 1,314 | 126 | 9.51 | 1,118 | 112 | 10.04 | 196 | 18 | |||||||||||||||||||||||||||||||||||||||
| Total consumer | 51,406 | 2,018 | 3.92 | 44,769 | 1,652 | 3.69 | 6,637 | 15 | |||||||||||||||||||||||||||||||||||||||
| Total loans and leases | 115,266 | 4,827 | 4.19 | 96,818 | 3,646 | 3.77 | 18,448 | 19 | |||||||||||||||||||||||||||||||||||||||
| Total earning assets | 163,313 | 6,000 | 3.67 | 140,006 | 4,216 | 3.01 | 23,307 | 17 | |||||||||||||||||||||||||||||||||||||||
| Cash and due from banks | 1,666 | 1,356 | 310 | 23 | |||||||||||||||||||||||||||||||||||||||||||
| Goodwill and other intangible assets | 5,688 | 4,108 | 1,580 | 38 | |||||||||||||||||||||||||||||||||||||||||||
| All other assets | 10,184 | 8,804 | 1,380 | 16 | |||||||||||||||||||||||||||||||||||||||||||
| Allowance for loan and lease losses | (2,083) | (1,993) | (90) | (5) | |||||||||||||||||||||||||||||||||||||||||||
| Total assets | $ | 178,768 | $ | 152,281 | $ | 26,487 | 17 | % | |||||||||||||||||||||||||||||||||||||||
| Liabilities and Shareholders’ Equity: | |||||||||||||||||||||||||||||||||||||||||||||||
| Interest-bearing deposits: | |||||||||||||||||||||||||||||||||||||||||||||||
| Demand deposits—interest-bearing | $ | 41,779 | $ | 158 | 0.38 | % | $ | 32,708 | $ | 12 | 0.04 | % | $ | 9,071 | 28 | % | |||||||||||||||||||||||||||||||
| Money market deposits | 33,733 | 112 | 0.33 | 30,039 | 21 | 0.07 | 3,694 | 12 | |||||||||||||||||||||||||||||||||||||||
| Savings and other domestic deposits | 21,316 | 5 | 0.02 | 17,357 | 5 | 0.03 | 3,959 | 23 | |||||||||||||||||||||||||||||||||||||||
| Core certificates of deposit (4) | 2,439 | 12 | 0.50 | 2,368 | 1 | 0.03 | 71 | 3 | |||||||||||||||||||||||||||||||||||||||
| Other domestic deposits of $250,000 or more | 233 | 1 | 0.47 | 353 | 1 | 0.21 | (120) | (34) | |||||||||||||||||||||||||||||||||||||||
Negotiable CDs, brokered and other deposits |
3,838 | 75 | 1.96 | 3,525 | 5 | 0.16 | 313 | 9 | |||||||||||||||||||||||||||||||||||||||
| Total interest-bearing deposits | 103,338 | 363 | 0.35 | 86,350 | 45 | 0.05 | 16,988 | 20 | |||||||||||||||||||||||||||||||||||||||
| Short-term borrowings | 2,485 | 46 | 1.86 | 278 | 1 | 0.20 | 2,207 | NM | |||||||||||||||||||||||||||||||||||||||
| Long-term debt (5) | 8,724 | 287 | 3.29 | 7,479 | 43 | 0.57 | 1,245 | 17 | |||||||||||||||||||||||||||||||||||||||
| Total interest-bearing liabilities | 114,547 | 696 | 0.61 | 94,107 | 89 | 0.09 | 20,440 | 22 | |||||||||||||||||||||||||||||||||||||||
| Demand deposits—noninterest-bearing | 41,574 | 37,960 | 3,614 | 10 | |||||||||||||||||||||||||||||||||||||||||||
| All other liabilities | 4,353 | 3,205 | 1,148 | 36 | |||||||||||||||||||||||||||||||||||||||||||
| Total Huntington Bancshares Inc shareholders’ equity | 18,263 | 16,997 | 1,266 | 7 | |||||||||||||||||||||||||||||||||||||||||||
| Non-controlling interest | 31 | 12 | 19 | NM | |||||||||||||||||||||||||||||||||||||||||||
| Total equity | 18,294 | 17,009 | 1,285 | 8 | |||||||||||||||||||||||||||||||||||||||||||
| Total liabilities and shareholders’ equity | $ | 178,768 | $ | 152,281 | $ | 26,487 | 17 | % | |||||||||||||||||||||||||||||||||||||||
| Net interest rate spread | 3.06 | 2.92 | |||||||||||||||||||||||||||||||||||||||||||||
| Impact of noninterest-bearing funds on margin | 0.19 | 0.03 | |||||||||||||||||||||||||||||||||||||||||||||
| Net interest margin/NII | $ | 5,304 | 3.25 | % | $ | 4,127 | 2.95 | % | |||||||||||||||||||||||||||||||||||||||
(1)FTE yields are calculated assuming a 21% tax rate.
(2)Average yield/rates include the impact of applicable derivatives. Loan and lease and deposit average yield/rates also include impact of applicable non-deferrable and amortized fees.
(3)For purposes of this analysis, NALs are reflected in the average balances of loans and leases.
(4)Includes consumer certificates of deposit of $250,000 or more.
(5)Reflects the benefit of $89 million mark-to-market of interest rate caps for 2021. There was no impact for 2022.
2022 Form 10-K 47
| Table 3 - Consolidated Average Balance Sheet and Net Interest Margin Analysis (Continued) | |||||||||||||||||||||||||||||||||||||||||||||||
| Year ended | |||||||||||||||||||||||||||||||||||||||||||||||
| 2021 | 2020 | Change from 2020 |
|||||||||||||||||||||||||||||||||||||||||||||
| Average | Interest | Yield/ | Average | Interest | Yield/ | Average Balances | |||||||||||||||||||||||||||||||||||||||||
| (dollar amounts in millions) | Balances | Income (FTE) (1) | Rate (2) | Balances | Income (FTE) (1) | Rate (2) | Amount | Percent | |||||||||||||||||||||||||||||||||||||||
| Assets: | |||||||||||||||||||||||||||||||||||||||||||||||
| Interest-bearing deposits at Federal Reserve Bank | $ | 8,129 | $ | 11 | 0.14 | % | $ | 3,874 | $ | 6 | 0.15 | % | $ | 4,255 | 110 | % | |||||||||||||||||||||||||||||||
| Interest-bearing deposits in banks | 372 | 1 | 0.04 | 176 | 1 | 0.47 | 196 | 111 | |||||||||||||||||||||||||||||||||||||||
| Securities: | |||||||||||||||||||||||||||||||||||||||||||||||
| Trading account securities | 50 | 1 | 3.32 | 59 | 2 | 3.10 | (9) | (15) | |||||||||||||||||||||||||||||||||||||||
| Available-for-sale securities: | |||||||||||||||||||||||||||||||||||||||||||||||
| Taxable | 19,767 | 261 | 1.32 | 11,392 | 237 | 2.08 | 8,375 | 74 | |||||||||||||||||||||||||||||||||||||||
| Tax-exempt | 2,916 | 71 | 2.42 | 2,735 | 77 | 2.84 | 181 | 7 | |||||||||||||||||||||||||||||||||||||||
| Total available-for-sale securities | 22,683 | 332 | 1.46 | 14,127 | 314 | 2.23 | 8,556 | 61 | |||||||||||||||||||||||||||||||||||||||
| Held-to-maturity securities—taxable | 10,000 | 174 | 1.74 | 9,248 | 216 | 2.33 | 752 | 8 | |||||||||||||||||||||||||||||||||||||||
| Other securities | 556 | 10 | 1.75 | 443 | 6 | 1.41 | 113 | 26 | |||||||||||||||||||||||||||||||||||||||
| Total securities | 33,289 | 517 | 1.55 | 23,877 | 538 | 2.25 | 9,412 | 39 | |||||||||||||||||||||||||||||||||||||||
| Loans held for sale | 1,398 | 41 | 2.96 | 1,121 | 34 | 3.06 | 277 | 25 | |||||||||||||||||||||||||||||||||||||||
| Loans and leases: (3) | |||||||||||||||||||||||||||||||||||||||||||||||
| Commercial: | |||||||||||||||||||||||||||||||||||||||||||||||
| Commercial and industrial | 36,898 | 1,446 | 3.92 | 31,624 | 1,166 | 3.69 | 5,274 | 17 | |||||||||||||||||||||||||||||||||||||||
| Commercial real estate | 11,412 | 362 | 3.17 | 7,054 | 225 | 3.19 | 4,358 | 62 | |||||||||||||||||||||||||||||||||||||||
| Lease financing | 3,739 | 186 | 4.98 | 2,293 | 124 | 5.42 | 1,446 | 63 | |||||||||||||||||||||||||||||||||||||||
| Total commercial | 52,049 | 1,994 | 3.83 | 40,971 | 1,515 | 3.70 | 11,078 | 27 | |||||||||||||||||||||||||||||||||||||||
| Consumer: | |||||||||||||||||||||||||||||||||||||||||||||||
| Residential mortgage | 15,953 | 479 | 3.00 | 11,694 | 406 | 3.47 | 4,259 | 36 | |||||||||||||||||||||||||||||||||||||||
| Automobile | 13,008 | 471 | 3.62 | 12,838 | 504 | 3.93 | 170 | 1 | |||||||||||||||||||||||||||||||||||||||
| Home equity | 10,018 | 391 | 3.90 | 8,930 | 358 | 4.01 | 1,088 | 12 | |||||||||||||||||||||||||||||||||||||||
| RV and marine | 4,672 | 199 | 4.27 | 3,876 | 181 | 4.68 | 796 | 21 | |||||||||||||||||||||||||||||||||||||||
| Other consumer | 1,118 | 112 | 10.04 | 1,086 | 125 | 11.48 | 32 | 3 | |||||||||||||||||||||||||||||||||||||||
| Total consumer | 44,769 | 1,652 | 3.69 | 38,424 | 1,574 | 4.10 | 6,345 | 17 | |||||||||||||||||||||||||||||||||||||||
| Total loans and leases | 96,818 | 3,646 | 3.77 | 79,395 | 3,089 | 3.89 | 17,423 | 22 | |||||||||||||||||||||||||||||||||||||||
| Total earning assets | 140,006 | 4,216 | 3.01 | 108,443 | 3,668 | 3.38 | 31,563 | 29 | |||||||||||||||||||||||||||||||||||||||
| Cash and due from banks | 1,356 | 1,124 | 232 | 21 | |||||||||||||||||||||||||||||||||||||||||||
| Goodwill and other intangible assets | 4,108 | 2,201 | 1,907 | 87 | |||||||||||||||||||||||||||||||||||||||||||
| All other assets | 8,804 | 7,045 | 1,759 | 25 | |||||||||||||||||||||||||||||||||||||||||||
| Allowance for loan and lease losses | (1,993) | (1,581) | (412) | (26) | |||||||||||||||||||||||||||||||||||||||||||
| Total assets | $ | 152,281 | $ | 117,232 | $ | 35,049 | 30 | % | |||||||||||||||||||||||||||||||||||||||
| Liabilities and Shareholders’ Equity: | |||||||||||||||||||||||||||||||||||||||||||||||
| Interest-bearing deposits: | |||||||||||||||||||||||||||||||||||||||||||||||
| Demand deposits—interest-bearing | $ | 32,708 | $ | 12 | 0.04 | % | $ | 23,514 | $ | 32 | 0.14 | % | $ | 9,194 | 39 | % | |||||||||||||||||||||||||||||||
| Money market deposits | 30,039 | 21 | 0.07 | 25,695 | 100 | 0.39 | 4,344 | 17 | |||||||||||||||||||||||||||||||||||||||
| Savings and other domestic deposits | 17,357 | 5 | 0.03 | 10,720 | 10 | 0.09 | 6,637 | 62 | |||||||||||||||||||||||||||||||||||||||
| Core certificates of deposit (4) | 2,368 | 1 | 0.03 | 2,610 | 38 | 1.44 | (242) | (9) | |||||||||||||||||||||||||||||||||||||||
| Other domestic deposits of $250,000 or more | 353 | 1 | 0.21 | 216 | 3 | 1.18 | 137 | 63 | |||||||||||||||||||||||||||||||||||||||
Negotiable CDs, brokered and other deposits |
3,525 | 5 | 0.16 | 3,822 | 15 | 0.38 | (297) | (8) | |||||||||||||||||||||||||||||||||||||||
| Total interest-bearing deposits | 86,350 | 45 | 0.05 | 66,577 | 198 | 0.30 | 19,773 | 30 | |||||||||||||||||||||||||||||||||||||||
| Short-term borrowings | 278 | 1 | 0.20 | 1,147 | 13 | 1.18 | (869) | (76) | |||||||||||||||||||||||||||||||||||||||
| Long-term debt (5) | 7,479 | 43 | 0.57 | 9,496 | 212 | 2.24 | (2,017) | (21) | |||||||||||||||||||||||||||||||||||||||
| Total interest-bearing liabilities | 94,107 | 89 | 0.09 | 77,220 | 423 | 0.55 | 16,887 | 22 | |||||||||||||||||||||||||||||||||||||||
| Demand deposits—noninterest-bearing | 37,960 | 25,336 | 12,624 | 50 | |||||||||||||||||||||||||||||||||||||||||||
| All other liabilities | 3,205 | 2,373 | 832 | 35 | |||||||||||||||||||||||||||||||||||||||||||
| Total Huntington Bancshares Inc shareholders’ equity | 16,997 | 12,303 | 4,694 | 38 | |||||||||||||||||||||||||||||||||||||||||||
| Non-controlling interest | 12 | — | 12 | 100 | |||||||||||||||||||||||||||||||||||||||||||
| Total equity | 17,009 | 12,303 | 4,706 | 38 | |||||||||||||||||||||||||||||||||||||||||||
| Total liabilities and shareholders’ equity | $ | 152,281 | $ | 117,232 | $ | 35,049 | 30 | % | |||||||||||||||||||||||||||||||||||||||
| Net interest rate spread | 2.92 | 2.83 | |||||||||||||||||||||||||||||||||||||||||||||
| Impact of noninterest-bearing funds on margin | 0.03 | 0.16 | |||||||||||||||||||||||||||||||||||||||||||||
| Net interest margin/NII | $ | 4,127 | 2.95 | % | $ | 3,245 | 2.99 | % | |||||||||||||||||||||||||||||||||||||||
(1)FTE yields are calculated assuming a 21% tax rate.
(2)Average yield/rates include the impact of applicable derivatives. Loan and lease and deposit average yield/rates also include impact of applicable non-deferrable and amortized fees.
(3)For purposes of this analysis, NALs are reflected in the average balances of loans and leases.
(4)Includes consumer certificates of deposit of $250,000 or more.
(5)Reflects the benefit of $89 million mark-to-market of interest rate caps for 2021. There was no impact for 2020.
48 Huntington Bancshares Incorporated
Net interest income for 2022 increased $1.2 billion, or 29%, from 2021. FTE net interest income, a non-GAAP financial measure, for 2022 increased $1.2 billion, or 29%, from 2021. The increase in FTE net interest income reflected the benefit of a $23.3 billion, or 17%, increase in average total earning assets in addition to a 30 basis point increase in the FTE NIM to 3.25%. The increase in average total earning assets included a $18.4 billion, or 19%, increase in average loans and leases and a $8.9 billion, or 27%, increase in average total securities. Average balance increases across earning asset categories for 2022 reflect organic growth in addition to the late second-quarter 2021 TCF acquisition. The increase in average securities was additionally driven by the redeployment of excess liquidity into securities in the second half of 2021.
The NIM expansion was driven by the higher rate environment driving an increase in loan and lease and investment security yields, partially offset by higher cost of funds and the impact of lower accelerated PPP loan fees recognized upon forgiveness payments from the SBA in 2022. Net interest income for 2022 included $21 million in accelerated PPP loan fees recognized upon forgiveness payments from the SBA, compared to $126 million in 2021.
Provision for Credit Losses
The provision for credit losses is the expense necessary to maintain the ACL at levels appropriate to absorb our estimate of credit losses expected over the life of the loan and lease portfolio, securities portfolio, and unfunded lending commitments.
The provision for credit losses in 2022 was $289 million, an increase of $264 million from 2021. The increase in provision expense over the prior year was due to a combination of loan and lease growth in 2022 and a reduction in ACL coverage ratios over the course of 2021, as there was more clarity relating to the economic impacts of COVID-19.
The components of the provision for credit losses were as follows:
| Table 4 - Provision for Credit Losses | |||||||||||||||||
| Year Ended December 31, | |||||||||||||||||
| (dollar amounts in millions) | 2022 | 2021 | 2020 | ||||||||||||||
| Provision for loan and lease losses | $ | 212 | $ | (1) | $ | 1,089 | |||||||||||
| Provision for unfunded lending commitments | 73 | 26 | (41) | ||||||||||||||
| Provision for securities | 4 | — | — | ||||||||||||||
| Total provision for credit losses | $ | 289 | $ | 25 | $ | 1,048 | |||||||||||
2022 Form 10-K 49
Noninterest Income
The following table reflects noninterest income for each of the periods presented:
| Table 5 - Noninterest Income | |||||||||||||||||||||||||||||||||||||||||
| Year Ended December 31, | |||||||||||||||||||||||||||||||||||||||||
| (dollar amounts in millions) | Change from 2021 | Change from 2020 | |||||||||||||||||||||||||||||||||||||||
| 2022 | Amount | Percent | 2021 | Amount | Percent | 2020 | |||||||||||||||||||||||||||||||||||
| Service charges on deposit accounts | $ | 384 | $ | 12 | 3 | % | $ | 372 | $ | 71 | 24 | % | $ | 301 | |||||||||||||||||||||||||||
| Card and payment processing income | 374 | 40 | 12 | 334 | 86 | 35 | 248 | ||||||||||||||||||||||||||||||||||
| Capital markets fees | 252 | 101 | 67 | 151 | 26 | 21 | 125 | ||||||||||||||||||||||||||||||||||
| Trust and investment management services | 249 | 17 | 7 | 232 | 43 | 23 | 189 | ||||||||||||||||||||||||||||||||||
| Mortgage banking income | 144 | (165) | (53) | 309 | (57) | (16) | 366 | ||||||||||||||||||||||||||||||||||
| Leasing revenue | 126 | 27 | 27 | 99 | 78 | NM | 21 | ||||||||||||||||||||||||||||||||||
| Insurance income | 117 | 12 | 11 | 105 | 8 | 8 | 97 | ||||||||||||||||||||||||||||||||||
| Gain on sale of loans | 57 | 48 | NM | 9 | (33) | (79) | 42 | ||||||||||||||||||||||||||||||||||
| Bank owned life insurance income | 56 | (13) | (19) | 69 | 5 | 8 | 64 | ||||||||||||||||||||||||||||||||||
| Net gains (losses) on sales of securities | — | (9) | NM | 9 | 10 | NM | (1) | ||||||||||||||||||||||||||||||||||
| Other noninterest income | 222 | 22 | 11 | 200 | 61 | 44 | 139 | ||||||||||||||||||||||||||||||||||
| Total noninterest income | $ | 1,981 | $ | 92 | 5 | % | $ | 1,889 | $ | 298 | 19 | % | $ | 1,591 | |||||||||||||||||||||||||||
Noninterest income was $2.0 billion, up $92 million, or 5%, from the prior year. Capital markets fees increased $101 million, or 67%, primarily reflecting higher advisory fees supported by the impact of Capstone Partners, loan syndication fees, foreign exchange fees, and interest rate derivative fees. Gain on sale of loans increased $48 million, primarily due to sales of SBA loans during the first through third quarters of 2022. Trust and investment management services income increased $17 million, or 7%, primarily reflecting the full-period impact of the TCF acquisition and an increase in sales. Service charges on deposit accounts increased $12 million, or 3%, primarily due to the full-period impact on volume due to TCF customers, partially offset by the impact from Fair Play enhancements implemented in the second half of 2022. Insurance income increased $12 million, or 11%, primarily reflecting an increase in agency commissions. All other increases were largely a result of the full-period impact of the TCF acquisition. Offsetting these increases, mortgage banking income decreased $165 million, or 53%, primarily reflecting lower salable volume and secondary marketing spreads, bank owned life insurance decreased $13 million, or 19%, primarily due to valuation adjustments and lower benefit claims, and net gains on sales of securities decreased $9 million, as the prior year included sales reflecting securities optimization following the acquisition of TCF.
50 Huntington Bancshares Incorporated
| Noninterest Expense | |||||||||||||||||||||||||||||||||||||||||
The following table reflects noninterest expense for each of the periods presented: |
|||||||||||||||||||||||||||||||||||||||||
| Table 6 - Noninterest Expense | |||||||||||||||||||||||||||||||||||||||||
| Year Ended December 31, | |||||||||||||||||||||||||||||||||||||||||
| (dollar amounts in millions) | Change from 2021 | Change from 2020 | |||||||||||||||||||||||||||||||||||||||
| 2022 | Amount | Percent | 2021 | Amount | Percent | 2020 | |||||||||||||||||||||||||||||||||||
| Personnel costs | $ | 2,401 | $ | 66 | 3 | % | $ | 2,335 | $ | 643 | 38 | % | $ | 1,692 | |||||||||||||||||||||||||||
| Outside data processing and other services | 610 | (240) | (28) | 850 | 466 | 121 | 384 | ||||||||||||||||||||||||||||||||||
| Equipment | 269 | 21 | 8 | 248 | 68 | 38 | 180 | ||||||||||||||||||||||||||||||||||
| Net occupancy | 246 | (31) | (11) | 277 | 119 | 75 | 158 | ||||||||||||||||||||||||||||||||||
| Marketing | 91 | 2 | 2 | 89 | 51 | 134 | 38 | ||||||||||||||||||||||||||||||||||
| Professional services | 77 | (36) | (32) | 113 | 58 | 105 | 55 | ||||||||||||||||||||||||||||||||||
| Deposit and other insurance expense | 67 | 16 | 31 | 51 | 19 | 59 | 32 | ||||||||||||||||||||||||||||||||||
| Amortization of intangibles | 53 | 5 | 10 | 48 | 7 | 17 | 41 | ||||||||||||||||||||||||||||||||||
| Lease financing equipment depreciation | 45 | 4 | 10 | 41 | 40 | NM | 1 | ||||||||||||||||||||||||||||||||||
| Other noninterest expense | 342 | 19 | 6 | 323 | 109 | 51 | 214 | ||||||||||||||||||||||||||||||||||
| Total noninterest expense | $ | 4,201 | $ | (174) | (4) | % | $ | 4,375 | $ | 1,580 | 57 | % | $ | 2,795 | |||||||||||||||||||||||||||
| Number of employees (average FTE) | 19,920 | 1,478 | 8 | % | 18,442 | 2,864 | 18 | % | 15,578 | ||||||||||||||||||||||||||||||||
Impacts of acquisition-related expenses:
| Year Ended December 31, | |||||||||||||||||
| (dollar amounts in millions) | 2022 | 2021 | 2020 | ||||||||||||||
| Personnel costs | $ | 8 | $ | 177 | $ | — | |||||||||||
| Outside data processing and other services | 41 | 303 | — | ||||||||||||||
| Equipment | 5 | 16 | — | ||||||||||||||
| Net occupancy | 32 | 82 | — | ||||||||||||||
| Marketing | — | 5 | — | ||||||||||||||
| Professional services | 4 | 57 | — | ||||||||||||||
| Deposit and other insurance expense | 1 | — | — | ||||||||||||||
| Other noninterest expense | 4 | 61 | — | ||||||||||||||
| Total noninterest expense adjustments | $ | 95 | $ | 701 | $ | — | |||||||||||
Noninterest expense was $4.2 billion, a decrease of $174 million, or 4%, from the prior year, primarily reflecting a $606 million decrease in acquisition-related expenses and execution of cost reduction initiatives, partially offset by the full-period impact of the TCF acquisition. Outside data processing and other services decreased $240 million, or 28%, professional services expense decreased $36 million, or 32%, and net occupancy decreased $31 million, or 11%, all primarily reflecting decreases in acquisition-related expenses and execution of cost reduction initiatives, partially offset by the full-period impact of the TCF acquisition. Partially offsetting these decreases, personnel costs increased $66 million, or 3%, primarily due to the impact of the full-period impact of the TCF acquisition, the impact from the addition of Capstone Partners, and other merit increases, partially offset by a decrease in acquisition-related expenses. Equipment expense increased $21 million, or 8%, primarily reflecting timing of technology equipment purchases and amortization and the full-period impact of the TCF acquisition, partially offset by reductions to the post-conversion cost structure. Other noninterest expenses increased $19 million, or 6%, primarily due to Capstone Partners expenses attributable to revenue activity, an increase in travel expenses as travel resumes a more normalized level following the COVID-19 pandemic, and the full-period impact of the TCF acquisition, partially offset by a decrease in acquisition-related expenses. All other increases were primarily a result of the full-period impact of the TCF acquisition, partially offset by cost reduction initiatives.
2022 Form 10-K 51
Provision for Income Taxes
(This section should be read in conjunction with Note 1 - “Significant Accounting Policies” and Note 18 - “Income Taxes” of the Notes to Consolidated Financial Statements.)
The provision for income taxes was $515 million for 2022, compared with $294 million in 2021. The effective tax rates for 2022 and 2021 were 18.6% and 18.5%, respectively. Both years included the benefits from general business credits, capital losses, tax-exempt income, tax-exempt bank owned life insurance income, and investments in qualified affordable housing projects.
The net federal deferred tax asset was $437 million, and the net state deferred tax asset was $97 million at December 31, 2022. As of December 31, 2022 and 2021 there was no valuation allowance on federal deferred taxes. In 2022, a $3 million decrease in the provision for state income taxes, net of federal tax effect, was recorded for the portion of state deferred tax assets that are not more likely than not to be realized, compared to an increase of $7 million, net of federal tax effect, in 2021.
RISK MANAGEMENT AND CAPITAL
Risk Governance
Risk awareness, identification and assessment, reporting, and active management are key elements in overall risk management. Controls include, among other, effective segregation of duties, access management, and authorization and reconciliation procedures, as well as staff education and a disciplined assessment process.
We use a multi-faceted approach to risk governance. It begins with the Board of Directors defining our risk appetite as aggregate moderate-to-low, through-the-cycle. This does not preclude engagement in select higher risk activities. Rather, the definition is intended to represent an aggregate view of where we want our overall risk to be managed.
Three Board committees primarily oversee implementation and monitoring of this desired risk appetite:
•Our Audit Committee oversees the integrity of the consolidated financial statements, including policies, procedures, and practices regarding the preparation of financial statements, the financial reporting process, disclosures, and internal control over financial reporting. The Audit Committee also provides assistance to our Board in overseeing the internal audit division and the independent registered public accounting firm’s qualifications and independence; compliance with our Financial Code of Ethics for the chief executive officer and senior financial officers; and compliance with corporate securities trading policies.
•Our Risk Oversight Committee assists the Board in overseeing management of material risks, the approval and monitoring of our capital position and plan supporting our overall aggregate moderate-to-low, through-the-cycle risk appetite, the risk governance structure, compliance with applicable laws and regulations, and determining adherence to the board’s stated risk appetite. The ROC has oversight responsibility with respect to the full range of inherent risks: credit, market, liquidity, legal, compliance/regulatory, operational, strategic, and reputational. The ROC provides assistance to our Board in overseeing the credit review group. This committee also oversees our capital management and planning process, ensures that the amount and quality of capital are adequate in relation to expected and unexpected risks, and that our capital levels exceed “well-capitalized” requirements.
•Our Technology Committee assists our Board in fulfilling its oversight responsibilities with respect to all technology, cyber security, and third-party risk management strategies and plans. The committee is charged with evaluating Huntington’s capability to properly perform all technology functions necessary for its business plan, including projected growth, technology capacity, planning, operational execution, product development, and management capacity. Our Technology Committee provides oversight of technology investments and plans to drive efficiency as well as to meet defined standards for risk, information security, and redundancy. Our Technology Committee oversees the allocation of technology costs and ensures that they are understood by the Board. Our Technology Committee monitors and evaluates innovation and technology trends that may affect our strategic plans, including monitoring of overall industry trends. The Technology Committee reviews and provides oversight of our continuity and disaster recovery planning and preparedness.
52 Huntington Bancshares Incorporated
Our Audit and Risk Oversight Committees routinely hold executive sessions with our key officers engaged in accounting and risk management. On a periodic basis, the two committees meet in joint session to cover matters relevant to both, such as the construct and appropriateness of the ACL, which is reviewed quarterly. All directors have access to information provided to each committee and all scheduled meetings are open to all directors.
Our Risk Oversight and Technology Committees routinely hold joint sessions to cover matters relevant to both such as cybersecurity and IT risk and control projects and risk assessments.
Further, through our Human Resources and Compensation Committee, our Board seeks to ensure its system of rewards is risk-sensitive and aligns the interests of management, creditors, and shareholders. We utilize a variety of compensation-related tools to induce appropriate behavior, including common stock ownership thresholds for the chief executive officer and certain members of senior management, equity deferrals, recoupment provisions, and the right to terminate compensation plans at any time.
Management has implemented an Enterprise Risk Management and Risk Appetite Framework. Critically important is our self-assessment process, in which each business segment produces an analysis of its risks and the strength of its risk controls. The segment analyses are combined with assessments by our risk management organization of major risk sectors (e.g., credit, market, liquidity, operational, compliance, strategic, and reputation) to produce an overall enterprise risk assessment. Outcomes of the process include a determination of the quality of the overall control process, the direction of risk, and our position compared to the defined risk appetite.
Management also utilizes a wide series of metrics (key risk indicators) to monitor risk positions throughout the Company. In general, a range for each metric is established, which allows the Company, in aggregate, to operate within an aggregate moderate-to-low, through-the-cycle risk appetite. Deviations from the range will indicate if the risk being measured exceeds desired tolerance, which may then necessitate corrective action.
We also have four executive level committees to manage risk: ALCO, Credit Policy and Strategy, Risk Management, and Capital Management. Each committee focuses on specific categories of risk and is supported by a series of subcommittees that are tactical in nature. We believe this structure helps ensure appropriate escalation of issues and overall communication of strategies.
Huntington utilizes three lines of defense with regard to risk management: (1) business segments, (2) corporate risk management, and (3) internal audit and credit review. To induce greater ownership of risk within its business segments, segment risk officers have been embedded in the business to identify and monitor risk, elevate and remediate issues, establish controls, perform self-testing, and oversee the self-assessment process. Corporate Risk Management establishes policies, sets operating limits, reviews new or modified products/processes, ensures consistency and quality assurance within the segments, and produces the enterprise risk assessment. The Chief Risk Officer has significant input into the design and outcome of incentive compensation plans as they apply to risk. Internal audit and credit review provide additional assurance that risk-related functions are operating as intended.
Huntington classifies/aggregates risk into seven risk pillars. Huntington recognizes that risks can be interrelated or embedded within each other, and therefore managing across risk pillars is a key component of the framework. The following defines the Company’s risk pillars:
•Credit risk, which is the risk of loss due to loan and lease customers or other counterparties not being able to meet their financial obligations under agreed upon terms;
•Market risk, which occurs when fluctuations in interest rates impact earnings and capital. Financial impacts are realized through changes in the interest rates of balance sheet assets and liabilities (net interest margin) or directly through valuation changes of capitalized MSR and/or trading assets (noninterest income);
•Liquidity risk, which is the risk to current or anticipated earnings or capital arising from an inability to meet obligations when they come due. Liquidity risk includes the inability to access funding sources or manage fluctuations in funding levels. Liquidity risk also results from the failure to recognize or address changes in market conditions that affect our ability to liquidate assets quickly and with minimal loss in value;
2022 Form 10-K 53
•Operational risk, which is the risk of loss arising from inadequate or failed internal processes or systems, including information security breaches or cyberattacks, human errors or misconduct, or adverse external events. Operational losses result from internal fraud, external fraud, inadequate or inappropriate employment practices and workplace safety, failure to meet professional obligations involving customers, products, and business practices, damage to physical assets, business disruption and systems failures, and failures in execution, delivery, and process management;
•Compliance risk, which exposes us to money penalties, enforcement actions, or other sanctions as a result of non-conformance with laws, rules, and regulations that apply to the financial services industry;
•Strategic risk, which is defined as risk to current or anticipated earnings, capital, or enterprise value arising from adverse business decisions, improper implementation of business decisions or lack of responsiveness to industry / market changes; and
•Reputation risk, which is the risk that negative publicity regarding an institution’s business practices, whether true or not, will cause a decline in the customer base, costly litigation, or revenue reductions.
A comprehensive discussion of risk management and capital matters affecting us can be found in the Risk Factors section included in Item 1A: Risk Factors and the “Regulatory Matters” section of Item 1: Business of this Form 10-K.
Some of the more significant processes used to manage and control credit, market, liquidity, operational, and compliance risks are described in the following sections.
Credit Risk
Credit risk is the risk of financial loss if a counterparty is not able to meet the agreed upon terms of the financial obligation. The majority of our credit risk is associated with lending activities, as the acceptance and management of credit risk is central to profitable lending. We also have credit risk associated with our investment securities portfolios (see Note 4 - "Investment Securities and Other Securities" of the Notes to Consolidated Financial Statements). We engage with other financial counterparties for a variety of purposes including investing, asset and liability management, mortgage banking, and trading activities. A variety of derivative financial instruments, principally interest rate swaps, caps and floors, swaption collars, forward contracts, and forward starting interest rate swaps are used in asset and liability management activities to protect against the risk of adverse price or interest rate movements. We also use derivatives, principally loan sale commitments, in hedging our mortgage loan interest rate lock commitments and mortgage loans held for sale. While there is credit risk associated with derivative activity, we believe this exposure is minimal. (See Note 1 - "Significant Accounting Policies" of the Notes to Consolidated Financial Statements.)
We focus on the early identification, monitoring, and management of all aspects of our credit risk. In addition to the traditional credit risk mitigation strategies of credit policies and processes, market risk management activities, and portfolio diversification, we use quantitative measurement capabilities utilizing external data sources, enhanced modeling technology, and internal stress testing processes. Our ongoing expansion of portfolio management resources is central to our commitment to maintaining an aggregate moderate-to-low, through-the-cycle risk appetite. In our efforts to identify risk mitigation techniques, we have focused on product design features, origination policies, and solutions for delinquent or stressed borrowers.
The maximum level of credit exposure to individual credit borrowers is limited by policy guidelines based on the perceived risk of each borrower or related group of borrowers. Authority to grant commitments sits with the independent credit administration function, with limited exceptions, and is closely monitored and regularly updated. Concentration risk is managed through limits on loan type, industry, and loan quality factors. We focus predominantly on extending credit to consumer and commercial customers with existing or expandable relationships within our primary banking markets, although we will consider lending opportunities outside our primary markets if we believe the associated risks are acceptable and aligned with strategic initiatives. Although we offer a broad set of products, we continue to develop new lending products and opportunities. Each of these new products and opportunities goes through a rigorous development and approval process prior to implementation to ensure our overall objective of maintaining an aggregate moderate-to-low risk portfolio profile.
54 Huntington Bancshares Incorporated
The checks and balances in the credit process and the separation of the credit administration and risk management functions are designed to appropriately assess and sanction the level of credit risk being accepted, facilitate the early recognition of credit problems when they occur, and provide for effective problem asset management and resolution. For example, we do not extend additional credit to delinquent borrowers except in certain circumstances that substantially improve our overall repayment or collateral coverage position.
Loan and Lease Credit Exposure Mix
At December 31, 2022, our loans and leases totaled $119.5 billion, representing a $8.3 billion, or 7%, increase compared to $111.3 billion at December 31, 2021.
Total commercial loans and leases were $67.0 billion at December 31, 2022 and represented 56% of our total loan and lease credit exposure. Our commercial loan portfolio is diversified by product type, customer size, and geography, and is comprised of the following (see Commercial Credit discussion):
C&I – C&I loans are made to commercial customers for use in normal business operations to finance working capital needs, equipment purchases, or other projects. We focus on borrowers doing business within our geographic markets. C&I loans are generally underwritten individually and secured with the assets of the company and/or the personal guarantee of the business owners. The financing of owner-occupied facilities is considered a C&I loan even though there is improved real estate as collateral. This treatment is a result of the credit decision process, which focuses on cash flow from operations of the business to repay the debt. The operation, sale, rental, or refinancing of the real estate is not considered the primary repayment source for these types of loans. As we have expanded our C&I portfolio, we have developed a series of “vertical specialties” to ensure that new products or lending types are embedded within a structured, centralized Commercial Lending area with designated, experienced credit officers. These specialties are comprised of either targeted industries (for example, healthcare, technology & telecom, finance and insurance, etc.) and/or lending disciplines (equipment finance, distribution finance, asset-based lending, etc.), all of which requires a high degree of expertise and oversight to effectively mitigate and monitor risk. As such, we have dedicated colleagues and teams focused on bringing value-added expertise to these specialty customers.
CRE – The CRE portfolio includes both CRE commercial and CRE construction loans. CRE commercial loans are loans to developers and institutional sponsors supporting income-producing or for-sale commercial real estate properties. We mitigate our risk on these loans by requiring collateral values that exceed the loan amount and underwriting the loan with projected cash flow in excess of the debt service requirement. These loans are made to finance properties such as apartment buildings, office and industrial buildings, and retail shopping centers, and are repaid through cash flows related to the operation, sale, or refinance of the property. For loans secured by real estate, appropriate appraisals are obtained at origination and updated on an as needed basis in compliance with regulatory requirements and our credit policies. CRE construction loans are loans to developers, companies, or individuals used for the construction of a commercial or residential property for which repayment will be generated by the sale or permanent financing of the property. Our CRE construction portfolio primarily consists of multi-family, retail, office, and warehouse project types. Generally, these loans are for construction projects that have been pre-sold or pre-leased, or have secured permanent financing, as well as loans to real estate companies with significant equity invested in each project. These loans are managed by a specialized real estate lending group that actively monitors the construction phase and manages the loan disbursements according to the predetermined construction schedule.
Lease Financing – Lease financing products are designed to address the diverse financing needs of small to large companies primarily for the acquisition of equipment. Our lease financing portfolio will utilize a variety of origination partners and third-party sources including equipment manufacturers, dealers, or vendors set up under program structures to generate transactions from a nationwide footprint. High level business lines comprise of industrial finance, specialty finance, healthcare finance, technology finance, and specialized transportation, franchise, & government.
Total consumer loans were $52.5 billion at December 31, 2022 and represented 44% of our total loan and lease credit exposure. The consumer portfolio is comprised primarily of automobile loans, home equity lines-of-credit, residential mortgages, and RV and marine finance (see Consumer Credit discussion).
2022 Form 10-K 55
Residential mortgage – Residential mortgage loans represent loans to consumers for the purchase or refinance of a residence. These loans are generally financed over a 15-year to 30-year term, and in most cases, are extended to borrowers to finance their primary residence. Applications are underwritten centrally using consistent credit policies and processes. All residential mortgage loan decisions utilize a full appraisal for collateral valuation. Huntington has not originated or acquired residential mortgages that allow negative amortization or allow the borrower multiple payment options.
Automobile – Automobile loans are comprised primarily of loans made through automotive dealerships and include exposure in selected states outside of our primary banking markets. The exposure outside of our core footprint states represents 18% of the total exposure, with no individual state representing more than 6%. Applications are underwritten using an automated underwriting system that applies consistent policies and processes across the portfolio.
Home equity – Home equity lending includes both home equity loans and lines-of-credit. This type of lending, which is secured by a first-lien or junior-lien on the borrower’s residence, allows customers to borrow against the equity in their home or refinance existing mortgage debt. Products include closed-end loans which are generally fixed-rate with principal and interest payments, and variable-rate, interest-only lines-of-credit which do not require payment of principal during the 10-year revolving period. The home equity line of credit converts to a 20-year amortizing structure at the end of the revolving period. Applications are underwritten centrally in conjunction with an automated underwriting system. The home equity underwriting criteria is based on minimum credit scores, debt-to-income ratios, and LTV ratios, with current collateral valuations. The underwriting for the floating rate lines of credit also incorporates a stress analysis for rising interest rates.
RV and marine – RV and marine loans are loans provided to consumers for the purpose of financing recreational vehicles and boats. Loans are originated on an indirect basis through a series of dealerships across 35 states. The loans are underwritten centrally using an application and decisioning system similar to automobile loans. The current portfolio includes 26% of the balances within our core footprint states.
Other consumer – Other consumer loans primarily consists of consumer loans not secured by real estate, including credit cards, personal unsecured loans, and overdraft balances. We originate these products within our established set of credit policies and guidelines.
The table below provides the composition of our total loan and lease portfolio:
| Table 7 - Loan and Lease Portfolio Composition | |||||||||||||||||||||||
| At December 31, | |||||||||||||||||||||||
| (dollar amounts in millions) | 2022 | 2021 | |||||||||||||||||||||
| Commercial: | |||||||||||||||||||||||
Commercial and industrial |
$ | 45,127 | 38 | % | $ | 41,688 | 37 | % | |||||||||||||||
Commercial real estate |
16,634 | 14 | 14,961 | 14 | |||||||||||||||||||
| Lease financing | 5,252 | 4 | 5,000 | 4 | |||||||||||||||||||
Total commercial |
67,013 | 56 | 61,649 | 55 | |||||||||||||||||||
| Consumer: | |||||||||||||||||||||||
| Residential mortgage | 22,226 | 19 | 19,256 | 17 | |||||||||||||||||||
Automobile |
13,154 | 11 | 13,434 | 12 | |||||||||||||||||||
Home equity |
10,375 | 9 | 10,550 | 9 | |||||||||||||||||||
RV and marine |
5,376 | 4 | 5,058 | 5 | |||||||||||||||||||
Other consumer |
1,379 | 1 | 1,320 | 2 | |||||||||||||||||||
Total consumer |
52,510 | 44 | 49,618 | 45 | |||||||||||||||||||
Total loans and leases |
$ | 119,523 | 100 | % | $ | 111,267 | 100 | % | |||||||||||||||
56 Huntington Bancshares Incorporated
Our loan and lease portfolio is a managed mix of consumer and commercial credits. We manage the overall credit exposure and portfolio composition via a credit concentration policy. The policy designates specific loan types, collateral types, and loan structures to be formally tracked and assigned maximum exposure limits as a percentage of capital. Commercial lending by NAICS categories, specific limits for CRE project types, loans secured by residential real estate, large dollar exposures, and designated high risk loan categories represent examples of specifically tracked components of our concentration management process. There are no identified concentrations that exceed the assigned exposure limit. Our concentration management policy is approved by the ROC and is used to ensure a high quality, well diversified portfolio that is consistent with our overall objective of maintaining an aggregate moderate-to-low, through-the-cycle risk appetite. Changes to existing concentration limits, incorporating specific information relating to the potential impact on the overall portfolio composition and performance metrics, require the approval of the ROC prior to implementation.
The table below provides our total loan and lease portfolio segregated by industry type. The changes in the industry composition from December 31, 2021 are consistent with the portfolio growth metrics.
| Table 8 - Loan and Lease Portfolio by Industry Type | At December 31, | |||||||||||||||||||||||||
| (dollar amounts in millions) | 2022 | 2021 | ||||||||||||||||||||||||
| Commercial loans and leases: | ||||||||||||||||||||||||||
| Real estate and rental and leasing | $ | 16,310 | 14 | % | $ | 14,287 | 13 | % | ||||||||||||||||||
| Retail trade (1) | 9,894 | 8 | 6,709 | 6 | ||||||||||||||||||||||
| Manufacturing | 7,809 | 7 | 7,401 | 7 | ||||||||||||||||||||||
| Finance and insurance | 5,005 | 4 | 4,595 | 4 | ||||||||||||||||||||||
| Health care and social assistance | 4,293 | 4 | 4,733 | 4 | ||||||||||||||||||||||
| Wholesale Trade | 3,922 | 3 | 4,067 | 4 | ||||||||||||||||||||||
| Accommodation and food services | 3,335 | 3 | 3,778 | 3 | ||||||||||||||||||||||
| Transportation and warehousing | 3,246 | 3 | 3,096 | 3 | ||||||||||||||||||||||
| Other services | 2,097 | 2 | 2,119 | 2 | ||||||||||||||||||||||
| Professional, scientific, and technical services | 1,899 | 2 | 1,975 | 2 | ||||||||||||||||||||||
| Construction | 1,757 | 1 | 1,980 | 2 | ||||||||||||||||||||||
| Arts, entertainment, and recreation | 1,424 | 1 | 1,495 | 1 | ||||||||||||||||||||||
| Admin./Support/Waste Mgmt. and Remediation Services | 1,370 | 1 | 1,285 | 1 | ||||||||||||||||||||||
| Utilities | 1,298 | 1 | 932 | 1 | ||||||||||||||||||||||
| Information | 1,167 | 1 | 870 | 1 | ||||||||||||||||||||||
| Public administration | 667 | 1 | 713 | 1 | ||||||||||||||||||||||
| Educational services | 513 | — | 657 | — | ||||||||||||||||||||||
| Agriculture, forestry, fishing, and hunting | 455 | — | 453 | — | ||||||||||||||||||||||
| Mining, quarrying, and oil and gas extraction | 196 | — | 358 | — | ||||||||||||||||||||||
| Management of companies and enterprises | 127 | — | 130 | — | ||||||||||||||||||||||
| Unclassified/other | 229 | — | 16 | — | ||||||||||||||||||||||
| Total commercial loans and leases by industry category | 67,013 | 56 | % | 61,649 | 55 | % | ||||||||||||||||||||
| Residential mortgage | 22,226 | 19 | 19,256 | 17 | ||||||||||||||||||||||
| Automobile | 13,154 | 11 | 13,434 | 12 | ||||||||||||||||||||||
| Home Equity | 10,375 | 9 | 10,550 | 9 | ||||||||||||||||||||||
| RV and marine | 5,376 | 4 | 5,058 | 5 | ||||||||||||||||||||||
| Other consumer loans | 1,379 | 1 | 1,320 | 2 | ||||||||||||||||||||||
| Total loans and leases | $ | 119,523 | 100 | % | $ | 111,267 | 100 | % | ||||||||||||||||||
(1) Amounts include $2.3 billion and $1.5 billion of auto dealer services loans at December 31, 2022 and December 31, 2021, respectively.
2022 Form 10-K 57
Commercial Credit
The primary factors considered in commercial credit approvals are the financial strength of the borrower, assessment of the borrower’s management capabilities, cash flows from operations, industry sector trends, type and sufficiency of collateral, type of exposure, transaction structure, and the general economic outlook. While these are the primary factors considered, there are a number of other factors that may be considered in the decision process. We require the signature approval of both the appropriate line of business leaders and independent credit executives. The risk rating, credit exposure amount, and complexity of the credit determines the threshold for approval. Credit officers who understand each local region and are experienced in the industries and loan structures of the requested credit exposure are involved in all loan decisions and have the primary credit authority, with the exception of small business loans. For small business loans, we utilize a centralized loan approval process for standard products and structures. In this centralized decision environment, certain individuals who understand each local region may make credit-extension decisions to preserve our commitment to the communities in which we operate. In addition to disciplined and consistent judgmental factors, a sophisticated credit scoring process is used as a primary evaluation tool in the determination of approving a loan.
In commercial lending, on-going credit management is dependent on the type and nature of the loan. We monitor all significant exposures. All commercial credit extensions are assigned internal risk ratings reflecting the borrower’s PD and LGD. This two-dimensional rating methodology provides granularity in the portfolio management process. The PD is rated and applied at the borrower level. The LGD is rated and applied based on the specific type of credit extension and the quality and lien position associated with the underlying collateral. The internal risk ratings are assessed at origination and updated at each periodic monitoring event. There is also extensive macro-portfolio management analysis. We review and adjust our risk-rating criteria based on actual experience, which provides us with the current risk level in the portfolio. A centralized portfolio management function monitors and reports on the performance of the entire commercial portfolio, including small business loans, to provide consistent oversight.
In addition to the initial credit analysis conducted during the approval process, our credit review group performs testing to provide an independent review and assessment of the quality and risk of new loan originations. This group is part of our Risk Management area and conducts portfolio reviews on a risk-based cycle to evaluate individual loans, validate risk ratings, and test the consistency of credit processes.
Our standardized loan grading system considers many components that directly correlate to loan quality and likelihood of repayment, one of which is guarantor support. On an at least annual basis, we consider, among other things, the guarantor’s reputation and creditworthiness, where available, along with various key financial metrics such as liquidity and net worth. Our assessment of the guarantor’s credit strength, or lack thereof, is reflected in our risk ratings for such loans, which is directly tied to, and an integral component of, our ACL methodology. When a loan goes to impaired status, viable guarantor support is considered in the determination of a credit loss.
If our assessment of the guarantor’s credit strength yields an inherent capacity to perform, we will seek repayment from the guarantor as part of the collection process and have done so successfully.
Substantially all loans categorized as Classified (See Note 5 “Loans / Leases” of the Notes to Consolidated Financial Statements) are managed by FRG. FRG is a specialized group of credit professionals that handle the day-to-day management of workouts, commercial recoveries, and problem loan sales. Its responsibilities include developing and implementing action plans, assessing risk ratings, and determining the appropriateness of the allowance, the accrual status, and the ultimate collectability of the Classified loan portfolio.
C&I PORTFOLIO
We manage the risks inherent in the C&I portfolio through origination policies, a defined loan concentration policy with established limits, on-going loan-level and portfolio-level reviews, recourse requirements, and continuous portfolio risk management activities. Our origination policies for the C&I portfolio include loan product-type specific policies such as LTV and debt service coverage ratios, as applicable.
58 Huntington Bancshares Incorporated
The C&I portfolio continues to have solid origination activity while we maintain a focus on high quality originations. We continue to maintain a proactive approach to identifying borrowers that may be facing financial difficulty in order to maximize the potential credit outcomes. Subsequent to the origination of the loan, the credit review group provides an independent review and assessment of the quality of the underwriting and risk of new loan originations.
CRE PORTFOLIO
We manage the risks inherent in this portfolio specific to CRE lending, focusing on the quality of the developer and the specifics associated with each project. Generally, we: (1) limit our loans to 80% of the appraised value of the commercial real estate at origination, (2) require net operating cash flows to be 120% of required interest and principal payments, and (3) if the commercial real estate is non-owner occupied, require that pre-leasing generate break-even interest-only debt service. We actively monitor project-type concentrations and both geographic and project-type performance metrics of all CRE loan types, with a focus on loans identified as higher risk based on the risk rating methodology. Both macro-level and loan-level stress-test scenarios based on existing and forecast market conditions are part of the on-going portfolio management process for the CRE portfolio.
Dedicated real estate professionals originate and manage the portfolio. The portfolio is diversified by project type and loan size, and this diversification represents a significant portion of the credit risk management strategies employed for this portfolio. Subsequent to the origination of the loan, the credit review group provides an independent review and assessment of the quality of the underwriting and risk of new loan originations.
Appraisal values are obtained in conjunction with all originations and renewals, and on an as-needed basis, in compliance with regulatory requirements and to ensure appropriate decisions regarding the on-going management of the portfolio reflect the changing market conditions. Appraisals are obtained from approved vendors and are reviewed by an internal appraisal review group comprised of certified appraisers to ensure the quality of the valuation used in the underwriting process. We continue to perform on-going portfolio level reviews within the CRE portfolio. These reviews generate action plans based on occupancy levels or leasing revenues associated with the projects being reviewed. This highly individualized process requires working closely with all of our borrowers, as well as an in-depth knowledge of CRE project lending and the market environment.
LEASE FINANCING
We manage the risks inherent in the Lease Financing portfolio through external consumer and business credit scoring solutions, internally developed custom probability of default and loss given default models, continuous portfolio risk management activities, and equipment and customer diversification. Our origination policies are aligned by transaction size with increased use of the personal guarantee of principals and external credit scoring tools for smaller transactions and expanded financial analysis and reporting requirements for larger transactions. Our program focuses on high-quality manufacturer, distributor, vendor, or third party originations sources with in-depth partner diligence. The lease financing group may use manufacturer loss risk share programs that provide additional transaction support, but the origination strategy prioritizes strong customer financial condition.
High level business lines are comprised of Industrial Finance, Specialty Finance, Healthcare Finance, Technology Finance, and Specialized Transportation, Franchise, and Government with multiple segments under each main line. We also have specific equipment types or industries designated as low tolerance with additional front-end guidance and diligence requirements. Subsequent to the origination of the lease, the credit review group provides an independent review and assessment of the quality of the underwriting and risk of new lease originations.
2022 Form 10-K 59
Consumer Credit
Consumer credit approvals are based on, among other factors, the financial strength and payment history of the borrower, type of exposure, and transaction structure. Consumer credit decisions are generally made in a centralized environment utilizing decision models. Importantly, certain individuals who understand each local region have the authority to make credit extension decisions to preserve our focus on the local communities in which we operate. For all classes within the consumer loan portfolio, loans are assigned pool level PD factors based on the FICO range within which the borrower’s credit bureau score falls. The credit bureau score is widely accepted as the standard measure of consumer credit risk used by lenders, regulators, rating agencies, and consumers. The LGD is related to the type of collateral associated with the credit extension, which typically does not change over the course of the loan term. This allows Huntington to maintain a current view of the customer for credit risk management and ACL purposes.
In consumer lending, credit risk is managed from a segment (i.e., loan type, collateral position, geography, etc.) and vintage performance analysis. All portfolio segments are continuously monitored for changes in delinquency trends and other asset quality indicators. We make extensive use of portfolio assessment models to continuously monitor the quality of the portfolio, which may result in changes to future origination strategies. The credit review group conducts ongoing independent credit origination and process reviews to ensure the effectiveness and efficiency of the consumer credit processes.
Collection actions by our customer assistance team are initiated as needed through a centrally managed collection and recovery function. We employ a series of collection methodologies designed to maintain a high level of effectiveness, while maximizing efficiency. In addition to the consumer loan portfolio, the customer assistance team is responsible for collection activity on all sold and securitized consumer loans and leases. Collection practices include a single contact point for the majority of the residential real estate secured portfolios.
RESIDENTIAL REAL ESTATE SECURED PORTFOLIOS
The properties securing our residential mortgage and home equity portfolios are primarily located within our geographic footprint. Huntington continues to support our local markets with consistent underwriting across all residential secured products. The residential secured portfolio originations continue to be of high quality. Our portfolio management strategies associated with our Home Savers group allow us to focus on effectively helping our customers with appropriate solutions for their specific circumstances.
Huntington underwrites all residential mortgage applications centrally, with a focus on higher quality borrowers. We do not originate residential mortgages that allow negative amortization or allow the borrower multiple payment options. Residential mortgages are originated based on a completed full appraisal during the credit underwriting process. We update values in compliance with applicable regulations to facilitate our portfolio management, as well as our workout and loss mitigation functions.
We are subject to repurchase risk associated with residential mortgage loans sold in the secondary market. An appropriate level of reserve for representations and warranties related to residential mortgage loans sold has been established to address this repurchase risk inherent in the portfolio.
AUTOMOBILE PORTFOLIO
Our strategy in the automobile portfolio continues to focus on high quality borrowers as measured by both FICO and internal custom scores, combined with appropriate LTVs, terms, and profitability. Our strategy and operational capabilities allow us to appropriately manage the origination quality across the entire portfolio, including our newer markets. Although increased origination volume and entering new markets can be associated with increased risk levels, we believe our disciplined strategy and operational processes significantly mitigate these risks.
We have continued to consistently execute our value proposition and take advantage of available market opportunities. Importantly, we have maintained our high credit quality standards while expanding the portfolio.
RV AND MARINE PORTFOLIO
Our strategy in the RV and Marine portfolio focuses on high quality borrowers, combined with appropriate LTVs, terms, and profitability. Although entering new markets can be associated with increased risk levels, we believe our disciplined strategy and operational processes significantly mitigate these risks.
60 Huntington Bancshares Incorporated
Credit Quality
(This section should be read in conjunction with Note 5 “Loans / Leases and Note 6 “Allowance for Credit Losses” of the Notes to Consolidated Financial Statements.)
We believe the most meaningful way to assess overall credit quality performance is through an analysis of specific performance ratios. This approach forms the basis of the discussion in the sections immediately following: NPAs, NALs, ACL, and NCOs. In addition, we utilize delinquency rates, risk distribution and migration patterns, product segmentation, and origination trends in the analysis of our credit quality performance.
Credit quality performance in 2022 reflected NCOs of $121 million, or 0.11% of average total loans and leases, a decrease from $215 million or 0.22% in the prior year. The decrease was driven by a $145 million decrease in Commercial NCOs, partially offset by a $51 million increase in Consumer NCOs. NPAs decreased by $156 million, or 21%, to $594 million, primarily driven by decreases in commercial and industrial and lease financing NALs.
NPAs and NALs
NPAs consist of (1) NALs, which represent loans and leases no longer accruing interest, (2) OREO properties, and (3) other NPAs. Any loan or lease in our portfolio may be placed on nonaccrual status prior to the policies described below when collection of principal or interest is in doubt. Also, when a borrower with discharged non-reaffirmed debt in a Chapter 7 bankruptcy is identified and the loan or lease is determined to be collateral dependent, the loan is placed on nonaccrual status.
Commercial loans and leases are placed on nonaccrual status at 90-days past due, or earlier if repayment of principal and interest is in doubt. Of the $398 million of commercial related NALs at December 31, 2022, $270 million, or 68%, represent loans and leases that were less than 30-days past due, demonstrating our continued commitment to proactive credit risk management. With the exception of residential mortgage loans guaranteed by government organizations which continue to accrue interest, first lien loans secured by residential mortgage collateral are placed on nonaccrual status at 150-days past due. Junior-lien home equity loans are placed on nonaccrual status at the earlier of 120-days past due or when the related first-lien loan has been identified as nonaccrual. Automobile, RV and marine, and other consumer loans are generally fully charged-off at 120-days past due, and if not fully charged-off are placed on non-accrual.
When loans and leases are placed on nonaccrual, any accrued interest is reversed against interest income. When, in our judgment, the borrower’s ability to make required interest and principal payments has resumed and collectability is no longer in doubt, the loan or lease could be returned to accrual status.
2022 Form 10-K 61
The following table reflects period-end NALs and NPAs detail:
| Table 9 - Nonaccrual Loans and Leases and Nonperforming Assets | |||||||||||
| At December 31, | |||||||||||
| (dollar amounts in millions) | 2022 | 2021 | |||||||||
| Nonaccrual loans and leases (NALs): | |||||||||||
| Commercial and industrial | $ | 288 | $ | 370 | |||||||
| Commercial real estate | 92 | 104 | |||||||||
| Lease financing | 18 | 48 | |||||||||
| Residential mortgage | 90 | 111 | |||||||||
| Automobile | 4 | 3 | |||||||||
| Home equity | 76 | 79 | |||||||||
| RV and marine | 1 | 1 | |||||||||
| Total nonaccrual loans and leases | 569 | 716 | |||||||||
| Other real estate, net: | |||||||||||
| Residential | 11 | 8 | |||||||||
| Commercial | — | 1 | |||||||||
| Total other real estate, net | 11 | 9 | |||||||||
Other NPAs (1) |
14 | 25 | |||||||||
| Total nonperforming assets | $ | 594 | $ | 750 | |||||||
| Nonaccrual loans and leases as a % of total loans and leases | 0.48 | % | 0.64 | % | |||||||
| NPA ratio (2) | 0.50 | 0.67 | |||||||||
(1)Other nonperforming assets include certain impaired investment securities and/or nonaccrual loans held-for-sale.
(2)Nonperforming assets divided by the sum of loans and leases, other real estate owned, and other NPAs.
ACL
Our ACL is comprised of two different components, both of which in our judgment are appropriate to absorb lifetime expected credit losses in our loan and lease portfolio: the ALLL and the AULC.
We use statistically-based models that employ assumptions about current and future economic conditions throughout the contractual life of the loan. The process of estimating expected credit losses is based on three key parameters: PD, EAD, and LGD. Beyond the reasonable and supportable period (two to three years), the economic variables revert to a historical equilibrium at a pace dependent on the state of the economy reflected within the economic scenario.
Future economic conditions consider multiple macroeconomic scenarios provided to us by an independent third party and are reviewed through the appropriate committee governance channels described below. These macroeconomic scenarios contain certain variables that are influential to our modeling process, the most significant being unemployment rates and GDP. The probability weights assigned to each scenario are generally expected to be consistent from period to period and determined through our ACL process. Any changes in probability weights must be supported by appropriate documentation and approval of senior management. Additionally, we consider whether to adjust the modeled estimates to address possible limitations within the models or factors not captured within the macroeconomic scenarios. Lifetime losses for most of our loans and leases are evaluated collectively based on similar risk characteristics, risk ratings, origination credit bureau scores, delinquency status, and remaining months within loan agreements, among other factors.
The baseline scenario used for the 2022 fourth quarter assumes the weaker pace of job growth in 2023 will cause the unemployment rate to gradually increase to 4.1% by the end of 2023. The overnight federal funds rate is forecasted to continue to increase, hitting a terminal rate of approximately 4.6% in the second quarter of 2023 as the Federal Reserve continues to address the elevated inflation levels. The expectation is that the Federal Reserve would start to cut rates late in 2023 and throughout 2024 although monetary policy remains restrictive until the end of 2025 when the federal funds rate returns to its neutral rate. Inflation is forecast to drop from an average of 8.1% in 2022 to 2.4% in 2024 as a result of Federal Reserve’s actions, a reduction in U.S supply chain stress, below potential GDP growth, declines in global energy prices and moderating nominal wage growth.
62 Huntington Bancshares Incorporated
The table below is intended to show how the forecasted path of unemployment and GDP has changed since the end of 2021:
| Table 10 - Forecasted Key Macroeconomic Variables | ||||||||||||||||||||||||||||||||
| 2021 | 2022 | 2023 | ||||||||||||||||||||||||||||||
| Baseline scenario forecast | Q4 | Q2 | Q4 | Q2 | Q4 | |||||||||||||||||||||||||||
| Unemployment rate (1) | ||||||||||||||||||||||||||||||||
| 4Q 2021 | 4.5% | 3.7% | 3.5% | 3.5% | 3.5% | |||||||||||||||||||||||||||
| 4Q 2022 | N/A | N/A | 3.7 | 3.9 | 4.1 | |||||||||||||||||||||||||||
| Gross Domestic Product (1) | ||||||||||||||||||||||||||||||||
| 4Q 2021 | 6.6% | 3.6% | 2.5% | 2.9% | 2.8% | |||||||||||||||||||||||||||
| 4Q 2022 | N/A | N/A | (0.1) | 0.4 | 2.0 | |||||||||||||||||||||||||||
(1)Values reflect the baseline scenario forecast inputs for each period presented, not updated for subsequent actual amounts.
Management continues to assess the uncertainty in the macroeconomic environment, including geopolitical instability and current inflation levels, considering multiple macroeconomic forecasts that reflected a range of possible outcomes. While we have incorporated estimates of economic uncertainty into our ACL, the ultimate impact of the current inflation levels and attempts to lower inflation through Federal Reserve rate actions will have on the economy remains unknown.
Management develops additional analytics to support adjustments to our modeled results. Our governance committees reviewed model results of each economic scenario for appropriate usage, concluding that the quantitative transactional reserve will continue to utilize scenario weighting. Given the uncertainty associated with key economic scenario assumptions, the December 31, 2022 ACL included a general reserve that consists of various risk profile components, including profiles to capture uncertainty not addressed within the quantitative transaction reserve.
Our ACL methodology committee is responsible for developing the methodology, assumptions and estimates used in the calculation, as well as determining the appropriateness of the ACL. The ALLL represents the estimate of lifetime expected losses in the loan and lease portfolio at the reported date. The loss modeling process uses an EAD concept to calculate total expected losses on both funded balances and unfunded lending commitments, where appropriate. Losses related to the unfunded lending commitments are then recorded as AULC within other liabilities in the Consolidated Balance Sheet. A liability for expected credit losses for off-balance sheet credit exposures is recognized if Huntington has a present contractual obligation to extend the credit and the obligation is not unconditionally cancelable.
The AULC is determined by applying the same quantitative reserve determination process to the unfunded portion of the loan exposures adjusted by an applicable funding expectation. (See Note 1 - "Significant Accounting Policies" of the Notes to Consolidated Financial Statements).
Our ACL evaluation process includes the on-going assessment of credit quality metrics, and a comparison of certain ACL benchmarks to current performance. For further information, including the ALLL and AULC activity by portfolio segment, refer to Note 6 “Allowance for Credit Losses” of the Notes to Consolidated Financial Statements.
2022 Form 10-K 63
The table below reflects the allocation of our ALLL among our various loan and lease categories and the reported ACL:
| Table 11 - Allocation of Allowance for Credit Losses | |||||||||||||||||||||||||||||||||||
| (dollar amounts in millions) | At December 31, | ||||||||||||||||||||||||||||||||||
| 2022 | 2021 | ||||||||||||||||||||||||||||||||||
| Allocation of Allowance | % of Total ALLL | % of Total Loans and Leases (1) | Allocation of Allowance | % of Total ALLL | % of Total Loans and Leases (1) | ||||||||||||||||||||||||||||||
| Commercial | |||||||||||||||||||||||||||||||||||
| Commercial and industrial | $ | 890 | 42 | % | 38 | % | $ | 832 | 41 | % | 37 | % | |||||||||||||||||||||||
| Commercial real estate | 482 | 23 | 14 | 586 | 29 | 14 | |||||||||||||||||||||||||||||
| Lease financing | 52 | 2 | 4 | 44 | 2 | 4 | |||||||||||||||||||||||||||||
| Total commercial | 1,424 | 67 | 56 | 1,462 | 72 | 55 | |||||||||||||||||||||||||||||
| Consumer | |||||||||||||||||||||||||||||||||||
| Residential mortgage | 187 | 8 | 19 | 145 | 8 | 17 | |||||||||||||||||||||||||||||
| Automobile | 141 | 7 | 11 | 108 | 5 | 12 | |||||||||||||||||||||||||||||
| Home equity | 105 | 5 | 9 | 88 | 4 | 9 | |||||||||||||||||||||||||||||
| RV and marine | 143 | 7 | 4 | 105 | 5 | 5 | |||||||||||||||||||||||||||||
| Other consumer | 121 | 6 | 1 | 122 | 6 | 2 | |||||||||||||||||||||||||||||
| Total consumer | 697 | 33 | 44 | 568 | 28 | 45 | |||||||||||||||||||||||||||||
| Total ALLL | 2,121 | 100 | % | 100 | % | 2,030 | 100 | % | 100 | % | |||||||||||||||||||||||||
| AULC | 150 | 77 | |||||||||||||||||||||||||||||||||
| Total ACL | $ | 2,271 | $ | 2,107 | |||||||||||||||||||||||||||||||
| Total ALLL as % of: | |||||||||||||||||||||||||||||||||||
| Total loans and leases | 1.77 | % | 1.82 | % | |||||||||||||||||||||||||||||||
| Nonaccrual loans and leases | 373 | 284 | |||||||||||||||||||||||||||||||||
| NPAs | 357 | 271 | |||||||||||||||||||||||||||||||||
| Total ACL as % of: | |||||||||||||||||||||||||||||||||||
| Total loans and leases | 1.90 | % | 1.89 | % | |||||||||||||||||||||||||||||||
| Nonaccrual loans and leases | 400 | 294 | |||||||||||||||||||||||||||||||||
| NPAs | 382 | 281 | |||||||||||||||||||||||||||||||||
(1)Percentages represent the percentage of each loan and lease category to total loans and leases.
At December 31, 2022, the ACL was $2.3 billion, or 1.90%, of total loans and leases, compared to $2.1 billion, or 1.89%, at December 31, 2021. The increase in the total ACL was primarily driven by loan and lease growth, but also recognizes the increased near-term recessionary risks at the end of 2022.
NCOs
A loan in any portfolio may be charged-off prior to the policies described below if a loss confirming event has occurred. Loss confirming events include, but are not limited to, bankruptcy (unsecured), continued delinquency, foreclosure, or receipt of an asset valuation indicating a collateral deficiency where that asset is the sole source of repayment. Additionally, discharged, collateral dependent non-reaffirmed debt in Chapter 7 bankruptcy filings will result in a charge-off to estimated collateral value, less anticipated selling costs at the time of discharge.
Commercial loans and leases are either charged-off or written down to net realizable value by 90-days past due with the exception of administrative small ticket lease delinquencies. Automobile loans, RV and marine, and other consumer loans are generally fully charged-off at 120-days past due. First-lien and junior-lien home equity loans are charged-off to the estimated fair value of the collateral, less anticipated selling costs, at 150-days past due and 120-days past due, respectively. Residential mortgages are charged-off to the estimated fair value of the collateral, less anticipated selling costs, at 150-days past due. The remaining balance is in delinquent status until a modification can be completed, or the loan goes through the foreclosure process.
64 Huntington Bancshares Incorporated
The following table reflects NCO detail:
| Table 12 - Net Loan and Lease Charge-offs | |||||||||||||||||
| (dollar amounts in millions) | Year Ended December 31, | ||||||||||||||||
| 2022 | 2021 | 2020 | |||||||||||||||
Net charge-offs by loan and lease type: |
|||||||||||||||||
Commercial: |
|||||||||||||||||
Commercial and industrial |
$ | (2) | $ | 99 | $ | 287 | |||||||||||
Commercial real estate |
8 | 17 | 43 | ||||||||||||||
| Lease financing | 9 | 44 | 12 | ||||||||||||||
Total commercial |
15 | 160 | 342 | ||||||||||||||
Consumer: |
|||||||||||||||||
| Residential mortgage | (2) | (1) | 3 | ||||||||||||||
| Automobile | 6 | (6) | 33 | ||||||||||||||
| Home equity | (5) | (5) | 6 | ||||||||||||||
RV and marine |
8 | 5 | 12 | ||||||||||||||
Other consumer |
99 | 62 | 53 | ||||||||||||||
Total consumer |
106 | 55 | 107 | ||||||||||||||
| Total net charge-offs | $ | 121 | $ | 215 | $ | 449 | |||||||||||
Net charge-offs - annualized percentages: |
|||||||||||||||||
Commercial: |
|||||||||||||||||
Commercial and industrial |
— | % | 0.27 | % | 0.91 | % | |||||||||||
Commercial real estate |
0.05 | 0.14 | 0.61 | ||||||||||||||
| Lease financing | 0.18 | 1.18 | 0.54 | ||||||||||||||
Total commercial |
0.03 | 0.31 | 0.84 | ||||||||||||||
Consumer: |
|||||||||||||||||
| Residential mortgage | (0.01) | — | 0.03 | ||||||||||||||
| Automobile | 0.05 | (0.05) | 0.26 | ||||||||||||||
| Home equity | (0.05) | (0.05) | 0.07 | ||||||||||||||
RV and marine |
0.15 | 0.10 | 0.31 | ||||||||||||||
Other consumer |
7.55 | 5.56 | 4.84 | ||||||||||||||
Total consumer |
0.21 | 0.12 | 0.28 | ||||||||||||||
| Net charge-offs as a % of average loans | 0.11 | % | 0.22 | % | 0.57 | % | |||||||||||
NCOs decreased $94 million, or 44%, to $121 million in 2022 compared to 2021. NCOs for the commercial portfolios showed significant improvement, with net charge-offs of 0.03% in 2022 compared to 0.31% in 2021, primarily attributable to a reduction in NCOs in the C&I portfolio. Consumer charge-offs were higher in 2022 compared to 2021, primarily due to an increase in the other consumer portfolio.
Market Risk
Market risk refers to potential losses arising from changes in interest rates, foreign exchange rates, equity prices and commodity prices, including the correlation among these factors and their volatility. When the value of an instrument is tied to such external factors, the holder faces market risk. We are primarily exposed to interest rate risk as a result of offering a wide array of financial products to our customers and secondarily to price risk from trading securities, securities owned by our broker-dealer subsidiaries, foreign exchange positions, equity investments, and investments in securities backed by mortgage loans.
2022 Form 10-K 65
We measure market risk exposure via financial simulation models, which provide management with insights on the potential impact to net interest income and other key metrics as a result of changes in market interest rates. Models are used to simulate cash flows and accrual characteristics of the balance sheet based on assumptions regarding the slope or shape of the yield curve, the direction and volatility of interest rates, and the changing composition and characteristics of the balance sheet resulting from strategic objectives and customer behavior. Assumptions and models provide insight on forecasted balance sheet growth and composition, and the pricing and maturity characteristics of current and future business.
In measuring the financial risks associated with interest rate sensitivity in our balance sheet, we compare a set of alternative interest rate scenarios to the results of a base case scenario derived using market forward rates. The market forward reflects the market consensus regarding the future level and slope of the yield curve across a range of tenor points. The standard set of interest rate scenarios includes two types: “shock” scenarios which are immediate parallel rate shifts, and “ramp” scenarios where the parallel shift is applied gradually over the first 12 months of the forecast on a pro rata basis. In both shock and ramp scenarios with falling rates, we presume that market rates will not go below 0%. The scenarios are inclusive of all executed interest rate risk hedging activities. Forward starting hedges are included to the extent that they have been transacted and that they start within the measurement horizon.
Interest rate risk measurement is calculated and reported to the Board of Directors at least quarterly. A comprehensive discussion of risk management governance can be found in Item 7: Management’s Discussion and Analysis of Financial Condition and Results of Operations and the “Risk Governance” section of this Form 10-K.
We use two approaches to model interest rate risk: Net interest income at risk (NII at risk) and economic value of equity at risk modeling sensitivity analysis (EVE at Risk).
| Table 13 - Net Interest Income at Risk | |||||||||||||||||
| Net Interest Income at Risk (%) | |||||||||||||||||
| Basis point change scenario | -100 | +100 | +200 | ||||||||||||||
| December 31, 2022 | -2.0 | 2.0 | 4.0 | ||||||||||||||
| December 31, 2021 | -4.2 | 4.6 | 8.9 | ||||||||||||||
The NII at Risk results included in the table above reflect the analysis used monthly by management. It models gradual “ramp” -100, +100 and +200 basis point parallel shift scenarios, implied by the forward yield curve over the next twelve months.
The NII at Risk shows that the balance sheet is asset sensitive at both December 31, 2022 and December 31, 2021. The change in sensitivity is primarily driven by changes in forecasted market interest rate expectations, and the mix of the balance sheet.
| Table 14 - Economic Value of Equity at Risk | |||||||||||||||||
| Economic Value of Equity at Risk (%) | |||||||||||||||||
| Basis point change scenario | -100 | +100 | +200 | ||||||||||||||
| December 31, 2022 | 5.9 | -8.0 | -17.3 | ||||||||||||||
| December 31, 2021 | -4.6 | -1.5 | -5.6 | ||||||||||||||
The EVE results included in the table above reflect the analysis used monthly by management. It models immediate -100, +100 and +200 basis point parallel “shock” scenarios.
The change in sensitivity from December 31, 2021 was driven primarily by increases in the yield curve shortening the duration of liabilities, change in deposit mix, and hedging throughout the year.
66 Huntington Bancshares Incorporated
As of December 31, 2022, Huntington had outstanding LIBOR-based instruments that mature after June 30, 2023, including loan and lease exposures totaling approximately $19 billion, notional derivative exposure totaling approximately $37 billion, securities of approximately $1 billion, and long-term debt of $347 million. To address the discontinuance of LIBOR in its current form, we established a LIBOR transition team and project plan under the oversight of the CRO and CFO, providing periodic updates to the ROC. Contract remediation efforts coordinated by the LIBOR transition team are scheduled for completion by June 2023. Source systems have been updated to support alternative reference rates. At this time alternative reference rates are predominantly SOFR based. As such, we have developed a SOFR-enabled interest rate risk monitoring framework and a strategy for managing interest rate risk during the transition from LIBOR to SOFR. We continue to monitor market developments and regulatory updates. For a discussion of the risks associated with the LIBOR transition to alternative reference rates, refer to "Item 1A: Risk Factors.”
Use of Derivatives to Manage Interest Rate Risk
An integral component of our interest rate risk management strategy is the use of derivative instruments to minimize significant fluctuations in earnings caused by changes in market interest rates. Examples of derivative instruments that we may use as part of our interest rate risk management strategy include interest rate swaps, caps and floors, forward contracts, and forward starting interest rate swaps.
Table 15 shows all swap, swaption collar and floor positions that are utilized for purposes of managing our exposures to the variability of interest rates. The interest rates variability may impact either the fair value of the assets and liabilities or impact the cash flows attributable to net interest margin. These positions are used to protect the fair value of asset and liabilities by converting the contractual interest rate on a specified amount of assets and liabilities (i.e., notional amounts) to another interest rate index. The positions are also used to hedge the variability in cash flows attributable to the contractually specified interest rate by converting the variable rate index into a fixed rate. The volume, maturity, and mix of derivative positions change frequently as we adjust our broader interest rate risk management objectives and the balance sheet positions to be hedged. For further information, including the notional amount and fair values of these derivatives, refer to Note 20 “Derivative Financial Instruments” of the Notes to Consolidated Financial Statements.
2022 Form 10-K 67
The following tables present additional information about the interest rate swaps, swaption collars, and floors used in Huntington’s asset and liability management activities.
| Table 15 - Weighted-Average Maturity, Receive Rate and SOFR/LIBOR Reset Rate on Asset Liability Management Instruments | |||||||||||||||||||||||||||||
| At December 31, 2022 | |||||||||||||||||||||||||||||
| Notional Value | Average Maturity (years) | Fair Value |
Weighted-Average Fixed Rate | Weighted-Average Reset Rate | |||||||||||||||||||||||||
| (dollar amounts in millions) | |||||||||||||||||||||||||||||
| Asset conversion swaps | |||||||||||||||||||||||||||||
| Receive Fixed - Pay 1 month LIBOR | $ | 7,875 | 1.41 | $ | (390) | 1.21 | % | 4.20 | % | ||||||||||||||||||||
| Receive Fixed - Pay SOFR | 8,700 | 3.55 | (351) | 2.57 | 3.90 | ||||||||||||||||||||||||
| Pay Fixed - Receive 1 month LIBOR (1) | 8,024 | 3.89 | 834 | 0.93 | 4.37 | ||||||||||||||||||||||||
| Pay Fixed - Receive SOFR | 366 | 7.02 | 49 | 1.46 | 3.82 | ||||||||||||||||||||||||
| Receive Fixed - Pay SOFR - forward starting (2) | 2,950 | 4.91 | (109) | 2.64 | — | ||||||||||||||||||||||||
| Pay Fixed - Receive 1 month LIBOR - forward starting (3) | 91 | 7.31 | 12 | 1.62 | — | ||||||||||||||||||||||||
| Pay Fixed - Receive SOFR - forward starting (1)(4) | 1,926 | 6.17 | 85 | 2.17 | — | ||||||||||||||||||||||||
| Liability conversion swaps | |||||||||||||||||||||||||||||
| Receive Fixed - Pay 1 month LIBOR | 1,430 | 1.85 | (60) | 2.01 | 4.25 | ||||||||||||||||||||||||
| Receive Fixed - Pay SOFR | 6,299 | 4.91 | (201) | 3.16 | 3.36 | ||||||||||||||||||||||||
| Purchased swaption collars | |||||||||||||||||||||||||||||
| Purchased Interest Rate Swaption Collars (5) | 4,800 | 0.27 | (6) | 2.87 / 4.05 | |||||||||||||||||||||||||
| Basis swaps | |||||||||||||||||||||||||||||
| Pay SOFR- Receive Fed Fund (economic hedges) (6) | 174 | 3.58 | $ | — | 4.33 | 4.31 | |||||||||||||||||||||||
| Pay Fed Fund - Receive SOFR (economic hedges) (6) | 1 | 12.81 | — | 4.35 | 4.33 | ||||||||||||||||||||||||
| Total swap portfolio (7) | $ | 42,636 | $ | (137) | |||||||||||||||||||||||||
| At December 31, 2021 | |||||||||||||||||||||||||||||
| Notional Value | Average Maturity (years) | Fair Value |
Weighted-Average Fixed Rate |
Weighted-Average Reset Rate |
|||||||||||||||||||||||||
| (dollar amounts in millions) | |||||||||||||||||||||||||||||
| Asset conversion swaps | |||||||||||||||||||||||||||||
| Receive Fixed - Pay 1 month LIBOR | $ | 10,775 | 1.88 | $ | 58 | 1.38 | % | 0.11 | % | ||||||||||||||||||||
| Pay Fixed - Receive 1 month LIBOR (1) | 1,625 | 8.83 | 34 | 1.08 | 0.10 | ||||||||||||||||||||||||
| Pay Fixed - Receive SOFR | 67 | 7.98 | — | 1.32 | — | ||||||||||||||||||||||||
| Pay Fixed - Receive 1 month LIBOR - forward starting (8) | 6,500 | 3.97 | 78 | 0.90 | — | ||||||||||||||||||||||||
| Pay Fixed - Receive SOFR - forward starting (8) | 36 | 7.32 | — | 1.29 | — | ||||||||||||||||||||||||
| Liability conversion swaps | |||||||||||||||||||||||||||||
| Receive Fixed - Pay 1 month LIBOR | 1,928 | 2.16 | 54 | 2.13 | 0.10 | ||||||||||||||||||||||||
| Basis swaps | |||||||||||||||||||||||||||||
| Pay SOFR- Receive Fed Fund (economic hedges) (6) | 230 | 3.66 | $ | — | 0.08 | 0.06 | |||||||||||||||||||||||
| Pay Fed Fund - Receive SOFR (economic hedges) (6) | 41 | 0.98 | — | 0.05 | 0.08 | ||||||||||||||||||||||||
| Total swap portfolio | $ | 21,202 | $ | 224 | |||||||||||||||||||||||||
| At December 31, 2021 | |||||||||||||||||||||||||||||
| Notional Value | Average Maturity (years) | Fair Value |
Weighted-Average Floor Strike |
Weighted-Average Reset Rate |
|||||||||||||||||||||||||
| (dollar amounts in millions) | |||||||||||||||||||||||||||||
| Interest rate floors | |||||||||||||||||||||||||||||
| Purchased Interest Rate Floors - 1 month LIBOR | $ | 375 | 0.06 | $ | 2 | 1.93 | % | 0.10 | % | ||||||||||||||||||||
| Total floors portfolio | $ | 375 | $ | 2 | |||||||||||||||||||||||||
(1)Amounts include interest rate swaps as fair value hedges of fixed-rate investment securities using the portfolio layer method.
(2)Forward starting swaps effective starting from January 2023 to July 2024.
(3)Forward starting swaps effective starting from January 2023 to February 2023
(4)Forward starting swaps effective starting from January 2023 to October 2027.
(5)The weighted average fixed rates for the swaption collars are the weighted average strike rates for the upper and lower bounds of the collars.
(6)Swaps have variable pay and variable receive resets. Weighted Average Fixed Rate column represents pay rate reset.
(7)LIBOR swap instruments that remain outstanding in July 2023 will transition to a SOFR-based rate.
(8)Forward starting swaps effective starting from January 2022 to February 2023.
68 Huntington Bancshares Incorporated
MSRs
(This section should be read in conjunction with Note 7 - “Mortgage Loan Sales and Servicing Rights” of Notes to Consolidated Financial Statements.)
At December 31, 2022, we had a total of $494 million of capitalized MSRs representing the right to service $32.4 billion in mortgage loans.
MSR fair values are sensitive to movements in interest rates as expected future net servicing income depends on the projected outstanding principal balances of the underlying loans, which can be reduced by prepayments and declines in credit quality. Prepayments usually increase when mortgage interest rates decline and decrease when mortgage interest rates rise. We also employ hedging strategies to reduce the risk of MSR fair value changes or impairment. However, volatile changes in interest rates can diminish the effectiveness of these economic hedges. We report changes in the MSR value net of hedge-related trading activity in the mortgage banking income category of noninterest income.
MSR assets are included in servicing rights and other intangible assets in the Consolidated Financial Statements.
Price Risk
Price risk represents the risk of loss arising from adverse movements in the prices of financial instruments that are carried at fair value and are subject to fair value accounting. We have price risk from trading securities, securities owned by our broker-dealer subsidiaries, foreign exchange positions, derivative instruments, and equity investments. We have established loss limits on the trading portfolio, on the amount of foreign exchange exposure that can be maintained, and on the amount of marketable equity securities that can be held.
Liquidity Risk
Liquidity risk is the possibility of us being unable to meet current and future financial obligations in a timely manner. The goal of liquidity management is to ensure adequate, stable, reliable, and cost-effective sources of funds to satisfy changes in loan and lease demand, unexpected levels of deposit withdrawals, investment opportunities, and other contractual obligations. We consider core earnings, strong capital ratios, and credit quality essential for maintaining high credit ratings, which allows us cost-effective access to market-based liquidity. We mitigate liquidity risk by maintaining liquid assets in the form of cash, deposits at the Federal Reserve Bank, and investment securities. In addition, we maintain a large, stable core deposit base and a diversified base of readily available wholesale funding sources, including advances from the FHLB through pledged borrowing capacity, issuance through dealers in the capital markets, and access to certificates of deposit issued through brokers. The Board of Directors approves the liquidity strategy and furthermore reviews the acceptable level of liquidity risk, policy, and procedures established by senior management. The ALCO is appointed by the ROC to oversee liquidity risk management and the establishment of liquidity risk policies and limits. Liquidity Risk is managed centrally by Corporate Treasury. Our liquidity position is evaluated daily, weekly, and monthly by analyzing the composition of all funding sources, reviewing projected liquidity commitments by future months, and identifying sources and uses of funds. The overall management of our liquidity position is also integrated into consumer and commercial pricing policies to ensure a stable core deposit base. Liquidity risk is reviewed and managed continuously for the Bank and the parent company, as well as its subsidiaries. In addition, liquidity working groups meet regularly to identify and monitor liquidity positions, provide policy guidance, review funding strategies, and oversee the adherence to, and maintenance of, the contingency funding plans.
Our primary source of liquidity is our core deposit base. Core deposits comprised approximately 96% of total deposits at December 31, 2022. We also have available unused wholesale sources of liquidity. Liquidity is further provided by unencumbered, or unpledged, investment securities that totaled $13.1 billion as of December 31, 2022.
2022 Form 10-K 69
The treasury department also maintains a contingency funding plan that provides for liquidity stress testing, which assesses the potential erosion of funds in the event of a systemic financial market crisis or institutional-specific stress scenario. An example of an institution specific event would be a downgrade in our public credit rating by a rating agency due to factors such as deterioration in asset quality, a large charge to earnings, a decline in profitability or other financial measures, or a significant merger or acquisition. Examples of systemic events unrelated to us that could have an effect on our access to liquidity would be terrorism or war, natural disasters, political events, or the default or bankruptcy of a major corporation, mutual fund, or hedge fund. Similarly, market speculation or rumors about us, or the banking industry in general, may adversely affect the cost and availability of normal funding sources. The contingency funding plan outlines the process for addressing a liquidity crisis. The plan provides for an evaluation of funding sources under various market conditions. It also assigns specific roles and responsibilities and communication protocols for effectively managing liquidity through a problem period.
Investment securities portfolio
(This section should be read in conjunction with Note 4 - “Investment Securities and Other Securities” of the Notes to Consolidated Financial Statements.)
Our investment securities portfolio is evaluated under established ALCO objectives. Changing market conditions could affect the profitability of the portfolio, as well as the level of interest rate risk exposure.
The weighted average yield by maturity of the investment securities portfolio is presented on the following table:
| Table 16 - Investment Securities Weighted Average Yield by Maturity | |||||||||||||||||||||||||||||
| At December 31, 2022 | |||||||||||||||||||||||||||||
1 year or less |
After 1 year through 5 years | After 5 years through 10 years | After 10 years | Total | |||||||||||||||||||||||||
| (dollar amounts in millions) | Yield (1) |
Yield (1) | Yield (1) | Yield (1) | Yield (1) | ||||||||||||||||||||||||
| Available-for-sale securities: | |||||||||||||||||||||||||||||
| U.S. Treasury | 4.64 | % | 4.15 | % | — | % | — | % | 4.62 | % | |||||||||||||||||||
| Federal agencies: | |||||||||||||||||||||||||||||
| Residential CMO | — | — | — | 2.69 | 2.69 | ||||||||||||||||||||||||
| Residential MBS | — | — | 1.57 | 2.16 | 2.16 | ||||||||||||||||||||||||
| Commercial MBS | — | — | — | 2.82 | 2.82 | ||||||||||||||||||||||||
| Other agencies | — | 1.81 | 2.59 | 4.93 | 3.51 | ||||||||||||||||||||||||
| Total U.S. Treasury, Federal agency, and other agency securities | 4.64 | 2.01 | 2.41 | 2.34 | 2.35 | ||||||||||||||||||||||||
| Municipal securities | 4.52 | 4.67 | 4.10 | 4.05 | 4.34 | ||||||||||||||||||||||||
| Private-label CMO | — | 0.22 | 2.14 | 2.68 | 2.50 | ||||||||||||||||||||||||
| Asset-backed securities | 5.25 | 1.90 | 1.67 | 2.62 | 3.02 | ||||||||||||||||||||||||
| Corporate debt | 2.77 | 2.02 | 2.20 | — | 2.25 | ||||||||||||||||||||||||
| Other securities/Sovereign debt | 1.64 | 0.80 | — | — | 0.96 | ||||||||||||||||||||||||
| Total available-for-sale securities | 4.64 | % | 3.54 | % | 3.02 | % | 2.40 | % | 2.61 | % | |||||||||||||||||||
| Held-to-maturity securities: | |||||||||||||||||||||||||||||
| Federal agencies: | |||||||||||||||||||||||||||||
| Residential CMO | — | % | — | % | 2.56 | % | 2.44 | % | 2.45 | % | |||||||||||||||||||
| Residential MBS | — | — | — | 2.51 | 2.51 | ||||||||||||||||||||||||
| Commercial MBS | — | — | 2.77 | 2.52 | 2.52 | ||||||||||||||||||||||||
| Other agencies | — | 2.49 | 2.35 | 2.60 | 2.51 | ||||||||||||||||||||||||
| Total Federal agencies and other agencies | — | 2.49 | 2.60 | 2.49 | 2.49 | ||||||||||||||||||||||||
| Municipal securities | — | — | — | 2.63 | 2.63 | ||||||||||||||||||||||||
| Total held-to-maturity securities | — | % | 2.49 | % | 2.60 | % | 2.49 | % | 2.49 | % | |||||||||||||||||||
(1)Weighted average yields were calculated using amortized cost on a fully-taxable equivalent basis, assuming a 21% tax rate where applicable.
70 Huntington Bancshares Incorporated
Bank Liquidity and Sources of Funding
Our primary sources of funding for the Bank are consumer and commercial core deposits. At December 31, 2022, these core deposits funded 78% of total assets (119% of total loans). Other sources of liquidity include non-core deposits, FHLB advances, wholesale debt instruments, and securitizations. Demand deposit overdrafts that have been reclassified as loan balances were $25 million and $29 million at December 31, 2022 and December 31, 2021, respectively.
The following table reflects deposit composition detail:
| Table 17 - Deposit Composition | |||||||||||||||||||||||
| At December 31, | |||||||||||||||||||||||
| (dollar amounts in millions) | 2022 | 2021 | |||||||||||||||||||||
| By Type: | |||||||||||||||||||||||
| Demand deposits—noninterest-bearing | $ | 38,242 | 26 | % | $ | 43,236 | 30 | % | |||||||||||||||
| Demand deposits—interest-bearing | 43,136 | 29 | 39,837 | 28 | |||||||||||||||||||
| Money market deposits | 36,082 | 24 | 32,522 | 23 | |||||||||||||||||||
| Savings and other domestic deposits | 20,357 | 14 | 21,088 | 15 | |||||||||||||||||||
| Core certificates of deposit (1) | 4,324 | 3 | 2,740 | 2 | |||||||||||||||||||
| Total core deposits: | 142,141 | 96 | 139,423 | 98 | |||||||||||||||||||
| Other domestic deposits of $250,000 or more | 220 | — | 359 | — | |||||||||||||||||||
| Negotiable CDs, brokered and other deposits | 5,553 | 4 | 3,481 | 2 | |||||||||||||||||||
| Total deposits | $ | 147,914 | 100 | % | $ | 143,263 | 100 | % | |||||||||||||||
| Total core deposits: | |||||||||||||||||||||||
| Commercial | $ | 64,107 | 45 | % | $ | 61,521 | 44 | % | |||||||||||||||
| Consumer | 78,034 | 55 | 77,902 | 56 | |||||||||||||||||||
| Total core deposits | $ | 142,141 | 100 | % | $ | 139,423 | 100 | % | |||||||||||||||
(1)Includes consumer certificates of deposit of $250,000 or more.
The following table reflects consolidated Huntington Bancshares Incorporated amounts. Uninsured deposits are defined as the portion of deposit accounts in U.S. offices that exceed the FDIC insurance limit or similar state deposit insurance regimes and amounts in any other uninsured investment or deposit accounts that are classified as deposits and not subject to any federal or state deposit insurance regimes.
| Table 18 - Uninsured deposits | |||||||||||||||||||||||||||||
| At December 31, | |||||||||||||||||||||||||||||
| (dollar amounts in millions) | 2022 | 2021 | |||||||||||||||||||||||||||
| Uninsured deposits (1) | $ | 47,283 | $ | 48,869 | |||||||||||||||||||||||||
(1)Uninsured deposits were determined by adjusting the amounts reported in the Bank Call Report by internal deposits to arrive at consolidated Huntington Bancshares Incorporated.
| At December 31, 2022 | |||||||||||||||||||||||||||||
| (dollar amounts in millions) | 3 months or less |
3 months to 6 months |
6 months to 12 months |
12 months or more |
Total | ||||||||||||||||||||||||
| Portion of U.S. time deposits in excess of insurance limit | $ | 107 | $ | 67 | $ | 115 | $ | 173 | $ | 462 | |||||||||||||||||||
To the extent we are unable to obtain sufficient liquidity through core deposits, we may meet our liquidity needs through sources of wholesale funding, asset securitization or sale. Sources of wholesale funding include other domestic deposits of $250,000 or more, negotiable CDs, brokered and other deposits, short-term borrowings, and long-term debt. Our wholesale funding for both the Bank and parent company totaled $17.5 billion at December 31, 2022, compared to $11.3 billion at December 31, 2021. The increase from the prior year-end is primarily due to increases in senior debt, brokered funds, and FHLB borrowings.
The Bank may issue long-term debt pursuant to an authorization from the Bank’s board of directors that allows for the periodic issuance of senior and/or subordinated debt securities with fixed or floating interest rates. The aggregate principal amount of the debt securities available for issuance is capped by the board authorization and is reviewed periodically for adjustment.
2022 Form 10-K 71
The Bank maintains borrowing capacity at the FHLB and the Federal Reserve Bank Discount Window. The Bank does not consider borrowing capacity from the Federal Reserve Bank Discount Window as a primary source of liquidity. Total loans and securities pledged to the Federal Reserve Bank Discount Window and the FHLB were $90.0 billion at December 31, 2022.
At December 31, 2022, we believe the Bank has sufficient liquidity and capital resources to meet its cash flow obligations over the next 12 months and for the foreseeable future.
The following table reflects the composition and maturities of the loan and lease portfolio:
| Table 19 - Maturity Schedule of Loans and leases | |||||||||||||||||||||||||||||
| At December 31, 2022 | |||||||||||||||||||||||||||||
| (dollar amounts in millions) | One Year or Less |
One to Five Years |
Five to Fifteen Years |
After Fifteen Years |
Total | ||||||||||||||||||||||||
| Commercial: | |||||||||||||||||||||||||||||
| Commercial and industrial | $ | 12,443 | $ | 26,186 | $ | 5,789 | $ | 709 | $ | 45,127 | |||||||||||||||||||
| Commercial real estate | 3,251 | 10,433 | 2,898 | 52 | 16,634 | ||||||||||||||||||||||||
| Lease financing | 447 | 3,721 | 832 | 252 | 5,252 | ||||||||||||||||||||||||
| Total commercial | 16,141 | 40,340 | 9,519 | 1,013 | 67,013 | ||||||||||||||||||||||||
| Consumer: | |||||||||||||||||||||||||||||
| Residential mortgage | 11 | 88 | 1,947 | 20,180 | 22,226 | ||||||||||||||||||||||||
| Automobile | 167 | 7,961 | 4,992 | 34 | 13,154 | ||||||||||||||||||||||||
| Home equity | 195 | 361 | 2,229 | 7,590 | 10,375 | ||||||||||||||||||||||||
| RV and marine | 2 | 102 | 2,994 | 2,278 | 5,376 | ||||||||||||||||||||||||
| Other consumer | 350 | 831 | 154 | 44 | 1,379 | ||||||||||||||||||||||||
| Total consumer | 725 | 9,343 | 12,316 | 30,126 | 52,510 | ||||||||||||||||||||||||
| Total loans and leases | $ | 16,866 | $ | 49,683 | $ | 21,835 | $ | 31,139 | $ | 119,523 | |||||||||||||||||||
| Percent of total | 14 | % | 42 | % | 18 | % | 26 | % | 100 | % | |||||||||||||||||||
The following table reflects the loans and leases due after one year:
| Table 20 - Loans and leases due after one year | |||||||||||
| Interest rate | |||||||||||
| (dollar amounts in millions) | Fixed | Floating or Adjustable | |||||||||
| Commercial: | |||||||||||
| Commercial and industrial | $ | 9,781 | $ | 22,903 | |||||||
| Commercial real estate | 1,128 | 12,255 | |||||||||
| Lease financing | 4,579 | 226 | |||||||||
| Total commercial | 15,488 | 35,384 | |||||||||
| Consumer: | |||||||||||
| Residential mortgage | 10,137 | 12,078 | |||||||||
| Automobile | 12,987 | — | |||||||||
| Home equity | 2,562 | 7,618 | |||||||||
| RV and marine finance | 5,374 | — | |||||||||
| Other consumer | 459 | 570 | |||||||||
| Total consumer | 31,519 | 20,266 | |||||||||
| Total loans and leases | $ | 47,007 | $ | 55,650 | |||||||
72 Huntington Bancshares Incorporated
Parent Company Liquidity
The parent company’s funding requirements consist primarily of dividends to shareholders, debt service, income taxes, operating expenses, funding of nonbank subsidiaries, repurchases of our stock, and acquisitions. The parent company obtains funding to meet obligations from dividends and interest received from the Bank, interest and dividends received from direct subsidiaries, net taxes collected from subsidiaries included in the federal consolidated tax return, fees for services provided to subsidiaries, and the issuance of debt securities.
The parent company had $3.5 billion and $2.8 billion, at December 31, 2022 and December 31, 2021, in cash and cash equivalents, respectively.
On January 18, 2023, our Board of Directors declared a quarterly common stock cash dividend of $0.155 per common share. The dividend is payable on April 3, 2023, to shareholders of record on March 20, 2023. Based on the current quarterly dividend of $0.155 per common share, cash demands required for common stock dividends are estimated to be approximately $224 million per quarter. Additionally, on January 18, 2023, our Board of Directors declared a quarterly Series B, Series E, Series F, Series G, and Series H Preferred Stock dividend payable on April 17, 2023 to shareholders of record on April 1, 2023. On December 8, 2022, our Board of Directors declared a quarterly dividend for the Series I Preferred Stock payable on March 1, 2023 to shareholders of record on February 15, 2023. Based on the current quarterly dividends declared, total cash demands required for Series B, Series E, Series F, Series G, Series H and Series I Preferred Stock are expected to be approximately $29 million per quarter.
During 2022, the Bank paid preferred and common dividends to the parent company of $45 million and $1.5 billion, respectively. To meet any additional liquidity needs, the parent company may issue debt or equity securities. To support the parent company’s ability to issue debt or equity securities, we have filed with the SEC an automatic shelf registration statement covering an indeterminate amount or number of securities to be offered or sold from time to time as authorized by the Huntington’s Board of Directors.
At December 31, 2022, we believe the Company has sufficient liquidity and capital resources to meet its cash flow obligations over the next 12 months and for the foreseeable future.
Off-Balance Sheet Arrangements
In the normal course of business, we enter into various off-balance sheet arrangements. These arrangements include commitments to extend credit, interest rate swaps, caps and floors, swaption collars, financial guarantees contained in standby letters-of-credit issued by the Bank, and commitments by the Bank to sell mortgage loans.
COMMITMENTS TO EXTEND CREDIT
Commitments to extend credit generally have fixed expiration dates, are variable-rate, and contain clauses that permit Huntington to terminate or otherwise renegotiate the contracts in the event of a significant deterioration in the customer’s credit quality. These arrangements normally require the payment of a fee by the customer, the pricing of which is based on prevailing market conditions, credit quality, probability of funding, and other relevant factors. Since many of these commitments are expected to expire without being drawn upon, the contract amounts are not necessarily indicative of future cash requirements. The interest rate risk arising from these financial instruments is insignificant as a result of their predominantly short-term, variable-rate nature. See Note 22 - “Commitments and Contingent Liabilities” of the Notes to Consolidated Financial Statements for more information.
STANDBY LETTERS-OF-CREDIT
Standby letters-of-credit are conditional commitments issued to guarantee the performance of a customer to a third-party. These guarantees are primarily issued to support public and private borrowing arrangements, including commercial paper, bond financing, and similar transactions. Most of these arrangements mature within two years and are expected to expire without being drawn upon. Standby letters-of-credit are included in the determination of the amount of risk-based capital that the parent company and the Bank are required to hold. Through our credit process, we monitor the credit risks of outstanding standby letters-of-credit. When it is probable that a standby letter-of-credit will be drawn and not repaid in full, a loss is recognized in the provision for credit losses. See Note 22 - “Commitments and Contingent Liabilities” of the Notes to Consolidated Financial Statements for more information.
2022 Form 10-K 73
COMMITMENTS TO SELL LOANS
Activity related to our mortgage origination activity supports the hedging of the mortgage pricing commitments to customers and the secondary sale to third parties. In addition, we have commitments to sell residential real estate loans. These contracts mature in less than one year. See Note 22 - “Commitments and Contingent Liabilities” of the Notes to Consolidated Financial Statements for more information.
Contractual obligations, including off-balance sheet arrangements are properly considered in our liquidity risk management process. At December 31, 2022, we believe the Company has sufficient liquidity and capital resources to meet its cash flow obligations over the next 12 months and for the foreseeable future.
| Table 21 - Contractual Obligations (1) | |||||||||||||||||||||||||||||
| At December 31, 2022 | |||||||||||||||||||||||||||||
| (dollar amounts in millions) | Less than 1 Year |
1 to 3
Years
|
3 to 5
Years
|
More than
5 Years
|
Total | ||||||||||||||||||||||||
| Deposits without a stated maturity | $ | 142,684 | $ | — | $ | — | $ | — | $ | 142,684 | |||||||||||||||||||
| Certificates of deposit and other time deposits | 2,411 | 2,734 | 85 | — | 5,230 | ||||||||||||||||||||||||
| Short-term borrowings | 2,027 | — | — | — | 2,027 | ||||||||||||||||||||||||
| Long-term debt (2) | 1,035 | 3,733 | 589 | 4,645 | 10,002 | ||||||||||||||||||||||||
| Operating lease obligations | 70 | 125 | 79 | 262 | 536 | ||||||||||||||||||||||||
| Purchase commitments | 164 | 188 | 66 | 70 | 488 | ||||||||||||||||||||||||
(1)Amounts do not include associated interest payments.
(2)Maturities are based upon the par value.
Operational Risk
Operational risk is the risk of loss due to human error, third-party performance failures, inadequate or failed internal systems and controls, including the use of financial or other quantitative methodologies that may not adequately predict future results; violations of, or noncompliance with, laws, rules, regulations, prescribed practices, or ethical standards; and external influences such as market conditions, fraudulent activities, disasters, failed business contingency plans, and security risks. We continuously strive to strengthen our system of internal controls to ensure compliance with significant contracts, agreements, laws, rules, and regulations, and to improve the oversight of our operational risk.
We actively monitor cyberattacks such as attempts related to online deception and loss of sensitive customer data. We evaluate internal systems, processes, and controls to mitigate loss from cyber-attacks and, to date, have not experienced any material losses. Cybersecurity threats have increased, primarily through phishing campaigns. We are actively monitoring our email gateways for malicious phishing email campaigns. We have also increased our cybersecurity and fraud monitoring activities through the implementation of specific monitoring of remote connections by geography and volume of connections to detect anomalous remote logins, since a significant portion of our workforce has the option to work remotely.
Our objective for managing cyber security risk is to avoid or minimize the impacts of external threat events or other efforts to penetrate our systems. We work to achieve this objective by hardening networks and systems against attack, and by diligently managing visibility and monitoring controls within our data and communications environment to recognize events and respond before the attacker has the opportunity to plan and execute on its own goals. To this end we employ a set of defense in-depth strategies, which include efforts to make us less attractive as a target and less vulnerable to threats, while investing in threat analytic capabilities for rapid detection and response. Potential concerns related to cyber security may be escalated to our board-level Technology Committee, as appropriate. As a complement to the overall cyber security risk management, we use a number of internal training methods, both formally through mandatory courses and informally through written communications and other updates. Internal policies and procedures have been implemented to encourage the reporting of potential phishing attacks or other security risks. We also use third-party services to test the effectiveness of our cyber security risk management framework, and any such third parties are required to comply with our policies regarding information security and confidentiality.
74 Huntington Bancshares Incorporated
To govern operational risks, we have an Operational Risk Committee, a Legal, Regulatory, and Compliance Committee, a Funds Movement Committee, and a Third Party Risk Management Committee. The responsibilities of these committees, among other duties, include establishing and maintaining management information systems to monitor material risks and to identify potential concerns, risks, or trends that may have a significant impact and ensuring that recommendations are developed to address the identified issues. In addition, we have a Model Risk Oversight Committee that is responsible for policies and procedures describing how model risk is evaluated and managed and the application of the governance process to implement these practices throughout the enterprise. These committees report any significant findings and remediation recommendations to the Risk Management Committee. Potential concerns may be escalated to our ROC and our Audit Committee, as appropriate. Significant findings or issues are escalated by the Third Party Risk Management Committee to the Technology Committee of the Board, as appropriate.
The goal of this framework is to implement effective operational risk-monitoring; minimize operational, fraud, and legal losses; minimize the impact of inadequately designed models and enhance our overall performance.
Compliance Risk
Financial institutions are subject to many laws, rules, and regulations at both the federal and state levels. These broad-based laws, rules, and regulations include, but are not limited to, expectations relating to anti-money laundering, lending limits, client privacy, fair lending, prohibitions against unfair, deceptive, or abusive acts or practices, protections for military members as they enter active duty, and community reinvestment. The volume and complexity of recent regulatory changes have increased our overall compliance risk. As such, we utilize various resources to help ensure expectations are met, including a team of compliance experts dedicated to ensuring our conformance with all applicable laws, rules, and regulations. Our colleagues receive training for several broad-based laws and regulations including, but not limited to, anti-money laundering and customer privacy. Additionally, colleagues engaged in lending activities receive training for laws and regulations related to flood disaster protection, equal credit opportunity, fair lending, and/or other courses related to the extension of credit. We hold ourselves to a high standard for adherence to compliance management and seek to continuously enhance our performance.
Capital
(This section should be read in conjunction with the “Regulatory Matters” section included in Part I, Item 1: Business and Note 23 - “Other Regulatory Matters” of the Notes to Consolidated Financial Statements.)
Both regulatory capital and shareholders’ equity are managed at the Bank and on a consolidated basis. We have an active program for managing capital and maintain a comprehensive process for assessing the Company’s overall capital adequacy. We believe our current levels of both regulatory capital and shareholders’ equity are adequate.
Regulatory Capital
We are subject to the Basel III capital requirements including the standardized approach for calculating risk-weighted assets in accordance with subpart D of the final capital rule. The following table presents risk-weighted assets and other financial data necessary to calculate certain financial ratios, including CET1, which we use to measure capital adequacy.
2022 Form 10-K 75
| Table 22 - Capital Under Current Regulatory Standards (Basel III) | |||||||||||
| At December 31, | |||||||||||
| (dollar amounts in millions) | 2022 | 2021 | |||||||||
| CET1 risk-based capital ratio: | |||||||||||
| Total shareholders’ equity | $ | 17,731 | $ | 19,297 | |||||||
| Regulatory capital adjustments: | |||||||||||
| CECL transitional amount (1) | 328 | 437 | |||||||||
| Shareholders’ preferred equity and related surplus | (2,177) | (2,177) | |||||||||
| Accumulated other comprehensive loss | 3,098 | 230 | |||||||||
| Goodwill and other intangible assets, net of taxes | (5,663) | (5,484) | |||||||||
| Deferred tax assets that arise from tax loss and credit carryforwards | (27) | (54) | |||||||||
| CET1 capital | 13,290 | 12,249 | |||||||||
| Additional tier 1 capital | |||||||||||
| Shareholders’ preferred equity and related surplus | 2,177 | 2,177 | |||||||||
| Tier 1 capital | 15,467 | 14,426 | |||||||||
| Long-term debt and other tier 2 qualifying instruments | 1,424 | 1,539 | |||||||||
| Qualifying allowance for loan and lease losses | 1,682 | 1,281 | |||||||||
| Tier 2 capital | 3,106 | 2,820 | |||||||||
| Total risk-based capital | $ | 18,573 | $ | 17,246 | |||||||
| RWA | $ | 141,940 | $ | 131,266 | |||||||
| CET1 risk-based capital ratio | 9.36 | % | 9.33 | % | |||||||
| Other regulatory capital data: | |||||||||||
| Tier 1 risk-based capital ratio | 10.90 | 10.99 | |||||||||
| Total risk-based capital ratio | 13.09 | 13.14 | |||||||||
| Tier 1 leverage ratio | 8.60 | 8.56 | |||||||||
(1)Huntington and the Bank elected to temporarily delay certain effects of CECL on regulatory capital until January 1, 2022 pursuant to a rule that allowed BHCs and banks to delay for two years 100% of the day-one impact of adopting CECL and 25% of the cumulative change in the reported allowance for credit losses since adopting CECL. As of December 31, 2022, we have phased in 25% of the cumulative CECL deferral with the remaining impact to be recognized through the first quarter 2025.
| Table 23 - Capital Adequacy—Non-Regulatory (Non-GAAP) | |||||||||||
| (dollar amounts in millions) | At December 31, | ||||||||||
| 2022 | 2021 | ||||||||||
| Consolidated capital calculations: | |||||||||||
| Total shareholders’ equity | $ | 17,731 | $ | 19,297 | |||||||
| Goodwill and other intangible assets | (5,766) | (5,591) | |||||||||
| Deferred tax liability on other intangible assets (1) | 41 | 51 | |||||||||
| Total tangible equity (2) | 12,006 | 13,757 | |||||||||
| Preferred equity | (2,167) | (2,167) | |||||||||
| Total tangible common equity (2) | $ | 9,839 | $ | 11,590 | |||||||
| Total assets | $ | 182,906 | $ | 174,064 | |||||||
| Goodwill and other intangible assets | (5,766) | (5,591) | |||||||||
| Deferred tax liability on other intangible assets (1) | 41 | 51 | |||||||||
| Total tangible assets (2) | $ | 177,181 | $ | 168,524 | |||||||
| Tangible equity / tangible asset ratio (2) | 6.78 | % | 8.16 | % | |||||||
| Tangible common equity / tangible asset ratio (2) | 5.55 | 6.88 | |||||||||
| Tangible common equity / RWA ratio (2) | 6.93 | 8.83 | |||||||||
(1)Deferred tax liability related to other intangible assets is calculated at a 21% tax rate.
(2)Tangible equity, tangible common equity, and tangible assets, as well as ratios utilizing these financial measures are non-GAAP financial measures. See Non-GAAP Financial Measures in the Additional Disclosures section.
76 Huntington Bancshares Incorporated
The following table presents certain regulatory capital data at the consolidated and Bank level:
| Table 24 - Regulatory Capital Data (1) | ||||||||||||||
| Basel III | ||||||||||||||
| (dollar amounts in millions) | At December 31, | |||||||||||||
| 2022 | 2021 | |||||||||||||
| Total risk-weighted assets | Consolidated | $ | 141,940 | $ | 131,266 | |||||||||
| Bank | 141,571 | 130,597 | ||||||||||||
| CET1 risk-based capital | Consolidated | 13,290 | 12,249 | |||||||||||
| Bank | 14,133 | 13,261 | ||||||||||||
| Tier 1 risk-based capital | Consolidated | 15,467 | 14,426 | |||||||||||
| Bank | 15,334 | 14,445 | ||||||||||||
| Tier 2 risk-based capital | Consolidated | 3,106 | 2,821 | |||||||||||
| Bank | 2,313 | 1,982 | ||||||||||||
| Total risk-based capital | Consolidated | 18,573 | 17,246 | |||||||||||
| Bank | 17,647 | 16,427 | ||||||||||||
| CET1 risk-based capital ratio | Consolidated | 9.36 | % | 9.33 | % | |||||||||
| Bank | 9.98 | 10.15 | ||||||||||||
| Tier 1 risk-based capital ratio | Consolidated | 10.90 | 10.99 | |||||||||||
| Bank | 10.83 | 11.06 | ||||||||||||
| Total risk-based capital ratio | Consolidated | 13.09 | 13.14 | |||||||||||
| Bank | 12.47 | 12.58 | ||||||||||||
| Tier 1 leverage ratio | Consolidated | 8.60 | 8.56 | |||||||||||
| Bank | 8.54 | 8.60 | ||||||||||||
(1) Huntington and the Bank elected to temporarily delay certain effects of CECL on regulatory capital until January 1, 2022 pursuant to a rule that allowed BHCs and banks to delay for two years 100% of the day-one impact of adopting CECL and 25% of the cumulative change in the reported allowance for credit losses since adopting CECL. As of December 31, 2022, we have phased in 25% of the cumulative CECL deferral with the remaining impact to be recognized through the first quarter 2025.
At December 31, 2022, we, at both the consolidated and Bank level, maintained Basel III capital ratios in excess of the well-capitalized standards established by the Federal Reserve. The increase in the consolidated CET1 risk-based capital ratio compared to the prior year, was primarily driven by current period earnings, partially offset by dividends and growth in risk-weighted assets.
Shareholders’ Equity
We generate shareholders’ equity primarily through the retention of earnings, net of dividends and share repurchases. Other potential sources of shareholders’ equity include issuances of common and preferred stock. Our objective is to maintain capital at an amount commensurate with our risk appetite and risk tolerance objectives, to meet both regulatory and market expectations, and to provide the flexibility needed for future growth and business opportunities.
Shareholders’ equity totaled $17.7 billion at December 31, 2022, a decrease of $1.6 billion, or 8%, when compared with December 31, 2021. The decrease was primarily driven by the higher rate environment causing an increase in accumulated other comprehensive loss, partially offset by earnings, net of dividends.
Huntington is authorized to make capital distributions that are consistent with the requirements in the Federal Reserve’s capital rule, inclusive of the SCB requirement. On April 5, 2022, Huntington submitted its 2022 Capital Plan to the Federal Reserve for supervisory review. By notice dated August 4, 2022, the Federal Reserve informed Huntington that its final SCB requirement associated with its 2022 Capital Plan is 3.3%, effective for the period of October 1, 2022 through September 20, 2023. As of December 31, 2022, Huntington’s SCB requirement was 3.3%.
2022 Form 10-K 77
Share Repurchases
From time to time the Board of Directors authorizes the Company to repurchase shares of our common stock. Although we announce when our Board authorizes share repurchases, we typically do not give any public notice before we repurchase our shares. Future stock repurchases may be private or open-market repurchases, including block transactions, accelerated or delayed block transactions, forward transactions, and similar transactions. Various factors determine the amount and timing of our share repurchases, including our capital requirements, the number of shares we expect to issue for employee benefit plans and acquisitions, market conditions (including the trading price of our stock), and regulatory and legal considerations.
On January 18, 2023, our Board authorized the repurchase of up to $1.0 billion of common shares within the eight quarter period ending December 31, 2024, subject to the Federal Reserve’s capital regulations. Purchases of common stock under the authorization may include open market purchases, privately negotiated transactions, and accelerated share repurchase programs.
BUSINESS SEGMENT DISCUSSION
Overview
Our business segments are based on our internally-aligned segment leadership structure, which is how we monitor results and assess performance. We have four major business segments: Commercial Banking, Consumer and Business Banking, Vehicle Finance, and Regional Banking and The Huntington Private Client Group (RBHPCG). The Treasury / Other function includes technology and operations, other unallocated assets, liabilities, revenue, and expense.
To align with our strategic priorities, in the second quarter of 2023, we plan to complete an organizational realignment to consolidate three of our current major business segments, consisting of Consumer and Business Banking, Vehicle Finance, and RBHPCG, into one new major business segment called Consumer & Regional Banking. This will result in two major business segments, Consumer & Regional Banking and Commercial Banking.
Business segment results are determined based upon our management practices, which assigns balance sheet and income statement items to each of the business segments. The process is designed around our organizational and management structure and, accordingly, the results derived are not necessarily comparable with similar information published by other financial institutions.
For a discussion of business segment trends for 2021 versus 2020, see “Part II, Item 7: Management’s Discussion and Analysis of Financial Condition and Results of Operations” Business Segment Discussion included in our 2021 Form 10-K, filed with the SEC on February 18, 2022.
Revenue Sharing
Revenue is recorded in the business segment responsible for the related product or service. Fee sharing is recorded to allocate portions of such revenue to other business segments involved in selling to or providing service to customers. Results of operations for the business segments reflect these fee sharing allocations.
Expense Allocation
The management process that develops the business segment reporting utilizes various estimates and allocation methodologies to measure the performance of the business segments. Expenses are allocated to business segments using a two-phase approach. The first phase consists of measuring and assigning unit costs (activity-based costs) to activities related to product origination and servicing. These activity-based costs are then extended, based on volumes, with the resulting amount allocated to business segments that own the related products. The second phase consists of the allocation of overhead costs to all four business segments from Treasury / Other. We utilize a full-allocation methodology, where all Treasury / Other expenses, except reported acquisition-related expenses, if any, and a small amount of other residual unallocated expenses, are allocated to the four business segments.
78 Huntington Bancshares Incorporated
Funds Transfer Pricing (FTP)
We use an active and centralized FTP methodology to attribute appropriate net interest income to the business segments. The intent of the FTP methodology is to transfer interest rate risk from the business segments by providing modeled duration funding of assets and liabilities. The result is to centralize the financial impact, management, and reporting of interest rate risk in the Treasury / Other function where it can be centrally monitored and managed. The Treasury / Other function charges (credits) an internal cost of funds for assets held in (or pays for funding provided by) each business segment. The FTP rate is based on prevailing market interest rates for comparable duration assets (or liabilities).
Net Income (Loss) by Business Segment
Net income (loss) by business segment for the past three years is presented in the following table:
| Table 25 - Net Income by Business Segment | |||||||||||||||||
| Year Ended December 31, | |||||||||||||||||
| (dollar amounts in millions) | 2022 | 2021 | 2020 | ||||||||||||||
| Commercial Banking | $ | 1,143 | $ | 798 | $ | 78 | |||||||||||
| Consumer and Business Banking | 789 | 308 | 270 | ||||||||||||||
| Vehicle Finance | 191 | 319 | 120 | ||||||||||||||
| RBHPCG | 106 | 55 | 85 | ||||||||||||||
| Treasury / Other | 9 | (185) | 264 | ||||||||||||||
| Net income | $ | 2,238 | $ | 1,295 | $ | 817 | |||||||||||
| Commercial Banking | |||||||||||||||||||||||||||||
| Table 26 - Key Performance Indicators for Commercial Banking | |||||||||||||||||||||||||||||
| Year Ended December 31, | Change from 2021 | Year Ended December 31, | |||||||||||||||||||||||||||
| (dollar amounts in millions unless otherwise noted) | 2022 | 2021 | Amount | Percent | 2020 | ||||||||||||||||||||||||
| Net interest income | $ | 1,879 | $ | 1,284 | $ | 595 | 46 | % | $ | 903 | |||||||||||||||||||
| Provision for credit losses | 28 | 4 | 24 | NM | 626 | ||||||||||||||||||||||||
| Noninterest income | 670 | 523 | 147 | 28 | 364 | ||||||||||||||||||||||||
| Noninterest expense | 1,061 | 791 | 270 | 34 | 542 | ||||||||||||||||||||||||
| Provision for income taxes | 307 | 212 | 95 | 45 | 21 | ||||||||||||||||||||||||
| Income attributable to non-controlling interest | 10 | 2 | 8 | NM | — | ||||||||||||||||||||||||
| Net income attributable to Huntington Bancshares Inc | $ | 1,143 | $ | 798 | $ | 345 | 43 | % | $ | 78 | |||||||||||||||||||
| Number of employees (average FTE) | 2,134 | 1,754 | 380 | 22 | % | 1,276 | |||||||||||||||||||||||
| Total average assets | $ | 59,962 | $ | 44,427 | $ | 15,535 | 35 | $ | 35,490 | ||||||||||||||||||||
| Total average loans/leases | 52,275 | 38,092 | 14,183 | 37 | 27,234 | ||||||||||||||||||||||||
| Total average deposits | 35,551 | 29,351 | 6,200 | 21 | 23,321 | ||||||||||||||||||||||||
| Net interest margin | 3.42 | % | 3.15 | % | 0.27 | % | 9 | 3.04 | % | ||||||||||||||||||||
| NCOs | $ | 2 | $ | 119 | $ | (117) | (98) | $ | 302 | ||||||||||||||||||||
| NCOs as a % of average loans and leases | — | % | 0.31 | % | (0.31) | % | NM | 1.11 | % | ||||||||||||||||||||
2022 Form 10-K 79
Commercial Banking reported net income of $1.1 billion in 2022, an increase of $345 million, or 43%, compared to the year ago period. Segment net interest income increased $595 million, or 46%, primarily due to an increase in average loans and leases, reflecting the impact of the TCF acquisition and continued organic loan and lease growth, and a 27-basis point increase in NIM, driven by the higher rate environment resulting in an increase in spreads. The provision for credit losses increased $24 million due to a combination of loan and lease growth in 2022 and a reduction in ACL coverage ratios over the course of 2021, as there was more clarity around the economic impacts of COVID-19. Noninterest income increased $147 million, or 28%, reflecting the impact of the TCF acquisition in addition to an increase in capital markets fees, primarily due to higher advisory fees supported by the impact of the Capstone Partners acquisition, loan syndication fees, foreign exchange fees, and interest rate derivatives fees. Noninterest expense increased $270 million, or 34%, primarily reflecting the impact of the TCF and Capstone Partners acquisitions, which led to higher personnel costs and allocated overhead.
| Consumer and Business Banking | |||||||||||||||||||||||||||||
| Table 27 - Key Performance Indicators for Consumer and Business Banking | |||||||||||||||||||||||||||||
| Year Ended December 31, | Change from 2021 | Year Ended December 31, | |||||||||||||||||||||||||||
| (dollar amounts in millions unless otherwise noted) | 2022 | 2021 | Amount | Percent | 2020 | ||||||||||||||||||||||||
| Net interest income | $ | 2,577 | $ | 1,667 | $ | 910 | 55 | % | $ | 1,436 | |||||||||||||||||||
| Provision for credit losses | 161 | 91 | 70 | 77 | 265 | ||||||||||||||||||||||||
| Noninterest income | 1,017 | 1,045 | (28) | (3) | 945 | ||||||||||||||||||||||||
| Noninterest expense | 2,434 | 2,231 | 203 | 9 | 1,774 | ||||||||||||||||||||||||
| Provision for income taxes | 210 | 82 | 128 | NM | 72 | ||||||||||||||||||||||||
| Net income | $ | 789 | $ | 308 | $ | 481 | NM | $ | 270 | ||||||||||||||||||||
| Number of employees (average FTE) | 10,573 | 9,211 | 1,362 | 15 | % | 7,908 | |||||||||||||||||||||||
| Total average assets | $ | 38,374 | $ | 36,617 | $ | 1,757 | 5 | $ | 28,853 | ||||||||||||||||||||
| Total average loans/leases | 32,123 | 31,436 | 687 | 2 | 25,453 | ||||||||||||||||||||||||
| Total average deposits | 94,071 | 81,289 | 12,782 | 16 | 56,960 | ||||||||||||||||||||||||
| Net interest margin | 2.71 | % | 2.02 | % | 0.69 | % | 34 | 2.48 | % | ||||||||||||||||||||
| NCOs | $ | 106 | $ | 96 | $ | 10 | 10 | $ | 102 | ||||||||||||||||||||
| NCOs as a % of average loans and leases | 0.33 | % | 0.31 | % | 0.02 | % | 6 | 0.40 | % | ||||||||||||||||||||
Consumer and Business Banking reported net income of $789 million in 2022, an increase of $481 million, compared to the year ago period. Segment net interest income increased $910 million, or 55%, primarily due to a 69 basis point increase in NIM driven by the higher rate environment and an increase in average assets reflecting the impact of the TCF acquisition, partially offset by a decrease in accelerated PPP loan fees recognized upon forgiveness payments from the SBA. The provision for credit losses increased $70 million, or 77%, primarily due to an increase in loan growth and uncertainty in the near-term recessionary risks. Noninterest income decreased $28 million, or 3%, primarily due to lower mortgage banking income reflecting lower salable volume and secondary marketing spreads, partially offset by the impact of the TCF acquisition and an increase in gain on sale of loans, primarily due to sales of SBA loans during the first through third quarters of 2022. Noninterest expense increased $203 million, or 9%, primarily due to the impact of the TCF acquisition largely driven by higher personnel expense reflecting an increase in the number of FTE employees and allocated overhead.
80 Huntington Bancshares Incorporated
| Vehicle Finance | |||||||||||||||||||||||||||||
| Table 28 - Key Performance Indicators for Vehicle Finance | |||||||||||||||||||||||||||||
| Year Ended December 31, | Change from 2021 | Year Ended December 31, | |||||||||||||||||||||||||||
| (dollar amounts in millions unless otherwise noted) | 2022 | 2021 | Amount | Percent | 2020 | ||||||||||||||||||||||||
| Net interest income | $ | 477 | $ | 468 | $ | 9 | 2 | % | $ | 430 | |||||||||||||||||||
| Provision (benefit) for credit losses | 83 | (86) | 169 | NM | 146 | ||||||||||||||||||||||||
| Noninterest income | 13 | 13 | — | — | 9 | ||||||||||||||||||||||||
| Noninterest expense | 165 | 163 | 2 | 1 | 141 | ||||||||||||||||||||||||
| Provision for income taxes | 51 | 85 | (34) | (40) | 32 | ||||||||||||||||||||||||
| Net income | $ | 191 | $ | 319 | $ | (128) | (40) | % | $ | 120 | |||||||||||||||||||
| Number of employees (average FTE) | 272 | 262 | 10 | 4 | % | 266 | |||||||||||||||||||||||
| Total average assets | $ | 21,306 | $ | 19,787 | $ | 1,519 | 8 | $ | 19,760 | ||||||||||||||||||||
| Total average loans/leases | 21,558 | 20,028 | 1,530 | 8 | 19,939 | ||||||||||||||||||||||||
| Total average deposits | 1,242 | 1,161 | 81 | 7 | 653 | ||||||||||||||||||||||||
| Net interest margin | 2.21 | % | 2.33 | % | (0.12) | % | (5) | 2.15 | % | ||||||||||||||||||||
| NCOs | $ | 13 | $ | (1) | $ | 14 | NM | $ | 45 | ||||||||||||||||||||
| NCOs as a % of average loans and leases | 0.06 | % | — | % | 0.06 | % | 100 | 0.23 | % | ||||||||||||||||||||
Vehicle Finance reported net income of $191 million in 2022, a decrease of $128 million, or 40%, compared to the year ago period. Segment net interest income increased $9 million or 2%, primarily due to an increase in average earning assets, partially offset by a 12 basis point decrease in the NIM. The provision for credit losses increased $169 million, primarily due to reserve releases in 2021 as the economic environment was improving, contrasted with reserve builds in 2022 that recognize the increased near-term recessionary risks.
| Regional Banking and The Huntington Private Client Group | |||||||||||||||||||||||||||||
| Table 29 - Key Performance Indicators for Regional Banking and The Huntington Private Client Group | |||||||||||||||||||||||||||||
| Year Ended December 31, | Change from 2021 | Year Ended December 31, | |||||||||||||||||||||||||||
| (dollar amounts in millions unless otherwise noted) | 2022 | 2021 | Amount | Percent | 2020 | ||||||||||||||||||||||||
| Net interest income | $ | 232 | $ | 159 | $ | 73 | 46 | % | $ | 160 | |||||||||||||||||||
| Provision for credit losses | 17 | 16 | 1 | 6 | 11 | ||||||||||||||||||||||||
| Noninterest income | 239 | 227 | 12 | 5 | 201 | ||||||||||||||||||||||||
| Noninterest expense | 320 | 300 | 20 | 7 | 243 | ||||||||||||||||||||||||
| Provision for income taxes | 28 | 15 | 13 | 87 | 22 | ||||||||||||||||||||||||
| Net income | $ | 106 | $ | 55 | $ | 51 | 93 | % | $ | 85 | |||||||||||||||||||
| Number of employees (average FTE) | 1,110 | 1,071 | 39 | 4 | % | 1,018 | |||||||||||||||||||||||
| Total average assets | $ | 9,304 | $ | 7,496 | $ | 1,808 | 24 | $ | 6,845 | ||||||||||||||||||||
| Total average loans/leases | 9,016 | 7,199 | 1,817 | 25 | 6,574 | ||||||||||||||||||||||||
| Total average deposits | 9,375 | 8,187 | 1,188 | 15 | 6,531 | ||||||||||||||||||||||||
| Net interest margin | 2.39 | % | 1.90 | % | 0.49 | % | 26 | 2.36 | % | ||||||||||||||||||||
| NCOs | $ | — | $ | — | $ | — | — | $ | — | ||||||||||||||||||||
| NCOs as a % of average loans and leases | (0.01) | % | — | % | (0.01) | % | NM | 0.01 | % | ||||||||||||||||||||
Total assets under management (in billions)—eop
|
$ | 21.7 | $ | 25.2 | $ | (3.5) | (14) | $ | 19.8 | ||||||||||||||||||||
Total trust assets (in billions)—eop
|
142.4 | 135.7 | 6.7 | 5 | 123.0 | ||||||||||||||||||||||||
eop—End of Period.
2022 Form 10-K 81
RBHPCG reported net income of $106 million in 2022, an increase of $51 million, or 93%, compared to the year ago period. Segment net interest income increased $73 million, or 46%, primarily due to an increase in average earning assets and a 49 basis point increase in NIM, largely driven by higher benefit in deposit spreads. Average loans and leases increased $1.8 billion, or 25%, due to growth in both commercial and residential real estate mortgages, and the impact of the TCF acquisition. Average deposits increased $1.2 billion, or 15%, primarily related to the acquired TCF deposit portfolio. Noninterest income increased $12 million, or 5%, reflecting higher sales production and the impact of the TCF acquisition. Total assets under management decreased 14% due to equity and bond market declines, partially offset by strong sales. Noninterest expense increased $20 million, or 7%, primarily due to an increase in personnel expense impacted by the TCF acquisition and impacts of strategic initiative investments.
Treasury / Other
The Treasury / Other function includes revenue and expense related to assets, liabilities, derivatives (including mark-to-market of interest rate caps, as applicable), and equity not directly assigned or allocated to one of the four business segments. Assets include investment securities and bank owned life insurance.
Net interest income includes the impact of administering our investment securities portfolios, the net impact of derivatives used to hedge interest rate sensitivity as well as the financial impact associated with our FTP methodology, as described above. Noninterest income includes miscellaneous fee income not allocated to other business segments, such as bank owned life insurance income and securities and trading asset gains or losses. Noninterest expense includes certain corporate administrative, acquisition-related expenses, if any, and other miscellaneous expenses not allocated to other business segments. The provision for income taxes for the business segments is calculated at a statutory 21% tax rate, although our overall effective tax rate is lower.
ADDITIONAL DISCLOSURES
Forward-Looking Statements
This report, including MD&A, contains certain forward-looking statements, including, but not limited to, certain plans, expectations, goals, projections, and statements, which are not historical facts and are subject to numerous assumptions, risks, and uncertainties. Statements that do not describe historical or current facts, including statements about beliefs and expectations, are forward-looking statements. Forward-looking statements may be identified by words such as expect, anticipate, believe, intend, estimate, plan, target, goal, or similar expressions, or future or conditional verbs such as will, may, might, should, would, could, or similar variations. The forward-looking statements are intended to be subject to the safe harbor provided by Section 27A of the Securities Act of 1933, Section 21E of the Securities Exchange Act of 1934, and the Private Securities Litigation Reform Act of 1995.
While there is no assurance that any list of risks and uncertainties or risk factors is complete, below are certain factors which could cause actual results to differ materially from those contained or implied in the forward-looking statements: changes in general economic, political, or industry conditions; deterioration in business and economic conditions, including persistent inflation, supply chain issues or labor shortages; instability in global economic conditions and geopolitical matters, as well as volatility in financial markets; the impact of pandemics, including the COVID-19 pandemic and related variants and mutations, and their impact on the global economy and financial market conditions and our business, results of operations, and financial condition; cybersecurity risks; uncertainty in U.S. fiscal and monetary policy, including the interest rate policies of the Federal Reserve; volatility and disruptions in global capital and credit markets; movements in interest rates; transition away from LIBOR; competitive pressures on product pricing and services; success, impact, and timing of our business strategies, including market acceptance of any new products or services including those implementing our “Fair Play” banking philosophy; the nature, extent, timing, and results of governmental actions, examinations, reviews, reforms, regulations, and interpretations, including those related to the Dodd-Frank Wall Street Reform and Consumer Protection Act and the Basel III regulatory capital reforms, as well as those involving the OCC, Federal Reserve, FDIC, and CFPB; and other factors that may affect the future results of Huntington.
82 Huntington Bancshares Incorporated
All forward-looking statements speak only as of the date they are made and are based on information available at that time. Huntington does not assume any obligation to update forward-looking statements to reflect circumstances or events that occur after the date the forward-looking statements were made or to reflect the occurrence of unanticipated events except as required by federal securities laws. As forward-looking statements involve significant risks and uncertainties, caution should be exercised against placing undue reliance on such statements.
Non-GAAP Financial Measures
This document contains GAAP financial measures and non-GAAP financial measures where management believes it to be helpful in understanding our results of operations or financial position. Where non-GAAP financial measures are used, the comparable GAAP financial measure, as well as the reconciliation to the comparable GAAP financial measure, can be found herein.
Fully-Taxable Equivalent Basis
Interest income, yields, and ratios on an FTE basis are considered non-GAAP financial measures. Management believes net interest income on an FTE basis provides an insightful picture of the interest margin for comparison purposes. The FTE basis also allows management to assess the comparability of revenue arising from both taxable and tax-exempt sources. The FTE basis assumes a federal statutory tax rate of 21 percent. We encourage readers to consider the Consolidated Financial Statements and other financial information contained in this Form 10-K in their entirety, and not to rely on any single financial measure.
Non-Regulatory Capital Ratios
In addition to capital ratios defined by banking regulators, the Company considers various other measures when evaluating capital utilization and adequacy, including:
•Tangible common equity to tangible assets,
•Tangible equity to tangible assets, and
•Tangible common equity to risk-weighted assets using Basel III definitions.
These non-regulatory capital ratios are viewed by management as useful additional methods of reflecting the level of capital available to withstand unexpected market conditions. Additionally, presentation of these ratios allows readers to compare our capitalization to other financial services companies. These ratios differ from capital ratios defined by banking regulators principally in that the numerator excludes goodwill and other intangible assets, the nature and extent of which varies among different financial services companies. These ratios are not defined in GAAP or federal banking regulations. As a result, these non-regulatory capital ratios disclosed by the Company are considered non-GAAP financial measures.
Because there are no standardized definitions for these non-regulatory capital ratios, the Company’s calculation methods may differ from those used by other financial services companies. Also, there may be limits in the usefulness of these measures to investors. As a result, we encourage readers to consider the Consolidated Financial Statements and other financial information contained in this Form 10-K in their entirety, and not to rely on any single financial measure.
Risk Factors
More information on risk is discussed in the Risk Factors section included in Item 1A: “Risk Factors” of this report. Additional information regarding risk factors can also be found in the Risk Management and Capital discussion of this report, as well as the “Regulatory Matters” section included in Item 1: Business of this report.
Critical Accounting Policies and Use of Significant Estimates
Our Consolidated Financial Statements are prepared in accordance with GAAP. The preparation of financial statements in conformity with GAAP requires us to establish accounting policies and make estimates that affect amounts reported in our Consolidated Financial Statements. Note 1 - “Significant Accounting Policies” of the Notes to Consolidated Financial Statements, which is incorporated by reference into this MD&A, describes the significant accounting policies we used in our Consolidated Financial Statements.
2022 Form 10-K 83
An accounting estimate requires assumptions and judgments about uncertain matters that could have a material effect on the Consolidated Financial Statements. Estimates are made under facts and circumstances at a point in time, and changes in those facts and circumstances could produce results substantially different from those estimates. Our most significant accounting policies and estimates and their related application are discussed below.
Allowance for Credit Losses
Our ACL at December 31, 2022 represents our current estimate of the lifetime credit losses expected from our loan and lease portfolio and our unfunded lending commitments. Management estimates the ACL by projecting probability of default, loss given default and exposure at default conditional on economic parameters, for the remaining contractual term. Internal factors that impact the quarterly allowance estimate include the level of outstanding balances, the portfolio performance and assigned risk ratings.
One of the most significant judgments influencing the ACL estimate is the macroeconomic forecasts. Key external economic parameters that directly impact our loss modeling framework include forecasted unemployment rates and Gross Domestic Product. Changes in the economic forecasts could significantly affect the estimated credit losses which could potentially lead to materially different allowance levels from one reporting period to the next.
Given the dynamic relationship between macroeconomic variables within our modeling framework, it is difficult to estimate the impact of a change in any one individual variable on the allowance. As a result, management uses a probability-weighted approach that incorporates a baseline, an adverse and a more favorable economic scenario when formulating the quantitative estimate.
However, to illustrate a hypothetical sensitivity analysis, management calculated a quantitative allowance using a 100% weighting applied to an adverse scenario. This scenario includes assumptions around OPEC oil supply cuts being more severe than anticipated and the Russian invasion of Ukraine worsening and lasting longer than the baseline scenario. The worsening inflationary pressures cause the Federal Reserve to raise interest rates more than in the baseline scenario to a peak of 5% by mid-2023. The combination of the worsening invasion, higher oil prices, rising inflation and the Federal Reserve’s response collectively cause the stock market to drop further and the economy falls into a recession in the first quarter of 2023. Under this scenario, as an example, the unemployment rate increases from baseline levels and remains elevated for a prolonged period, the rate is estimated at 7.7% and 6.6% at the end of 2023 and 2024, respectively. This forecast reflects unemployment rates that are approximately 3.6% and 2.7% higher than baseline scenario projections of 4.1% and 3.9%, respectively for the same time periods.
To demonstrate the sensitivity to key economic parameters used in the calculation of our ACL at December 31, 2022, management calculated the difference between our quantitative ACL and this 100% adverse scenario. Excluding consideration of qualitative adjustments, this sensitivity analysis would result in a hypothetical increase in our ACL of approximately $1 billion at December 31, 2022. This hypothetical increase is reflective of the sensitivity of the rate of change in the unemployment variable on our models.
The resulting difference is not intended to represent an expected increase in allowance levels for a number of reasons including the following:
•Management uses a weighted approach applied to multiple economic scenarios for its allowance estimation process;
•The highly uncertain economic environment;
•The difficulty in predicting the inter-relationships between the economic parameters used in the various economic scenarios; and
•The sensitivity estimate does not account for any general reserve components and associated risk profile adjustments incorporated by management as part of its overall allowance framework.
84 Huntington Bancshares Incorporated
We regularly review our ACL for appropriateness by performing on-going evaluations of the loan and lease portfolio. In doing so, we consider factors such as the differing economic risks associated with each loan category, the financial condition of specific borrowers, the level of delinquent loans, the value of any collateral and, where applicable, the existence of any guarantees or other documented support. We also evaluate the impact of changes in key economic parameters and overall economic conditions on the ability of borrowers to meet their financial obligations when quantifying our exposure to credit losses and assessing the appropriateness of our ACL at each reporting date. There is no certainty that our ACL will be appropriate over time to cover losses in our portfolio as economic and market conditions may ultimately differ from our reasonable and supportable forecast. Additionally, events adversely affecting specific customers, industries, or our markets such as geopolitical instability, risks of inflation including a near-term recession, or the emergence of a more contagious and severe COVID-19 variant, could severely impact our current expectations. If the credit quality of our customer base materially deteriorates or the risk profile of a market, industry, or group of customers changes materially, our net income and capital could be materially adversely affected which, in turn, could have a material adverse effect on our financial condition and results of operations. The extent to which the geopolitical instability, risks of inflation, and the COVID-19 pandemic will continue to negatively impact our businesses, financial condition, liquidity, and results will depend on future developments, which are highly uncertain and cannot be forecasted with precision at this time. For more information, see Note 5 - ”Loans / Leases” and Note 6 - “Allowance for Credit Losses” of the Notes to Consolidated Financial Statements.
Fair Value Measurement
Certain assets and liabilities are measured at fair value on a recurring basis, including securities and derivative instruments. A majority of assets and liabilities measured on a recurring basis are based on quoted market prices or market prices for similar instruments. Assets and liabilities measured at fair value on a non-recurring basis or that result in a Level 3 measurement in the fair value hierarchy, inherently include subjectivity and may require the use of significant assumptions, adjustments and judgment including, among others, discount rates, rates of return on assets, cash flows, default rates, loss rates, terminal values, and liquidation values. A significant change in assumptions may result in a significant change in fair value, which in turn, may result in a higher degree of financial statement volatility and could result in significant impact on our results of operations, financial condition or disclosures of fair value information.
While all non-recurring and Level 3 fair value measurements inherently have a significant level of estimation uncertainty, the following items are those most likely to have a material impact on our financial statements:
•Acquired Loans and Leases - When Huntington acquires loans and leases through an acquisition those loans are recorded at fair value on the acquisition date. This requires significant assumptions to be made about credit quality, likelihood of prepayment and current market conditions for similar loans. These assumptions form the basis for establishing discount rates and projecting future cash flows used to estimate the acquired loans fair value. Management generally will utilize a third-party specialist when these valuations are significant and as a result will perform various sensitivity analysis to determine the significance of specific inputs into the valuation.
•Direct Purchase Municipal Securities - Huntington holds certain municipal securities purchased directly from the issuer in non-public offerings. As a result, these securities use unobservable inputs to estimate fair value each period. Management utilizes a third-party valuation specialist to assist in determining certain assumptions used in the valuation and projecting future cash flows used to estimate fair value of the securities. Management reviews the valuations including understanding how sensitive the valuation is to specific inputs.
The fair values measured at each level of the fair value hierarchy, additional discussion regarding fair value measurements, and a brief description of how fair value is determined for categories that have unobservable inputs, can be found in Note 19 - “Fair Value of Assets and Liabilities” of the Notes to Consolidated Financial Statements.
2022 Form 10-K 85
Goodwill
The acquisition method of accounting requires that assets and liabilities acquired in a business combination are recorded at fair value as of the acquisition date. The valuation of assets and liabilities often involves estimates based on third party valuations or internal valuations based on discounted cash flow analyses or other valuation techniques, all of which are inherently subjective. This typically results in goodwill, the amount by which the cost of net assets acquired in a business combination exceeds their fair value, which is subject to impairment testing at least annually.
Management reviews the goodwill of each reporting unit for impairment on an annual basis as of October 1 or more often if events or circumstances indicate that it is more-likely-than-not that the fair value of a reporting unit is below its carrying value.
Based on our annual impairment analysis of goodwill as of October 1, it was determined that the fair value of each reporting unit was in excess of its respective carrying value as of October 1, 2022; therefore goodwill is considered not impaired. Huntington additionally performs sensitivity analyses around discount rate assumptions utilized in order to assess the reasonableness of the rates, and the resulting estimated fair values. As of October 1, 2022, a 100 basis point increase in discount rates would reduce estimated entity level fair value by approximately $2 billion and would not result in any impairment, as each reporting unit’s fair value would still exceed its carrying value.
Recent Accounting Pronouncements and Developments
Note 2 - “Accounting Standards Update” of the Notes to Consolidated Financial Statements discusses new accounting pronouncements adopted during 2022 and the expected impact of accounting pronouncements recently issued but not yet required to be adopted. To the extent the adoption of new accounting standards materially affects financial condition, results of operations, or liquidity, the impacts are discussed in the applicable section of this MD&A and the Notes to Consolidated Financial Statements.
Item 7A: Quantitative and Qualitative Disclosures About Market Risk
Information required by this item is set forth under the heading of “Market Risk” in Item 7: MD&A, which is incorporated by reference into this item.
Item 8: Financial Statements and Supplementary Data
Information required by this item is set forth in the Reports of Independent Registered Public Accounting Firm (PCAOB ID 238 ), Consolidated Financial Statements and Notes to Consolidated Financial Statements, which is incorporated by reference into this item. The selected quarterly financial data is no longer required. There were no material retrospective changes to any quarters in the two most recent fiscal years that would require this
disclosure.
86 Huntington Bancshares Incorporated
REPORT OF MANAGEMENT’S EVALUATION OF DISCLOSURE CONTROLS AND PROCEDURES
The Management of Huntington Bancshares Incorporated (Huntington or the Company) is responsible for the financial information and representations contained in the Consolidated Financial Statements and other sections of this report. The Consolidated Financial Statements have been prepared in conformity with accounting principles generally accepted in the United States. In all material respects, they reflect the substance of transactions that should be included based on informed judgments, estimates, and currently available information. Management maintains a system of internal accounting controls, which includes the careful selection and training of qualified personnel, appropriate segregation of responsibilities, communication of written policies and procedures, and a broad program of internal audits. The costs of the controls are balanced against the expected benefits. During 2022, the audit committee of the board of directors met regularly with Management, Huntington’s internal auditors, and the independent registered public accounting firm, PricewaterhouseCoopers LLP, to review the scope of their audits and to discuss the evaluation of internal accounting controls and financial reporting matters. The independent registered public accounting firm and the internal auditors have free access to, and meet confidentially with, the audit committee to discuss appropriate matters. Also, Huntington maintains a disclosure review committee. This committee’s purpose is to design and maintain disclosure controls and procedures to ensure that material information relating to the financial and operating condition of Huntington is properly reported to its chief executive officer, chief financial officer, chief auditor, and the audit committee of the board of directors in connection with the preparation and filing of periodic reports and the certification of those reports by the chief executive officer and the chief financial officer.
REPORT OF MANAGEMENT’S ASSESSMENT OF INTERNAL CONTROL OVER FINANCIAL REPORTING
Management is responsible for establishing and maintaining adequate internal control over financial reporting as such term is defined in Rules 13a-15(f) and 15d-15(f) of the Securities Exchange Act of 1934, as amended. Huntington’s Management assessed the effectiveness of the Company’s internal control over financial reporting as of December 31, 2022. In making this assessment, Management used the criteria set forth by the Committee of Sponsoring Organizations of the Treadway Commission (COSO) in Internal Control—Integrated Framework (2013). Based on that assessment, Management concluded that, as of December 31, 2022, the Company’s internal control over financial reporting is effective based on those criteria. The Company’s internal control over financial reporting as of December 31, 2022 has been audited by PricewaterhouseCoopers LLP, an independent registered public accounting firm, as stated in their report appearing on the next page.

Stephen D. Steinour – Chairman, President, and Chief Executive Officer

Zachary Wasserman – Senior Executive Vice President and Chief Financial Officer
February 17, 2023
2022 Form 10-K 87
Report of Independent Registered Public Accounting Firm
To the Board of Directors and Shareholders of
Huntington Bancshares Incorporated
Opinions on the Financial Statements and Internal Control over Financial Reporting
We have audited the accompanying consolidated balance sheets of Huntington Bancshares Incorporated and its subsidiaries (the “Company”) as of December 31, 2022 and 2021, and the related consolidated statements of income, of comprehensive income, of changes in shareholders' equity and of cash flows for each of the three years in the period ended December 31, 2022, including the related notes (collectively referred to as the “consolidated financial statements”). We also have audited the Company's internal control over financial reporting as of December 31, 2022, based on criteria established in Internal Control - Integrated Framework (2013) issued by the Committee of Sponsoring Organizations of the Treadway Commission (COSO).
In our opinion, the consolidated financial statements referred to above present fairly, in all material respects, the financial position of the Company as of December 31, 2022 and 2021, and the results of its operations and its cash flows for each of the three years in the period ended December 31, 2022 in conformity with accounting principles generally accepted in the United States of America. Also in our opinion, the Company maintained, in all material respects, effective internal control over financial reporting as of December 31, 2022, based on criteria established in Internal Control - Integrated Framework (2013) issued by the COSO.
Change in Accounting Principle
As discussed in Note 1 to the consolidated financial statements, the Company changed the manner in which it accounts for the allowance for credit losses as of January 1, 2020.
Basis for Opinions
The Company's management is responsible for these consolidated financial statements, for maintaining effective internal control over financial reporting, and for its assessment of the effectiveness of internal control over financial reporting, included in the accompanying Report of Management's Assessment of Internal Control over Financial Reporting. Our responsibility is to express opinions on the Company’s consolidated financial statements and on the Company's internal control over financial reporting based on our audits. We are a public accounting firm registered with the Public Company Accounting Oversight Board (United States) (PCAOB) and are required to be independent with respect to the Company in accordance with the U.S. federal securities laws and the applicable rules and regulations of the Securities and Exchange Commission and the PCAOB.
We conducted our audits in accordance with the standards of the PCAOB. Those standards require that we plan and perform the audits to obtain reasonable assurance about whether the consolidated financial statements are free of material misstatement, whether due to error or fraud, and whether effective internal control over financial reporting was maintained in all material respects.
Our audits of the consolidated financial statements included performing procedures to assess the risks of material misstatement of the consolidated financial statements, whether due to error or fraud, and performing procedures that respond to those risks. Such procedures included examining, on a test basis, evidence regarding the amounts and disclosures in the consolidated financial statements. Our audits also included evaluating the accounting principles used and significant estimates made by management, as well as evaluating the overall presentation of the consolidated financial statements. Our audit of internal control over financial reporting included obtaining an understanding of internal control over financial reporting, assessing the risk that a material weakness exists, and testing and evaluating the design and operating effectiveness of internal control based on the assessed risk. Our audits also included performing such other procedures as we considered necessary in the circumstances. We believe that our audits provide a reasonable basis for our opinions.
88 Huntington Bancshares Incorporated
Definition and Limitations of Internal Control over Financial Reporting
A company’s internal control over financial reporting is a process designed to provide reasonable assurance regarding the reliability of financial reporting and the preparation of financial statements for external purposes in accordance with generally accepted accounting principles. A company’s internal control over financial reporting includes those policies and procedures that (i) pertain to the maintenance of records that, in reasonable detail, accurately and fairly reflect the transactions and dispositions of the assets of the company; (ii) provide reasonable assurance that transactions are recorded as necessary to permit preparation of financial statements in accordance with generally accepted accounting principles, and that receipts and expenditures of the company are being made only in accordance with authorizations of management and directors of the company; and (iii) provide reasonable assurance regarding prevention or timely detection of unauthorized acquisition, use, or disposition of the company’s assets that could have a material effect on the financial statements.
Because of its inherent limitations, internal control over financial reporting may not prevent or detect misstatements. Also, projections of any evaluation of effectiveness to future periods are subject to the risk that controls may become inadequate because of changes in conditions, or that the degree of compliance with the policies or procedures may deteriorate.
Critical Audit Matters
The critical audit matter communicated below is a matter arising from the current period audit of the consolidated financial statements that was communicated or required to be communicated to the audit committee and that (i) relates to accounts or disclosures that are material to the consolidated financial statements and (ii) involved our especially challenging, subjective, or complex judgments. The communication of critical audit matters does not alter in any way our opinion on the consolidated financial statements, taken as a whole, and we are not, by communicating the critical audit matter below, providing a separate opinion on the critical audit matter or on the accounts or disclosures to which it relates.
Valuation of the General Reserve of the Allowance for Credit Losses
As described in Notes 1 and 6 to the consolidated financial statements, management’s estimate of the allowance for credit losses of $2.3 billion as of December 31, 2022 includes a general reserve that consists of various risk-profile reserve components. The risk-profile components consider items unique to the Company’s structure, policies, processes, and portfolio composition, as well as qualitative measurements and assessments of the Company’s loan portfolios including, but not limited to, economic uncertainty, concentrations, portfolio composition, industry comparisons, and internal review functions.
The principal considerations for our determination that performing procedures relating to the valuation of the general reserve of the allowance for credit losses is a critical audit matter are (i) the significant judgment by management when determining the general reserve, which in turn led to a high degree of auditor judgment, subjectivity, and effort in performing procedures and evaluating audit evidence relating to the methodology and assumptions used to determine the general reserve, and (ii) the audit effort involved the use of professionals with specialized skill and knowledge.
Addressing the matter involved performing procedures and evaluating audit evidence in connection with forming our overall opinion on the consolidated financial statements. These procedures included testing the effectiveness of controls related to the valuation of the general reserve of the allowance for credit losses. These procedures also included, among others, testing management’s process for determining the general reserve, including evaluating the appropriateness of management’s methodology, testing the completeness and accuracy of data utilized by management and evaluating the reasonableness of assumptions relating to the general reserve. Evaluating management’s assumptions related to the general reserve involved evaluating whether the assumptions used were reasonable considering portfolio composition, relevant market data, and indicators of economic uncertainty. Professionals with specialized skill and knowledge were used to assist in evaluating the appropriateness of management’s methodology and assumptions related to the general reserve.

February 17, 2023
We have served as the Company’s auditor since 2015.
2022 Form 10-K 89
Huntington Bancshares Incorporated
Consolidated Balance Sheets
| At December 31, | |||||||||||
| (dollar amounts in millions) | 2022 | 2021 | |||||||||
| Assets | |||||||||||
| Cash and due from banks | $ | $ | |||||||||
| Interest-bearing deposits at Federal Reserve Bank | |||||||||||
| Interest-bearing deposits in banks | |||||||||||
| Trading account securities | |||||||||||
| Available-for-sale securities | |||||||||||
| Held-to-maturity securities | |||||||||||
| Other securities | |||||||||||
Loans held for sale (includes $ |
|||||||||||
Loans and leases (includes $ |
|||||||||||
| Allowance for loan and lease losses | ( |
( |
|||||||||
| Net loans and leases | |||||||||||
| Bank owned life insurance | |||||||||||
| Accrued income and other receivables | |||||||||||
| Premises and equipment | |||||||||||
| Goodwill | |||||||||||
| Servicing rights and other intangible assets | |||||||||||
| Other assets | |||||||||||
| Total assets | $ | $ | |||||||||
| Liabilities and shareholders’ equity | |||||||||||
| Liabilities | |||||||||||
| Deposits: | |||||||||||
| Demand deposits—noninterest-bearing | $ | $ | |||||||||
| Interest-bearing | |||||||||||
| Total deposits | |||||||||||
| Short-term borrowings | |||||||||||
| Long-term debt | |||||||||||
| Other liabilities | |||||||||||
| Total liabilities | |||||||||||
| Commitments and Contingent Liabilities (Note 22) | |||||||||||
| Shareholders’ equity | |||||||||||
| Preferred stock | |||||||||||
| Common stock | |||||||||||
| Capital surplus | |||||||||||
| Less treasury shares, at cost | ( |
( |
|||||||||
| Accumulated other comprehensive (loss) gain | ( |
( |
|||||||||
| Retained earnings | |||||||||||
| Total Huntington Bancshares Inc shareholders’ equity | |||||||||||
| Non-controlling interest | |||||||||||
| Total equity | |||||||||||
| Total liabilities and shareholders’ equity | $ | $ | |||||||||
Common shares authorized (par value of $ |
|||||||||||
| Common shares outstanding | |||||||||||
| Treasury shares outstanding | |||||||||||
| Preferred stock, authorized shares | |||||||||||
| Preferred shares outstanding | |||||||||||
(1)Amounts represent loans for which Huntington has elected the fair value option. See Note 19 “Fair Values of Assets and Liabilities.”
See Notes to Consolidated Financial Statements
90 Huntington Bancshares Incorporated
Huntington Bancshares Incorporated
Consolidated Statements of Income
| Year Ended December 31, | |||||||||||||||||
| (dollar amounts in millions, except per share data, share amounts in thousands) | 2022 | 2021 | 2020 | ||||||||||||||
| Interest and fee income: | |||||||||||||||||
| Loans and leases | $ | $ | $ | ||||||||||||||
| Available-for-sale securities | |||||||||||||||||
| Taxable | |||||||||||||||||
| Tax-exempt | |||||||||||||||||
| Held-to-maturity securities-taxable | |||||||||||||||||
| Other securities-taxable | |||||||||||||||||
| Other interest income | |||||||||||||||||
| Total interest income | |||||||||||||||||
| Interest expense | |||||||||||||||||
| Deposits | |||||||||||||||||
| Short-term borrowings | |||||||||||||||||
| Long-term debt | |||||||||||||||||
| Total interest expense | |||||||||||||||||
| Net interest income | |||||||||||||||||
| Provision for credit losses | |||||||||||||||||
| Net interest income after provision for credit losses | |||||||||||||||||
| Service charges on deposit accounts | |||||||||||||||||
| Card and payment processing income | |||||||||||||||||
| Capital markets fees | |||||||||||||||||
| Trust and investment management services | |||||||||||||||||
| Mortgage banking income | |||||||||||||||||
| Leasing revenue | |||||||||||||||||
| Insurance income | |||||||||||||||||
| Gain on sale of loans | |||||||||||||||||
| Bank owned life insurance income | |||||||||||||||||
| Net gains (losses) on sales of securities | ( |
||||||||||||||||
| Other noninterest income | |||||||||||||||||
Total noninterest income |
|||||||||||||||||
| Personnel costs | |||||||||||||||||
| Outside data processing and other services | |||||||||||||||||
| Equipment | |||||||||||||||||
| Net occupancy | |||||||||||||||||
| Marketing | |||||||||||||||||
| Professional services | |||||||||||||||||
| Deposit and other insurance expense | |||||||||||||||||
| Amortization of intangibles | |||||||||||||||||
| Lease financing equipment depreciation | |||||||||||||||||
| Other noninterest expense | |||||||||||||||||
| Total noninterest expense | |||||||||||||||||
| Income before income taxes | |||||||||||||||||
| Provision for income taxes | |||||||||||||||||
| Income after income taxes | |||||||||||||||||
| Income attributable to non-controlling interest | |||||||||||||||||
| Net income attributable to Huntington Bancshares Inc | |||||||||||||||||
| Dividends on preferred shares | |||||||||||||||||
| Impact of preferred stock redemption | |||||||||||||||||
| Net income applicable to common shares | $ | $ | $ | ||||||||||||||
| Average common shares—basic | |||||||||||||||||
| Average common shares—diluted | |||||||||||||||||
| Per common share: | |||||||||||||||||
| Net income—basic | $ | $ | $ | ||||||||||||||
| Net income—diluted | |||||||||||||||||
See Notes to Consolidated Financial Statements
2022 Form 10-K 91
Huntington Bancshares Incorporated
Consolidated Statements of Comprehensive Income
| Year Ended December 31, | |||||||||||||||||
| (dollar amounts in millions) | 2022 | 2021 | 2020 | ||||||||||||||
| Net income attributable to Huntington Bancshares Inc | $ | $ | $ | ||||||||||||||
| Other comprehensive income, net of tax: | |||||||||||||||||
| Net unrealized (losses) gains on available-for-sale securities | ( |
( |
|||||||||||||||
| Net impact of hedges on available-for-sale securities | |||||||||||||||||
| Change in fair value of cash flow hedges on loans | ( |
( |
|||||||||||||||
| Translations adjustments, net of hedges | ( |
( |
|||||||||||||||
| Change in accumulated unrealized gains (losses) for pension and other post-retirement obligations | ( |
||||||||||||||||
| Other comprehensive (loss) income, net of tax | ( |
( |
|||||||||||||||
| Comprehensive (loss) income attributable to Huntington Bancshares | ( |
||||||||||||||||
| Comprehensive income attributed to non-controlling interest | |||||||||||||||||
| Comprehensive (loss) income | $ | ( |
$ | $ | |||||||||||||
See Notes to Consolidated Financial Statements
92 Huntington Bancshares Incorporated
Huntington Bancshares Incorporated
Consolidated Statements of Changes in Shareholders’ Equity
| Preferred Stock | Common Stock | AOCI | Non-controlling | ||||||||||||||||||||||||||||||||||||||||||||||||||||||||||||||
| (dollar amounts in millions, except per share data, share amounts in thousands) | Capital | Treasury Stock | Retained | Total | |||||||||||||||||||||||||||||||||||||||||||||||||||||||||||||
| Amount | Shares | Amount | Surplus | Shares | Amount | Earnings | Total | Interest | Equity | ||||||||||||||||||||||||||||||||||||||||||||||||||||||||
Year Ended December 31, 2022 |
|||||||||||||||||||||||||||||||||||||||||||||||||||||||||||||||||
| Balance, beginning of year | $ | $ | $ | ( |
$ | ( |
$ | ( |
$ | $ | $ | $ | |||||||||||||||||||||||||||||||||||||||||||||||||||||
| Net income | |||||||||||||||||||||||||||||||||||||||||||||||||||||||||||||||||
| Other comprehensive (loss) income, net of tax | ( |
( |
( |
||||||||||||||||||||||||||||||||||||||||||||||||||||||||||||||
| Cash dividends declared: | |||||||||||||||||||||||||||||||||||||||||||||||||||||||||||||||||
Common ($ |
( |
( |
( |
||||||||||||||||||||||||||||||||||||||||||||||||||||||||||||||
| Preferred | ( |
( |
( |
||||||||||||||||||||||||||||||||||||||||||||||||||||||||||||||
| Recognition of the fair value of share-based compensation | |||||||||||||||||||||||||||||||||||||||||||||||||||||||||||||||||
| Other share-based compensation activity | ( |
( |
( |
||||||||||||||||||||||||||||||||||||||||||||||||||||||||||||||
| Other | ( |
( |
|||||||||||||||||||||||||||||||||||||||||||||||||||||||||||||||
| Balance, end of year | $ | $ | $ | ( |
$ | ( |
$ | ( |
$ | $ | $ | $ | |||||||||||||||||||||||||||||||||||||||||||||||||||||
| Preferred Stock | Common Stock | AOCI | Non-controlling | ||||||||||||||||||||||||||||||||||||||||||||||||||||||||||||||
| (dollar amounts in millions, except per share data, share amounts in thousands) | Capital | Treasury Stock | Retained | Total | |||||||||||||||||||||||||||||||||||||||||||||||||||||||||||||
| Amount | Shares | Amount | Surplus | Shares | Amount | Earnings | Total | Interest | Equity | ||||||||||||||||||||||||||||||||||||||||||||||||||||||||
| Year Ended December 31, 2021 | |||||||||||||||||||||||||||||||||||||||||||||||||||||||||||||||||
| Balance, beginning of year | $ | $ | $ | ( |
$ | ( |
$ | $ | $ | $ | $ | ||||||||||||||||||||||||||||||||||||||||||||||||||||||
| Net income | |||||||||||||||||||||||||||||||||||||||||||||||||||||||||||||||||
| Other comprehensive (loss) income, net of tax | ( |
( |
( |
||||||||||||||||||||||||||||||||||||||||||||||||||||||||||||||
| TCF Financial Corp Acquisition: | |||||||||||||||||||||||||||||||||||||||||||||||||||||||||||||||||
| Issuance of common stock | ( |
||||||||||||||||||||||||||||||||||||||||||||||||||||||||||||||||
| Issuance of Series I Preferred Stock | |||||||||||||||||||||||||||||||||||||||||||||||||||||||||||||||||
| Non-controlling interest acquired | |||||||||||||||||||||||||||||||||||||||||||||||||||||||||||||||||
| Net proceeds from issuance of Series H Preferred Stock | |||||||||||||||||||||||||||||||||||||||||||||||||||||||||||||||||
| Redemption of preferred stock | ( |
( |
( |
( |
( |
||||||||||||||||||||||||||||||||||||||||||||||||||||||||||||
| Repurchases of common stock | ( |
( |
( |
( |
|||||||||||||||||||||||||||||||||||||||||||||||||||||||||||||
| Cash dividends declared: | |||||||||||||||||||||||||||||||||||||||||||||||||||||||||||||||||
Common ($ |
( |
( |
( |
||||||||||||||||||||||||||||||||||||||||||||||||||||||||||||||
| Preferred | ( |
( |
( |
||||||||||||||||||||||||||||||||||||||||||||||||||||||||||||||
| Recognition of the fair value of share-based compensation | |||||||||||||||||||||||||||||||||||||||||||||||||||||||||||||||||
| Other share-based compensation activity | ( |
( |
( |
( |
|||||||||||||||||||||||||||||||||||||||||||||||||||||||||||||
| Other | — | ( |
( |
( |
|||||||||||||||||||||||||||||||||||||||||||||||||||||||||||||
| Balance, end of year | $ | $ | $ | ( |
$ | ( |
$ | ( |
$ | $ | $ | $ | |||||||||||||||||||||||||||||||||||||||||||||||||||||
2022 Form 10-K 93
| Preferred Stock | Common Stock | AOCI | Non-controlling | ||||||||||||||||||||||||||||||||||||||||||||||||||||||||||||||
| (dollar amounts in millions, except per share data, share amounts in thousands) | Capital | Treasury Stock | Retained | Total | |||||||||||||||||||||||||||||||||||||||||||||||||||||||||||||
| Amount | Shares | Amount | Surplus | Shares | Amount | Earnings | Total | Interest | Equity | ||||||||||||||||||||||||||||||||||||||||||||||||||||||||
| Year Ended December 31, 2020 | |||||||||||||||||||||||||||||||||||||||||||||||||||||||||||||||||
| Balance, beginning of year | $ | $ | $ | ( |
$ | ( |
$ | ( |
$ | $ | $ | $ | |||||||||||||||||||||||||||||||||||||||||||||||||||||
| Cumulative-effect of change in accounting principle, net of tax | ( |
( |
( |
||||||||||||||||||||||||||||||||||||||||||||||||||||||||||||||
| Net income | — | ||||||||||||||||||||||||||||||||||||||||||||||||||||||||||||||||
| Other comprehensive income, net of tax | |||||||||||||||||||||||||||||||||||||||||||||||||||||||||||||||||
| Net proceeds from issuance of Preferred Stock | |||||||||||||||||||||||||||||||||||||||||||||||||||||||||||||||||
| Repurchases of common stock | ( |
( |
( |
( |
|||||||||||||||||||||||||||||||||||||||||||||||||||||||||||||
| Cash dividends declared: | |||||||||||||||||||||||||||||||||||||||||||||||||||||||||||||||||
Common ($ |
( |
( |
( |
||||||||||||||||||||||||||||||||||||||||||||||||||||||||||||||
| Preferred | ( |
( |
( |
||||||||||||||||||||||||||||||||||||||||||||||||||||||||||||||
| Recognition of the fair value of share-based compensation | |||||||||||||||||||||||||||||||||||||||||||||||||||||||||||||||||
| Other share-based compensation activity | — | ( |
— | ( |
( |
||||||||||||||||||||||||||||||||||||||||||||||||||||||||||||
| Other | ( |
— | ( |
( |
( |
— | ( |
( |
|||||||||||||||||||||||||||||||||||||||||||||||||||||||||
| Balance, end of year | $ | $ | $ | ( |
$ | ( |
$ | $ | $ | $ | $ | ||||||||||||||||||||||||||||||||||||||||||||||||||||||
See Notes to Consolidated Financial Statements
94 Huntington Bancshares Incorporated
Huntington Bancshares Incorporated
Consolidated Statements of Cash Flows
| Year Ended December 31, | |||||||||||||||||
| (dollar amounts in millions) | 2022 | 2021 | 2020 | ||||||||||||||
| Operating activities | |||||||||||||||||
| Net income | $ | $ | $ | ||||||||||||||
| Adjustments to reconcile net income to net cash provided by (used in) operating activities: | |||||||||||||||||
| Provision for credit losses | |||||||||||||||||
| Depreciation and amortization | |||||||||||||||||
| Share-based compensation expense | |||||||||||||||||
| Deferred income tax expense (benefit) | ( |
( |
|||||||||||||||
| Net change in: | |||||||||||||||||
| Trading account securities | |||||||||||||||||
| Loans held for sale | ( |
( |
|||||||||||||||
| Other assets | ( |
( |
|||||||||||||||
| Other liabilities | |||||||||||||||||
| Other, net | ( |
( |
|||||||||||||||
| Net cash provided by operating activities | |||||||||||||||||
| Investing activities | |||||||||||||||||
| Change in interest bearing deposits in banks | ( |
||||||||||||||||
| Net cash (paid) received from business acquisition | ( |
||||||||||||||||
| Proceeds from: | |||||||||||||||||
| Maturities and calls of available-for-sale securities | |||||||||||||||||
| Maturities and calls of held-to-maturity securities | |||||||||||||||||
| Maturities and calls of other securities | |||||||||||||||||
| Sales of available-for-sale securities | |||||||||||||||||
| Purchases of available-for-sale securities | ( |
( |
( |
||||||||||||||
| Purchases of held-to-maturity securities | ( |
( |
|||||||||||||||
| Purchases of other securities | ( |
( |
( |
||||||||||||||
| Net proceeds from sales of portfolio loans and leases | |||||||||||||||||
| Principal payments received under direct finance and sales-type leases | |||||||||||||||||
| Net loan and lease activity, excluding sales and purchases | ( |
( |
|||||||||||||||
| Purchases of premises and equipment | ( |
( |
( |
||||||||||||||
| Purchases of loans and leases | ( |
( |
( |
||||||||||||||
| Net accrued income and other receivables activity | ( |
( |
|||||||||||||||
| Net cash paid for branch disposition | ( |
||||||||||||||||
| Other, net | |||||||||||||||||
| Net cash used in investing activities | ( |
( |
( |
||||||||||||||
| Financing activities | |||||||||||||||||
| Increase in deposits | |||||||||||||||||
| Increase (decrease) in short-term borrowings | ( |
( |
|||||||||||||||
| Net proceeds from issuance of long-term debt | |||||||||||||||||
| Maturity/redemption of long-term debt | ( |
( |
( |
||||||||||||||
| Dividends paid on preferred stock | ( |
( |
( |
||||||||||||||
| Dividends paid on common stock | ( |
( |
( |
||||||||||||||
| Repurchases of common stock | ( |
( |
|||||||||||||||
| Payment to repurchase preferred stock | ( |
||||||||||||||||
| Net proceeds from issuance of preferred stock | |||||||||||||||||
| Other, net | ( |
( |
( |
||||||||||||||
| Net cash provided by financing activities | |||||||||||||||||
| Increase (decrease) in cash and cash equivalents | ( |
||||||||||||||||
| Cash and cash equivalents at beginning of period | |||||||||||||||||
| Cash and cash equivalents at end of period | $ | $ | $ | ||||||||||||||
| Year Ended December 31, | |||||||||||||||||
| (dollar amounts in millions) | 2022 | 2021 | 2020 | ||||||||||||||
| Supplemental disclosures: | |||||||||||||||||
| Interest paid | $ | $ | $ | ||||||||||||||
| Income taxes (refunded) paid | ( |
||||||||||||||||
| Non-cash activities | |||||||||||||||||
| Loans transferred to held-for-sale from portfolio | |||||||||||||||||
| Loans transferred to portfolio from held-for-sale | |||||||||||||||||
| Transfer of securities from available-for-sale to held-to-maturity | |||||||||||||||||
| Business Combination (1) | |||||||||||||||||
(1) In the year ended 2021, the TCF acquisition included fair value of tangible assets acquired of $46.3 billion, goodwill and other intangible assets of $3.5 billion, liabilities assumed $42.6 billion, preferred stock of $185 million, and common stock of $7.0 billion.
See Notes to Consolidated Financial Statements
95 Huntington Bancshares Incorporated
Huntington Bancshares Incorporated
Notes to Consolidated Financial Statements
1. SIGNIFICANT ACCOUNTING POLICIES
Nature of Operations — Huntington Bancshares Incorporated (Huntington or the Company) is a multi-state diversified regional bank holding company organized under Maryland law in 1966 and headquartered in Columbus, Ohio. Through its subsidiaries, including its bank subsidiary, The Huntington National Bank (the Bank), Huntington is engaged in providing full-service commercial and consumer banking services, mortgage banking services, automobile financing, recreational vehicle and marine financing, investment banking, capital markets, and advisory services, equipment financing, distribution finance (formerly referred to as inventory finance), investment management, trust services, brokerage services, insurance products and services, and other financial products and services. Huntington’s full-service branches and private client group offices are primarily located in Ohio, Colorado, Illinois, Indiana, Kentucky, Michigan, Minnesota, Pennsylvania, West Virginia, and Wisconsin. Select financial services and other activities are also conducted in other states.
Basis of Presentation — The Consolidated Financial Statements include the accounts of Huntington and its majority-owned subsidiaries and are presented in accordance with GAAP. All intercompany transactions and balances are eliminated in consolidation. Entities in which Huntington holds a controlling financial interest are consolidated. For a voting interest entity, a controlling financial interest is generally where Huntington holds, directly or indirectly, more than 50 percent of the outstanding voting shares. For a VIE, a controlling financial interest is where Huntington has the power to direct the activities of an entity that most significantly impact the entity’s economic performance and has an obligation to absorb losses or the right to receive benefits from the VIE. For consolidated entities where Huntington holds less than a 100% interest, Huntington recognizes non-controlling interest (included in shareholders’ equity) for the equity held by minority shareholders and non-controlling profit or loss (included in income attributable to non-controlling interest) for the portion of the entity’s earnings attributable to minority interests. Investments in companies that are not consolidated are accounted for using the equity method when Huntington has the ability to exert significant influence. Investments in non-marketable equity securities for which Huntington does not have the ability to exert significant influence are generally accounted for using the cost method adjusted for impairment and other changes in observable prices. Investments in private investment partnerships that are accounted for under the equity method or the cost method are included in other assets and Huntington’s earnings in equity investments are included in other noninterest income. Investments accounted for under the cost and equity methods are periodically evaluated for impairment.
Effective in the 2022, a new classification within the Consolidated Balance Sheet of accrued income and other receivables was established comprised of activity that was previously classified as loans and leases (other consumer loans and leases) and other assets. All prior period amounts and all related metrics have been reclassified to conform to the current presentation.
2022 Form 10-K 96
Securities — Securities purchased with the intention of recognizing short-term profits or which are actively bought and sold are classified as trading account securities and reported at fair value. The unrealized gains or losses on trading account securities are recorded in other noninterest income. Debt securities purchased that Huntington has the positive intent and ability to hold to their maturity are classified as held-to-maturity securities. Held-to-maturity securities are recorded at amortized cost. All other debt securities are classified as available-for-sale securities. Available-for-sale securities are recognized and measured at fair value with any change in the fair value recognized in other comprehensive income. All equity securities are classified as other securities.
Securities transactions are recognized on the trade date (the date the order to buy or sell is executed). The carrying value plus any related accumulated OCI balance of sold securities is used to compute realized gains and losses. Interest on securities, including amortization of premiums and accretion of discounts using the effective interest method over the period to maturity, is included in interest income.
Non-marketable equity securities include stock held for membership and regulatory purposes, such as FHLB stock and Federal Reserve Bank stock. These securities are accounted for at cost, evaluated for impairment, and are included in other securities. Other securities also include mutual funds and other marketable equity securities. These securities are carried at fair value, with changes in fair value recognized in other noninterest income.
Loans and Leases — Loans for which Huntington has the intent and ability to hold for the foreseeable future, or until maturity or payoff, except loans for which the fair value option has been elected, are carried at the principal amount outstanding, net of charge-offs, unamortized deferred loan origination fees and costs, premiums and discounts, and unearned income. Direct financing leases are reported at the aggregate of lease payments receivable and estimated residual values, net of unearned and deferred income, and any initial direct costs incurred to originate these leases. Renewal options for leases are at the option of the lessee and are typically not included in the measurement of the lease receivable as they are not considered reasonably certain of exercise. Purchase options are typically at fair value, and as such those options are not considered in the measurement of lease receivables or in lease classification. Interest income is accrued as earned using the interest method. Huntington defers the fees it receives from the origination of loans and leases, as well as the direct costs of those activities. Huntington also acquires loans at premiums and/or discounts to their contractual values. Huntington amortizes loan discounts, premiums, and net loan origination fees and costs over the contractual lives of the related loans using the effective interest method.
Troubled debt restructurings are loans for which the original contractual terms have been modified to provide a concession to a borrower experiencing financial difficulties. Loan modifications are considered TDRs when the concessions provided are not available to the borrower through either normal channels or other sources. However, not all loan modifications are TDRs. Modifications resulting in troubled debt restructurings may include changes to one or more terms of the loan, including, but not limited to, an interest rate concession, an extension of the repayment period, a reduction in payment amount, and partial forgiveness or deferment of principal or accrued interest.
Impairment of the residual values of direct financing leases is evaluated quarterly, with impairment arising if the expected fair value is less than the carrying amount. Huntington assesses net investments in leases (including residual values) for impairment and recognizes impairment losses in accordance with the impairment guidance for financial instruments. As such, net investments in leases may be reduced by an allowance for credit losses, with changes recognized as provision expense.
For leased equipment, the residual component of a direct financing lease represents the estimated fair value of the leased equipment at the end of the lease term. Huntington uses industry data, historical experience, and independent appraisals to establish these residual value estimates. Upon expiration of a lease, residual assets are remarketed, resulting in an extension of the lease by the lessee, a lease to a new customer, or purchase of the residual asset by the lessee or another party. Huntington also purchases insurance guaranteeing the value of certain residual assets.
97 Huntington Bancshares Incorporated
Nonaccrual and Past Due Loans — Loans are considered past due when the contractual amounts due with respect to principal and interest are not received within 30 days of the contractual due date.
Any loan in any portfolio may be placed on nonaccrual status prior to the policies described below when collection of principal or interest is in doubt. When a borrower with debt is discharged in a Chapter 7 bankruptcy and the debt is not reaffirmed by the borrower, the loan is determined to be collateral dependent and placed on nonaccrual status, unless there is a co-borrower or the repayment is likely to occur based on objective evidence.
All classes within the commercial loan and lease portfolio are placed on nonaccrual status at 90 150 -days past due. Junior-lien home equity loans are placed on nonaccrual status at the earlier of 120 -days past due or when the related first-lien loan has been identified as nonaccrual. Automobile, RV and marine, and other consumer loans are generally fully charged-off at 120 150 -days past due, with the exception of residential mortgages guaranteed by government agencies which continue to accrue interest at the rate guaranteed by the government agency.
For all classes within all loan portfolios, when a loan is placed on nonaccrual status, any accrued interest is reversed and charged against interest income.
For all classes within all loan portfolios, cash receipts on NALs are applied against principal until the loan or lease has been collected in full, including the charged-off portion, after which time any additional cash receipts are recognized as interest income. However, for secured non-reaffirmed debt in a Chapter 7 bankruptcy, payments are applied to principal and interest when the borrower has demonstrated a capacity to continue payment of the debt and collection of the debt is reasonably assured. For unsecured non-reaffirmed debt in a Chapter 7 bankruptcy where the carrying value has been fully charged-off, payments are recorded as loan recoveries.
Management monitors several factors to evaluate a borrower’s financial condition and their ability to make principal and interest payments. When, in management’s judgment, the borrower’s ability to make required principal and interest payments resumes and collectability is no longer in doubt, supported by sustained repayment history, the loan is returned to accrual status. For loans that are returned to accrual status, cash receipts are applied according to the contractual terms of the loan.
Collateral-dependent Loans — Certain commercial and consumer loans for which repayment is expected to be provided substantially through the operation or sale of the loan collateral are considered to be collateral-dependent.
Allowance for Credit Losses — Huntington performs an ACL evaluation on its loan and lease portfolio, held-to-maturity securities as well as on available-for-sale securities. The ACL on loan and lease portfolio and held-to-maturity securities are provided through an expected loss methodology referred to as CECL methodology. The ACL on AFS securities is provided when a credit loss is deemed to have occurred for securities which Huntington does not intend to sell or is not required to sell. The CECL methodology also applies to credit exposures on off-balance-sheet loan commitments, financial guarantees not accounted for as insurance, including standby letters of credit, and other similar instruments not recognized as derivative financial instruments.
On January 1, 2020, Huntington adopted ASC Topic 326 using the modified retrospective method for all financial assets in scope of the standard. Upon adoption, Huntington recorded an increase to the ACL of $393 million and a corresponding decrease to retained earnings of $306 million, net of tax.
2022 Form 10-K 98
Loans - The ACL is deducted from the amortized cost basis of a financial asset or a group of financial assets so that the balance sheet reflects the net amount Huntington expects to collect. Amortized cost is the principal balance outstanding, net of purchase premiums and discounts, fair value hedge accounting adjustments, and deferred fees and costs. Subsequent changes (favorable and unfavorable) in expected credit losses are recognized immediately in net income as a credit loss expense or a reversal of credit loss expense. Management estimates the allowance by utilizing models dependent upon loan risk characteristics and economic parameters. Commercial loan risk characteristics include but are not limited to risk ratings, industry type and maturity type. Consumer loan risk characteristics include but are not limited to FICO scores, LTV, and loan vintages. The economic parameters are developed using available information relating to past events, current conditions, and reasonable and supportable forecasts. Huntington’s reasonable and supportable forecast period reverts to a historical norm based on inputs within approximately two to three years. The reversion period is dependent on the state of the economy at the beginning of the forecast. Historical credit experience provides the basis for the estimation of expected credit losses, with adjustments made for differences in current loan-specific risk characteristics such as differences in underwriting standards, portfolio mix, delinquency levels and terms, as well as for changes in the micro- and macroeconomic environments. The contractual terms of financial assets are adjusted for expected prepayments and any extensions outside of Huntington’s control.
The ACL is measured on a collective basis when similar risk characteristics exist. Loans that are determined to have unique risk characteristics are evaluated on an individual basis by management. If a loan is determined to be collateral dependent or meets the criteria to apply the collateral dependent practical expedient, expected credit losses are determined based on the fair value of the collateral at the reporting date, less costs to sell as appropriate.
Management believes the products within each of the entity’s portfolio classes exhibit similar risk characteristics. Huntington has identified its portfolio classes as disclosed in Note 5 - “Loans and Leases.”
In addition to the transactional reserve described above, Huntington also maintains a general reserve that consists of various risk-profile reserve components. The risk-profile components consider items unique to Huntington’s structure, policies, processes, and portfolio composition, as well as qualitative measurements and assessments of the loan portfolios including, but not limited to, economic uncertainty, concentrations, portfolio composition, industry comparisons and internal review functions.
Huntington has elected to exclude accrued interest receivable from the measurement of its ACL given the well-defined non-accrual policies in place for all loan portfolios which results in timely reversal of outstanding interest through interest income.
The estimate for the off-balance sheet exposures, the AULC, is determined using the same procedures and methodologies as used for the loan and lease portfolio supplemented by the information related to future draws and related credit loss expectations. The AULC is recorded in other liabilities in the Consolidated Balance Sheets.
HTM Securities - The allowance for held-to-maturity debt securities is estimated using a CECL methodology. Any expected credit loss is provided through the allowance for credit loss on HTM securities and is deducted from the amortized cost basis of the security so that the balance sheet reflects the net amount Huntington expects to collect. Nearly all of Huntington’s HTM debt securities are issued by U.S. government entities and agencies. These securities are either explicitly or implicitly guaranteed by the U.S. government, are highly rated by major rating agencies, and have a long history of no credit losses. Accordingly, there is a zero credit loss expectation on these securities.
99 Huntington Bancshares Incorporated
AFS Securities - Huntington evaluates its available-for-sale investment securities portfolio on a quarterly basis for indicators of impairment. Huntington assesses whether an impairment has occurred when the fair value of a debt security is less than the amortized cost at the balance sheet date. Management reviews the amount of unrealized loss, the credit rating history, market trends of similar security classes, time remaining to maturity, and the source of both interest and principal payments to identify securities which could potentially be impaired. For those debt securities that Huntington intends to sell or is more likely than not required to sell, before the recovery of their amortized cost basis, the difference between fair value and amortized cost is considered to be impaired and is recognized in provision for credit losses. For those debt securities that Huntington does not intend to sell or is not more likely than not required to sell, prior to expected recovery of amortized cost basis, the credit portion of the impairment is recognized through an allowance in provision for credit losses while the noncredit portion is recognized in OCI. In determining the credit portion, Huntington uses a discounted cash flow analysis, which includes evaluating the timing and amount of the expected cash flows. Non-credit-related impairment results from other factors, including increased liquidity spreads and higher interest rates.
Charge-off of Uncollectible Loans — Any loan in any portfolio may be charged-off prior to the policies described below if a loss confirming event has occurred. Loss confirming events include, but are not limited to, bankruptcy (unsecured), continued delinquency, foreclosure, or receipt of an asset valuation indicating a collateral deficiency and that asset is the sole source of repayment. Additionally, discharged, collateral dependent non-reaffirmed debt in Chapter 7 bankruptcy filings will result in a charge-off to estimated collateral value, less anticipated selling costs, unless the repayment is likely to occur based on objective evidence.
Commercial loans and leases are generally either charged-off or written down to net realizable value at 90 120 150 -days past due and 120 -days past due, respectively. Residential mortgages are charged-off to the estimated fair value of the collateral at 150 -days past due.
Collateral — Huntington pledges assets as collateral as required for various transactions including security repurchase agreements, public deposits, loan notes, derivative financial instruments, short-term borrowings, and long-term borrowings. Assets that have been pledged as collateral, including those that can be sold or repledged by the secured party, continue to be reported on the Consolidated Balance Sheets.
Huntington also accepts collateral, primarily as part of various transactions including derivative instruments and security resale agreements. Collateral received is excluded from the Consolidated Balance Sheets.
2022 Form 10-K 100
Derivative Financial Instruments — A variety of derivative financial instruments, principally interest rate swaps, caps, floors, and swaption collars, are used in asset and liability management activities to protect against the risk of adverse price or interest rate movements. These instruments provide flexibility in adjusting Huntington’s sensitivity to changes in interest rates without exposure to loss of principal and higher funding requirements.
Huntington also uses derivatives, principally loan sale commitments, in hedging its mortgage loan interest rate lock commitments and its mortgage loans held for sale. Mortgage loan sale commitments and the related interest rate lock commitments are carried at fair value on the Consolidated Balance Sheets with changes in fair value reflected in mortgage banking income. Huntington also uses certain derivative financial instruments to offset changes in value of its MSRs. These derivatives consist primarily of forward interest rate agreements and forward mortgage contracts. The derivative instruments used are not designated as qualifying hedges. Accordingly, such derivatives are recorded at fair value with changes in fair value reflected in mortgage banking income.
Derivative financial instruments are recorded in the Consolidated Balance Sheets as either an asset or a liability (in other assets and other liabilities, respectively) and measured at fair value. Accounting for changes in fair value of derivatives depends on whether the derivative is designated and qualifies in a hedging relationship. At inception a derivative contract can be designated as:
•a qualifying hedge of the fair value of a recognized asset or liability or of an unrecognized firm commitment (fair value hedge);
•a qualifying hedge of the variability of cash flows to be received or paid related to a recognized asset, liability or forecasted transaction (cash flow hedge); or
•a qualifying hedge of Huntington’s investment in non-U.S. dollar functional currency entities (net investment hedge).
Changes in the fair value of a derivative that has been designated and qualifies as a fair value hedge, along with the changes in the fair value of the hedged asset or liability that is attributable to the hedged risk, are recorded in current period earnings. Changes in the fair value of a derivative that has been designated and qualifies as a cash flow hedge are recorded in other comprehensive income, net of income taxes, and reclassified into earnings in the period during which the hedged item affects earnings. Changes in the fair value of derivatives that have been designated as net investment hedges are recorded in other comprehensive income, net of income taxes, and reclassified into earnings during the period the foreign entity is substantially liquidated or other elements of the currency translation adjustment are reclassified into earnings. Changes in the fair value of derivatives held for trading purposes or which do not qualify for hedge accounting are reported in current period earnings.
For those derivatives to which hedge accounting is applied, Huntington formally documents the hedging relationship and the risk management objective and strategy for undertaking the hedge. This documentation identifies the hedging instrument, the hedged item or transaction, the nature of the risk being hedged, and, unless the hedge meets all of the criteria to assume there is no ineffectiveness, the method that will be used to assess the effectiveness of the hedging instrument. Huntington typically assesses effectiveness using statistical regression at inception and on an ongoing basis.
101 Huntington Bancshares Incorporated
Hedge accounting is discontinued prospectively when:
•the derivative is no longer effective or expected to be effective in offsetting changes in the fair value, cash flows or changes in net investment of a hedged item (including firm commitments or forecasted transactions);
•the derivative expires, is sold, terminated, or exercised;
•the forecasted transaction is no longer probable of occurring by the end of the originally specified time period;
•the hedged firm commitment no longer meets the definition of a firm commitment; or
•the designation of the derivative as a hedging instrument is removed.
When hedge accounting is discontinued and the derivative no longer qualifies as an effective fair value, cash flow or net investment hedge, the derivative continues to be carried on the balance sheet at fair value and changes in fair value will be recorded in current period earnings unless re-designated.
Like other financial instruments, derivatives contain an element of credit risk, which is the possibility that Huntington will incur a loss because the counterparty fails to meet its contractual obligations. Notional values of interest rate swaps and other off-balance sheet financial instruments significantly exceed the credit risk associated with these instruments and represent contractual balances on which calculations of amounts to be exchanged are based. Credit exposure is limited to the sum of the aggregate fair value of positions that have become favorable to Huntington, including any accrued interest receivable due from counterparties. Potential credit losses are mitigated by derivatives through central clearing parties, careful evaluation of counterparty credit standing, selection of counterparties from a limited group of high quality institutions, collateral agreements, and other contract provisions. Huntington considers the value of collateral held and collateral provided in determining the net carrying value of derivatives.
Huntington offsets the fair value amounts recognized for derivative instruments and the fair value for the right to reclaim cash collateral or the obligation to return cash collateral arising from derivative instruments recognized at fair value executed with the same counterparty under a master netting arrangement.
Fair Value Measurements — The Company records or discloses certain of its assets and liabilities at fair value. Fair value is defined as the exchange price that would be received for an asset or paid to transfer a liability (an exit price) in the principal or most advantageous market for the asset or liability in an orderly transaction between market participants on the measurement date. Fair value measurements are classified within one of three levels in a valuation hierarchy based upon the observability of inputs to the valuation of an asset or liability as of the measurement date. The three levels are defined as follows:
•Level 1 – inputs to the valuation methodology are quoted prices (unadjusted) for identical assets or liabilities in active markets.
•Level 2 – inputs to the valuation methodology include quoted prices for similar assets and liabilities in active markets, and inputs that are observable for the asset or liability, either directly or indirectly, for substantially the full term of the financial instrument.
•Level 3 – inputs to the valuation methodology are unobservable and significant to the fair value measurement.
A financial instrument’s categorization within the valuation hierarchy is based upon the lowest level of input that is significant to the fair value measurement.
2022 Form 10-K 102
contemporaneously with, or in contemplation of, the transfer, even if they were not entered into at the time of transfer. Control is generally considered to have been surrendered when (i) the transferred assets have been legally isolated from Huntington or any of its consolidated affiliates, even in bankruptcy or other receivership, (ii) the transferee (or, if the transferee is an entity whose sole purpose is to engage in securitization or asset-backed financing that is constrained from pledging or exchanging the assets it receives, each third-party holder of its beneficial interests) has the right to pledge or exchange the assets (or beneficial interests) it received without any constraints that provide more than a trivial benefit to Huntington, and (iii) neither Huntington nor its consolidated affiliates and agents have (a) both the right and obligation under any agreement to repurchase or redeem the transferred assets before their maturity, (b) the unilateral ability to cause the holder to return specific financial assets that also provides Huntington with a more-than-trivial benefit (other than through a cleanup call) or (c) an agreement that permits the transferee to require Huntington to repurchase the transferred assets at a price so favorable that it is probable that it will require Huntington to repurchase them.
If the sale criteria are met, the transferred financial assets are removed from the balance sheet and a gain or loss on sale is recognized. If the sale criteria are not met, the transfer is recorded as a secured borrowing in which the assets remain on the balance sheet and the proceeds from the transaction are recognized as a liability. For the majority of financial asset transfers, it is clear whether or not Huntington has surrendered control. For other transfers, such as in the case of complex transactions or where Huntington have continuing involvement, we generally obtain a legal opinion as to whether the transfer results in a true sale by law.
Gains and losses on the loans and leases sold and servicing rights associated with loan and lease sales are determined when the related loans or leases are sold to either a securitization trust or third-party. For loan or lease sales with servicing retained, a servicing asset is recorded at fair value for the right to service the loans sold.
Pension and Other Postretirement Benefits — Huntington recognizes the funded status of the postretirement benefit plans on the Consolidated Balance Sheets. Net postretirement benefit cost charged to current earnings related to these plans is predominantly based on various actuarial assumptions regarding expected future experience.
Certain employees are participants in various defined contribution and other non-qualified supplemental retirement plans. Contributions to defined contribution plans are charged to current earnings.
In addition, Huntington maintains a 401(k) plan covering substantially all employees. Employer contributions to the plan are charged to current earnings.
Noninterest Income — Huntington recognizes revenue when the performance obligations related to the transfer of goods or services under the terms of a contract are satisfied. Some obligations are satisfied at a point in time while others are satisfied over a period of time. Revenue is recognized as the amount of consideration to which Huntington expects to be entitled to in exchange for transferring goods or services to a customer. When consideration includes a variable component, the amount of consideration attributable to variability is included in the transaction price only to the extent it is probable that significant revenue recognized will not be reversed when uncertainty associated with the variable consideration is subsequently resolved. Generally, the variability relating to the consideration is explicitly stated in the contracts, but may also arise from Huntington’s customer business practices, for example, waiving certain fees related to customer’s deposit accounts such as NSF fees. Huntington’s contracts generally do not contain terms that require significant judgement to determine the variability impacting the transaction price.
Revenue is segregated based on the nature of product and services offered as part of contractual arrangements. Revenue from contracts with customers is broadly segregated as follows:
•Service charges on deposit accounts include fees and other charges Huntington receives to provide various services, including, but not limited to, maintaining an account with a customer, providing overdraft services, wire transfer, transferring funds, and accepting and executing stop-payment orders. The consideration includes both fixed (e.g., account maintenance fee) and transaction fees (e.g., wire-transfer fee). The fixed fee is recognized over a period of time while the transaction fee is recognized when a specific service (e.g., execution of wire-transfer) is rendered to the customer. Huntington may, from time to time, waive certain fees (e.g., NSF fee) for customers but generally does not reduce the transaction price to reflect variability for
103 Huntington Bancshares Incorporated
future reversals due to the insignificance of the amounts. Waiver of fees reduces the revenue in the period the waiver is granted to the customer.
•Card and payment processing income includes interchange fees earned on debit cards and credit cards. All other fees (e.g., annual fees), and interest income are recognized in accordance with ASC 310. Huntington recognizes interchange fees for services performed related to authorization and settlement of a cardholder’s transaction with a merchant. Revenue is recognized when a cardholder’s transaction is approved and settled.
Certain volume or transaction based interchange expenses (net of rebates) paid to the payment network reduce the interchange revenue and are presented net on the income statement. Similarly, rewards payable under a reward program to cardholders are recognized as a reduction of the transaction price and are presented net against the interchange revenue.
•Capital markets fees includes advisory fees, interest rate derivative fees, underwriting fees, foreign exchange fees and loan syndication fees. We recognize these fees when the related transaction closes.
•Trust and investment management services includes fee income generated from personal, corporate, and institutional customers. Huntington also provides investment management services, cash management services and tax reporting to customers. Services are rendered over a period of time, over which revenue is recognized. Huntington may also recognize revenue from referring a customer to outside third-parties including mutual fund companies that pay distribution (12b-1) fees and other expenses. 12b-1 fees are recognized in the period earned, this is generally upon initial placement into the fund and at specified future dates as long as the customer remains invested in the fund.
•Insurance income includes agency commissions that are recognized when Huntington sells insurance policies to customers. Huntington is also entitled to renewal commissions and, in some cases, profit sharing which are recognized in subsequent periods. The initial commission is recognized when the insurance policy is sold to a customer. Renewal commission is variable consideration and is recognized in subsequent periods when the uncertainty around variable consideration is subsequently resolved (i.e., when customer renews the policy). Profit sharing is also variable consideration that is not recognized until the variability surrounding realization of revenue is resolved (i.e., Huntington has reached a minimum volume of sales).
•Other noninterest income includes a variety of other revenue streams including miscellaneous consumer fees, marketing allowance revenue, and leasing revenue (including income from operating lease payments, other lease revenue, gain and losses on sales-type leases and sales of leased equipment). Revenue is recognized when, or as, the performance obligation is satisfied. Inherent variability in the transaction price is not recognized until the uncertainty affecting the variability is resolved.
Control is transferred to a customer either at a point in time or over time. A performance obligation is deemed satisfied when the control over goods or services is transferred to the customer. To determine when control is transferred at a point in time, Huntington considers indicators, including, but not limited to, the right to payment for the asset, transfer of significant risk and rewards of ownership of the asset and acceptance of the asset by the customer.
Revenue is recorded in the business segment responsible for the related product or service. Fee sharing arrangements exist to allocate portions of such revenue to other business segments involved in selling to, or providing service to, customers. Business segment results are determined based upon management’s reporting system, which assigns balance sheet and income statement items to each of the business segments. The process is designed around Huntington’s organizational and management structure and, accordingly, the results derived are not necessarily comparable with similar information published by other financial institutions.
2022 Form 10-K 104
2. ACCOUNTING STANDARDS UPDATE
Accounting standards adopted in the current period
| Standard | Summary of guidance | Effects on financial Statements | ||||||
| ASU 2021-08-Business Combinations (Topic 805) Issued October 2021 |
•The amendments in this update require that an acquirer apply topic 606 to the recognition and measurement of revenue contract assets and liabilities acquired in a business combination.
|
•Management adopted the guidance during the second quarter 2022.
•The ASU has been applied to all business combinations occurring during 2022 and will be applied prospectively to all future business combinations.
•The adoption did not result in a material impact on Huntington’s Consolidated Financial Statements.
|
||||||
| ASU 2022-01-Derivatives and Hedging (Topic 815): Fair Value Hedging - Portfolio Layer Method Issued March 2022 |
•The amendments in this update expand the current last-of-layer method to allow for multiple hedge layers in a single closed portfolio. To reflect the expansion, the last-of-layer method has been renamed the portfolio layer method. The standard also expands the scope of the portfolio layer method to nonprepayable financial assets.
|
•Management early adopted the guidance during the second quarter of 2022 using the modified retrospective basis. There was no impact to Huntington’s Consolidated Financial Statements as a result of the adoption. Amendments related to disclosures were applied prospectively from the initial adoption date.
•Huntington did not elect to reclassify debt securities classified in the held-to-maturity category at the date of adoption to the available-for-sale category.
|
||||||
| Accounting standards yet to be adopted | ||||||||
| Standard | Summary of guidance | Effects on financial statements | ||||||
| ASU 2022-02- Financial Instruments - Credit Losses (Topic 326): Troubled Debt Restructurings and Vintage Disclosures Issued March 2022 |
•The amendments in this update eliminate TDR accounting for entities that have adopted Update 2016-13, while enhancing disclosure requirements for certain loan modifications when a borrower is experiencing financial difficulty. The ASU also requires disclosure of current period gross write-offs by year of origination for financing receivables and net investment in leases.
|
•Effective for fiscal years beginning after December 15, 2022, including interim periods within those fiscal years.
•Adoption of the ASU will be applied prospectively, except for the portion of the standard related to the recognition and measurement of TDRs an entity may elect to use a modified retrospective transition method with a cumulative effect adjustment to retained earnings at the beginning of the period of adoption.
•Huntington adopted the standard effective January 1, 2023, using the modified retrospective method the impact of the adoption on the Consolidated Financial Statements was not material.
|
||||||
105 Huntington Bancshares Incorporated
3. BUSINESS COMBINATIONS
Capstone Partners
On June 15, 2022, Huntington acquired Capstone Partners, a leading middle market investment bank and advisory firm dedicated to servicing middle market companies throughout their full business lifecycle. The acquisition resulted in $192 million of goodwill, allocated to the Commercial segment, which approximates total consideration. The goodwill recognized is deductible for tax purposes. As of December 31, 2022, management completed its review of information relating to events or circumstances existing at the acquisition date.
TCF Financial Corporation
On June 9, 2021, Huntington closed the acquisition of TCF Financial Corporation in an all-stock transaction valued at $7.2 billion. TCF was a financial holding company headquartered in Detroit, Michigan with operations across the Midwest. The acquisition brought increased scale and market density, as well as added new markets and capabilities.
Under the terms of the agreement, TCF shareholders received 3.0028 shares of Huntington common stock for each share of TCF common stock. Holders of TCF common stock also received cash in lieu of fractional shares. In addition, each outstanding share of 5.70 % Series C Non-Cumulative Perpetual Preferred Stock of TCF was converted into one share of a newly created series of preferred stock of Huntington, Series I Preferred Stock.
The acquisition of TCF constituted a business combination. We recorded the estimate of fair value based on initial valuations available at June 9, 2021, the acquisition date. The determination of estimated fair value required management to make assumptions related to discount rates, expected future cash flows, market conditions and other future events that are highly subjective in nature. As of December 31, 2021, management completed its review of information relating to events or circumstances existing at the acquisition date.
2022 Form 10-K 106
The following table provides the allocation of consideration paid for the fair value of assets acquired and liabilities and equity assumed from TCF as of June 9, 2021.
| TCF | ||||||||||||||
| (dollar amounts in millions) | UPB | Fair Value | ||||||||||||
| Assets acquired: | ||||||||||||||
| Cash and due from banks | $ | |||||||||||||
| Interest-bearing deposits at Federal Reserve Bank | ||||||||||||||
| Interest-bearing deposits in banks | ||||||||||||||
| Available-for-sale securities | ||||||||||||||
| Other securities | ||||||||||||||
| Loans held for sale | ||||||||||||||
| Loans and leases: | ||||||||||||||
| Commercial: | ||||||||||||||
| Commercial and industrial | $ | |||||||||||||
| Commercial real estate | ||||||||||||||
| Lease financing | ||||||||||||||
| Total commercial | ||||||||||||||
| Consumer: | ||||||||||||||
| Residential mortgage | ||||||||||||||
| Automobile | ||||||||||||||
| Home equity | ||||||||||||||
| RV and marine | ||||||||||||||
| Other consumer | ||||||||||||||
| Total consumer | ||||||||||||||
| Total loans and leases | $ | |||||||||||||
| Bank owned life insurance | ||||||||||||||
| Premises and equipment | ||||||||||||||
| Core deposit intangible | ||||||||||||||
| Other intangible assets | ||||||||||||||
| Servicing rights | ||||||||||||||
| Servicing rights and other intangible assets | ||||||||||||||
| Other assets | ||||||||||||||
| Total assets acquired | ||||||||||||||
| Liabilities and equity assumed: | ||||||||||||||
| Deposits | ||||||||||||||
| Short-term borrowings | ||||||||||||||
| Long-term debt | ||||||||||||||
| Other liabilities | ||||||||||||||
| Total liabilities | ||||||||||||||
| Non-controlling interest | ||||||||||||||
| Net assets acquired | $ | |||||||||||||
| Consideration: | ||||||||||||||
| Fair value of common stock issued | $ | |||||||||||||
| Fair value of preferred stock exchange | ||||||||||||||
| Total consideration | ||||||||||||||
| Goodwill | $ | |||||||||||||
In connection with the acquisition, the Company recorded approximately $3.4 billion of goodwill. The goodwill was the result of expected synergies, operational efficiencies, and other factors. Information regarding the allocation of goodwill recorded as a result of the acquisition to the Company’s reportable segments, as well as the carrying amounts and amortization of core deposit and other intangible assets, are provided in Note 8 “Goodwill and Other Intangible Assets” of the Notes to Consolidated Financial Statements.
107 Huntington Bancshares Incorporated
The following is a description of the methods used to determine the fair values of significant assets and liabilities presented above.
Cash and due from banks and interest-bearing deposits in banks: The carrying amount of these assets is a reasonable estimate of fair value based on the short-term nature of these assets.
Securities: Fair values for securities are based on quoted market prices, where available. If quoted market prices are not available, fair value estimates are based on observable inputs including quoted market prices for similar instruments, quoted market prices that are not in an active market or other inputs that are observable in the market. In the absence of observable inputs, fair value is estimated based on pricing models and/or discounted cash flow methodologies.
Loans and leases: Fair values for loans and leases are based on a discounted cash flow methodology that considered factors including the type of loan and lease and related collateral, classification status, fixed or variable interest rate, term, amortization status and current discount rates. Loans and leases are grouped together according to similar characteristics when applying various valuation techniques. The discount rates used for loans and leases are based on current market rates for new originations of comparable loans and leases and include adjustments for liquidity. The discount rate does not include a factor for credit losses as that has been included as a reduction to the estimated cash flows.
CDI: This intangible asset represents the low cost of funding acquired core deposits provide relative to the Company’s marginal cost of funds. The fair value was estimated based on a discounted cash flow methodology that gave appropriate consideration to expected customer attrition rates, net maintenance cost of the deposit base, alternative cost of funds, and the interest costs associated with customer deposits. The CDI is being amortized over 10 years based upon the period over which estimated economic benefits are estimated to be received.
Deposits: The fair values used for the demand and savings deposits by definition equal the amount payable on demand at the acquisition date. The fair values for time deposits are estimated using a discounted cash flow calculation that applies interest rates currently being offered to the contractual interest rates on such time deposits.
Debt: The fair values of long-term debt instruments are estimated based on quoted market prices for the instrument if available, or for similar instruments if not available, or by using discounted cash flow analyses, based on current incremental borrowing rates for similar types of instruments.
Premises and equipment: The fair values of premises are based on a market approach, with Huntington obtaining third-party appraisals and broker opinions of value for land, office, and branch space.
Servicing rights: Servicing rights are valued using an option-adjusted spread valuation model to project cash flows over multiple interest rate scenarios which are then discounted at risk-adjusted rates. The model considers portfolio characteristics, prepayment rates, delinquency rates, contractually specified servicing fees, late charges, other ancillary revenue, costs to service and other economic factors.
PCD loans and leases
Purchased loans and leases that reflect a more-than-insignificant deterioration of credit from origination are considered PCD. For PCD loans and leases, the initial estimate of expected credit losses is recognized in the ALLL on the date of acquisition using the same methodology as other loans and leases held-for-investment. The following table provides a summary of loans and leases purchased as part of the TCF acquisition with credit deterioration at acquisition:
| (dollar amounts in millions) | Commercial | Consumer | Total | ||||||||||||||
| Par value (UPB) | $ | $ | $ | ||||||||||||||
| ALLL at acquisition | ( |
( |
( |
||||||||||||||
| Non-credit (discount) | ( |
( |
( |
||||||||||||||
| Fair value | $ | $ | $ | ||||||||||||||
2022 Form 10-K 108
Huntington's operating results for the years ended December 31, 2022 and December 31, 2021 include the operating results of the acquired assets and assumed liabilities of TCF Financial Corporation subsequent to the acquisition on June 9, 2021. Due to the conversions of TCF systems occurring throughout 2021, as well as other streamlining and integration of the operating activities into those of the Company, historical reporting for the former TCF operations is impracticable and thus disclosures of the revenue from the assets acquired and income before income taxes is impracticable for the period subsequent to acquisition.
The following table presents unaudited pro forma information as if the acquisition of TCF had occurred on January 1, 2020 under the “Unaudited Pro Forma” columns. The pro forma adjustments give effect to any change in interest income due to the accretion of the discount (premium) associated with the fair value adjustments to acquired loans and leases, any change in interest expense due to estimated premium amortization/discount accretion associated with the fair value adjustment to acquired interest-bearing deposits and long-term debt and the amortization of the CDI that would have resulted had the deposits been acquired as of January 1, 2020. Pro forma results include Huntington acquisition-related expenses which primarily included, but were not limited to, severance costs, professional services, data processing fees, marketing and advertising expenses totaling $701 million for the year ended December 31, 2021. Pro forma results also include adjustments for the elimination of TCF’s accretion of the discount (premium) associated with the fair value adjustments to acquired loans and leases, deposits and long-term debt, elimination of TCF's intangible amortization expense, and related income tax effects. The pro forma information does not necessarily reflect the results of operations that would have occurred had Huntington acquired TCF on January 1, 2020. Furthermore, cost savings and other business synergies related to the acquisition are not reflected in the pro forma amounts.
| Unaudited Pro Forma for | ||||||||||||||
| Year Ended December 31, | ||||||||||||||
| (dollar amounts in millions) | 2021 | 2020 | ||||||||||||
| Net interest income | $ | $ | ||||||||||||
| Noninterest income | ||||||||||||||
| Net income attributable to Huntington Bancshares Inc | ||||||||||||||
109 Huntington Bancshares Incorporated
4. INVESTMENT SECURITIES AND OTHER SECURITIES
Debt securities purchased in which Huntington has the intent and ability to hold to their maturity are classified as held-to-maturity securities. All other debt and equity securities are classified as either available-for-sale or other securities. The following tables provide amortized cost, fair value, and gross unrealized gains and losses by investment category.
| Unrealized | |||||||||||||||||||||||
| (dollar amounts in millions) | Amortized Cost (1)(2) |
Gross
Gains
|
Gross
Losses
|
Fair Value | |||||||||||||||||||
| At December 31, 2022 | |||||||||||||||||||||||
| Available-for-sale securities: | |||||||||||||||||||||||
| U.S. Treasury | $ | $ | $ | $ | |||||||||||||||||||
| Federal agencies: | |||||||||||||||||||||||
| Residential CMO | ( |
||||||||||||||||||||||
| Residential MBS | ( |
||||||||||||||||||||||
| Commercial MBS | ( |
||||||||||||||||||||||
| Other agencies | ( |
||||||||||||||||||||||
| Total U.S. Treasury, federal agency, and other agency securities | ( |
||||||||||||||||||||||
| Municipal securities | ( |
||||||||||||||||||||||
| Private-label CMO | ( |
||||||||||||||||||||||
| Asset-backed securities | ( |
||||||||||||||||||||||
| Corporate debt | ( |
||||||||||||||||||||||
Other securities/Sovereign debt |
|||||||||||||||||||||||
| Total available-for-sale securities | $ | $ | $ | ( |
$ | ||||||||||||||||||
| Held-to-maturity securities: | |||||||||||||||||||||||
| Federal agencies: | |||||||||||||||||||||||
| Residential CMO | $ | $ | $ | ( |
$ | ||||||||||||||||||
| Residential MBS | ( |
||||||||||||||||||||||
| Commercial MBS | ( |
||||||||||||||||||||||
| Other agencies | ( |
||||||||||||||||||||||
| Total federal agency and other agency securities | ( |
||||||||||||||||||||||
| Municipal securities | |||||||||||||||||||||||
| Total held-to-maturity securities | $ | $ | $ | ( |
$ | ||||||||||||||||||
| Other securities, at cost: | |||||||||||||||||||||||
| Non-marketable equity securities: | |||||||||||||||||||||||
| Federal Home Loan Bank stock | $ | $ | $ | $ | |||||||||||||||||||
| Federal Reserve Bank stock | |||||||||||||||||||||||
| Equity securities | |||||||||||||||||||||||
| Other securities, at fair value | |||||||||||||||||||||||
| Mutual funds | |||||||||||||||||||||||
| Equity securities | |||||||||||||||||||||||
| Total other securities | $ | $ | $ | $ | |||||||||||||||||||
(1)Amortized cost amounts exclude accrued interest receivable, which is recorded within accrued income and other receivables on the Consolidated Balance Sheets. At December 31, 2022, accrued interest receivable on available-for-sale securities and held-to-maturity securities totaled $64 million and $39 million, respectively.
(2)Excluded from the amortized cost are portfolio level basis adjustments for securities designated in fair value hedges under the portfolio layer method. The basis adjustments totaled $849 million and represent a reduction to the amortized cost of the securities being hedged. The securities being hedged under the portfolio layer method are primarily Residential CMO and Residential MBS securities.
2022 Form 10-K 110
| Unrealized | |||||||||||||||||||||||
| (dollar amounts in millions) | Amortized Cost (1) |
Gross Gains |
Gross Losses |
Fair Value | |||||||||||||||||||
| At December 31, 2021 | |||||||||||||||||||||||
| Available-for-sale securities: | |||||||||||||||||||||||
| U.S. Treasury | $ | $ | $ | $ | |||||||||||||||||||
| Federal agencies: | |||||||||||||||||||||||
| Residential CMO | ( |
||||||||||||||||||||||
| Residential MBS | ( |
||||||||||||||||||||||
| Commercial MBS | ( |
||||||||||||||||||||||
| Other agencies | ( |
||||||||||||||||||||||
| Total U.S. Treasury, federal agency, and other agency securities | ( |
||||||||||||||||||||||
| Municipal securities | ( |
||||||||||||||||||||||
| Private-label CMO | ( |
||||||||||||||||||||||
| Asset-backed securities | ( |
||||||||||||||||||||||
| Corporate debt | ( |
||||||||||||||||||||||
Other securities/Sovereign debt |
|||||||||||||||||||||||
| Total available-for-sale securities | $ | $ | $ | ( |
$ | ||||||||||||||||||
| Held-to-maturity securities: | |||||||||||||||||||||||
| Federal agencies: | |||||||||||||||||||||||
| Residential CMO | $ | $ | $ | ( |
$ | ||||||||||||||||||
| Residential MBS | ( |
||||||||||||||||||||||
| Commercial MBS | ( |
||||||||||||||||||||||
| Other agencies | |||||||||||||||||||||||
| Total federal agency and other agency securities | ( |
||||||||||||||||||||||
| Municipal securities | |||||||||||||||||||||||
| Total held-to-maturity securities | $ | $ | $ | ( |
$ | ||||||||||||||||||
| Other securities, at cost: | |||||||||||||||||||||||
| Non-marketable equity securities: | |||||||||||||||||||||||
| Federal Home Loan Bank stock | $ | $ | $ | $ | |||||||||||||||||||
| Federal Reserve Bank stock | |||||||||||||||||||||||
| Equity securities | |||||||||||||||||||||||
| Other securities, at fair value | |||||||||||||||||||||||
| Mutual funds | |||||||||||||||||||||||
| Equity securities | |||||||||||||||||||||||
| Total other securities | $ | $ | $ | $ | |||||||||||||||||||
(1)Amortized cost amounts exclude accrued interest receivable, which is recorded within accrued income and other receivables on the Consolidated Balance Sheets. At December 31, 2021, accrued interest receivable on available-for-sale securities and held-to-maturity securities totaled $62 million and $26 million, respectively.
111 Huntington Bancshares Incorporated
The following table provides the amortized cost and fair value of securities by contractual maturity. Expected maturities may differ from contractual maturities as issuers may have the right to call or prepay obligations with or without incurring penalties.
| At December 31, | |||||||||||||||||||||||
| 2022 | 2021 | ||||||||||||||||||||||
| (dollar amounts in millions) |
Amortized
Cost
|
Fair
Value
|
Amortized
Cost
|
Fair
Value
|
|||||||||||||||||||
| Available-for-sale securities: | |||||||||||||||||||||||
| Under 1 year | $ | $ | $ | $ | |||||||||||||||||||
| After 1 year through 5 years | |||||||||||||||||||||||
| After 5 years through 10 years | |||||||||||||||||||||||
| After 10 years | |||||||||||||||||||||||
| Total available-for-sale securities | $ | $ | $ | $ | |||||||||||||||||||
| Held-to-maturity securities: | |||||||||||||||||||||||
| Under 1 year | $ | $ | $ | $ | |||||||||||||||||||
| After 1 year through 5 years | |||||||||||||||||||||||
| After 5 years through 10 years | |||||||||||||||||||||||
| After 10 years | |||||||||||||||||||||||
| Total held-to-maturity securities | $ | $ | $ | $ | |||||||||||||||||||
The following tables provide detail on investment securities with unrealized losses aggregated by investment category and the length of time the individual securities have been in a continuous loss position.
| Less than 12 Months | Over 12 Months | Total | |||||||||||||||||||||||||||||||||
| (dollar amounts in millions) | Fair Value |
Gross Unrealized Losses |
Fair Value |
Gross Unrealized Losses |
Fair Value |
Gross Unrealized Losses |
|||||||||||||||||||||||||||||
| At December 31, 2022 | |||||||||||||||||||||||||||||||||||
| Available-for-sale securities: | |||||||||||||||||||||||||||||||||||
| Federal agencies: | |||||||||||||||||||||||||||||||||||
| Residential CMO | $ | $ | ( |
$ | $ | ( |
$ | $ | ( |
||||||||||||||||||||||||||
| Residential MBS | ( |
( |
( |
||||||||||||||||||||||||||||||||
| Commercial MBS | ( |
( |
( |
||||||||||||||||||||||||||||||||
| Other agencies | ( |
( |
( |
||||||||||||||||||||||||||||||||
| Total federal agency and other agency securities | ( |
( |
( |
||||||||||||||||||||||||||||||||
| Municipal securities | ( |
( |
( |
||||||||||||||||||||||||||||||||
| Private-label CMO | ( |
( |
( |
||||||||||||||||||||||||||||||||
| Asset-backed securities | ( |
( |
( |
||||||||||||||||||||||||||||||||
| Corporate debt | ( |
( |
( |
||||||||||||||||||||||||||||||||
| Total temporarily impaired available-for-sale securities | $ | $ | ( |
$ | $ | ( |
$ | $ | ( |
||||||||||||||||||||||||||
| Held-to-maturity securities: | |||||||||||||||||||||||||||||||||||
| Federal agencies: | |||||||||||||||||||||||||||||||||||
| Residential CMO | $ | $ | ( |
$ | $ | ( |
$ | $ | ( |
||||||||||||||||||||||||||
| Residential MBS | ( |
( |
( |
||||||||||||||||||||||||||||||||
| Commercial MBS | ( |
( |
( |
||||||||||||||||||||||||||||||||
| Other agencies | ( |
( |
|||||||||||||||||||||||||||||||||
| Total federal agency and other agency securities | ( |
( |
( |
||||||||||||||||||||||||||||||||
| Total temporarily impaired held-to-maturity securities | $ | $ | ( |
$ | $ | ( |
$ | $ | ( |
||||||||||||||||||||||||||
2022 Form 10-K 112
| Less than 12 Months | Over 12 Months | Total | |||||||||||||||||||||||||||||||||
| (dollar amounts in millions) | Fair Value |
Gross Unrealized Losses |
Fair Value |
Gross Unrealized Losses |
Fair Value |
Gross Unrealized Losses |
|||||||||||||||||||||||||||||
| At December 31, 2021 | |||||||||||||||||||||||||||||||||||
| Available-for-sale securities: | |||||||||||||||||||||||||||||||||||
| Federal agencies: | |||||||||||||||||||||||||||||||||||
| Residential CMO | $ | $ | ( |
$ | $ | $ | $ | ( |
|||||||||||||||||||||||||||
| Residential MBS | ( |
( |
|||||||||||||||||||||||||||||||||
| Commercial MBS | ( |
( |
|||||||||||||||||||||||||||||||||
| Other agencies | ( |
( |
|||||||||||||||||||||||||||||||||
| Total federal agency and other agency securities | ( |
( |
|||||||||||||||||||||||||||||||||
| Municipal securities | ( |
( |
( |
||||||||||||||||||||||||||||||||
| Private-label CMO | ( |
( |
|||||||||||||||||||||||||||||||||
| Asset-backed securities | ( |
( |
|||||||||||||||||||||||||||||||||
| Corporate debt | ( |
( |
|||||||||||||||||||||||||||||||||
| Total temporarily impaired available-for-sale securities | $ | $ | ( |
$ | $ | ( |
$ | $ | ( |
||||||||||||||||||||||||||
| Held-to-maturity securities: | |||||||||||||||||||||||||||||||||||
| Federal agencies: | |||||||||||||||||||||||||||||||||||
| Residential CMO | $ | $ | ( |
$ | $ | $ | $ | ( |
|||||||||||||||||||||||||||
| Residential MBS | ( |
( |
|||||||||||||||||||||||||||||||||
| Commercial MBS | ( |
( |
|||||||||||||||||||||||||||||||||
| Total federal agency and other agency securities | ( |
( |
|||||||||||||||||||||||||||||||||
| Total temporarily impaired held-to-maturity securities | $ | $ | ( |
$ | $ | $ | $ | ( |
|||||||||||||||||||||||||||
During 2022 and 2021, Huntington transferred $4.2 billion and $3.0 billion, respectively, of securities from the AFS portfolio to the HTM portfolio. At the time of the transfers, AOCI included $58 million of net unrealized losses and $2 million of unrealized gains, respectively, attributed to these securities. The gain or loss will be amortized into interest income over the remaining life of the securities.
At December 31, 2022 and December 31, 2021, the carrying value of investment securities pledged to secure public and trust deposits, trading account liabilities, U.S. Treasury demand notes, security repurchase agreements and to support borrowing capacity totaled $26.9 billion and $21.7 billion, respectively. There were no securities of a single issuer, which were not governmental or government-sponsored, that exceeded 10% of shareholders’ equity at either December 31, 2022 or December 31, 2021. At December 31, 2022, all HTM debt securities are considered AAA rated. In addition, there were no HTM debt securities considered past due at December 31, 2022.
Based on an evaluation of available information including security type, counterparty credit quality, past events, current conditions, and reasonable and supportable forecasts that are relevant to collectability of cash flows, as of December 31, 2022, Huntington has concluded that except for one municipal bond classified as an AFS debt security for which a charge-off of $4 million was recognized during 2022, it expects to receive all contractual cash flows from each security held in its AFS and HTM debt securities portfolio. There was no allowance related to securities as of December 31, 2022 or December 31, 2021.
113 Huntington Bancshares Incorporated
5. LOANS AND LEASES
The following table provides a detailed listing of Huntington’s loan and lease portfolio.
| At December 31, | |||||||||||
| (dollar amounts in millions) | 2022 | 2021 | |||||||||
| Commercial loan and lease portfolio: | |||||||||||
| Commercial and industrial | $ | $ | |||||||||
| Commercial real estate | |||||||||||
| Lease financing | |||||||||||
| Total commercial loan and lease portfolio | |||||||||||
| Consumer loan portfolio: | |||||||||||
| Residential mortgage | |||||||||||
| Automobile | |||||||||||
| Home equity | |||||||||||
| RV and marine | |||||||||||
| Other consumer | |||||||||||
| Total consumer loan portfolio | |||||||||||
| Total loans and leases (1)(2) | |||||||||||
| Allowance for loan and lease losses | ( |
( |
|||||||||
| Net loans and leases | $ | $ | |||||||||
(1)Loans and leases are reported at principal amount outstanding including unamortized purchase premiums and discounts, unearned income, and net direct fees and costs associated with originating and acquiring loans and leases. The aggregate amount of these loan and lease adjustments was a net premium (discount) of $3 million and $(111 ) million at December 31, 2022 and 2021, respectively.
Lease Financing
The following table presents net investments in lease financing receivables by category.
At December 31, |
|||||||||||
| (dollar amounts in millions) | 2022 | 2021 | |||||||||
| Lease payments receivable | $ | $ | |||||||||
| Estimated residual value of leased assets | |||||||||||
| Gross investment in lease financing receivables | |||||||||||
| Deferred origination costs | |||||||||||
| Deferred fees, unearned income and other | ( |
( |
|||||||||
| Total lease financing receivables | $ | $ | |||||||||
The carrying value of residual values guaranteed was $466 million and $473 million as of December 31, 2022 and December 31, 2021, respectively. The future lease rental payments due from customers on sales-type and direct financing leases at December 31, 2022, totaled $4.9 billion and were due as follows: $834 million in 2023, $781 million in 2024, $749 million in 2025, $725 million in 2026, $730 million in 2027, and $1.1 billion thereafter. Interest income recognized for these types of leases was $249 million, $193 million, and $106 million for the years 2022, 2021, and 2020, respectively.
2022 Form 10-K 114
Nonaccrual and Past Due Loans and Leases
The following table presents NALs by class.
| At December 31, 2022 | At December 31, 2021 | ||||||||||||||||||||||
| (dollar amounts in millions) | Nonaccrual loans with no ACL | Total nonaccrual loans | Nonaccrual loans with no ACL | Total nonaccrual loans | |||||||||||||||||||
| Commercial and industrial | $ | $ | $ | $ | |||||||||||||||||||
| Commercial real estate | |||||||||||||||||||||||
| Lease financing | |||||||||||||||||||||||
| Residential mortgage | |||||||||||||||||||||||
| Automobile | |||||||||||||||||||||||
| Home Equity | |||||||||||||||||||||||
| RV and marine | |||||||||||||||||||||||
| Total nonaccrual loans and leases | $ | $ | $ | $ | |||||||||||||||||||
The total amount of interest recorded to interest income for NAL loans was $23 million, $10 million, and $6 million in 2022, 2021, and 2020, respectively.
The following tables present an aging analysis of loans and leases, by class.
| At December 31, 2022 | ||||||||||||||||||||||||||||||||||||||||||||||||||
| Past Due (1) | Loans Accounted for Under FVO | Total Loans and Leases |
90 or more days past due and accruing |
|||||||||||||||||||||||||||||||||||||||||||||||
| (dollar amounts in millions) | 30-59 Days |
60-89 Days |
90 or more days |
Total | Current | |||||||||||||||||||||||||||||||||||||||||||||
| Commercial and industrial | $ | $ | $ | $ | $ | $ | $ | $ | (2) | |||||||||||||||||||||||||||||||||||||||||
| Commercial real estate | ||||||||||||||||||||||||||||||||||||||||||||||||||
| Lease financing | (3) | |||||||||||||||||||||||||||||||||||||||||||||||||
| Residential mortgage | (4) | |||||||||||||||||||||||||||||||||||||||||||||||||
| Automobile | ||||||||||||||||||||||||||||||||||||||||||||||||||
| Home equity | ||||||||||||||||||||||||||||||||||||||||||||||||||
| RV and marine | ||||||||||||||||||||||||||||||||||||||||||||||||||
| Other consumer | ||||||||||||||||||||||||||||||||||||||||||||||||||
| Total loans and leases | $ | $ | $ | $ | $ | $ | $ | $ | ||||||||||||||||||||||||||||||||||||||||||
| At December 31, 2021 | ||||||||||||||||||||||||||||||||||||||||||||||||||
| Past Due (1) | Loans Accounted for Under FVO | Total Loans and Leases |
90 or more days past due and accruing |
|||||||||||||||||||||||||||||||||||||||||||||||
| (dollar amounts in millions) |
30-59 Days
|
60-89 Days
|
90 or more days | Total | Current | |||||||||||||||||||||||||||||||||||||||||||||
| Commercial and industrial | $ | $ | $ | $ | $ | $ | $ | $ | (2) | |||||||||||||||||||||||||||||||||||||||||
| Commercial real estate | ||||||||||||||||||||||||||||||||||||||||||||||||||
| Lease financing | (3) | |||||||||||||||||||||||||||||||||||||||||||||||||
| Residential mortgage | (4) | |||||||||||||||||||||||||||||||||||||||||||||||||
| Automobile | ||||||||||||||||||||||||||||||||||||||||||||||||||
| Home equity | ||||||||||||||||||||||||||||||||||||||||||||||||||
| RV and marine | ||||||||||||||||||||||||||||||||||||||||||||||||||
| Other consumer | ||||||||||||||||||||||||||||||||||||||||||||||||||
| Total loans and leases | $ | $ | $ | $ | $ | $ | $ | $ | ||||||||||||||||||||||||||||||||||||||||||
(1)NALs are included in this aging analysis based on the loan’s past due status.
(2)Amounts include PPP and other SBA loans and leases.
(3)Amounts include Huntington Technology Finance administrative lease delinquencies.
(4)Amounts include mortgage loans insured by U.S. government agencies.
115 Huntington Bancshares Incorporated
Credit Quality Indicators
To facilitate the monitoring of credit quality for commercial loans, and for purposes of determining an appropriate ACL level for these loans, Huntington utilizes the following internally defined categories of credit grades:
•Pass - Higher quality loans that do not fit any of the other categories described below.
•OLEM - The credit risk may be relatively minor yet represents a risk given certain specific circumstances. If the potential weaknesses are not monitored or mitigated, the loan may weaken or the collateral may be inadequate to protect Huntington’s position in the future. For these reasons, Huntington considers the loans to be potential problem loans.
•Substandard - Inadequately protected loans resulting from the borrower’s ability to repay, equity, and/or the collateral pledged to secure the loan. These loans have identified weaknesses that could hinder normal repayment or collection of the debt. It is likely Huntington will sustain some loss if any identified weaknesses are not mitigated.
•Doubtful - Loans that have all of the weaknesses inherent in those loans classified as Substandard, with the added elements of the full collection of the loan is improbable and that the possibility of loss is high.
Loans are generally assigned a category of “Pass” rating upon initial approval and subsequently updated as appropriate based on the borrower’s financial performance.
Commercial loans categorized as OLEM, Substandard, or Doubtful are considered Criticized loans. Commercial loans categorized as Substandard or Doubtful are both considered Classified loans.
For all classes within the consumer loan portfolios, borrower credit bureau scores are monitored as an indicator of credit quality. A credit bureau score is a credit score developed by FICO based on data provided by the credit bureaus. The credit bureau score is widely accepted as the standard measure of consumer credit risk used by lenders, regulators, rating agencies, and consumers. The higher the credit bureau score, the higher likelihood of repayment and therefore, an indicator of higher credit quality.
Huntington assesses the risk in the loan portfolio by utilizing numerous risk characteristics. The classifications described above, and also presented in the table below, represent one of those characteristics that are closely monitored in the overall credit risk management processes.
2022 Form 10-K 116
The following tables present the amortized cost basis of loans and leases by vintage and credit quality indicator.
| At December 31, 2022 | |||||||||||||||||||||||||||||||||||||||||||||||||||||
| Term Loans Amortized Cost Basis by Origination Year | Revolver Total at Amortized Cost Basis | Revolver Total Converted to Term Loans | |||||||||||||||||||||||||||||||||||||||||||||||||||
| (dollar amounts in millions) | 2022 | 2021 | 2020 | 2019 | 2018 | Prior | Total | ||||||||||||||||||||||||||||||||||||||||||||||
| Commercial and industrial | |||||||||||||||||||||||||||||||||||||||||||||||||||||
| Credit Quality Indicator (1): | |||||||||||||||||||||||||||||||||||||||||||||||||||||
| Pass | $ | $ | $ | $ | $ | $ | $ | $ | $ | ||||||||||||||||||||||||||||||||||||||||||||
| OLEM | |||||||||||||||||||||||||||||||||||||||||||||||||||||
| Substandard | |||||||||||||||||||||||||||||||||||||||||||||||||||||
| Doubtful | |||||||||||||||||||||||||||||||||||||||||||||||||||||
| Total Commercial and industrial | $ | $ | $ | $ | $ | $ | $ | $ | $ | ||||||||||||||||||||||||||||||||||||||||||||
| Commercial real estate | |||||||||||||||||||||||||||||||||||||||||||||||||||||
| Credit Quality Indicator (1): | |||||||||||||||||||||||||||||||||||||||||||||||||||||
| Pass | $ | $ | $ | $ | $ | $ | $ | $ | $ | ||||||||||||||||||||||||||||||||||||||||||||
| OLEM | |||||||||||||||||||||||||||||||||||||||||||||||||||||
| Substandard | |||||||||||||||||||||||||||||||||||||||||||||||||||||
| Total Commercial real estate | $ | $ | $ | $ | $ | $ | $ | $ | $ | ||||||||||||||||||||||||||||||||||||||||||||
| Lease financing | |||||||||||||||||||||||||||||||||||||||||||||||||||||
| Credit Quality Indicator (1): | |||||||||||||||||||||||||||||||||||||||||||||||||||||
| Pass | $ | $ | $ | $ | $ | $ | $ | $ | $ | ||||||||||||||||||||||||||||||||||||||||||||
| OLEM | |||||||||||||||||||||||||||||||||||||||||||||||||||||
| Substandard | |||||||||||||||||||||||||||||||||||||||||||||||||||||
| Total Lease financing | $ | $ | $ | $ | $ | $ | $ | $ | $ | ||||||||||||||||||||||||||||||||||||||||||||
| Residential mortgage | |||||||||||||||||||||||||||||||||||||||||||||||||||||
| Credit Quality Indicator (2): | |||||||||||||||||||||||||||||||||||||||||||||||||||||
| 750+ | $ | $ | $ | $ | $ | $ | $ | $ | $ | ||||||||||||||||||||||||||||||||||||||||||||
| 650-749 | |||||||||||||||||||||||||||||||||||||||||||||||||||||
| <650 | |||||||||||||||||||||||||||||||||||||||||||||||||||||
| Total Residential mortgage | $ | $ | $ | $ | $ | $ | $ | $ | $ | ||||||||||||||||||||||||||||||||||||||||||||
| Automobile | |||||||||||||||||||||||||||||||||||||||||||||||||||||
| Credit Quality Indicator (2): | |||||||||||||||||||||||||||||||||||||||||||||||||||||
| 750+ | $ | $ | $ | $ | $ | $ | $ | $ | $ | ||||||||||||||||||||||||||||||||||||||||||||
| 650-749 | |||||||||||||||||||||||||||||||||||||||||||||||||||||
| <650 | |||||||||||||||||||||||||||||||||||||||||||||||||||||
| Total Automobile | $ | $ | $ | $ | $ | $ | $ | $ | $ | ||||||||||||||||||||||||||||||||||||||||||||
| Home Equity | |||||||||||||||||||||||||||||||||||||||||||||||||||||
| Credit Quality Indicator (2): | |||||||||||||||||||||||||||||||||||||||||||||||||||||
| 750+ | $ | $ | $ | $ | $ | $ | $ | $ | $ | ||||||||||||||||||||||||||||||||||||||||||||
| 650-749 | |||||||||||||||||||||||||||||||||||||||||||||||||||||
| <650 | |||||||||||||||||||||||||||||||||||||||||||||||||||||
| Total Home equity | $ | $ | $ | $ | $ | $ | $ | $ | $ | ||||||||||||||||||||||||||||||||||||||||||||
| RV and marine | |||||||||||||||||||||||||||||||||||||||||||||||||||||
| Credit Quality Indicator (2): | |||||||||||||||||||||||||||||||||||||||||||||||||||||
| 750+ | $ | $ | $ | $ | $ | $ | $ | $ | $ | ||||||||||||||||||||||||||||||||||||||||||||
| 650-749 | |||||||||||||||||||||||||||||||||||||||||||||||||||||
| <650 | |||||||||||||||||||||||||||||||||||||||||||||||||||||
| Total RV and marine | $ | $ | $ | $ | $ | $ | $ | $ | $ | ||||||||||||||||||||||||||||||||||||||||||||
| Other consumer | |||||||||||||||||||||||||||||||||||||||||||||||||||||
| Credit Quality Indicator (2): | |||||||||||||||||||||||||||||||||||||||||||||||||||||
| 750+ | $ | $ | $ | $ | $ | $ | $ | $ | $ | ||||||||||||||||||||||||||||||||||||||||||||
| 650-749 | |||||||||||||||||||||||||||||||||||||||||||||||||||||
| <650 | |||||||||||||||||||||||||||||||||||||||||||||||||||||
| Total Other consumer | $ | $ | $ | $ | $ | $ | $ | $ | $ | ||||||||||||||||||||||||||||||||||||||||||||
117 Huntington Bancshares Incorporated
| At December 31, 2021 | |||||||||||||||||||||||||||||||||||||||||||||||||||||
| Term Loans Amortized Cost Basis by Origination Year | Revolver Total at Amortized Cost Basis | Revolver Total Converted to Term Loans | |||||||||||||||||||||||||||||||||||||||||||||||||||
| (dollar amounts in millions) | 2021 | 2020 | 2019 | 2018 | 2017 | Prior | Total | ||||||||||||||||||||||||||||||||||||||||||||||
| Commercial and industrial | |||||||||||||||||||||||||||||||||||||||||||||||||||||
| Credit Quality Indicator (1): | |||||||||||||||||||||||||||||||||||||||||||||||||||||
| Pass | $ | $ | $ | $ | $ | $ | $ | $ | $ | ||||||||||||||||||||||||||||||||||||||||||||
| OLEM | |||||||||||||||||||||||||||||||||||||||||||||||||||||
| Substandard | |||||||||||||||||||||||||||||||||||||||||||||||||||||
| Doubtful | |||||||||||||||||||||||||||||||||||||||||||||||||||||
| Total Commercial and industrial | $ | $ | $ | $ | $ | $ | $ | $ | $ | ||||||||||||||||||||||||||||||||||||||||||||
| Commercial real estate | |||||||||||||||||||||||||||||||||||||||||||||||||||||
| Credit Quality Indicator (1): | |||||||||||||||||||||||||||||||||||||||||||||||||||||
| Pass | $ | $ | $ | $ | $ | $ | $ | $ | $ | ||||||||||||||||||||||||||||||||||||||||||||
| OLEM | |||||||||||||||||||||||||||||||||||||||||||||||||||||
| Substandard | |||||||||||||||||||||||||||||||||||||||||||||||||||||
| Doubtful | |||||||||||||||||||||||||||||||||||||||||||||||||||||
| Total Commercial real estate | $ | $ | $ | $ | $ | $ | $ | $ | $ | ||||||||||||||||||||||||||||||||||||||||||||
| Lease financing | |||||||||||||||||||||||||||||||||||||||||||||||||||||
| Credit Quality Indicator (1): | |||||||||||||||||||||||||||||||||||||||||||||||||||||
| Pass | $ | $ | $ | $ | $ | $ | $ | $ | $ | ||||||||||||||||||||||||||||||||||||||||||||
| OLEM | |||||||||||||||||||||||||||||||||||||||||||||||||||||
| Substandard | |||||||||||||||||||||||||||||||||||||||||||||||||||||
| Total Lease financing | $ | $ | $ | $ | $ | $ | $ | $ | $ | ||||||||||||||||||||||||||||||||||||||||||||
| Residential mortgage | |||||||||||||||||||||||||||||||||||||||||||||||||||||
| Credit Quality Indicator (2): | |||||||||||||||||||||||||||||||||||||||||||||||||||||
| 750+ | $ | $ | $ | $ | $ | $ | $ | $ | $ | ||||||||||||||||||||||||||||||||||||||||||||
| 650-749 | |||||||||||||||||||||||||||||||||||||||||||||||||||||
| <650 | |||||||||||||||||||||||||||||||||||||||||||||||||||||
| Total Residential mortgage | $ | $ | $ | $ | $ | $ | $ | $ | $ | ||||||||||||||||||||||||||||||||||||||||||||
| Automobile | |||||||||||||||||||||||||||||||||||||||||||||||||||||
| Credit Quality Indicator (2): | |||||||||||||||||||||||||||||||||||||||||||||||||||||
| 750+ | $ | $ | $ | $ | $ | $ | $ | $ | $ | ||||||||||||||||||||||||||||||||||||||||||||
| 650-749 | |||||||||||||||||||||||||||||||||||||||||||||||||||||
| <650 | |||||||||||||||||||||||||||||||||||||||||||||||||||||
| Total Automobile | $ | $ | $ | $ | $ | $ | $ | $ | $ | ||||||||||||||||||||||||||||||||||||||||||||
| Home equity | |||||||||||||||||||||||||||||||||||||||||||||||||||||
| Credit Quality Indicator (2): | |||||||||||||||||||||||||||||||||||||||||||||||||||||
| 750+ | $ | $ | $ | $ | $ | $ | $ | $ | $ | ||||||||||||||||||||||||||||||||||||||||||||
| 650-749 | |||||||||||||||||||||||||||||||||||||||||||||||||||||
| <650 | |||||||||||||||||||||||||||||||||||||||||||||||||||||
| Total Home equity | $ | $ | $ | $ | $ | $ | $ | $ | $ | ||||||||||||||||||||||||||||||||||||||||||||
| RV and marine | |||||||||||||||||||||||||||||||||||||||||||||||||||||
| Credit Quality Indicator (2): | |||||||||||||||||||||||||||||||||||||||||||||||||||||
| 750+ | $ | $ | $ | $ | $ | $ | $ | $ | $ | ||||||||||||||||||||||||||||||||||||||||||||
| 650-749 | |||||||||||||||||||||||||||||||||||||||||||||||||||||
| <650 | |||||||||||||||||||||||||||||||||||||||||||||||||||||
| Total RV and marine | $ | $ | $ | $ | $ | $ | $ | $ | $ | ||||||||||||||||||||||||||||||||||||||||||||
| Other consumer | |||||||||||||||||||||||||||||||||||||||||||||||||||||
| Credit Quality Indicator (2): | |||||||||||||||||||||||||||||||||||||||||||||||||||||
| 750+ | $ | $ | $ | $ | $ | $ | $ | $ | $ | ||||||||||||||||||||||||||||||||||||||||||||
| 650-749 | |||||||||||||||||||||||||||||||||||||||||||||||||||||
| <650 | |||||||||||||||||||||||||||||||||||||||||||||||||||||
| Total Other consumer | $ | $ | $ | $ | $ | $ | $ | $ | $ | ||||||||||||||||||||||||||||||||||||||||||||
(1)Consistent with the credit quality disclosures, indicators for the Commercial portfolio are based on internally defined categories of credit grades which are generally refreshed at least semi-annually.
(2)Consistent with the credit quality disclosures, indicators for the Consumer portfolio are based on updated customer credit scores refreshed at least quarterly.
2022 Form 10-K 118
TDR Loans
TDR Concession Types
The Company’s standards relating to loan modifications consider, among other factors, minimum verified income requirements, cash flow analyses, and collateral valuations. Each potential loan modification is reviewed individually and the terms of the loan are modified to meet a borrower’s specific circumstances at a point in time. All commercial TDRs are reviewed and approved by our FRG.
Following is a description of TDRs by the different loan types:
Commercial loan TDRs – Our strategy involving commercial TDR borrowers includes working with these borrowers to allow them to refinance elsewhere, as well as allow them time to improve their financial position and remain a Huntington customer through refinancing their notes according to market terms and conditions in the future. A subsequent refinancing or modification of a loan may occur when either the loan matures according to the terms of the TDR-modified agreement, or the borrower requests a change to the loan agreements. At that time, the loan is evaluated to determine if the borrower is creditworthy. It is subjected to the normal underwriting standards and processes for other similar credit extensions, both new and existing. The refinanced note is evaluated to determine if it is considered a new loan or a continuation of the prior loan.
Consumer loan TDRs – Residential mortgage TDRs represent loan modifications associated with traditional first-lien mortgage loans in which a concession has been provided to the borrower. The primary concessions given to residential mortgage borrowers are amortization, maturity date, and interest rate concessions. Residential mortgages identified as TDRs involve borrowers unable to refinance their mortgages through the Company’s normal mortgage origination channels or through other independent sources. Some, but not all, of the loans may be delinquent. The Company may make similar interest rate, term, and principal concessions for Automobile, Home Equity, RV and Marine, and Other Consumer loan TDRs.
TDR Impact on Credit Quality
Huntington’s ALLL is influenced by loan level characteristics that inform the assessed propensity to default. As such, the provision for credit losses is impacted primarily by changes in such loan level characteristics, such as payment performance, rather than the TDR classification. TDRs can be classified as either accrual or nonaccrual loans. Nonaccrual TDRs are included in NALs whereas accruing TDRs are excluded from NALs as it is probable that all contractual principal and interest due under the restructured terms will be collected.
The Company’s TDRs may include multiple concessions and the disclosure classifications are presented based on the primary concession provided to the borrower.
119 Huntington Bancshares Incorporated
The following table presents, by class and modification type, the number of contracts, post-modification outstanding balance, and the financial effects of the modification.
| New Troubled Debt Restructurings (1) | |||||||||||||||||||||||||||||||||||
| Number of Contracts |
Post-modification Outstanding Recorded Investment (2) | ||||||||||||||||||||||||||||||||||
| (dollar amounts in millions) | Interest rate concession | Amortization or maturity date concession | Chapter 7 bankruptcy | Other | Total | ||||||||||||||||||||||||||||||
| Year Ended December 31, 2022 | |||||||||||||||||||||||||||||||||||
| Commercial and industrial | $ | $ | $ | $ | $ | ||||||||||||||||||||||||||||||
| Commercial real estate | |||||||||||||||||||||||||||||||||||
| Residential mortgage | |||||||||||||||||||||||||||||||||||
| Automobile | |||||||||||||||||||||||||||||||||||
| Home equity | |||||||||||||||||||||||||||||||||||
| RV and marine | |||||||||||||||||||||||||||||||||||
| Other consumer | |||||||||||||||||||||||||||||||||||
| Total new TDRs | $ | $ | $ | $ | $ | ||||||||||||||||||||||||||||||
| Year Ended December 31, 2021 | |||||||||||||||||||||||||||||||||||
| Commercial and industrial | $ | $ | $ | $ | $ | ||||||||||||||||||||||||||||||
| Commercial real estate | |||||||||||||||||||||||||||||||||||
| Residential mortgage | |||||||||||||||||||||||||||||||||||
| Automobile | |||||||||||||||||||||||||||||||||||
| Home equity | |||||||||||||||||||||||||||||||||||
| RV and marine | |||||||||||||||||||||||||||||||||||
| Other consumer | |||||||||||||||||||||||||||||||||||
| Total new TDRs | $ | $ | $ | $ | $ | ||||||||||||||||||||||||||||||
(1)TDRs may include multiple concessions and the disclosure classifications are based on the primary concession provided to the borrower.
(2)Post-modification balances approximate pre-modification balances.
Pledged Loans
The Bank has access to the Federal Reserve’s discount window and advances from the FHLB. As of December 31, 2022 and 2021, these borrowings and advances are secured by $70.9 billion and $61.1 billion, respectively, of loans.
2022 Form 10-K 120
6. ALLOWANCE FOR CREDIT LOSSES
The following table presents ACL activity by portfolio segment.
| (dollar amounts in millions) | Commercial | Consumer | Total | |||||||||||||||||
| Year ended December 31, 2022: | ||||||||||||||||||||
| ALLL balance, beginning of period | $ | $ | $ | |||||||||||||||||
| Loan and lease charge-offs | ( |
( |
( |
|||||||||||||||||
| Recoveries of loans and leases previously charged-off | ||||||||||||||||||||
| Provision (benefit) for loan and lease losses | ( |
|||||||||||||||||||
ALLL balance, end of period |
$ | $ | $ | |||||||||||||||||
| AULC balance, beginning of period | $ | $ | $ | |||||||||||||||||
| Provision for unfunded lending commitments | ||||||||||||||||||||
| AULC balance, end of period | $ | $ | $ | |||||||||||||||||
| ACL balance, end of period | $ | $ | $ | |||||||||||||||||
| Year ended December 31, 2021: | ||||||||||||||||||||
| ALLL balance, beginning of period | $ | $ | $ | |||||||||||||||||
| Loan and lease charge-offs | ( |
( |
( |
|||||||||||||||||
| Recoveries of loans and leases previously charged-off | ||||||||||||||||||||
| Provision (benefit) for loan and lease losses | ( |
( |
||||||||||||||||||
| Allowance on PCD loans and leases at acquisition | ||||||||||||||||||||
| ALLL balance, end of period | $ | $ | $ | |||||||||||||||||
| AULC balance, beginning of period | $ | $ | $ | |||||||||||||||||
| Provision for unfunded lending commitments | ||||||||||||||||||||
| Unfunded lending commitment losses | ( |
( |
||||||||||||||||||
| AULC balance, end of period | $ | $ | $ | |||||||||||||||||
| ACL balance, end of period | $ | $ | $ | |||||||||||||||||
| Year ended December 31, 2020: | ||||||||||||||||||||
| ALLL balance, beginning of period | $ | $ | $ | |||||||||||||||||
| Cumulative-effect of change in accounting principle for financial instruments - credit losses (1) | ||||||||||||||||||||
| Loan and lease charge-offs | ( |
( |
( |
|||||||||||||||||
| Recoveries of loans and leases previously charged-off | ||||||||||||||||||||
| Provision for loan and lease losses | ||||||||||||||||||||
| ALLL balance, end of period | $ | $ | $ | |||||||||||||||||
| AULC balance, beginning of period | $ | $ | $ | |||||||||||||||||
| Cumulative-effect of change in accounting principle for financial instruments - credit losses (1) | ( |
|||||||||||||||||||
| Provision (benefit) for unfunded lending commitments | ( |
( |
( |
|||||||||||||||||
| Unfunded lending commitment losses | ( |
( |
||||||||||||||||||
| AULC balance, end of period | $ | $ | $ | |||||||||||||||||
| ACL balance, end of period | $ | $ | $ | |||||||||||||||||
(1)Relates to day one impact of the CECL adjustment as a result of the implementation of ASU 2016-13.
At December 31, 2022, the ACL was $2.3 billion, an increase of $164 million from the December 31, 2021 balance of $2.1 billion. The increase was primarily driven by loan and lease growth of $8.3 billion, but also recognizes the increased near-term recessionary risks at the end of 2022.
The Commercial ACL was $1.5 5.4 billion and a generally more pessimistic economic forecast were offset by reductions in qualitative reserves related to the CRE portfolio as more clarity with respect to COVID-related impacts emerged throughout 2022.
The Consumer ACL balance was $776 million at December 31, 2022, an increase of $172 million from the December 31, 2021 balance of $604 million. The increase is attributable to a combination of strong consumer loan growth over the course of 2022 of $2.9 billion, while also reflecting a deterioration in the economic forecast resulting in increased near-term recessionary risks for the consumer portfolio.
121 Huntington Bancshares Incorporated
7. MORTGAGE LOAN SALES AND SERVICING RIGHTS
Residential Mortgage Portfolio
The following table summarizes activity relating to residential mortgage loans sold with servicing retained.
| Year Ended December 31, | |||||||||||||||||
| (dollar amounts in millions) | 2022 | 2021 | 2020 | ||||||||||||||
| Residential mortgage loans sold with servicing retained | $ | $ | $ | ||||||||||||||
| Pretax gains resulting from above loan sales (1) | |||||||||||||||||
(1)Recorded in mortgage banking income.
The following table summarizes the changes in MSRs recorded using the fair value method:
| Year Ended December 31, | ||||||||||||||
| (dollar amounts in millions) | 2022 | 2021 | ||||||||||||
| Fair value, beginning of period | $ | $ | ||||||||||||
| Servicing assets obtained in acquisition | ||||||||||||||
| New servicing assets created | ||||||||||||||
| Change in fair value during the period due to: | ||||||||||||||
| Time decay (1) | ( |
( |
||||||||||||
| Payoffs (2) | ( |
( |
||||||||||||
| Changes in valuation inputs or assumptions (3) | ||||||||||||||
| Fair value, end of period | $ | $ | ||||||||||||
(1)Represents decrease in value due to passage of time, including the impact from both regularly scheduled principal payments and partial loan paydowns.
(2)Represents decrease in value associated with loans that paid off during the period.
(3)Represents change in value resulting primarily from market-driven changes in interest rates.
MSRs do not trade in an active, open market with readily observable prices. Therefore, the fair value of MSRs is estimated using a discounted future cash flow model. Changes in the assumptions used may have a significant impact on the valuation of MSRs. MSR values are sensitive to movement in interest rates as expected future net servicing income depends on the projected outstanding principal balances of the underlying loans, which are impacted by the level of prepayments.
The following table summarizes the key assumptions and the sensitivity of the MSR value to changes in these assumptions.
| At December 31, 2022 | At December 31, 2021 | ||||||||||||||||||||||||||||||||||||||||
| Decline in fair value due to | Decline in fair value due to | ||||||||||||||||||||||||||||||||||||||||
| (dollar amounts in millions) | Actual | 10% adverse change |
20% adverse change |
Actual | 10% adverse change |
20% adverse change |
|||||||||||||||||||||||||||||||||||
Constant prepayment rate (annualized)
|
% | $ | ( |
$ | ( |
% | $ | ( |
$ | ( |
|||||||||||||||||||||||||||||||
| Spread over forward interest rate swap rates | bps | ( |
( |
bps | ( |
( |
|||||||||||||||||||||||||||||||||||
2022 Form 10-K 122
8. GOODWILL AND OTHER INTANGIBLE ASSETS
Business segments are based on segment leadership structure, which reflects how segment performance is monitored and assessed. We have four major business segments: Consumer and Business Banking, Commercial Banking, Vehicle Finance, and Regional Banking and The Huntington Private Client Group (RBHPCG). The Treasury / Other function includes technology and operations, other unallocated assets, liabilities, revenue, and expense.
A rollforward of goodwill by business segment for which goodwill is allocated is presented in the table below. No
| Consumer & | Commercial | Huntington | |||||||||||||||||||||
| (dollar amounts in millions) | Business Banking | Banking | RBHPCG | Consolidated | |||||||||||||||||||
| Balance, January 1, 2020 | $ | $ | $ | $ | |||||||||||||||||||
| TCF acquisition | |||||||||||||||||||||||
| Balance, December 31, 2021 | |||||||||||||||||||||||
| Acquisitions | |||||||||||||||||||||||
| Balance, December 31, 2022 | $ | $ | $ | $ | |||||||||||||||||||
Huntington’s other intangible assets consisted of the following:
| (dollar amounts in millions) | Gross Carrying Amount |
Accumulated Amortization |
Net Carrying Value |
||||||||||||||
| At December 31, 2022 | |||||||||||||||||
| Core deposit intangible | $ | $ | ( |
$ | |||||||||||||
| Customer relationship | ( |
||||||||||||||||
| Total other intangible assets | $ | $ | ( |
$ | |||||||||||||
| At December 31, 2021 | |||||||||||||||||
| Core deposit intangible | $ | $ | ( |
$ | |||||||||||||
| Customer relationship | ( |
||||||||||||||||
| Total other intangible assets | $ | $ | ( |
$ | |||||||||||||
The estimated amortization expense of other intangible assets for the next five years is as follows:
| (dollar amounts in millions) |
Amortization
Expense
|
||||
| 2023 | $ | ||||
| 2024 | |||||
| 2025 | |||||
| 2026 | |||||
| 2027 | |||||
123 Huntington Bancshares Incorporated
9. PREMISES AND EQUIPMENT
Premises and equipment were comprised of the following:
| At December 31, | |||||||||||
| (dollar amounts in millions) | 2022 | 2021 | |||||||||
| Land and land improvements | $ | $ | |||||||||
| Buildings | |||||||||||
| Leasehold improvements | |||||||||||
| Equipment | |||||||||||
| Total premises and equipment | |||||||||||
| Less accumulated depreciation and amortization | ( |
( |
|||||||||
| Net premises and equipment | $ | $ | |||||||||
Depreciation and amortization charged to expense and rental income credited to net occupancy expense were as follows:
| Year Ended December 31, | |||||||||||||||||
| (dollar amounts in millions) | 2022 | 2021 | 2020 | ||||||||||||||
| Total depreciation and amortization of premises and equipment | $ | $ | $ | ||||||||||||||
| Rental income credited to net occupancy expense | |||||||||||||||||
10. OPERATING LEASES
At December 31, 2022, Huntington was obligated under non-cancelable leases for branch and office space. These leases are all classified as operating due to the amount of time such spaces are occupied relative to the underlying assets useful lives. Many of these leases contain renewal options, most of which are not included in measurement of the right-of-use asset as they are not considered reasonably certain of exercise (i.e., Huntington does not currently have a significant economic incentive to exercise these options).
Net lease assets and liabilities are as follows:
| At December 31, | ||||||||||||||||||||
| (dollar amounts in millions) | Classification | 2022 | 2021 | |||||||||||||||||
| Assets | ||||||||||||||||||||
| Operating lease assets | $ | $ | ||||||||||||||||||
| Liabilities | ||||||||||||||||||||
| Lease liabilities | $ | $ | ||||||||||||||||||
Net lease cost are as follows:
| Year Ended December 31, | ||||||||||||||||||||
| (dollar amounts in millions) | Classification | 2022 | 2021 | |||||||||||||||||
| Operating lease cost | Net occupancy | $ | $ | |||||||||||||||||
| Short-term lease cost | Net occupancy | |||||||||||||||||||
| Net lease cost | $ | $ | ||||||||||||||||||
Maturity of lease liabilities at December 31, 2022 are as follows:
| (dollar amounts in millions) | Total | |||||||
| 2023 | $ | |||||||
| 2024 | ||||||||
| 2025 | ||||||||
| 2026 | ||||||||
| 2027 | ||||||||
| Thereafter | ||||||||
| Total lease payments | ||||||||
| Less: Interest | ( |
|||||||
| Total lease liabilities | $ | |||||||
2022 Form 10-K 124
Additional supplemental information related to the Company’s operating leases is as follows:
| Year Ended December 31, | ||||||||||||||
| (dollar amounts in millions) | 2022 | 2021 | ||||||||||||
| Cash paid for amounts included in the measurement of lease liabilities for operating cash flows | $ | ( |
$ | ( |
||||||||||
| Right-of-use assets obtained in exchange for lease obligations for operating leases | ||||||||||||||
| Weighted-average remaining lease term (years) for operating leases | ||||||||||||||
| Weighted-average discount rate for operating leases | % | % | ||||||||||||
11. BORROWINGS
Borrowings with original maturities of one year or less are classified as short-term and were comprised of the following:
| At December 31, | |||||||||||
| (dollar amounts in millions) | 2022 | 2021 | |||||||||
| Federal funds purchased and securities sold under agreements to repurchase | $ | $ | |||||||||
| FHLB advances | |||||||||||
| Other borrowings | |||||||||||
| Total short-term borrowings | $ | $ | |||||||||
125 Huntington Bancshares Incorporated
Huntington’s long-term debt consisted of the following:
| At December 31, | |||||||||||
| (dollar amounts in millions) | 2022 | 2021 | |||||||||
| The Parent Company: | |||||||||||
| Senior Notes: | |||||||||||
| $ | $ | ||||||||||
| Subordinated Notes: | |||||||||||
Huntington Capital I Trust Preferred |
|||||||||||
Huntington Capital II Trust Preferred |
|||||||||||
Sky Financial Capital Trust III |
|||||||||||
Sky Financial Capital Trust IV |
|||||||||||
Total notes issued by the parent |
|||||||||||
The Bank: |
|||||||||||
| Senior Notes: | |||||||||||
| Subordinated Notes: | |||||||||||
Total notes issued by the bank |
|||||||||||
| FHLB Advances: | |||||||||||
| Other: | |||||||||||
Huntington Technology Finance nonrecourse debt, |
|||||||||||
| Total long-term debt | $ | $ | |||||||||
(1)Variable effective rate at December 31, 2022, based on three-month LIBOR +0.70 %.
(2)Variable effective rate at December 31, 2022, based on three-month LIBOR +0.625 %.
(3)Variable effective rate at December 31, 2022, based on three-month LIBOR +1.40 %.
(4)Variable effective rate at December 31, 2022, based on three-month LIBOR +1.88 %.
(5)Variable effective rate at December 31, 2022, based on three-month LIBOR +2.00 %.
(6)Variable effective rate at December 31, 2022, based on three-month SOFR +2.60 %.
(7)Variable effective rate at December 31, 2022 based on three-month SOFR +3.10 %.
(8)Represents the outstanding amount of debentures issued to each trust and related trust-preferred securities. Refer to Note 21 “Variable Interest Entity” for trust-preferred securities details.
2022 Form 10-K 126
Amounts above are net of unamortized discounts and adjustments related to hedging with derivative financial instruments. We use interest rate swaps to hedge interest rate risk of certain fixed-rate debt by converting the debt to a variable rate. See Note 20 - “Derivative Financial Instruments“ for more information regarding such financial instruments.
Long-term debt maturities for the next five years and thereafter are as follows:
| (dollar amounts in millions) | 2023 | 2024 | 2025 | 2026 | 2027 | Thereafter | Total | ||||||||||||||||||||||||||||||||||
| The Parent Company: | |||||||||||||||||||||||||||||||||||||||||
| Senior notes | $ | $ | $ | $ | $ | $ | $ | ||||||||||||||||||||||||||||||||||
| Subordinated notes | |||||||||||||||||||||||||||||||||||||||||
| The Bank: | |||||||||||||||||||||||||||||||||||||||||
| Senior notes | |||||||||||||||||||||||||||||||||||||||||
| Subordinated notes | |||||||||||||||||||||||||||||||||||||||||
| FHLB Advances | |||||||||||||||||||||||||||||||||||||||||
| Other | |||||||||||||||||||||||||||||||||||||||||
| Total | $ | $ | $ | $ | $ | $ | $ | ||||||||||||||||||||||||||||||||||
These maturities are based upon the par values of the long-term debt.
The terms of certain long-term debt obligations contain various restrictive covenants including limitations on the acquisition of additional debt, dividend payments, and the disposition of subsidiaries. As of December 31, 2022, Huntington was in compliance with all such covenants.
127 Huntington Bancshares Incorporated
12. OTHER COMPREHENSIVE INCOME
The components of Huntington’s OCI were as follows:
| (dollar amounts in millions) | Pretax | Tax (expense) benefit | After-tax | ||||||||||||||
| Year Ended December 31, 2022 | |||||||||||||||||
| Unrealized losses on available-for-sale securities arising during the period | $ | ( |
$ | $ | ( |
||||||||||||
| Reclassification adjustment for realized net losses included in net income | ( |
||||||||||||||||
| Total unrealized losses on available-for-sale securities | ( |
( |
|||||||||||||||
| Net impact of hedges on available-for-sale securities | ( |
||||||||||||||||
| Change in fair value of cash flow hedges on loans | ( |
( |
|||||||||||||||
| Foreign currency translation adjustment (1) | ( |
( |
|||||||||||||||
| Net unrealized gains (losses) on net investment hedges | |||||||||||||||||
| Translation adjustments, net of hedges (1) | ( |
( |
|||||||||||||||
| Change in accumulated unrealized gains for pension and other post retirement obligations | ( |
||||||||||||||||
| Other comprehensive loss | $ | ( |
$ | $ | ( |
||||||||||||
| Year Ended December 31, 2021 | |||||||||||||||||
| Unrealized losses on available-for-sale securities arising during the period | $ | ( |
$ | $ | ( |
||||||||||||
| Reclassification adjustment for realized net losses included in net income | ( |
||||||||||||||||
| Total unrealized losses on available-for-sale securities | ( |
( |
|||||||||||||||
| Net impact of hedges on available-for-sale securities | ( |
||||||||||||||||
| Change in fair value of cash flow hedges on loans | ( |
( |
|||||||||||||||
| Foreign currency translation adjustment (1) | ( |
( |
|||||||||||||||
| Net unrealized gains (losses) on net investment hedges | |||||||||||||||||
| Translation adjustments, net of hedges (1) | ( |
( |
|||||||||||||||
| Change in accumulated unrealized gains for pension and other post retirement obligations | ( |
||||||||||||||||
| Other comprehensive income | $ | ( |
$ | $ | ( |
||||||||||||
| Year Ended December 31, 2020 | |||||||||||||||||
| Unrealized losses on available-for-sale securities arising during the period | $ | $ | ( |
$ | |||||||||||||
| Reclassification adjustment for realized net losses included in net income | ( |
||||||||||||||||
| Total unrealized losses on available-for-sale securities | ( |
||||||||||||||||
| Net impact of hedges on available-for-sale securities | ( |
||||||||||||||||
| Change in fair value of cash flow hedges on loans | ( |
||||||||||||||||
| Change in accumulated unrealized gains for pension and other post retirement obligations (2) | ( |
( |
|||||||||||||||
| Other comprehensive income | $ | $ | ( |
$ | |||||||||||||
(1)Foreign investments are deemed to be permanent in nature and, therefore, Huntington does not provide for taxes on foreign currency translation adjustments.
(2)Includes a settlement gain recognized in other noninterest income on the Consolidated Statements of Income.
2022 Form 10-K 128
Activity in accumulated OCI were as follows:
| (dollar amounts in millions) | Unrealized (losses) gains on debt securities (1) |
Net impact of hedges on available-for-sale securities | Change in fair value of cash flow hedges on loans | Translation adjustments, net of hedges | Unrealized (losses) gains for pension and other post-retirement obligations |
Total | |||||||||||||||||||||||||||||
| December 31, 2019 | $ | ( |
$ | $ | $ | $ | ( |
$ | ( |
||||||||||||||||||||||||||
| Other comprehensive income before reclassifications | |||||||||||||||||||||||||||||||||||
| Amounts reclassified from accumulated OCI to earnings | ( |
||||||||||||||||||||||||||||||||||
| Period change | ( |
||||||||||||||||||||||||||||||||||
| December 31, 2020 | ( |
||||||||||||||||||||||||||||||||||
| Other comprehensive income (loss) before reclassifications | ( |
( |
( |
( |
|||||||||||||||||||||||||||||||
| Amounts reclassified from accumulated OCI to earnings | |||||||||||||||||||||||||||||||||||
| Period change | ( |
( |
( |
( |
|||||||||||||||||||||||||||||||
| December 31, 2021 | ( |
( |
( |
( |
|||||||||||||||||||||||||||||||
| Other comprehensive income before reclassifications | ( |
( |
( |
( |
|||||||||||||||||||||||||||||||
| Amounts reclassified from accumulated OCI to earnings | |||||||||||||||||||||||||||||||||||
| Period change | ( |
( |
( |
( |
|||||||||||||||||||||||||||||||
| December 31, 2022 | $ | ( |
$ | $ | ( |
$ | ( |
$ | ( |
$ | ( |
||||||||||||||||||||||||
(1)AOCI amounts at December 31, 2022, 2021, and 2020 include $66 million, $27 million, and $53 million, respectively, of net unrealized losses (after-tax) on securities transferred from the available-for-sale securities portfolio to the held-to-maturity securities portfolio. The net unrealized losses will be recognized in earnings over the remaining life of the security using the effective interest method.
13. SHAREHOLDERS’ EQUITY
The following is a summary of Huntington’s non-cumulative, non-voting, perpetual preferred stock outstanding.
| (dollar amounts in millions) | Carrying Amount | |||||||||||||||||||||||||||||||||||||
| Series | Issuance Date | Shares Outstanding | Dividend Rate | Earliest Optional Redemption Date (1) | December 31, 2022 | December 31, 2021 | ||||||||||||||||||||||||||||||||
| Series B (2) | 12/28/2011 | 3-mo. LIBOR + |
$ | $ | ||||||||||||||||||||||||||||||||||
| Series E (3) | 2/27/2018 | |||||||||||||||||||||||||||||||||||||
| Series F (3) | 5/27/2020 | |||||||||||||||||||||||||||||||||||||
| Series G (3) | 8/3/2020 | |||||||||||||||||||||||||||||||||||||
| Series H (2) | 2/2/2021 | |||||||||||||||||||||||||||||||||||||
| Series I (4) | 6/9/2021 | |||||||||||||||||||||||||||||||||||||
| Total | $ | $ | ||||||||||||||||||||||||||||||||||||
(1)Redeemable at Huntington’s option on the date stated or on a quarterly basis thereafter. Earlier redemption is solely at Huntington’s option, subject to any required prior approval of Federal Reserve.
(2)Series B and H of preferred stock have a liquidation value and redemption price per share of $1,000 , plus any declared and unpaid dividends.
(3)Series E, F, and G, preferred stock have a liquidation value and redemption price per share of $100,000 , plus any declared and unpaid dividends.
129 Huntington Bancshares Incorporated
The following table presents the dividends declared for each series of Preferred shares.
| Year Ended December 31, | ||||||||||||||||||||||||||||||||||||||
| 2022 | 2021 | 2020 | ||||||||||||||||||||||||||||||||||||
| (amounts in millions, except per share data) | Cash Dividend Declared Per Share | Cash Dividend Declared Per Share | Cash Dividend Declared Per Share | |||||||||||||||||||||||||||||||||||
| Preferred Series | Amount ($) | Amount ($) | Amount ($) | |||||||||||||||||||||||||||||||||||
| Series B | $ | $ | ( |
$ | $ | ( |
$ | $ | ( |
|||||||||||||||||||||||||||||
| Series C | ( |
( |
||||||||||||||||||||||||||||||||||||
| Series D | ( |
( |
||||||||||||||||||||||||||||||||||||
| Series E | ( |
( |
( |
|||||||||||||||||||||||||||||||||||
| Series F | ( |
( |
( |
|||||||||||||||||||||||||||||||||||
| Series G | ( |
( |
( |
|||||||||||||||||||||||||||||||||||
| Series H | ( |
( |
||||||||||||||||||||||||||||||||||||
| Series I | ( |
( |
||||||||||||||||||||||||||||||||||||
| Total | $ | ( |
$ | ( |
$ | ( |
||||||||||||||||||||||||||||||||
On July 15, 2021, all $600 million of outstanding 6.250 % Series D Non-Cumulative Perpetual Preferred Stock, par value $0.01 per share, were redeemed.
On October 15, 2021, all $100 million of outstanding 5.875 % Series C Non-Cumulative Perpetual Preferred Stock, par value $0.01 per share, were redeemed.
Treasury shares
Treasury shares includes shares held for deferred compensation plans, at cost, of $80 million at December 31, 2022 and $79 million at December 31, 2021.
Non-controlling Interest in Subsidiaries
Through the acquisition of TCF, Huntington acquired a joint venture in which Huntington maintains a 55 % ownership interest. As Huntington has a controlling financial interest, its financial results are consolidated in Huntington's financial statements and the other party’s 45 % ownership interest is reported as a non-controlling interest within equity.
14. EARNINGS PER SHARE
2022 Form 10-K 130
The calculation of basic and diluted earnings per share is as follows:
| Year Ended December 31, | |||||||||||||||||
| (dollar amounts in millions, except per share data, share count in thousands) | 2022 | 2021 | 2020 | ||||||||||||||
| Basic earnings per common share: | |||||||||||||||||
| Net income attributable to Huntington Bancshares Inc | $ | $ | $ | ||||||||||||||
| Dividends on preferred shares | |||||||||||||||||
| Impact of preferred stock redemption | |||||||||||||||||
| Net income available to common shares | $ | $ | $ | ||||||||||||||
| Average common shares issued and outstanding | |||||||||||||||||
| Basic earnings per common share | $ | $ | $ | ||||||||||||||
| Diluted earnings per common share: | |||||||||||||||||
| Dilutive potential common shares | |||||||||||||||||
| Stock options and restricted stock units and awards | |||||||||||||||||
| Shares held in deferred compensation plans | |||||||||||||||||
| Dilutive potential common shares | |||||||||||||||||
| Total diluted average common shares issued and outstanding | |||||||||||||||||
| Diluted earnings per common share | $ | $ | $ | ||||||||||||||
| Anti-dilutive awards (1) | |||||||||||||||||
(1)Reflects the total number of shares related to outstanding options that have been excluded from the computation of diluted earnings per share because the impact would have been anti-dilutive.
15. NONINTEREST INCOME
Huntington earns a variety of revenue including interest and fees from customers as well as revenues from non-customers. Certain sources of revenue are recognized within interest or fee income and are outside of the scope of ASC Topic 606, Revenue from Contracts with Customers (“ASC 606”). Other sources of revenue fall within the scope of ASC 606 and are generally recognized within noninterest income. These revenues are included within various sections of the Consolidated Financial Statements. Refer to Note 1, “Significant Accounting Policies” for details of these revenues. The following table shows Huntington’s total noninterest income segregated between contracts with customers within the scope of ASC 606 and those within the scope of other GAAP Topics.
| Year Ended December 31, | ||||||||||||||||||||
| (dollar amounts in millions) | 2022 | 2021 | 2020 | |||||||||||||||||
| Noninterest income | ||||||||||||||||||||
| Noninterest income from contracts with customers | $ | $ | $ | |||||||||||||||||
| Noninterest income within the scope of other GAAP topics | ||||||||||||||||||||
| Total noninterest income | $ | $ | $ | |||||||||||||||||
The following table illustrates the disaggregation by operating segment and major revenue stream and reconciles disaggregated revenue to segment revenue presented in Note 25 - “Segment Reporting”:
131 Huntington Bancshares Incorporated
| Year Ended December 31, 2022 | |||||||||||||||||||||||||||||||||||
| (dollar amounts in millions) | Commercial Banking | Consumer & Business Banking | Vehicle Finance | RBHPCG | Treasury / Other | Huntington Consolidated | |||||||||||||||||||||||||||||
| Major Revenue Streams | |||||||||||||||||||||||||||||||||||
| Service charges on deposit accounts | $ | $ | $ | $ | $ | $ | |||||||||||||||||||||||||||||
| Card and payment processing income | |||||||||||||||||||||||||||||||||||
| Capital markets fees | ( |
||||||||||||||||||||||||||||||||||
| Trust and investment management services | |||||||||||||||||||||||||||||||||||
| Insurance income | ( |
||||||||||||||||||||||||||||||||||
| Other noninterest income | ( |
||||||||||||||||||||||||||||||||||
| Net revenue from contracts with customers | $ | $ | $ | $ | $ | ( |
$ | ||||||||||||||||||||||||||||
|
Noninterest income
within the scope of other GAAP topics
|
|||||||||||||||||||||||||||||||||||
| Total noninterest income | $ | $ | $ | $ | $ | $ | |||||||||||||||||||||||||||||
| Year Ended December 31, 2021 | |||||||||||||||||||||||||||||||||||
| (dollar amounts in millions) | Commercial Banking | Consumer & Business Banking | Vehicle Finance | RBHPCG | Treasury / Other | Huntington Consolidated | |||||||||||||||||||||||||||||
| Major Revenue Streams | |||||||||||||||||||||||||||||||||||
| Service charges on deposit accounts | $ | $ | $ | $ | $ | $ | |||||||||||||||||||||||||||||
| Card and payment processing income | |||||||||||||||||||||||||||||||||||
| Capital markets fees | |||||||||||||||||||||||||||||||||||
| Trust and investment management services | |||||||||||||||||||||||||||||||||||
| Insurance Income | |||||||||||||||||||||||||||||||||||
| Other noninterest income | |||||||||||||||||||||||||||||||||||
| Net revenue from contracts with customers | $ | $ | $ | $ | $ | $ | |||||||||||||||||||||||||||||
|
Noninterest income
within the scope of other GAAP topics
|
|||||||||||||||||||||||||||||||||||
| Total noninterest income | $ | $ | $ | $ | $ | $ | |||||||||||||||||||||||||||||
| Year Ended December 31, 2020 | |||||||||||||||||||||||||||||||||||
| (dollar amounts in millions) | Commercial Banking | Consumer & Business Banking | Vehicle Finance | RBHPCG | Treasury / Other | Huntington Consolidated | |||||||||||||||||||||||||||||
| Major Revenue Streams | |||||||||||||||||||||||||||||||||||
| Service charges on deposit accounts | $ | $ | $ | $ | $ | $ | |||||||||||||||||||||||||||||
| Card and payment processing income | |||||||||||||||||||||||||||||||||||
| Capital markets fees | |||||||||||||||||||||||||||||||||||
| Trust and investment management services | |||||||||||||||||||||||||||||||||||
| Insurance Income | |||||||||||||||||||||||||||||||||||
| Other noninterest income | |||||||||||||||||||||||||||||||||||
| Net revenue from contracts with customers | $ | $ | $ | $ | $ | $ | |||||||||||||||||||||||||||||
|
Noninterest income
within the scope of other GAAP topics
|
|||||||||||||||||||||||||||||||||||
| Total noninterest income | $ | $ | $ | $ | $ | $ | |||||||||||||||||||||||||||||
Huntington generally provides services for customers in which it acts as principal. Payment terms and conditions vary amongst services and customers, and thus impact the timing and amount of revenue recognition. Some fees may be paid before any service is rendered and accordingly, such fees are deferred until the obligations pertaining to those fees are satisfied. Most Huntington contracts with customers are cancelable by either party without penalty or they are short-term in nature, with a contract duration of less than one year. Accordingly, most revenue deferred for the reporting period ended December 31, 2022 is expected to be earned within one year. Huntington does not have significant balances of contract assets or contract liabilities and any change in those balances during the reporting period ended December 31, 2022 was determined to be immaterial.
2022 Form 10-K 132
16. SHARE-BASED COMPENSATION
Share-based awards are eligible for issuance under the Huntington Bancshares Incorporated 2018 Long Term Incentive Plan. This plan provides for the granting of stock options, restricted stock awards, restricted stock units, performance share units and other awards to officers, directors, and other employees. In connection with the TCF acquisition in 2021, equity awards granted under the TCF equity plans were assumed subject to the same terms and conditions applicable to such awards prior to the date of acquisition. At December 31, 2022, 21 million shares were available for future grants.
Huntington issues shares to fulfill share-based award vesting from available authorized common shares. At December 31, 2022, Huntington believes there are adequate authorized common shares to satisfy anticipated share-based award vesting in 2023.
The following table presents total share-based compensation expense and related tax benefit.
Year Ended December 31, |
|||||||||||||||||
| (dollar amounts in millions) | 2022 | 2021 | 2020 | ||||||||||||||
| Share-based compensation expense (1) | $ | $ | $ | ||||||||||||||
| Tax benefit | |||||||||||||||||
(1)Compensation costs are included in personnel costs on the Consolidated Statements of Income.
Stock Options
Stock options, awarded by Huntington, are granted at the closing market price on the date of the grant and vest ratably over four years or when other conditions are met. Options assumed in the TCF acquisition vest ratably over a five-year period. Stock options, which represented a portion of the grant values, have no intrinsic value until the stock price increases. All options have a contractual term of ten years from the date of grant.
Huntington’s stock option activity and related information was as follows:
| (dollar amounts in millions, except per share and options amounts in thousands) | Options | Weighted- Average Exercise Price |
Weighted-Average
Remaining Contractual Life (Years)
|
Aggregate Intrinsic Value |
|||||||||||||||||||
| Outstanding at January 1, 2022 | $ | ||||||||||||||||||||||
| Granted | |||||||||||||||||||||||
| Exercised | ( |
||||||||||||||||||||||
| Forfeited/expired | ( |
||||||||||||||||||||||
| Outstanding at December 31, 2022 | $ | $ | |||||||||||||||||||||
| Expected to vest (1) | $ | $ | |||||||||||||||||||||
| Exercisable at December 31, 2022 | $ | $ | |||||||||||||||||||||
(1)The number of options expected to vest reflect an estimate of 46,000 shares expected to be forfeited.
Restricted Stock Awards, Restricted Stock Units and Performance Share Units
Restricted stock units and performance share units awarded by Huntington are granted at the closing market price on the date of the grant. Restricted stock units and awards can be settled in shares or cash depending on the award. Restricted stock units, for the most part, provide either accumulated cash dividends during the vesting period or, accrue a dividend equivalent that is paid upon vesting. Both restricted stock awards and restricted stock units are subject to certain service restrictions. Performance share units are payable contingent upon Huntington achieving certain predefined performance objectives over a three-year measurement period. The fair value of these awards and units reflects the closing market price of Huntington’s common stock on the grant or assumption date.
133 Huntington Bancshares Incorporated
The following table summarizes the status of Huntington’s restricted stock awards, restricted stock units, and performance share units as of December 31, 2022, and activity for the year ended December 31, 2022:
| Restricted Stock Awards | Restricted Stock Units | Performance Share Units | |||||||||||||||||||||||||||||||||
| (amounts in thousands, except per share amounts) | Quantity |
Weighted-
Average
Grant Date
Fair Value
Per Share
|
Quantity |
Weighted-
Average
Grant Date
Fair Value
Per Share
|
Quantity |
Weighted-
Average
Grant Date
Fair Value
Per Share
|
|||||||||||||||||||||||||||||
| Nonvested at January 1, 2022 | $ | $ | $ | ||||||||||||||||||||||||||||||||
| Granted | |||||||||||||||||||||||||||||||||||
| Vested | ( |
( |
( |
||||||||||||||||||||||||||||||||
| Forfeited | ( |
( |
( |
||||||||||||||||||||||||||||||||
| Nonvested at December 31, 2022 | $ | $ | $ | ||||||||||||||||||||||||||||||||
The weighted-average fair value at grant date of nonvested shares granted for the years ended December 31, 2022, 2021, and 2020 were $13.47 , $15.78 , and $8.90 , respectively. The total fair value of awards vested during the years ended December 31, 2022, 2021, and 2020 was $105 million, $135 million, and $86 million, respectively. As of December 31, 2022, the total unrecognized compensation cost related to nonvested shares was $151 million with a weighted-average expense recognition period of 2.7 years.
17. BENEFIT PLANS
Huntington sponsors a non-contributory defined benefit pension plan covering substantially all employees hired or rehired prior to January 1, 2010. The Plan, which was modified in 2013, no longer accrues service benefits to participants and provides benefits based upon length of service and compensation levels. Huntington’s funding policy is to contribute an annual amount that is at least equal to the minimum funding requirements but not more than the amount deductible under the Internal Revenue Code. There were no required minimum contributions during 2022.
The following table shows the weighted-average assumptions used to determine the benefit obligation and the net periodic benefit cost:
| At December 31, | |||||||||||
| 2022 | 2021 | ||||||||||
Weighted-average assumptions used to determine benefit obligations |
|||||||||||
Discount rate |
% | % | |||||||||
Weighted-average assumptions used to determine net periodic benefit cost |
|||||||||||
Discount rate |
|||||||||||
Expected return on plan assets |
|||||||||||
The following table reconciles the beginning and ending balances of the benefit obligation of the Plan with the amounts recognized in the consolidated balance sheets:
| At December 31, | |||||||||||
| (dollar amounts in millions) | 2022 | 2021 | |||||||||
| Projected benefit obligation at beginning of measurement year | $ | $ | |||||||||
| Changes due to: | |||||||||||
| Service cost | |||||||||||
| Interest cost | |||||||||||
| Benefits paid | ( |
( |
|||||||||
| Settlements | ( |
( |
|||||||||
| Actuarial gains | ( |
( |
|||||||||
| Total changes | ( |
( |
|||||||||
| Projected benefit obligation at end of measurement year | $ | $ | |||||||||
2022 Form 10-K 134
The following table reconciles the beginning and ending balances of the fair value of Plan assets:
| At December 31, | |||||||||||
| (dollar amounts in millions) | 2022 | 2021 | |||||||||
| Fair value of plan assets at beginning of measurement year | $ | $ | |||||||||
| Changes due to: | |||||||||||
| Actual return on plan assets | ( |
||||||||||
| Settlements | ( |
( |
|||||||||
| Benefits paid | ( |
( |
|||||||||
| Total changes | ( |
( |
|||||||||
| Fair value of plan assets at end of measurement year | $ | $ | |||||||||
As of December 31, 2022, the difference between the accumulated benefit obligation and the fair value of Plan assets was $48 million and is recorded in other assets.
The following table shows the components of net periodic benefit costs recognized:
Year Ended December 31, (1) |
|||||||||||||||||
| (dollar amounts in millions) | 2022 | 2021 | 2020 | ||||||||||||||
| Service cost | $ | $ | $ | ||||||||||||||
| Interest cost | |||||||||||||||||
| Expected return on plan assets | ( |
( |
( |
||||||||||||||
| Amortization of loss | |||||||||||||||||
| Settlements | |||||||||||||||||
| Benefit costs | $ | $ | $ | ||||||||||||||
(1) The pension costs are recognized in other noninterest income in the Consolidated Statements of Income.
At December 31, 2022 and 2021, The Huntington National Bank, as trustee, held all Plan assets. The Plan assets consisted of investments in a variety of cash equivalent, corporate and government fixed income, and equity investments as follows:
Fair Value at December 31, |
|||||||||||||||||||||||
| (dollar amounts in millions) | 2022 | 2021 | |||||||||||||||||||||
| Cash equivalents: | |||||||||||||||||||||||
| Mutual funds-money market | $ | % | $ | % | |||||||||||||||||||
| Fixed income: | |||||||||||||||||||||||
| Corporate obligations | |||||||||||||||||||||||
| U.S. Government obligations | |||||||||||||||||||||||
| Municipal obligations | |||||||||||||||||||||||
| Collective trust funds | |||||||||||||||||||||||
| Equities: | |||||||||||||||||||||||
| Common stock | |||||||||||||||||||||||
| Limited liability companies | |||||||||||||||||||||||
| Collective trust funds | |||||||||||||||||||||||
| Limited partnerships | |||||||||||||||||||||||
| Fair value of plan assets | $ | % | $ | % | |||||||||||||||||||
135 Huntington Bancshares Incorporated
Investments of the Plan are accounted for at cost on the trade date and are reported at fair value. The valuation methodologies used to measure the fair value of pension plan assets vary depending on the type of asset. At December 31, 2022, mutual money market funds are valued at the closing price reported from an actively traded exchange and are classified as Level 1. Fixed income investments are valued using unadjusted quoted prices from active markets for similar assets are classified as Level 2. Common stock is valued using the year-end closing price as determined by a national securities exchange and are classified as Level 1. Collective trust funds and limited liability companies are valued at net asset value per unit as a practical expedient, which is calculated based on the fair values of the underlying investments held by the fund less its liabilities as reported by the issuer of the fund. The investment in the limited partnerships is reported at net asset value per share as determined by the general partners of each limited partnership, based on their proportionate share of the partnership’s fair value as recorded in the partnership’s audited financial statements.
The investment objective of the Plan is to maximize the return on Plan assets over a long-time period, while meeting the Plan obligations. At December 31, 2022, Plan assets were invested 3 % in cash equivalents, 11 % in equity investments, and 86 % in fixed income investments, with an average duration of 10.9 years on investments. The estimated life of benefit obligations was 10.3 years. Although it may fluctuate with market conditions, Huntington has targeted a long-term allocation of Plan assets of 10 % in equity investments and 90 % in bond investments. The allocation of Plan assets between equity investments and fixed income investments will change from time to time.
At December 31, 2022, the following table shows when benefit payments are expected to be paid:
| (dollar amounts in millions) | Pension Benefits | ||||
| 2023 | $ | ||||
| 2024 | |||||
| 2025 | |||||
| 2026 | |||||
| 2027 | |||||
| 2027 through 2030 | |||||
Huntington has a defined contribution plan that is available to eligible employees. Huntington’s expense related to the defined contribution plans for the years ended December 31, 2022, 2021, and 2020 was $58 million, $70 million, and $47 million, respectively.
The following table shows the number of shares, market value, and dividends received on shares of Huntington stock held by the defined contribution plan:
| At December 31, | |||||||||||
| (dollar amounts in millions, share amounts in thousands) | 2022 | 2021 | |||||||||
Shares in Huntington common stock |
|||||||||||
Market value of Huntington common stock |
$ | $ | |||||||||
Dividends received on shares of Huntington stock |
|||||||||||
18. INCOME TAXES
The following is a summary of the provision for income taxes:
| Year Ended December 31, | |||||||||||||||||
| (dollar amounts in millions) | 2022 | 2021 | 2020 | ||||||||||||||
| Current tax provision (benefit) | |||||||||||||||||
| Federal | $ | $ | $ | ||||||||||||||
| State | |||||||||||||||||
| Foreign | |||||||||||||||||
| Total current tax provision | |||||||||||||||||
| Deferred tax provision (benefit) | |||||||||||||||||
| Federal | ( |
( |
|||||||||||||||
| State | |||||||||||||||||
| Total deferred tax provision (benefit) | ( |
( |
|||||||||||||||
| Provision for income taxes | $ | $ | $ | ||||||||||||||
2022 Form 10-K 136
The following is a reconciliation for provision for income taxes:
Year Ended December 31, |
|||||||||||||||||
| (dollar amounts in millions) | 2022 | 2021 | 2020 | ||||||||||||||
| Provision for income taxes computed at the statutory rate | $ | $ | $ | ||||||||||||||
| Increases (decreases): | |||||||||||||||||
| General business credits | ( |
( |
( |
||||||||||||||
| Capital loss | ( |
( |
( |
||||||||||||||
| Tax-exempt income | ( |
( |
( |
||||||||||||||
| Tax-exempt bank owned life insurance income | ( |
( |
( |
||||||||||||||
| Affordable housing investment amortization, net of tax benefits | |||||||||||||||||
| State income taxes, net | |||||||||||||||||
| Other | |||||||||||||||||
| Provision for income taxes | $ | $ | $ | ||||||||||||||
The significant components of deferred tax assets and liabilities were as follows:
| At December 31, | |||||||||||
| (dollar amounts in millions) | 2022 | 2021 | |||||||||
| Deferred tax assets: | |||||||||||
| Fair value adjustments | $ | $ | |||||||||
| Allowances for credit losses | |||||||||||
| Purchase accounting and other intangibles | |||||||||||
| Net operating and other loss carryforward | |||||||||||
| Lease liability | |||||||||||
| Pension and other employee benefits | |||||||||||
| Tax credit carryforward | |||||||||||
| Other assets | |||||||||||
| Total deferred tax assets | |||||||||||
| Deferred tax liabilities: | |||||||||||
| Lease financing | |||||||||||
| Operating assets | |||||||||||
| Mortgage servicing rights | |||||||||||
| Loan origination costs | |||||||||||
| Right-of-use asset | |||||||||||
| Securities adjustments | |||||||||||
| Other liabilities | |||||||||||
| Total deferred tax liabilities | |||||||||||
| Net deferred tax asset (liability) before valuation allowance | |||||||||||
| Valuation allowance | ( |
( |
|||||||||
| Net deferred tax asset | $ | $ | |||||||||
At December 31, 2022, Huntington’s net deferred tax asset related to loss and other carryforwards was $195 million. This was comprised of federal net operating loss carryforwards of $60 million, which will begin expiring in 2025, state net operating loss carryforwards of $48 million, which will begin expiring in 2023, a federal capital loss carryforward of $22 million, which will expire in 2025, state capital loss carryforwards of $6 million, which will begin expiring in 2023, and general business credits of $59 million, which will expire in 2042.
The Company has established a valuation allowance on its state deferred tax assets as it believes it is more likely than not, portions will not be realized.
The Company and its subsidiaries file income tax returns in the U.S. federal jurisdiction and various state, city, and foreign jurisdictions. Federal income tax audits have been completed for tax years through 2009. The 2010-2017
tax years remain open as Huntington is currently appealing certain IRS positions related to these years. The 2018-
2021 tax years remain open under the standard statute of limitations. Also, with few exceptions, the Company is no longer subject to state, city, or foreign income tax examinations for tax years before 2018.
137 Huntington Bancshares Incorporated
The following table provides a reconciliation of the beginning and ending amounts of gross unrecognized tax benefits:
| Year Ended December 31, | |||||||||||
| (dollar amounts in millions) | 2022 | 2021 | |||||||||
| Unrecognized tax benefits at beginning of year | $ | $ | |||||||||
| Gross increases for tax positions taken during prior years | |||||||||||
| Unrecognized tax benefits at end of year | $ | $ | |||||||||
Due to the complexities of some of these uncertainties, the ultimate resolution may result in a liability that is materially different from the current estimate of the tax liabilities. Certain proposed adjustments resulting from the IRS examination of our 2010 through 2011 tax returns have received approval by the Joint Committee on Taxation of the U.S. Congress. The Company is currently working with the IRS to finalize settlement calculations and anticipate all unrecognized tax benefits associated with the exam will be settled within the next twelve months.
Any interest and penalties on income tax assessments or income tax refunds are recognized in the Consolidated Statements of Income as a component of provision for income taxes. The amounts of accrued tax-related interest and penalties were immaterial at December 31, 2022 and 2021. Further, the amount of net interest and penalties related to unrecognized tax benefits was immaterial for all periods presented. All of the gross unrecognized tax benefits would impact the Company’s effective tax rate if recognized.
At December 31, 2022, retained earnings included approximately $182 million of base year reserves of acquired thrift institutions, for which no deferred federal income tax liability has been recognized. Under current law, if these bad debt reserves are used for purposes other than to absorb bad debt losses, they will be subject to federal income tax at the corporate rate enacted at the time. The amount of unrecognized deferred tax liability relating to the cumulative bad debt deduction was approximately $38 million at December 31, 2022.
19. FAIR VALUES OF ASSETS AND LIABILITIES
Following is a description of the valuation methodologies used for instruments measured at fair value, as well as the general classification of such instruments pursuant to the valuation hierarchy. Assets and liabilities measured at fair value rarely transfer between Level 1 and Level 2 measurements. There were no such transfers during the years ended December 31, 2022 and 2021.
Loans held for sale
Huntington has elected to apply the fair value option for mortgage loans originated with the intent to sell which are included in loans held for sale. Mortgage loans held for sale are classified as Level 2 and are estimated using security prices for similar product types.
Loans held for investment
Certain mortgage loans originated with the intent to sell for which the FVO was elected have been reclassified to mortgage loans held for investment. These loans continue to be measured at fair value. The fair value is determined using fair value of similar mortgage-backed securities adjusted for loan specific variables.
2022 Form 10-K 138
Available-for-sale and trading account securities
Securities accounted for at fair value include both the available-for-sale and trading account portfolios. Huntington determines the fair value of securities utilizing quoted market prices obtained for identical or similar assets, third-party pricing services, third-party valuation specialists and other observable inputs such as recent trade observations. AFS and trading securities classified as Level 1 use quoted market prices (unadjusted) in active markets for identical securities at the measurement date. Level 1 positions in these portfolios consist of U.S. Treasury securities. When quoted market prices are not available, fair values are classified as Level 2 using quoted prices for similar assets in active markets, quoted prices of identical or similar assets in markets that are not active, and inputs that are observable for the asset, either directly or indirectly, for substantially the full term of the financial instrument. Level 2 positions in these portfolios consist of U.S. Government and agency debt securities, agency mortgage backed securities, private-label asset-backed securities, certain municipal securities, and other securities. For Level 2 securities Huntington primarily uses prices obtained from third-party pricing services to determine the fair value of securities. Huntington independently evaluates and corroborates the fair value received from pricing services through various methods and techniques, including references to dealer or other market quotes, by reviewing valuations of comparable instruments, and by comparing the prices realized on the sale of similar securities. If relevant market prices are limited or unavailable, valuations may require significant management judgment or estimation to determine fair value, in which case the fair values are classified as Level 3. The Level 3 positions predominantly consist of direct purchase municipal securities. A significant change in the unobservable inputs for these securities may result in a significant change in the ending fair value measurement of these securities.
The direct purchase municipal securities are classified as Level 3 and require estimates to determine fair value which results in greater subjectivity. The fair value is determined by utilizing a discounted cash flow valuation technique employed by a third-party valuation specialist. The third-party specialist uses assumptions related to yield, prepayment speed, conditional default rates and loss severity based on certain factors such as, credit worthiness of the counterparty, prevailing market rates, and analysis of similar securities. Huntington evaluates the fair values provided by the third-party specialist for reasonableness.
Derivative assets and liabilities
Derivatives classified as Level 2 consists of interest rate contracts, which are valued using a discounted cash flow method that incorporates current market interest rates. In addition, Level 2 includes foreign exchange and commodity contracts, which are valued using exchange traded swaps, exchange traded options, and futures market data. Level 2 also includes exchange traded options and forward commitments to deliver mortgage-backed securities, which are valued using quoted prices.
Derivatives classified as Level 3 consist of interest rate lock agreements related to mortgage loan commitments and the Visa® share swap.
139 Huntington Bancshares Incorporated
MSRs
MSRs are accounted for using the fair value method and are classified as Level 3. Refer to Note 7, “Mortgage Loan Sales and Servicing Rights” for information on valuation methodology.
Assets and Liabilities measured at fair value on a recurring basis
| Fair Value Measurements at Reporting Date Using | Netting Adjustments (1) | At December 31, 2022 | |||||||||||||||||||||||||||
| (dollar amounts in millions) | Level 1 | Level 2 | Level 3 | ||||||||||||||||||||||||||
| Assets | |||||||||||||||||||||||||||||
| Trading account securities: | |||||||||||||||||||||||||||||
| Municipal securities | $ | $ | $ | $ | — | $ | |||||||||||||||||||||||
| Available-for-sale securities: | |||||||||||||||||||||||||||||
| U.S. Treasury securities | — | ||||||||||||||||||||||||||||
| Residential CMO | — | ||||||||||||||||||||||||||||
| Residential MBS | — | ||||||||||||||||||||||||||||
| Commercial MBS | — | ||||||||||||||||||||||||||||
| Other agencies | — | ||||||||||||||||||||||||||||
| Municipal securities | — | ||||||||||||||||||||||||||||
| Private-label CMO | — | ||||||||||||||||||||||||||||
| Asset-backed securities | — | ||||||||||||||||||||||||||||
| Corporate debt | — | ||||||||||||||||||||||||||||
| Other securities/sovereign debt | — | ||||||||||||||||||||||||||||
| Total available-for-sale securities | — | ||||||||||||||||||||||||||||
| Other securities | — | ||||||||||||||||||||||||||||
| Loans held for sale | — | ||||||||||||||||||||||||||||
| Loans held for investment | — | ||||||||||||||||||||||||||||
| MSRs | — | ||||||||||||||||||||||||||||
| Other assets: | |||||||||||||||||||||||||||||
| Derivative assets | ( |
||||||||||||||||||||||||||||
| Assets held in trust for deferred compensation plans | — | ||||||||||||||||||||||||||||
| Liabilities | |||||||||||||||||||||||||||||
| Derivative liabilities | ( |
||||||||||||||||||||||||||||
2022 Form 10-K 140
| Fair Value Measurements at Reporting Date Using | Netting Adjustments (1) | At December 31, 2021 | |||||||||||||||||||||||||||
| (dollar amounts in millions) | Level 1 | Level 2 | Level 3 | ||||||||||||||||||||||||||
| Assets | |||||||||||||||||||||||||||||
| Trading account securities: | |||||||||||||||||||||||||||||
| Municipal securities | $ | $ | $ | $ | — | $ | |||||||||||||||||||||||
| Available-for-sale securities: | |||||||||||||||||||||||||||||
| U.S. Treasury securities | — | ||||||||||||||||||||||||||||
| Residential CMOs | — | ||||||||||||||||||||||||||||
| Residential MBS | — | ||||||||||||||||||||||||||||
| Commercial MBS | — | ||||||||||||||||||||||||||||
| Other agencies | — | ||||||||||||||||||||||||||||
| Municipal securities | — | ||||||||||||||||||||||||||||
| Private-label CMO | — | ||||||||||||||||||||||||||||
| Asset-backed securities | — | ||||||||||||||||||||||||||||
| Corporate debt | — | ||||||||||||||||||||||||||||
| Other securities/sovereign debt | — | ||||||||||||||||||||||||||||
| Total available-for-sale securities | — | ||||||||||||||||||||||||||||
| Other securities | — | ||||||||||||||||||||||||||||
| Loans held for sale | — | ||||||||||||||||||||||||||||
| Loans held for investment | — | ||||||||||||||||||||||||||||
| MSRs | — | ||||||||||||||||||||||||||||
| Other assets: | |||||||||||||||||||||||||||||
| Derivative assets | ( |
||||||||||||||||||||||||||||
| Assets held in trust for deferred compensation plans | — | ||||||||||||||||||||||||||||
| Liabilities | |||||||||||||||||||||||||||||
| Derivative liabilities | ( |
||||||||||||||||||||||||||||
(1)Amounts represent the impact of legally enforceable master netting agreements that allow the Company to settle positive and negative positions and cash collateral held or placed with the same counterparties.
141 Huntington Bancshares Incorporated
The following tables present a rollforward of the balance sheet amounts measured at fair value on a recurring basis and classified as Level 3. The classification of an item as Level 3 is based on the significance of the unobservable inputs to the overall fair value measurement. However, Level 3 measurements may also include observable components of value that can be validated externally. Accordingly, the gains and losses in the table below include changes in fair value due in part to observable factors that are part of the valuation methodology.
| Level 3 Fair Value Measurements | |||||||||||||||||||||||||||||||||||
| Available-for-sale securities | Loans held for investment | ||||||||||||||||||||||||||||||||||
| (dollar amounts in millions) | MSRs | Derivative instruments |
Municipal securities |
Private- label CMO |
Asset- backed securities |
||||||||||||||||||||||||||||||
| Year Ended December 31, 2022 | |||||||||||||||||||||||||||||||||||
| Opening balance | $ | $ | $ | $ | $ | $ | |||||||||||||||||||||||||||||
| Transfers out of Level 3 (1) | ( |
||||||||||||||||||||||||||||||||||
| Total gains/losses for the period: | |||||||||||||||||||||||||||||||||||
| Included in earnings: | |||||||||||||||||||||||||||||||||||
| ( |
|||||||||||||||||||||||||||||||||||
| ( |
( |
||||||||||||||||||||||||||||||||||
| ( |
|||||||||||||||||||||||||||||||||||
| Included in OCI | ( |
( |
|||||||||||||||||||||||||||||||||
| Purchases/originations | |||||||||||||||||||||||||||||||||||
| Repayments | ( |
||||||||||||||||||||||||||||||||||
| Settlements | ( |
( |
( |
( |
|||||||||||||||||||||||||||||||
| Closing balance | $ | $ | ( |
$ | $ | $ | $ | ||||||||||||||||||||||||||||
| $ | $ | ( |
$ | — | $ | — | $ | — | $ | ||||||||||||||||||||||||||
| Change in unrealized gains or losses for the period included in other comprehensive income for assets held at the end of the reporting period | — | — | ( |
( |
— | ||||||||||||||||||||||||||||||
| Level 3 Fair Value Measurements | |||||||||||||||||||||||||||||||||||
| Available-for-sale securities | Loans held for investment | ||||||||||||||||||||||||||||||||||
| (dollar amounts in millions) | MSRs |
Derivative
instruments
|
Municipal
securities
|
Private- label CMO |
Asset-
backed
securities
|
||||||||||||||||||||||||||||||
| Year Ended December 31, 2021 | |||||||||||||||||||||||||||||||||||
| Opening balance | $ | $ | $ | $ | $ | $ | |||||||||||||||||||||||||||||
| Transfers out of Level 3 (1) | ( |
||||||||||||||||||||||||||||||||||
| Total gains/losses for the period: | |||||||||||||||||||||||||||||||||||
| Included in earnings: | |||||||||||||||||||||||||||||||||||
| ( |
( |
||||||||||||||||||||||||||||||||||
| Included in OCI | ( |
||||||||||||||||||||||||||||||||||
| Purchases/originations/acquisitions | |||||||||||||||||||||||||||||||||||
| Sales | ( |
— | |||||||||||||||||||||||||||||||||
| Repayments | ( |
||||||||||||||||||||||||||||||||||
| Settlements | ( |
( |
( |
||||||||||||||||||||||||||||||||
| Closing balance | $ | $ | $ | $ | $ | $ | |||||||||||||||||||||||||||||
| $ | $ | ( |
$ | — | $ | — | $ | — | $ | ||||||||||||||||||||||||||
| Change in unrealized gains or losses for the period included in other comprehensive income for assets held at the end of the reporting period | — | — | ( |
— | |||||||||||||||||||||||||||||||
2022 Form 10-K 142
| Level 3 Fair Value Measurements | |||||||||||||||||||||||||||||||||||
| Available-for-sale securities | Loans held for investment | ||||||||||||||||||||||||||||||||||
| (dollar amounts in millions) | MSRs |
Derivative
instruments
|
Municipal
securities
|
Private
label CMO
|
Asset-
backed
securities
|
||||||||||||||||||||||||||||||
| Year Ended December 31, 2020 | |||||||||||||||||||||||||||||||||||
| Opening balance | $ | $ | $ | $ | $ | $ | |||||||||||||||||||||||||||||
| Fair value election for servicing assets previously measured using the amortized method | — | — | — | — | — | ||||||||||||||||||||||||||||||
| Transfers out of Level 3 (1) | ( |
||||||||||||||||||||||||||||||||||
| Total gains/losses for the period: | |||||||||||||||||||||||||||||||||||
| Included in earnings: | |||||||||||||||||||||||||||||||||||
| ( |
|||||||||||||||||||||||||||||||||||
| ( |
|||||||||||||||||||||||||||||||||||
| Included in OCI | |||||||||||||||||||||||||||||||||||
| Purchases/originations | |||||||||||||||||||||||||||||||||||
| Repayments | ( |
||||||||||||||||||||||||||||||||||
| Settlements | ( |
( |
|||||||||||||||||||||||||||||||||
| Closing balance | $ | $ | $ | $ | $ | $ | |||||||||||||||||||||||||||||
| $ | ( |
$ | $ | — | $ | — | $ | — | $ | ||||||||||||||||||||||||||
| Change in unrealized gains or losses for the period included in other comprehensive income for assets held at the end of the reporting period | — | — | — | ||||||||||||||||||||||||||||||||
Assets and liabilities under the fair value option
The following table presents the fair value and aggregate principal balance of certain assets and liabilities under the fair value option:
| Total Loans | Loans that are 90 or more days past due | ||||||||||||||||||||||||||||||||||
| (dollar amounts in millions) | Fair value carrying amount |
Aggregate unpaid principal |
Difference | Fair value carrying amount |
Aggregate unpaid principal |
Difference | |||||||||||||||||||||||||||||
| At December 31, 2022 | |||||||||||||||||||||||||||||||||||
| Assets | |||||||||||||||||||||||||||||||||||
| Loans held for sale | $ | $ | $ | $ | $ | $ | |||||||||||||||||||||||||||||
| Loans held for investment | ( |
||||||||||||||||||||||||||||||||||
| At December 31, 2021 | |||||||||||||||||||||||||||||||||||
| Assets | |||||||||||||||||||||||||||||||||||
| Loans held for sale | $ | $ | $ | $ | $ | $ | |||||||||||||||||||||||||||||
| Loans held for investment | $ | ( |
|||||||||||||||||||||||||||||||||
The following table presents the net (losses) gains from fair value changes:
| Net (losses) gains from fair value changes Year Ended December 31, |
|||||||||||||||||
| (dollar amounts in millions) | 2022 | 2021 | 2020 | ||||||||||||||
| Assets | |||||||||||||||||
Loans held for sale (1)
|
$ | ( |
$ | ( |
$ | ||||||||||||
| Loans held for investment | ( |
||||||||||||||||
(1)The net (losses) gains from fair value changes are included in Mortgage banking income on the Consolidated Statements of Income.
143 Huntington Bancshares Incorporated
Assets and Liabilities measured at fair value on a nonrecurring basis
Certain assets and liabilities may be required to be measured at fair value on a nonrecurring basis in periods subsequent to their initial recognition. These assets and liabilities are not measured at fair value on an ongoing basis; however, they are subject to fair value adjustments in certain circumstances, such as when there is evidence of impairment. The gains (losses) represent the amounts recorded during the period regardless of whether the asset is still held at period end.
The amounts measured at fair value on a nonrecurring basis were as follows:
| Fair Value Measurements Using Significant Other Unobservable Inputs (Level 3) | Total Gains/(Losses) Year Ended | ||||||||||||||||||||||||||||
| (dollar amounts in millions) | December 31, 2022 | December 31, 2021 | December 31, 2022 | December 31, 2021 | December 31, 2020 | ||||||||||||||||||||||||
| Collateral-dependent loans | $ | $ | $ | ( |
$ | ( |
$ | ( |
|||||||||||||||||||||
| Loans held for sale | ( |
||||||||||||||||||||||||||||
Huntington records nonrecurring adjustments of collateral-dependent loans held for investment. Such amounts are generally based on the fair value of the underlying collateral supporting the loan. Appraisals are generally obtained to support the fair value of the collateral and incorporate measures such as recent sales prices for comparable properties and cost of construction. Periodically, in cases where the carrying value exceeds the fair value of the collateral less cost to sell, an impairment charge is recognized in the form of a charge-off.
Significant unobservable inputs for assets and liabilities measured at fair value on a recurring and nonrecurring basis
The following table presents quantitative information about the significant unobservable inputs for assets and liabilities measured at fair value on a recurring and nonrecurring basis:
| Quantitative Information about Level 3 Fair Value Measurements | |||||||||||||||||||||||||||||||||||||||||||||||
| At December 31, 2022(1) | At December 31, 2021(1) | ||||||||||||||||||||||||||||||||||||||||||||||
| (dollar amounts in millions) | Valuation Technique | Significant Unobservable Input | Range |
Weighted
Average
|
Range |
Weighted
Average
|
|||||||||||||||||||||||||||||||||||||||||
| Measured at fair value on a recurring basis: | |||||||||||||||||||||||||||||||||||||||||||||||
| MSRs | Discounted cash flow | Constant prepayment rate | % | - | % | % | % | - | % | % | |||||||||||||||||||||||||||||||||||||
| Spread over forward interest rate swap rates | % | - | % | % | % | - | % | % | |||||||||||||||||||||||||||||||||||||||
| Municipal securities and asset-backed securities | Discounted cash flow | Discount rate | % | - | % | % | % | - | % | % | |||||||||||||||||||||||||||||||||||||
| Cumulative default | % | - | % | % | % | - | % | % | |||||||||||||||||||||||||||||||||||||||
| Loss given default | % | - | % | % | % | - | % | % | |||||||||||||||||||||||||||||||||||||||
(1) Certain disclosures related to quantitative level 3 fair value measurements do not include those deemed to be immaterial.
The following provides a general description of the impact of a change in an unobservable input on the fair value measurement and the interrelationship between unobservable inputs, where relevant/significant. Interrelationships may also exist between observable and unobservable inputs.
Credit loss estimates, such as probability of default, constant default, cumulative default, loss given default, cure given deferral, and loss severity, are driven by the ability of the borrowers to pay their loans and the value of the underlying collateral and are impacted by changes in macroeconomic conditions, typically increasing when economic conditions worsen and decreasing when conditions improve. An increase in the estimated prepayment rate typically results in a decrease in estimated credit losses and vice versa. Higher credit loss estimates generally result in lower fair values. Credit spreads generally increase when liquidity risks and market volatility increase and decrease when liquidity conditions and market volatility improve.
2022 Form 10-K 144
Discount rates and spread over forward interest rate swap rates typically increase when market interest rates increase and/or credit and liquidity risks increase, and decrease when market interest rates decline and/or credit and liquidity conditions improve. Higher discount rates and credit spreads generally result in lower fair market values.
Fair values of financial instruments
Many of the assets and liabilities subject to the disclosure requirements are not actively traded, requiring fair values to be estimated by management. These estimations necessarily involve the use of judgment about a wide variety of factors, including, but not limited to, relevancy of market prices of comparable instruments, expected future cash flows, and appropriate discount rates.
The short-term nature of certain assets and liabilities result in their carrying value approximating fair value. These include trading account securities, customers’ acceptance liabilities, short-term borrowings, bank acceptances outstanding, FHLB advances, and cash and short-term assets, which include cash and due from banks, interest-bearing deposits in banks, interest-bearing deposits at the Federal Reserve Bank, and federal funds sold. Loan commitments and letters-of-credit generally have short-term, variable-rate features and contain clauses that limit Huntington’s exposure to changes in customer credit quality. Accordingly, their carrying values, which are immaterial at the respective balance sheet dates, are reasonable estimates of fair value.
Certain assets, the most significant being operating lease assets, bank owned life insurance, and premises and equipment, do not meet the definition of a financial instrument and are excluded from this disclosure. Similarly, mortgage servicing rights and relationship intangibles are not considered financial instruments and are not included below. Accordingly, this fair value information is not intended to, and does not, represent Huntington’s underlying value.
145 Huntington Bancshares Incorporated
The following table provides the carrying amounts and estimated fair values of Huntington’s financial instruments:
| (dollar amounts in millions) | Amortized Cost | Lower of Cost or Market |
Fair Value or
Fair Value Option
|
Total Carrying Amount | Estimated Fair Value | ||||||||||||||||||||||||
| At December 31, 2022 | |||||||||||||||||||||||||||||
| Financial Assets | |||||||||||||||||||||||||||||
| Cash and short-term assets | $ | $ | — | $ | — | $ | $ | ||||||||||||||||||||||
| Trading account securities | — | — | |||||||||||||||||||||||||||
| Available-for-sale securities | — | — | |||||||||||||||||||||||||||
| Held-to-maturity securities | — | — | |||||||||||||||||||||||||||
| Other securities | — | ||||||||||||||||||||||||||||
| Loans held for sale | — | ||||||||||||||||||||||||||||
| Net loans and leases (1) | — | ||||||||||||||||||||||||||||
| Derivative assets | — | — | |||||||||||||||||||||||||||
| Assets held in trust for deferred compensation plans | — | — | |||||||||||||||||||||||||||
| Financial Liabilities | |||||||||||||||||||||||||||||
| Deposits | — | — | |||||||||||||||||||||||||||
| Short-term borrowings | — | — | |||||||||||||||||||||||||||
| Long-term debt | — | — | |||||||||||||||||||||||||||
| — | — | ||||||||||||||||||||||||||||
| At December 31, 2021 | |||||||||||||||||||||||||||||
| Financial Assets | |||||||||||||||||||||||||||||
| Cash and short-term assets | $ | $ | — | $ | — | $ | $ | ||||||||||||||||||||||
| Trading account securities | — | — | |||||||||||||||||||||||||||
| Available-for-sale securities | — | — | |||||||||||||||||||||||||||
| Held-to-maturity securities | — | — | |||||||||||||||||||||||||||
| Other securities | — | ||||||||||||||||||||||||||||
| Loans held for sale | — | ||||||||||||||||||||||||||||
| Net loans and leases (1) | — | ||||||||||||||||||||||||||||
| Derivative assets | — | — | |||||||||||||||||||||||||||
| Assets held in trust for deferred compensation plans | — | — | |||||||||||||||||||||||||||
| Financial Liabilities | |||||||||||||||||||||||||||||
| Deposits | — | — | |||||||||||||||||||||||||||
| Short-term borrowings | — | — | |||||||||||||||||||||||||||
| Long-term debt | — | — | |||||||||||||||||||||||||||
| — | — | ||||||||||||||||||||||||||||
(1)Includes collateral-dependent loans.
2022 Form 10-K 146
The following table presents the level in the fair value hierarchy for estimated fair values:
| Estimated Fair Value Measurements at Reporting Date Using | Netting | Presented Balance | |||||||||||||||||||||||||||
| (dollar amounts in millions) | Level 1 | Level 2 | Level 3 | Adjustments (1) | |||||||||||||||||||||||||
| At December 31, 2022 | |||||||||||||||||||||||||||||
| Financial Assets | |||||||||||||||||||||||||||||
| Trading account securities | $ | $ | $ | $ | — | $ | |||||||||||||||||||||||
| Available-for-sale securities | — | ||||||||||||||||||||||||||||
| Held-to-maturity securities | — | ||||||||||||||||||||||||||||
| Other securities (2) | — | ||||||||||||||||||||||||||||
| Loans held for sale | — | ||||||||||||||||||||||||||||
| Net loans and leases | — | ||||||||||||||||||||||||||||
| Derivative assets | ( |
||||||||||||||||||||||||||||
| Financial Liabilities | |||||||||||||||||||||||||||||
| Deposits | — | ||||||||||||||||||||||||||||
| Short-term borrowings | — | ||||||||||||||||||||||||||||
| Long-term debt | — | ||||||||||||||||||||||||||||
| ( |
|||||||||||||||||||||||||||||
| At December 31, 2021 | |||||||||||||||||||||||||||||
| Financial Assets | |||||||||||||||||||||||||||||
| Trading account securities | $ | $ | $ | $ | — | $ | |||||||||||||||||||||||
| Available-for-sale securities | — | ||||||||||||||||||||||||||||
| Held-to-maturity securities | — | ||||||||||||||||||||||||||||
| Other securities (2) | — | ||||||||||||||||||||||||||||
| Loans held for sale | — | ||||||||||||||||||||||||||||
| Net loans and leases | — | ||||||||||||||||||||||||||||
| Derivative assets | ( |
||||||||||||||||||||||||||||
| Financial Liabilities | |||||||||||||||||||||||||||||
| Deposits | — | ||||||||||||||||||||||||||||
| Short-term borrowings | — | ||||||||||||||||||||||||||||
| Long-term debt | — | ||||||||||||||||||||||||||||
| ( |
|||||||||||||||||||||||||||||
(1)Amounts represent the impact of legally enforceable master netting agreements that allow the Company to settle positive and negative positions and cash collateral held or placed with the same counterparties.
(2)Excludes securities without readily determinable fair values.
20. DERIVATIVE FINANCIAL INSTRUMENTS
Derivative financial instruments are recorded in the Consolidated Balance Sheets as either an asset or a liability (in other assets or other liabilities, respectively) and measured at fair value.
Derivative financial instruments can be designated as accounting hedges under GAAP. Designating a derivative as an accounting hedge allows Huntington to recognize gains and losses on the hedging instruments in the income statement line item where the gains and losses on the hedged item are recognized. Gains and losses on derivatives that are not designated in an effective hedge relationship under GAAP immediately impact earnings within the period they occur.
147 Huntington Bancshares Incorporated
| At December 31, 2022 | At December 31, 2021 | ||||||||||||||||||||||||||||||||||
| (dollar amounts in millions) | Notional Value | Asset | Liability | Notional Value | Asset | Liability | |||||||||||||||||||||||||||||
| Derivatives designated as Hedging Instruments | |||||||||||||||||||||||||||||||||||
| Interest rate contracts | $ | $ | $ | $ | $ | $ | |||||||||||||||||||||||||||||
| Foreign exchange contracts | |||||||||||||||||||||||||||||||||||
| Derivatives not designated as Hedging Instruments | |||||||||||||||||||||||||||||||||||
| Interest rate contracts | |||||||||||||||||||||||||||||||||||
| Foreign exchange contracts | |||||||||||||||||||||||||||||||||||
| Commodities contracts | |||||||||||||||||||||||||||||||||||
| Equity contracts | |||||||||||||||||||||||||||||||||||
| Total Contracts | $ | $ | $ | $ | $ | $ | |||||||||||||||||||||||||||||
The following table presents the amount of gain or loss recognized in income for derivatives not designated as hedging instruments under ASC Subtopic 815-10 in the Consolidated Income Statement.
| Location of Gain or (Loss) Recognized in Income on Derivatives | ||||||||||||||||||||||||||
| Year Ended December 31, | ||||||||||||||||||||||||||
| (dollar amounts in millions) | 2022 | 2021 | 2020 | |||||||||||||||||||||||
| Interest rate contracts: | ||||||||||||||||||||||||||
| Customer | Capital markets fees | $ | $ | $ | ||||||||||||||||||||||
| Mortgage banking | Mortgage banking income | ( |
( |
|||||||||||||||||||||||
| Interest rate floors | Interest and fee income on loans and leases | ( |
( |
|||||||||||||||||||||||
| Interest rate caps | Interest expense on long-term debt | |||||||||||||||||||||||||
| Foreign exchange contracts | Capital markets fees | |||||||||||||||||||||||||
| Commodities contracts | Capital markets fees | |||||||||||||||||||||||||
| Equity contracts | Other noninterest expense | ( |
( |
( |
||||||||||||||||||||||
| Total | $ | ( |
$ | $ | ||||||||||||||||||||||
Derivatives used in asset and liability management activities
Huntington engages in balance sheet hedging activity, principally for asset and liability management purposes. Balance sheet hedging activity is generally arranged to receive hedge accounting treatment that can be classified as either fair value or cash flow hedges. Fair value hedges are executed to hedge changes in fair value of outstanding fixed-rate debt and investment securities caused by fluctuations in market interest rates. Cash flow hedges are executed to modify interest rate characteristics of designated commercial loans in order to reduce the impact of changes in future cash flows due to market interest rate changes.
2022 Form 10-K 148
The following table presents the gross notional values of derivatives used in Huntington’s asset and liability management activities, identified by the underlying interest rate-sensitive instruments:
| At December 31, 2022 | |||||||||||||||||||||||
| (dollar amounts in millions) | Fair Value Hedges | Cash Flow Hedges | Economic Hedges | Total | |||||||||||||||||||
| Instruments associated with: | |||||||||||||||||||||||
| Investment securities | $ | $ | $ | $ | |||||||||||||||||||
| Loans | |||||||||||||||||||||||
| Long-term debt | |||||||||||||||||||||||
| Total notional value at December 31, 2022 | $ | $ | $ | $ | |||||||||||||||||||
| At December 31, 2021 | |||||||||||||||||||||||
| (dollar amounts in millions) | Fair Value Hedges | Cash Flow Hedges | Economic Hedges | Total | |||||||||||||||||||
| Instruments associated with: | |||||||||||||||||||||||
| Investment securities | $ | $ | $ | $ | |||||||||||||||||||
| Loans | |||||||||||||||||||||||
| Long-term debt | |||||||||||||||||||||||
| Total notional value at December 31, 2021 | $ | $ | $ | $ | |||||||||||||||||||
These derivative financial instruments were entered into for the purpose of managing the interest rate risk of assets and liabilities. Net amounts receivable or payable on contracts hedging either interest earning assets or interest bearing liabilities were accrued as an adjustment to either interest income or interest expense. Adjustments to interest income were also recorded for the amounts related to the amortization of premiums for swaption collars, floors, and forward-starting floors that were excluded from the hedge effectiveness, changes in the fair value of economic hedges, as well as the amounts related to terminated hedges reclassified from AOCI. The net amounts resulted in an increase to net interest income of $76 million, $337 million, and $239 million for the years ended December 31, 2022, 2021, and 2020, respectively.
Fair Value Hedges
The changes in fair value of the fair value hedges are recorded through earnings and offset against changes in the fair value of the hedged item.
Huntington has designated $9.5 billion of interest rate swaps as fair value hedges of fixed-rate investment securities using the portfolio layer method. This approach allows the Company to designate as the hedged item a stated amount of the assets that are not expected to be affected by prepayments, defaults and other factors affecting the timing and amount of cash flows. The fair value portfolio level basis adjustment on our hedged mortgage-backed securities portfolio has not been attributed to the individual available-for-sale securities in our Consolidated Statements of Financial Condition. Huntington has also designated $869 million of interest rate swaps as fair value hedges of fixed-rate corporate bonds.
The following table presents the change in fair value for derivatives designated as fair value hedges as well as the offsetting change in fair value on the hedged item.
| Year Ended December 31, | |||||||||||||||||
| (dollar amounts in millions) | 2022 | 2021 | 2020 | ||||||||||||||
| Interest rate contracts | |||||||||||||||||
| Change in fair value of interest rate swaps hedging investment securities (1) | $ | $ | $ | ||||||||||||||
| Change in fair value of hedged investment securities (1) | ( |
( |
|||||||||||||||
| Change in fair value of interest rate swaps hedging long-term debt (2) | ( |
( |
|||||||||||||||
| Change in fair value of hedged long term debt (2) | ( |
||||||||||||||||
(1)Recognized in Interest income—available-for-sale securities—taxable in the Consolidated Statements of Income.
149 Huntington Bancshares Incorporated
The following amounts were recorded on the balance sheet related to cumulative basis adjustments for fair value hedges.
| Amortized Cost | Cumulative Amount of Fair Value Hedging Adjustment To Hedged Items | ||||||||||||||||||||||
| At December 31, | At December 31, | ||||||||||||||||||||||
| (dollar amounts in millions) | 2022 | 2021 | 2022 | 2021 | |||||||||||||||||||
| Assets | |||||||||||||||||||||||
| Investment securities (1) | $ | $ | $ | ( |
$ | ( |
|||||||||||||||||
| Liabilities | |||||||||||||||||||||||
| Long-term debt (2) | ( |
||||||||||||||||||||||
(1)Amounts include the amortized cost basis of closed portfolios used to designate hedging relationships under the portfolio layer method. The hedged item is a layer of the closed portfolio which is expected to be remaining at the end of the hedging relationship. As of December 31, 2022, the amortized cost basis of the closed portfolios used in these hedging relationships was $17.2 billion, the cumulative basis adjustments associated with these hedging relationships was $849 million and represented a reduction to the amortized cost, and the amounts of the designated hedging instruments were $9.5 billion.
(2)Excluded from the above table are the cumulative amount of fair value hedge adjustments remaining for long-term debt for which hedge accounting has been discontinued in the amounts of $(70 ) million at December 31, 2022 and $17 million at December 31, 2021.
Cash Flow Hedges
At December 31, 2022, Huntington had $24.3 billion of interest rate swaps and swaption collars. These are designated as cash flow hedges for variable rate commercial loans. The change in the fair value of a derivative instrument designated as a cash flow hedge is initially recognized in OCI and is reclassified into income when the hedged item impacts earnings. The initial premium paid for the interest rate swaption collar contracts represents the time value of the contracts and is not included in the measurement of hedge effectiveness. Any change in fair value related to time value is recognized in OCI. The initial premium paid is amortized on a straight line basis as a reduction to interest income over the contractual life of these contracts.
Gains and (losses) on interest rate floors, floor spreads, and swaps recognized in other comprehensive income (loss) after-tax were $(695 ) million and $(192 ) million for the year ended December 31, 2022 and December 31, 2021, respectively.
At December 31, 2022, the net gains recognized in AOCI that are expected to be reclassified into earnings within the next 12 months were $10 million.
Derivatives used in mortgage banking activities
Mortgage loan origination hedging activity
Huntington’s mortgage origination hedging activity is related to economically hedging Huntington’s mortgage pricing commitments to customers and the secondary sale to third parties. The value of a newly originated mortgage is not firm until the interest rate is committed or locked. Forward commitments to sell economically hedge the possible loss on interest rate lock commitments due to interest rate change. The position of these derivatives was a net liability of $3 million and a net asset of $15 million at December 31, 2022 and December 31, 2021, respectively. At December 31, 2022 and December 31, 2021, Huntington had commitments to sell residential real estate loans of $766 million and $2.1 billion, respectively. These contracts mature in less than one year.
MSR hedging activity
Huntington’s MSR economic hedging activity uses securities and derivatives to manage the value of the MSR asset and to mitigate the various types of risk inherent in the MSR asset, including risks related to duration, basis, convexity, volatility, and yield curve. The hedging instruments include forward commitments, TBA securities, Treasury futures contracts, interest rate swaps, and options on interest rate swaps.
2022 Form 10-K 150
MSR hedging trading assets and liabilities are included in other assets and other liabilities, respectively, in the Consolidated Balance Sheets. Trading (losses) gains are included in mortgage banking income in the Consolidated Statement of Income. The notional value of the derivative financial instruments, the corresponding trading assets and liabilities positions, and net trading (losses) gains related to MSR hedging activity is summarized in the following table:
| At December 31, | ||||||||||||||||||||
| (dollar amounts in millions) | 2022 | 2021 | ||||||||||||||||||
| Notional value | $ | $ | ||||||||||||||||||
| Trading assets | ||||||||||||||||||||
| Trading liabilities | ( |
|||||||||||||||||||
| Year December 31, | ||||||||||||||||||||
| (dollar amounts in millions) | 2022 | 2021 | 2020 | |||||||||||||||||
| Trading (losses) gains | $ | ( |
$ | ( |
$ | |||||||||||||||
Derivatives used in customer related activities
Various derivative financial instruments are offered to enable customers to meet their financing and investing objectives and for their risk management purposes. Derivative financial instruments used in customer related activities consist of commodity, interest rate, and foreign exchange contracts. Huntington enters into offsetting third-party contracts with approved, reputable counterparties with substantially matching terms and currencies in order to economically hedge significant exposure related to derivatives used in customer related activities.
The interest rate or price risk of customer derivatives is mitigated by entering into similar derivatives having offsetting terms with other counterparties. The credit risk to these customers is evaluated and included in the calculation of fair value. Foreign currency derivatives help the customer hedge risk and reduce exposure to fluctuations in exchange rates. Transactions are primarily in liquid currencies with Canadian dollars and Euros comprising a majority of all transactions. Commodity derivatives help the customer hedge risk and reduce exposure to fluctuations in the price of various commodities. Hedging of energy-related products and base metals comprise the majority of these transactions.
The net fair values of these derivative financial instruments, for which the gross amounts are included in other assets or other liabilities at December 31, 2022 and December 31, 2021, were $59 million and $51 million, respectively. The total notional values of derivative financial instruments used by Huntington on behalf of customers, including offsetting derivatives, were $40.7 billion and $45.1 billion at December 31, 2022 and December 31, 2021, respectively. Huntington’s credit risk from customer derivatives was $118 million and $551 million at the same dates, respectively.
Financial assets and liabilities that are offset in the Consolidated Balance Sheets
Huntington records derivatives at fair value as further described in Note 19 “Fair Values of Assets and Liabilities.”
Derivative balances are presented on a net basis taking into consideration the effects of legally enforceable master netting agreements. Additionally, collateral exchanged with counterparties is also netted against the applicable derivative fair values. Huntington enters into derivative transactions with two primary groups: broker-dealers and banks, and Huntington’s customers. Different methods are utilized for managing counterparty credit exposure and credit risk for each of these groups.
Huntington enters into transactions with broker-dealers and banks for various risk management purposes. These types of transactions generally are high dollar volume. Huntington enters into collateral and master netting agreements with these counterparties, and routinely exchanges cash and high quality securities collateral. Huntington enters into transactions with customers to meet their financing, investing, payment and risk management needs. These types of transactions generally are low dollar volume. Huntington enters into master netting agreements with customer counterparties; however, collateral is generally not exchanged with customer counterparties.
151 Huntington Bancshares Incorporated
In addition to the customer derivative credit exposure, aggregate credit risk associated with broker-dealer and bank derivative transactions, net of collateral that has been pledged by the counterparty, was $227 million and $44 million at December 31, 2022 and December 31, 2021, respectively. The credit risk associated with derivatives is calculated after considering master netting agreements and is reduced by collateral that has been pledged by the counterparty.
At December 31, 2022, Huntington pledged $236 million of investment securities and cash collateral to counterparties, while other counterparties pledged $574 million of investment securities and cash collateral to Huntington to satisfy collateral netting agreements. In the event of credit downgrades, Huntington would not be required to provide additional collateral.
The following tables present the gross amounts of these assets and liabilities with any offsets to arrive at the net amounts recognized in the Consolidated Balance Sheets.
| Offsetting of Financial Assets and Derivative Assets | |||||||||||||||||||||||||||||||||||
|
Gross amounts
offset in the
consolidated
balance sheets
|
Gross amounts not offset in the consolidated balance sheets | ||||||||||||||||||||||||||||||||||
| (dollar amounts in millions) |
Gross amounts
of recognized
assets
|
Financial
instruments
|
Cash collateral
received
|
Net amount | |||||||||||||||||||||||||||||||
| At December 31, 2022 | $ | $ | ( |
$ | $ | ( |
$ | ( |
$ | ||||||||||||||||||||||||||
| At December 31, 2021 | ( |
( |
( |
||||||||||||||||||||||||||||||||
| Offsetting of Financial Liabilities and Derivative Liabilities | |||||||||||||||||||||||||||||||||||
|
Gross amounts
offset in the
consolidated
balance sheets
|
Net amounts of
liabilities
presented in
the
consolidated
balance sheets
|
Gross amounts not offset in the consolidated balance sheets | |||||||||||||||||||||||||||||||||
| (dollar amounts in millions) |
Gross amounts
of recognized
liabilities
|
Financial
instruments
|
Cash collateral
delivered
|
Net amount | |||||||||||||||||||||||||||||||
| At December 31, 2022 | $ | $ | ( |
$ | $ | ( |
$ | ( |
$ | ||||||||||||||||||||||||||
| At December 31, 2021 | ( |
( |
( |
||||||||||||||||||||||||||||||||
21. Variable Interest Entities
Unconsolidated VIEs
The following tables provide a summary of the assets and liabilities included in Huntington’s Consolidated Financial Statements, as well as the maximum exposure to losses, associated with its interests related to unconsolidated VIEs for which Huntington holds an interest in, but is not the primary beneficiary of, the VIE.
| At December 31, 2022 | |||||||||||||||||
| (dollar amounts in millions) | Total Assets | Total Liabilities | Maximum Exposure to Loss | ||||||||||||||
| Affordable Housing Tax Credit Partnerships | $ | $ | $ | ||||||||||||||
| Trust Preferred Securities | |||||||||||||||||
| Other Investments | |||||||||||||||||
| Total | $ | $ | $ | ||||||||||||||
| At December 31, 2021 | |||||||||||||||||
| (dollar amounts in millions) | Total Assets | Total Liabilities | Maximum Exposure to Loss | ||||||||||||||
| Affordable Housing Tax Credit Partnerships | $ | $ | $ | ||||||||||||||
| Trust Preferred Securities | |||||||||||||||||
| Other Investments | |||||||||||||||||
| Total | $ | $ | $ | ||||||||||||||
2022 Form 10-K 152
Trust-Preferred Securities
Huntington has certain trusts whose assets, liabilities, equity, income, and expenses are not included within Huntington’s Consolidated Financial Statements. These trusts have been formed for the sole purpose of issuing trust-preferred securities, from which the proceeds are then invested in Huntington junior subordinated debentures, which are reflected in Huntington’s Consolidated Balance Sheet as long-term debt. Refer to Note 11 “Borrowings” for the outstanding amount of debentures issued to each trust and corresponding trust securities. The trust securities are the obligations of the trusts, and as such, are not consolidated within Huntington’s Consolidated Financial Statements.
Each issue of the junior subordinated debentures has an interest rate equal to the corresponding trust securities distribution rate. Huntington has the right to defer payment of interest on the debentures at any time, or from time-to-time for a period not exceeding five years provided that no extension period may extend beyond the stated maturity of the related debentures. During any such extension period, distributions to the trust securities will also be deferred and Huntington’s ability to pay dividends on its common stock will be restricted. Periodic cash payments and payments upon liquidation or redemption with respect to trust securities are guaranteed by Huntington to the extent of funds held by the trusts. The guarantee ranks subordinate and junior in right of payment to all indebtedness of the Company to the same extent as the junior subordinated debt. The guarantee does not place a limitation on the amount of additional indebtedness that may be incurred by Huntington.
Affordable Housing Tax Credit Partnerships
Huntington makes certain equity investments in various limited partnerships that sponsor affordable housing projects utilizing the LIHTC pursuant to Section 42 of the Internal Revenue Code. The purpose of these investments is to achieve a satisfactory return on capital, to facilitate the sale of additional affordable housing product offerings, and to assist in achieving goals associated with the Community Reinvestment Act. The primary activities of the limited partnerships include the identification, development, and operation of multi-family housing that is leased to qualifying residential tenants. Generally, these types of investments are funded through a combination of debt and equity.
Huntington uses the proportional amortization method to account for a majority of its investments in these entities. These investments are included in other assets. Investments that do not meet the requirements of the proportional amortization method are accounted for using the equity method. Investment losses are included in Other noninterest income in the Consolidated Statements of Income.
The following table presents the balances of Huntington’s affordable housing tax credit investments and related unfunded commitments.
| At December 31, | |||||||||||
| (dollar amounts in millions) | 2022 | 2021 | |||||||||
| Affordable housing tax credit investments | $ | $ | |||||||||
| Less: amortization | ( |
( |
|||||||||
| Net affordable housing tax credit investments | $ | $ | |||||||||
| Unfunded commitments | $ | $ | |||||||||
The following table presents other information relating to Huntington’s affordable housing tax credit investments.
| Year Ended December 31, | |||||||||||||||||
| (dollar amounts in millions) | 2022 | 2021 | 2020 | ||||||||||||||
| Tax credits and other tax benefits recognized | $ | $ | $ | ||||||||||||||
| Proportional amortization expense included in provision for income taxes | |||||||||||||||||
Other Investments
Other investments determined to be VIE’s include investments in Small Business Investment Companies, Historic Tax Credit Investments, certain equity method investments, renewable energy financings, and other miscellaneous investments.
153 Huntington Bancshares Incorporated
22. COMMITMENTS AND CONTINGENT LIABILITIES
Commitments to extend credit
In the ordinary course of business, Huntington makes various commitments to extend credit that are not reflected in the Consolidated Financial Statements. The contract amounts of these financial agreements were as follows:
| At December 31, | |||||||||||
| (dollar amounts in millions) | 2022 | 2021 | |||||||||
| Contract amount representing credit risk | |||||||||||
| Commitments to extend credit: | |||||||||||
| Commercial | $ | $ | |||||||||
| Consumer | |||||||||||
| Commercial real estate | |||||||||||
| Standby letters of credit and guarantees on industrial revenue bonds | |||||||||||
| Commercial letters of credit | |||||||||||
Commitments to extend credit generally have fixed expiration dates, are variable-rate, and contain clauses that permit Huntington to terminate or otherwise renegotiate the contracts in the event of a significant deterioration in the customer’s credit quality. These arrangements normally require the payment of a fee by the customer, the pricing of which is based on prevailing market conditions, credit quality, probability of funding, and other relevant factors. Since many of these commitments are expected to expire without being drawn upon, the contract amounts are not necessarily indicative of future cash requirements. The interest rate risk arising from these financial instruments is insignificant as a result of their predominantly short-term, variable-rate nature. Collateral to secure any funding of these commitments predominately consists of residential and commercial real estate mortgage loans.
Standby letters of credit and guarantees on industrial revenue bonds are conditional commitments issued to guarantee the performance of a customer to a third-party. These guarantees are primarily issued to support public and private borrowing arrangements, including commercial paper, bond financing, and similar transactions. Most of these arrangements mature within two years. Since the conditions under which Huntington is required to fund these commitments may not materialize, the cash requirements are expected to be less than the total outstanding commitments. The carrying amount of deferred revenue associated with these guarantees was $27 million and $7 million at December 31, 2022 and December 31, 2021, respectively.
Commercial letters of credit represent short-term, self-liquidating instruments that facilitate customer trade transactions and generally have maturities of no longer than 90 days. The goods or cargo being traded normally secure these instruments.
Litigation and Regulatory Matters
In the ordinary course of business, Huntington is or may be a defendant in or party to pending and threatened legal and regulatory actions and proceedings.
In view of the inherent difficulty of predicting the outcome of such matters, particularly where the claimants seek very large or indeterminate damages or where the matters present novel legal theories or involve a large number of parties, Huntington generally cannot predict what the eventual outcome of the pending matters will be, what the timing of the ultimate resolution of these matters will be, or what the eventual loss, fines, or penalties related to each matter may be.
Huntington establishes an accrued liability when those matters present loss contingencies that are both probable and estimable. In such cases, there may be an exposure to loss in excess of any amounts accrued. Huntington thereafter continues to monitor the matter for further developments that could affect the amount of the accrued liability that has been previously established.
2022 Form 10-K 154
For certain matters, Huntington is able to estimate a range of possible loss. In cases in which Huntington possesses information to estimate a range of possible loss, that estimate is aggregated and disclosed below. There may be other matters for which a loss is probable or reasonably possible but such an estimate of the range of possible loss may not be possible. For those matters where an estimate of the range of possible loss is possible, management currently estimates the aggregate range of reasonably possible loss is $0 to $10 million at December 31, 2022 in excess of the accrued liability (if any) related to those matters. This estimated range of possible loss is based upon currently available information and is subject to significant judgment, a variety of assumptions, and known and unknown uncertainties. The matters underlying the estimated range will change from time to time, and actual results may vary significantly from the current estimate. The estimated range of possible loss does not represent Huntington’s maximum loss exposure.
Based on current knowledge, management does not believe that loss contingencies arising from pending matters will have a material adverse effect on the consolidated financial position of Huntington. Further, management believes that amounts accrued are adequate to address Huntington’s contingent liabilities. However, in light of the inherent uncertainties involved in these matters, some of which are beyond Huntington’s control, and the large or indeterminate damages sought in some of these matters, an adverse outcome in one or more of these matters could be material to Huntington’s results of operations for any particular reporting period.
23. OTHER REGULATORY MATTERS
Huntington and the Bank are subject to certain risk-based capital and leverage ratio requirements under the U.S. Basel III capital rules adopted by the Federal Reserve, for Huntington, and by the OCC, for the Bank. These rules implement the Basel III international regulatory capital standards in the United States, as well as certain provisions of the Dodd-Frank Act. These quantitative calculations are minimums, and the Federal Reserve and OCC may determine that a banking organization, based on its size, complexity, or risk profile, must maintain a higher level of capital in order to operate in a safe and sound manner. Under the U.S. Basel III capital rules, Huntington’s and the Bank’s assets, exposures and certain off-balance sheet items are subject to risk weights used to determine the institutions’ risk-weighted assets.
Failure to be well-capitalized or to meet minimum capital requirements could result in certain mandatory and possible additional discretionary actions by regulators that, if undertaken, could have an adverse material effect on our operations or financial condition. Failure to be well-capitalized or to meet minimum capital requirements could also result in restrictions on Huntington’s or the Bank’s ability to pay dividends or otherwise distribute capital or to receive regulatory approval of applications.
In addition to meeting the minimum capital requirements, under the U.S. Basel III capital rules Huntington and the Bank must also maintain the applicable capital buffer requirements, SCB or CCB, to avoid becoming subject to restrictions on capital distributions and certain discretionary bonus payments to management.
155 Huntington Bancshares Incorporated
As of December 31, 2022, Huntington’s and the Bank’s regulatory capital ratios were above the well-capitalized standards and met the applicable capital buffer requirements. Please refer to the table below for a summary of Huntington’s and the Bank’s regulatory capital ratios.
| Minimum | Minimum Ratio+ | Basel III | ||||||||||||||||||||||||||||||||||||||||||||||||
| Regulatory | Capital Buffer (1) | Well- | At December 31, | |||||||||||||||||||||||||||||||||||||||||||||||
| Capital | At December 31, | Capitalized | 2022 | 2021 | ||||||||||||||||||||||||||||||||||||||||||||||
| (dollar amounts in millions) | Ratios | 2022 | 2021 | Minimums | Ratio | Amount | Ratio | Amount | ||||||||||||||||||||||||||||||||||||||||||
| CET1 risk-based capital | Consolidated | % | % | % | N/A | % | $ | % | $ | |||||||||||||||||||||||||||||||||||||||||
| Bank | % | |||||||||||||||||||||||||||||||||||||||||||||||||
| Tier 1 risk-based capital | Consolidated | |||||||||||||||||||||||||||||||||||||||||||||||||
| Bank | ||||||||||||||||||||||||||||||||||||||||||||||||||
| Total risk-based capital | Consolidated | |||||||||||||||||||||||||||||||||||||||||||||||||
| Bank | ||||||||||||||||||||||||||||||||||||||||||||||||||
| Tier 1 leverage | Consolidated | N/A | N/A | N/A | ||||||||||||||||||||||||||||||||||||||||||||||
| Bank | N/A | N/A | ||||||||||||||||||||||||||||||||||||||||||||||||
(1) The SCB, applicable to Huntington, was 3.3 % and 2.5 % at December 31, 2022 and December 31, 2021, respectively. The CCB, applicable to the Bank, was 2.5
Huntington and its subsidiaries are also subject to various regulatory requirements that impose restrictions on cash, debt, and dividends. The Bank is required to maintain cash reserves based on the level of certain of its deposits. This reserve requirement may be met by holding cash in banking offices or on deposit at the Federal Reserve Bank. At December 31, 2022, the balance of these deposits was $4.9 billion.
Under current Federal Reserve regulations, the Bank is limited as to the amount and type of loans it may make to the parent company and nonbank subsidiaries. At December 31, 2022, the Bank could lend $1.8 billion to a single affiliate, subject to the qualifying collateral requirements defined in the regulations.
24. PARENT-ONLY FINANCIAL STATEMENTS
The parent-only financial statements, which include transactions with subsidiaries, are as follows:
Balance Sheets |
At December 31, | ||||||||||
| (dollar amounts in millions) | 2022 | 2021 | |||||||||
| Assets | |||||||||||
Cash and due from banks |
$ | $ | |||||||||
Due from The Huntington National Bank |
|||||||||||
Due from non-bank subsidiaries |
|||||||||||
Investment in The Huntington National Bank |
|||||||||||
Investment in non-bank subsidiaries |
|||||||||||
Accrued interest receivable and other assets |
|||||||||||
Total assets |
$ | $ | |||||||||
Liabilities and shareholders’ equity |
|||||||||||
Long-term borrowings |
$ | $ | |||||||||
Dividends payable, accrued expenses, and other liabilities |
|||||||||||
Total liabilities |
|||||||||||
Shareholders’ equity (1) |
|||||||||||
Total liabilities and shareholders’ equity |
$ | $ | |||||||||
(1)See Consolidated Statements of Changes in Shareholders’ Equity.
2022 Form 10-K 156
| Statements of Income | Year Ended December 31, | ||||||||||||||||
| (dollar amounts in millions) | 2022 | 2021 | 2020 | ||||||||||||||
| Income | |||||||||||||||||
| Dividends from: | |||||||||||||||||
| The Huntington National Bank | $ | $ | $ | ||||||||||||||
| Non-bank subsidiaries | |||||||||||||||||
| Interest from: | |||||||||||||||||
| The Huntington National Bank | |||||||||||||||||
| Non-bank subsidiaries | |||||||||||||||||
| Other | ( |
||||||||||||||||
| Total income | |||||||||||||||||
| Expense | |||||||||||||||||
| Personnel costs | |||||||||||||||||
| Interest on borrowings | |||||||||||||||||
| Other | |||||||||||||||||
| Total expense | |||||||||||||||||
| Income before income taxes and equity in undistributed net income of subsidiaries | |||||||||||||||||
| Provision (benefit) for income taxes | ( |
( |
( |
||||||||||||||
| Income before equity in undistributed net income of subsidiaries | |||||||||||||||||
| Increase (decrease) in undistributed net income (loss) of: | |||||||||||||||||
| The Huntington National Bank | ( |
||||||||||||||||
| Non-bank subsidiaries | ( |
||||||||||||||||
| Net income | $ | $ | $ | ||||||||||||||
| Other comprehensive (loss) income (1) | ( |
( |
|||||||||||||||
| Comprehensive (loss) income | $ | ( |
$ | $ | |||||||||||||
(1)See Consolidated Statements of Comprehensive Income for other comprehensive (loss) income detail.
157 Huntington Bancshares Incorporated
| Statements of Cash Flows | Year Ended December 31, | ||||||||||||||||
| (dollar amounts in millions) | 2022 | 2021 | 2020 | ||||||||||||||
| Operating activities | |||||||||||||||||
| Net income | $ | $ | $ | ||||||||||||||
| Adjustments to reconcile net income to net cash provided by operating activities: | |||||||||||||||||
| Equity in undistributed net income of subsidiaries | ( |
( |
|||||||||||||||
| Depreciation and amortization | ( |
||||||||||||||||
| Other, net | ( |
( |
|||||||||||||||
| Net cash provided by operating activities | |||||||||||||||||
| Investing activities | |||||||||||||||||
| Repayments from subsidiaries | |||||||||||||||||
| Advances to subsidiaries | ( |
( |
( |
||||||||||||||
| (Purchases)/Proceeds from sale of securities | ( |
( |
( |
||||||||||||||
| Net cash received from business combination | ( |
||||||||||||||||
| Other, net | ( |
||||||||||||||||
| Net cash (used for) provided by investing activities | ( |
( |
|||||||||||||||
| Financing activities | |||||||||||||||||
| Net proceeds from issuance of medium-term notes | |||||||||||||||||
| Payment of long-term debt | ( |
( |
|||||||||||||||
| Dividends paid on common and preferred stock | ( |
( |
( |
||||||||||||||
| Repurchases of common stock | ( |
( |
|||||||||||||||
| Net proceeds from issuance of preferred stock | |||||||||||||||||
| Payment to repurchase preferred stock | ( |
||||||||||||||||
| Other, net | ( |
( |
( |
||||||||||||||
| Net cash provided by (used for) financing activities | ( |
||||||||||||||||
| Increase (decrease) in cash and cash equivalents | ( |
||||||||||||||||
| Cash and cash equivalents at beginning of year | |||||||||||||||||
| Cash and cash equivalents at end of year | $ | $ | $ | ||||||||||||||
| Supplemental disclosure: | |||||||||||||||||
| Interest paid | $ | $ | $ | ||||||||||||||
25. SEGMENT REPORTING
Huntington’s business segments are based on our internally-aligned segment leadership structure, which is how management monitors results and assesses performance. The Company has four major business segments: Commercial Banking, Consumer and Business Banking, Vehicle Finance, Regional Banking and The Huntington Private Client Group (RBHPCG). The Treasury / Other function includes technology and operations, other unallocated assets, liabilities, revenue, and expense.
Business segment results are determined based upon Huntington’s management reporting system, which assigns balance sheet and income statement items to each of the business segments. The process is designed around the organizational and management structure and, accordingly, the results derived are not necessarily comparable with similar information published by other financial institutions. Additionally, because of the interrelationships of the various segments, the information presented is not indicative of how the segments would perform if they operated as independent entities.
Revenue is recorded in the business segment responsible for the related product or service. Fee sharing is recorded to allocate portions of such revenue to other business segments involved in selling to, or providing service to, customers. Results of operations for the business segments reflect these fee sharing allocations.
2022 Form 10-K 158
The management process that develops the business segment reporting utilizes various estimates and allocation methodologies to measure the performance of the business segments. Expenses are allocated to business segments using a two-phase approach. The first phase consists of measuring and assigning unit costs (activity-based costs) to activities related to product origination and servicing. These activity-based costs are then extended, based on volumes, with the resulting amount allocated to business segments that own the related products. The second phase consists of the allocation of overhead costs to all four business segments from Treasury / Other. Huntington utilizes a full-allocation methodology, where all Treasury / Other expenses, except reported acquisition-related net expenses, if any, and a small amount of other residual unallocated expenses, are allocated to the four business segments.
The management policies and processes utilized in compiling segment financial information are highly subjective and, unlike financial accounting, are not based on authoritative guidance similar to GAAP. As a result, reported segment results are not necessarily comparable with similar information reported by other financial institutions. Furthermore, changes in management structure or allocation methodologies and procedures result in changes in reported segment financial data. Accordingly, certain amounts have been reclassified to conform to the current period presentation.
Huntington uses an active and centralized FTP methodology to attribute appropriate net interest income to the business segments. The intent of the FTP methodology is to transfer interest rate risk from the business segments by providing matched duration funding of assets and liabilities. The result is to centralize the financial impact, management, and reporting of interest rate risk in the Treasury / Other function where it can be centrally monitored and managed. The Treasury / Other function charges (credits) an internal cost of funds for assets held in (or pays for funding provided by) each business segment. The FTP rate is based on prevailing market interest rates for comparable duration assets (or liabilities).
Commercial Banking - The Commercial Banking segment provides expertise through bankers, capabilities, and digital channels, which include a comprehensive set of product offerings. Our target clients span from mid-market to large corporate (greater than $2 billion in revenue) across a national footprint. The Commercial Banking segment leverages internal partnerships for wealth management, trust, insurance, payments, and treasury management capabilities. The segment is divided into five business units: (1) Middle Market Banking, (2) Corporate, Specialty, and Government Banking, (3) Asset Finance, (4) Commercial Real Estate Banking, and (5) Capital Markets.
Consumer and Business Banking - The Consumer and Business Banking segment provides a wide array of financial products and services to consumer and small business customers including, but not limited to, checking accounts, savings accounts, money market accounts, CDs, investments, consumer loans, credit cards, and small business loans. Other financial services available to customers include mortgages, insurance, interest rate risk protection, foreign exchange, and treasury management. Business Banking is defined as serving companies with revenues up to $20 million. Consumer and Business Banking also supports origination and servicing of consumer loans and mortgages for customers who are generally located in our primary banking markets across all segments.
Vehicle Finance - Our products and services include providing financing to consumers for the purchase of automobiles, light-duty trucks, recreational vehicles, marine craft, and powersports at franchised and other select dealerships, and providing financing to franchised dealerships for the acquisition of new and used inventory. Products and services are delivered through highly specialized relationship-focused bankers and product partners.
Regional Banking and The Huntington Private Client Group - The core business of The Huntington Private Client Group is The Huntington Private Bank, which consists of Private Banking, Wealth & Investment Management, and Retirement Plan Services. The Huntington Private Bank provides high net-worth customers with deposit, lending (including specialized lending options), and banking services. The Huntington Private Bank also delivers wealth management and legacy planning through investment and portfolio management, fiduciary administration, and trust services. This group also provides retirement plan services to corporate businesses. The Huntington Private Client Group provides corporate trust services and institutional and mutual fund custody services.
159 Huntington Bancshares Incorporated
Listed in the table below is certain operating basis financial information reconciled to Huntington’s, reported results by business segment.
|
Income Statements
(dollar amounts in millions)
|
Commercial Banking | Consumer & Business Banking | Vehicle Finance | RBHPCG | Treasury / Other |
Huntington
Consolidated
|
|||||||||||||||||||||||||||||
| Year Ended December 31, 2022 | |||||||||||||||||||||||||||||||||||
| Net interest income | $ | $ | $ | $ | $ | $ | |||||||||||||||||||||||||||||
| Provision for credit losses | |||||||||||||||||||||||||||||||||||
| Noninterest income | |||||||||||||||||||||||||||||||||||
| Noninterest expense | |||||||||||||||||||||||||||||||||||
| Provision (benefit) for income taxes | ( |
||||||||||||||||||||||||||||||||||
| Income attributable to non-controlling interest | |||||||||||||||||||||||||||||||||||
| Net income attributable to Huntington Bancshares Inc | $ | $ | $ | $ | $ | $ | |||||||||||||||||||||||||||||
| Year Ended December 31, 2021 | |||||||||||||||||||||||||||||||||||
| Net interest income | $ | $ | $ | $ | $ | $ | |||||||||||||||||||||||||||||
| Provision for credit losses | ( |
||||||||||||||||||||||||||||||||||
| Noninterest income | |||||||||||||||||||||||||||||||||||
| Noninterest expense | |||||||||||||||||||||||||||||||||||
| Provision (benefit) for income taxes | ( |
||||||||||||||||||||||||||||||||||
| Income attributable to non-controlling interest | |||||||||||||||||||||||||||||||||||
| Net income attributable to Huntington Bancshares Inc | $ | $ | $ | $ | $ | ( |
$ | ||||||||||||||||||||||||||||
| Year Ended December 31, 2020 | |||||||||||||||||||||||||||||||||||
| Net interest income | $ | $ | $ | $ | $ | $ | |||||||||||||||||||||||||||||
| Provision for credit losses | |||||||||||||||||||||||||||||||||||
| Noninterest income | |||||||||||||||||||||||||||||||||||
| Noninterest expense | |||||||||||||||||||||||||||||||||||
| Provision for income taxes | |||||||||||||||||||||||||||||||||||
| Net income | $ | $ | $ | $ | $ | $ | |||||||||||||||||||||||||||||
|
Assets at
December 31,
|
Deposits at
December 31,
|
||||||||||||||||||||||
| (dollar amounts in millions) | 2022 | 2021 | 2022 | 2021 | |||||||||||||||||||
| Commercial Banking | $ | $ | $ | $ | |||||||||||||||||||
| Consumer & Business Banking | |||||||||||||||||||||||
| Vehicle Finance | |||||||||||||||||||||||
| RBHPCG | |||||||||||||||||||||||
| Treasury / Other | |||||||||||||||||||||||
| Total | $ | $ | $ | $ | |||||||||||||||||||
2022 Form 10-K 160
Item 9: Changes In and Disagreements With Accountants on Accounting and Financial Disclosure
None.
Item 9A: Controls and Procedures
Disclosure Controls and Procedures
Huntington maintains disclosure controls and procedures designed to ensure that the information required to be disclosed in the reports that it files or submits under the Securities Exchange Act of 1934, as amended (the Exchange Act), are recorded, processed, summarized, and reported within the time periods specified in the SEC’s rules and forms. Disclosure controls and procedures include, without limitation, controls and procedures designed to ensure that information required to be disclosed by an issuer in the reports that it files or submits under the Exchange Act is accumulated and communicated to the issuer’s management, including its principal executive and principal financial officers, or persons performing similar functions, as appropriate to allow timely decisions regarding required disclosure. Huntington’s management, with the participation of its Chief Executive Officer and the Chief Financial Officer, evaluated the effectiveness of Huntington’s disclosure controls and procedures (as such term is defined in Rules 13a-15(e) and 15d-15(e) under the Exchange Act) as of December 31, 2022. Based upon such evaluation, Huntington’s Chief Executive Officer and Chief Financial Officer have concluded that, as of December 31, 2022, Huntington’s disclosure controls and procedures were effective.
Internal Control Over Financial Reporting
Information required by this item is set forth in the Report of Management’s Assessment of Internal Control over Financial Reporting and the Report of Independent Registered Public Accounting Firm.
Changes in Internal Control Over Financial Reporting
There have not been any changes in our internal control over financial reporting (as such term is defined in Rules 13a-15(f) and 15d-15(f) under the Exchange Act) during the quarter ended December 31, 2022, that have materially affected, or are reasonably likely to materially affect, internal control over financial reporting.
Item 9B: Other Information
Not applicable.
Item 9C: Disclosure Regarding Foreign Jurisdictions that Prevent Inspections.
Not applicable.
PART III
We refer in Part III of this report to relevant sections of our 2023 Proxy Statement for the 2023 Annual Meeting of shareholders, which will be filed with the SEC pursuant to Regulation 14A within 120 days of the close of our 2022 fiscal year. Portions of our 2023 Proxy Statement, including the sections we refer to in this report, are incorporated by reference into this report.
Item 10: Directors, Executive Officers, and Corporate Governance
Information required by this item is set forth under the captions Election of Directors, Our Executive Officers, Family Relationships, Delinquent Section 16(a) Reports, Codes of Ethics, Proposals by Shareholders for the 2024 Annual Meeting, Recommendations for Directorship, and Board Committee Information of our 2023 Proxy Statement, which is incorporated by reference into this item.
Item 11: Executive Compensation
Information required by this item is set forth under the captions Compensation of Executive Officers and Compensation of Directors of our 2023 Proxy Statement, which is incorporated by reference into this item.
161 Huntington Bancshares Incorporated
Item 12: Security Ownership of Certain Beneficial Owners and Management and Related Stockholder Matters
The following table sets forth information about Huntington common stock authorized for issuance under Huntington’s existing equity compensation plans as of December 31, 2022.
| Plan Category (1) | Number of securities to be issued upon exercise of outstanding options, warrants, and rights (2)(3) (a) |
Weighted-average exercise price of outstanding options, warrants, and rights (4) (b) |
Number of securities remaining available for future issuance under equity compensation plans (excluding securities reflected in column (a)) (5) (c) |
|||||||||||||||||
| Equity compensation plans approved by security holders | 38,998,458 | $ | 4.07 | 20,602,866 | ||||||||||||||||
| Equity compensation plans not approved by security holders | — | — | — | |||||||||||||||||
| Total | 38,998,458 | $ | 4.07 | 20,602,866 | ||||||||||||||||
(1)All equity compensation plan authorizations for shares of common stock provide for the number of shares to be adjusted for stock splits, stock dividends, and other changes in capitalization. The Huntington 401(k) Plan, a broad-based plan qualified under Internal Revenue Code Section 401(a) which includes Huntington common stock as one of a number of investment options available to participants, is excluded from the table.
(2)The numbers in this column (a) reflect shares of common stock to be issued upon exercise of outstanding stock options and the vesting of outstanding awards of RSAs, RSUs, and PSUs, and the release of DSUs.
(3)As of December 31, 2022, an additional 2,274,680 common shares, at a weighted-average exercise price of $3.32, are to be issued upon exercise or vesting under the TCF Incentive Plan, which was assumed in the acquisition of TCF, is no longer active, and for which Huntington has not reserved the right to make subsequent grants or awards.
(4)The weighted-average exercise prices in this column are based on outstanding options and do not take into account unvested awards of RSAs, RSUs and PSUs and unreleased DSUs as these awards do not have an exercise price.
(5)The number of shares in this column (c) reflects the number of shares remaining available for future issuance under Huntington’s 2018 Plan, excluding shares reflected in column (a). The number of shares in this column (c) does not include shares of common stock to be issued under the following compensation plans: the Executive Deferred Compensation Plan, which provides senior officers designated by the Human Resources and Compensation Committee the opportunity to defer up to 90% of base salary, annual bonus compensation and certain equity awards, and up to 90% of long-term incentive awards; the Supplemental Plan under which voluntary participant contributions made by payroll deduction are used to purchase shares; the Deferred Compensation for Huntington Bancshares Incorporated Directors under which directors may defer their director compensation and such amounts may be invested in shares of common stock; and the Deferred Compensation Plan for directors (now inactive) under which directors of selected subsidiaries may defer their director compensation and such amounts may be invested in shares of Huntington common stock. These plans do not contain a limit on the number of shares that may be issued under them.
The information related to item 403 of regulation S-K is set forth under the caption Ownership of Voting Stock of our 2023 Proxy Statement, which is incorporated by reference into this item.
Item 13: Certain Relationships and Related Transactions, and Director Independence
Information required by this item is set forth under the captions Review, Approval, or Ratification of Transactions with Related Persons and Independence of Directors of our 2023 Proxy Statement, which are incorporated by reference into this item.
Item 14: Principal Accounting Fees and Services
Information required by this item is set forth under the caption Audit Matters of our 2023 Proxy Statement which is incorporated by reference into this item.
PART IV
Item 15: Exhibits and Financial Statement Schedules
Financial Statements and Financial Statement Schedules
Our consolidated financial statements required in response to this Item are incorporated by reference from Item 8 of this Report.
Exhibits
Our exhibits listed on the Exhibit Index of this Form 10-K are filed with this Report or are incorporated herein by reference.
Item 16: 10-K Summary
Not applicable.
2022 Form 10-K 162
Exhibit Index
This report incorporates by reference the documents listed below that we have previously filed with the SEC. The SEC allows us to incorporate by reference information in this document. The information incorporated by reference is considered to be a part of this document, except for any information that is superseded by information that is included directly in this document.
The SEC maintains an Internet web site that contains reports, proxy statements, and other information about issuers, like us, who file electronically with the SEC. The address of the site is http://www.sec.gov. The reports and other information filed by us with the SEC are also available free of charge at our Internet web site. The address of the site is http://www.huntington.com. Except as specifically incorporated by reference into this Annual Report on Form 10-K, information on those web sites is not part of this report. You also should be able to inspect reports, proxy statements, and other information about us at the offices of the Nasdaq National Market at 33 Whitehall Street, New York, New York 10004.
|
Exhibit
Number
|
Document Description | Report or Registration Statement |
SEC File or
Registration
Number
|
Exhibit
Reference
|
||||||||||
| 2.1 | ||||||||||||||
| 3.1 | ||||||||||||||
| 3.2 | ||||||||||||||
| 3.3 | ||||||||||||||
| 3.4 | ||||||||||||||
| 3.5 | ||||||||||||||
| 3.6 | ||||||||||||||
| 3.7 | ||||||||||||||
| 3.8 | ||||||||||||||
| 4.1 | Instruments defining the Rights of Security Holders — reference is made to Articles Fifth, Eighth, and Tenth of Articles of Restatement of Charter, as amended and supplemented. Instruments defining the rights of holders of long-term debt will be furnished to the Securities and Exchange Commission upon request. | |||||||||||||
| 4.2 | ||||||||||||||
| 10.1 | ||||||||||||||
| 10.2(P) | * Deferred Compensation Plan and Trust for Directors | Post-Effective Amendment No. 2 to Registration Statement on Form S-8 filed on January 28, 1991. | 33-10546 | 4(a) | ||||||||||
| 10.3 | ||||||||||||||
| 10.4 | ||||||||||||||
| 10.5 | ||||||||||||||
| 10.6 | ||||||||||||||
| 10.7 | ||||||||||||||
| 10.8 | ||||||||||||||
| 10.9 | ||||||||||||||
| 10.10 | ||||||||||||||
163 Huntington Bancshares Incorporated
| 10.11 | ||||||||||||||
| 10.12 | ||||||||||||||
| 10.13 | ||||||||||||||
| 10.14 | ||||||||||||||
| 10.15 | ||||||||||||||
| 10.16 | ||||||||||||||
| 10.17 | ||||||||||||||
| 10.18 | ||||||||||||||
| 10.19 | ||||||||||||||
| 10.20 | ||||||||||||||
| 10.21 | ||||||||||||||
| 10.22 | ||||||||||||||
| 10.23 | ||||||||||||||
| 10.24 | ||||||||||||||
| 10.25 | ||||||||||||||
| 10.26 | ||||||||||||||
| 10.27 | ||||||||||||||
| 10.28 | ||||||||||||||
| 10.29 | ||||||||||||||
| 10.30 | ||||||||||||||
| 10.31 | ||||||||||||||
| 10.32 | ||||||||||||||
| 10.33 | ||||||||||||||
| 10.34 | ||||||||||||||
| 10.35 | ||||||||||||||
| 10.36 | ||||||||||||||
| 10.37 | ||||||||||||||
| 10.38 | ||||||||||||||
| 10.39 | ||||||||||||||
| 10.40 | ||||||||||||||
2022 Form 10-K 164
| 10.41 | ||||||||||||||
| 10.42 | ||||||||||||||
| 10.43 | ||||||||||||||
| 14.1(P) | Code of Business Conduct and Ethics dated January 14, 2003 and revised on January 31, 2022 and Financial Code of Ethics for Chief Executive Officer and Senior Financial Officers, adopted January 18, 2003, and revised on October 20, 2015, are available on our website at http://www.huntington.com/About-Us/corporate-governance | |||||||||||||
| 101 |
The following material from Huntington’s Form 10-K Report for the year ended December 31, 2022, formatted in Inline XBRL: (1) Consolidated Balance Sheets, (2) Consolidated Statements of Income, (3), Consolidated Statements of Comprehensive Income, (4) Consolidated Statements of Changes in Shareholders’ Equity, (5) Consolidated Statements of Cash Flows, and (6) the Notes to the Consolidated Financial Statements.
|
|||||||||||||
| 104 |
Cover Page Interactive Data File - the cover page XBRL tags are embedded within the Inline XBRL document.
|
|||||||||||||
| * Denotes management contract or compensatory plan or arrangement. | ||||||||||||||
165 Huntington Bancshares Incorporated
Signatures
Pursuant to the requirements of Section 13 or 15(d) of the Securities Exchange Act of 1934, the Registrant has duly caused this report to be signed on its behalf by the undersigned, thereunto duly authorized, on the 17th Day of February, 2023.
HUNTINGTON BANCSHARES INCORPORATED
(Registrant)
| By: | /s/ Stephen D. Steinour | By: | /s/ Zachary Wasserman | |||||||||||||||||
| Stephen D. Steinour | Zachary Wasserman | |||||||||||||||||||
| Chairman, President, Chief Executive | Chief Financial Officer |
|||||||||||||||||||
| Officer, and Director (Principal Executive Officer) | (Principal Financial Officer) | |||||||||||||||||||
| By: | /s/ Nancy E. Maloney | |||||||||||||||||||
| Nancy E. Maloney | ||||||||||||||||||||
| Executive Vice President, Controller | ||||||||||||||||||||
| (Principal Accounting Officer) | ||||||||||||||||||||
Pursuant to the requirements of the Securities Exchange Act of 1934, this report has been signed below by the following persons on behalf of the Registrant and in the capacities indicated on the 17th Day of February, 2023.
| Lizabeth Ardisana * | |||||
| Lizabeth Ardisana | |||||
| Director | |||||
| Alanna Y. Cotton * | |||||
| Alanna Y. Cotton | |||||
| Director | |||||
| Ann B. Crane * | |||||
| Ann B. Crane | |||||
| Director | |||||
| Robert S. Cubbin * | |||||
| Robert S. Cubbin | |||||
| Director | |||||
| Gina D. France * | |||||
| Gina D. France | |||||
| Director | |||||
| J. Michael Hochschwender * | |||||
| J. Michael Hochschwender | |||||
| Director | |||||
2022 Form 10-K 166
| Richard H. King * | |||||
| Richard H. King | |||||
| Director | |||||
| Katherine M.A. Kline * | |||||
| Katherine M.A. Kline | |||||
| Director | |||||
| Richard W. Neu * | |||||
| Richard W. Neu | |||||
| Director | |||||
| Kenneth J. Phelan * | |||||
| Kenneth J. Phelan | |||||
| Director | |||||
| David L. Porteous * | |||||
| David L. Porteous | |||||
| Director | |||||
| Roger J. Sit * | |||||
| Roger J. Sit | |||||
| Director | |||||
| Jeffrey L. Tate * | |||||
| Jeffrey L. Tate | |||||
| Director | |||||
| Gary Torgow * | |||||
| Gary Torgow | |||||
| Director | |||||
| */s/ Jana J. Litsey | |||||
| Jana J. Litsey | |||||
| Attorney-in-fact for each of the persons indicated | |||||
167 Huntington Bancshares Incorporated