EX-99.1
Published on November 10, 2022
2022 Investor Day November 10, 2022
Safe Harbor and Forward-Looking Statements CAUTION REGARDING FORWARD-LOOKING STATEMENTS This communication contains certain forward-looking statements, including, but not limited to, certain plans, expectations, goals, projections, and statements, which are not historical facts and are subject to numerous assumptions, risks, and uncertainties. Statements that do not describe historical or current facts, including statements about beliefs and expectations, are forward-looking statements. Forward-looking statements may be identified by words such as expect, anticipate, believe, intend, estimate, plan, target, goal, or similar expressions, or future or conditional verbs such as will, may, might, should, would, could, or similar variations. The forward-looking statements are intended to be subject to the safe harbor provided by Section 27A of the Securities Act of 1933, Section 21E of the Securities Exchange Act of 1934, and the Private Securities Litigation Reform Act of 1995. While there is no assurance that any list of risks and uncertainties or risk factors is complete, below are certain factors which could cause actual results to differ materially from those contained or implied in the forward-looking statements: changes in general economic, political, or industry conditions; the magnitude and duration of the COVID-19 pandemic and related variants and mutations and their impact on the global economy and financial market conditions and our business, results of operations, and financial condition; uncertainty in U.S. fiscal and monetary policy, including the interest rate policies of the Federal Reserve Board; volatility and disruptions in global capital and credit markets; movements in interest rates; reform of LIBOR; competitive pressures on product pricing and services; success, impact, and timing of our business strategies, including market acceptance of any new products or services including those implementing our “Fair Play” banking philosophy; the nature, extent, timing, and results of governmental actions, examinations, reviews, reforms, regulations, and interpretations, including those related to the Dodd-Frank Wall Street Reform and Consumer Protection Act and the Basel III regulatory capital reforms, as well as those involving the OCC, Federal Reserve, FDIC, and CFPB; the possibility that the anticipated benefits of the transaction with TCF are not realized when expected or at all, including as a result of the impact of, or problems arising from, the integration of the two companies or as a result of the strength of the economy and competitive factors in the areas where Huntington does business; and other factors that may affect the future results of Huntington. Additional factors that could cause results to differ materially from those described above can be found in Huntington’s Annual Report on Form 10-K for the year ended December 31, 2021, and in its subsequent Quarterly Reports on Form 10-Q for the quarters ended March 31, 2022, June 30, 2022, and September 30, 2022, each of which is on file with the Securities and Exchange Commission (the “SEC”) and available in the “Investor Relations” section of Huntington’s website (www.huntington.com) under the heading “Publications and Filings” and in other documents Huntington files with the SEC. All forward-looking statements speak only as of the date they are made and are based on information available at that time. Huntington does not assume any obligation to update forward-looking statements to reflect circumstances or events that occur after the date the forward-looking statements were made or to reflect the occurrence of unanticipated events except as required by federal securities laws. As forward-looking statements involve significant risks and uncertainties, caution should be exercised against placing undue reliance on such statements. 2
Welcome and Opening Remarks Tim Sedabres EVP, Head of Investor Relations
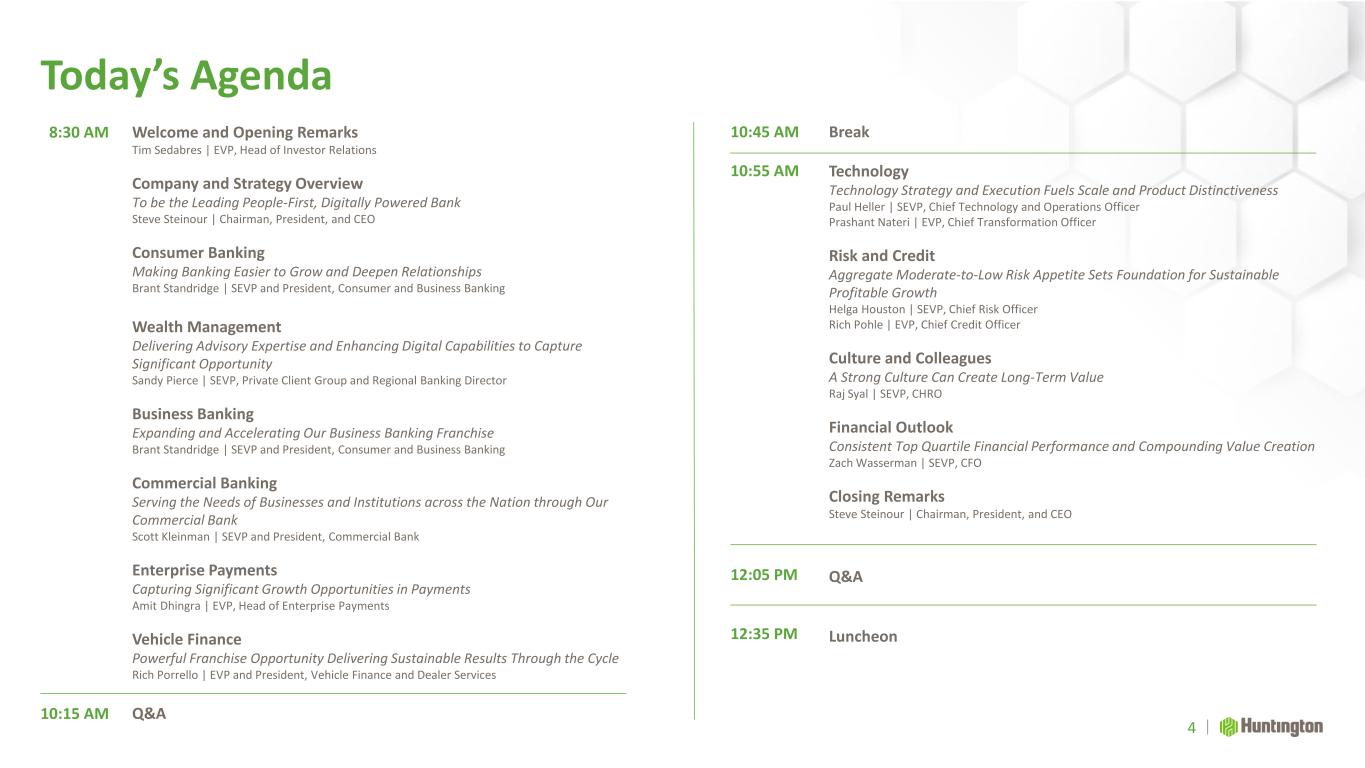
Today’s Agenda 4 8:30 AM 10:45 AM Break Technology Technology Strategy and Execution Fuels Scale and Product Distinctiveness Paul Heller | SEVP, Chief Technology and Operations Officer Prashant Nateri | EVP, Chief Transformation Officer Risk and Credit Aggregate Moderate-to-Low Risk Appetite Sets Foundation for Sustainable Profitable Growth Helga Houston | SEVP, Chief Risk Officer Rich Pohle | EVP, Chief Credit Officer Culture and Colleagues A Strong Culture Can Create Long-Term Value Raj Syal | SEVP, CHRO Financial Outlook Consistent Top Quartile Financial Performance and Compounding Value Creation Zach Wasserman | SEVP, CFO Closing Remarks Steve Steinour | Chairman, President, and CEO Q&A Luncheon 10:15 AM 10:55 AM 12:05 PM 12:35 PM Welcome and Opening Remarks Tim Sedabres | EVP, Head of Investor Relations Company and Strategy Overview To be the Leading People-First, Digitally Powered Bank Steve Steinour | Chairman, President, and CEO Consumer Banking Making Banking Easier to Grow and Deepen Relationships Brant Standridge | SEVP and President, Consumer and Business Banking Wealth Management Delivering Advisory Expertise and Enhancing Digital Capabilities to Capture Significant Opportunity Sandy Pierce | SEVP, Private Client Group and Regional Banking Director Business Banking Expanding and Accelerating Our Business Banking Franchise Brant Standridge | SEVP and President, Consumer and Business Banking Commercial Banking Serving the Needs of Businesses and Institutions across the Nation through Our Commercial Bank Scott Kleinman | SEVP and President, Commercial Bank Enterprise Payments Capturing Significant Growth Opportunities in Payments Amit Dhingra | EVP, Head of Enterprise Payments Vehicle Finance Powerful Franchise Opportunity Delivering Sustainable Results Through the Cycle Rich Porrello | EVP and President, Vehicle Finance and Dealer Services Q&A
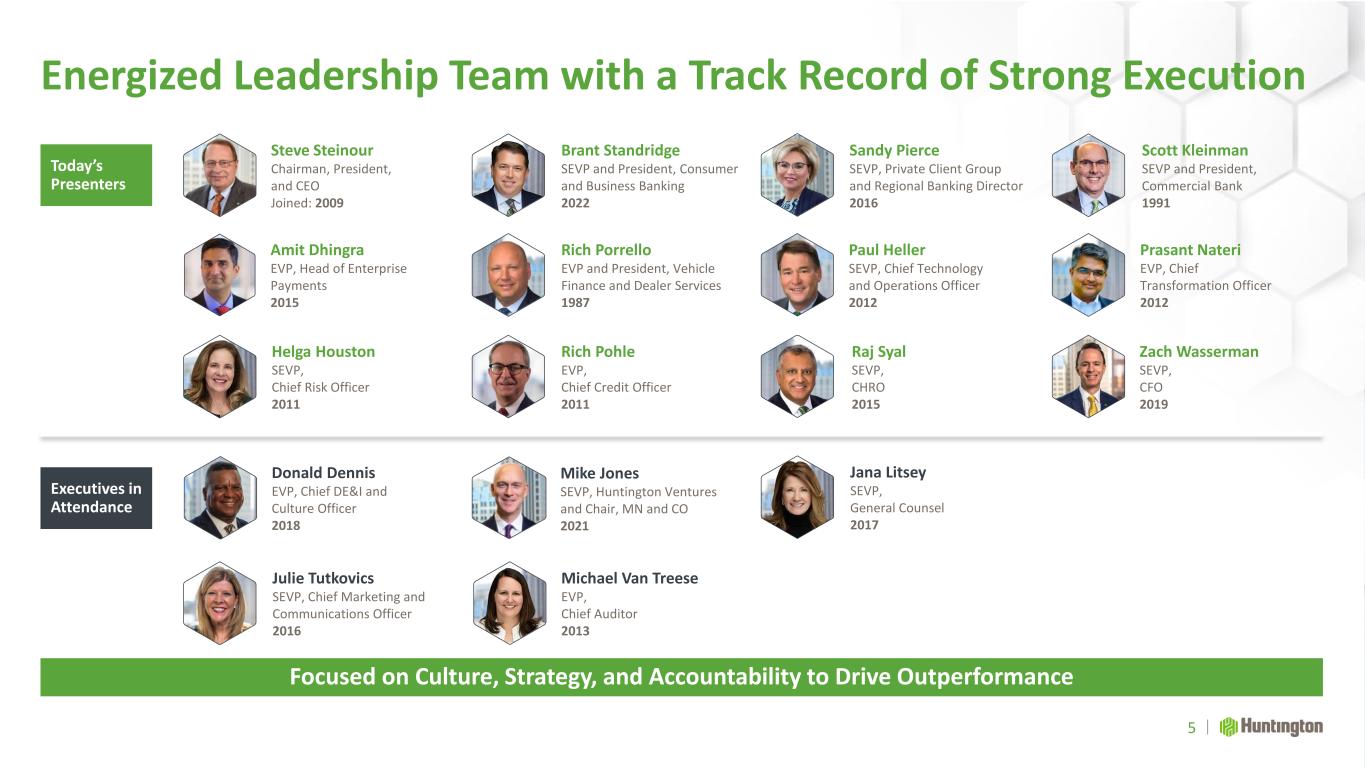
Energized Leadership Team with a Track Record of Strong Execution 5 Focused on Culture, Strategy, and Accountability to Drive Outperformance Today’s Presenters Jana Litsey SEVP, General Counsel 2017 Julie Tutkovics SEVP, Chief Marketing and Communications Officer 2016 Executives in Attendance Michael Van Treese EVP, Chief Auditor 2013 Steve Steinour Chairman, President, and CEO Joined: 2009 Zach Wasserman SEVP, CFO 2019 Brant Standridge SEVP and President, Consumer and Business Banking 2022 Scott Kleinman SEVP and President, Commercial Bank 1991 Amit Dhingra EVP, Head of Enterprise Payments 2015 Helga Houston SEVP, Chief Risk Officer 2011 Rich Pohle EVP, Chief Credit Officer 2011 Sandy Pierce SEVP, Private Client Group and Regional Banking Director 2016 Rich Porrello EVP and President, Vehicle Finance and Dealer Services 1987 Paul Heller SEVP, Chief Technology and Operations Officer 2012 Prasant Nateri EVP, Chief Transformation Officer 2012 Raj Syal SEVP, CHRO 2015 Donald Dennis EVP, Chief DE&I and Culture Officer 2018 Mike Jones SEVP, Huntington Ventures and Chair, MN and CO 2021
Company and Strategy Overview To be the Leading People-First, Digitally Powered Bank Steve Steinour Chairman, President, and CEO
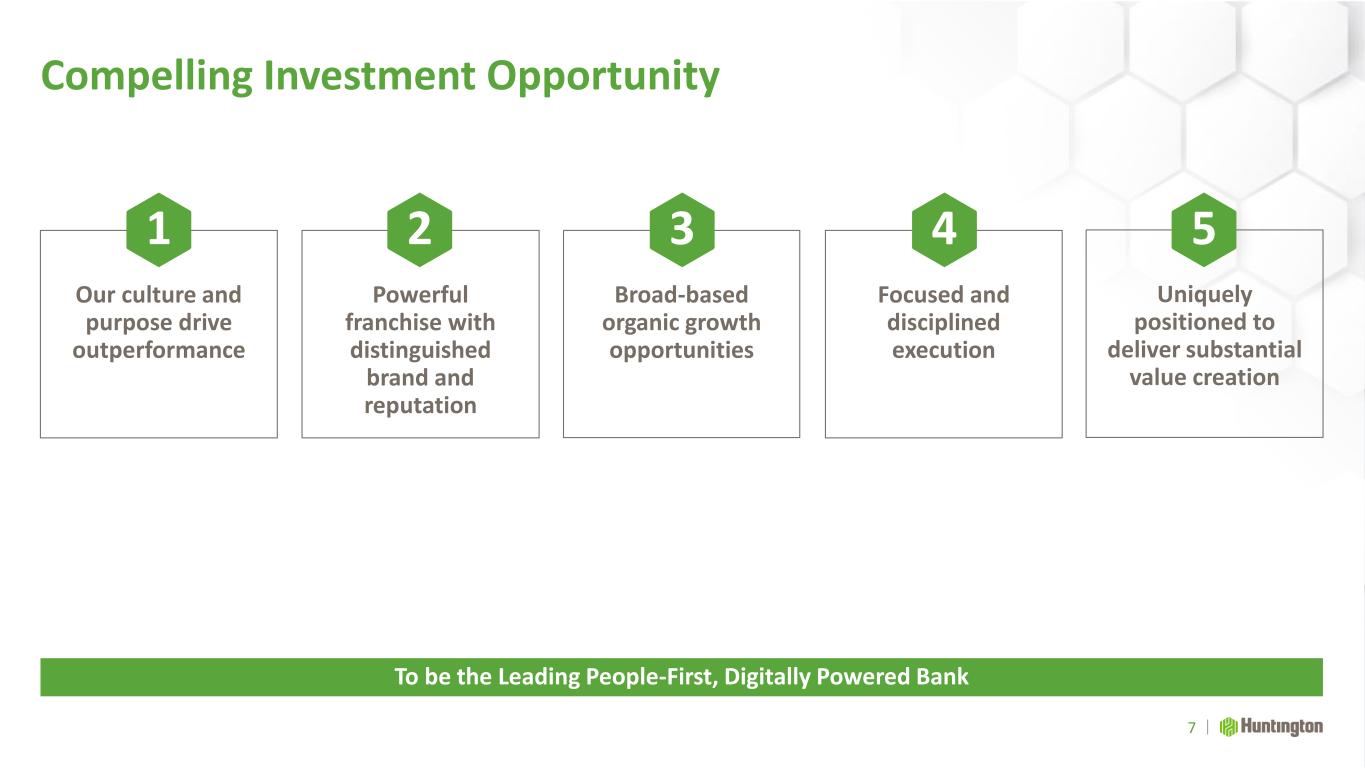
Compelling Investment Opportunity 7 To be the Leading People-First, Digitally Powered Bank Focused and disciplined execution Broad-based organic growth opportunities Powerful franchise with distinguished brand and reputation Our culture and purpose drive outperformance Uniquely positioned to deliver substantial value creation 1 2 3 4 5
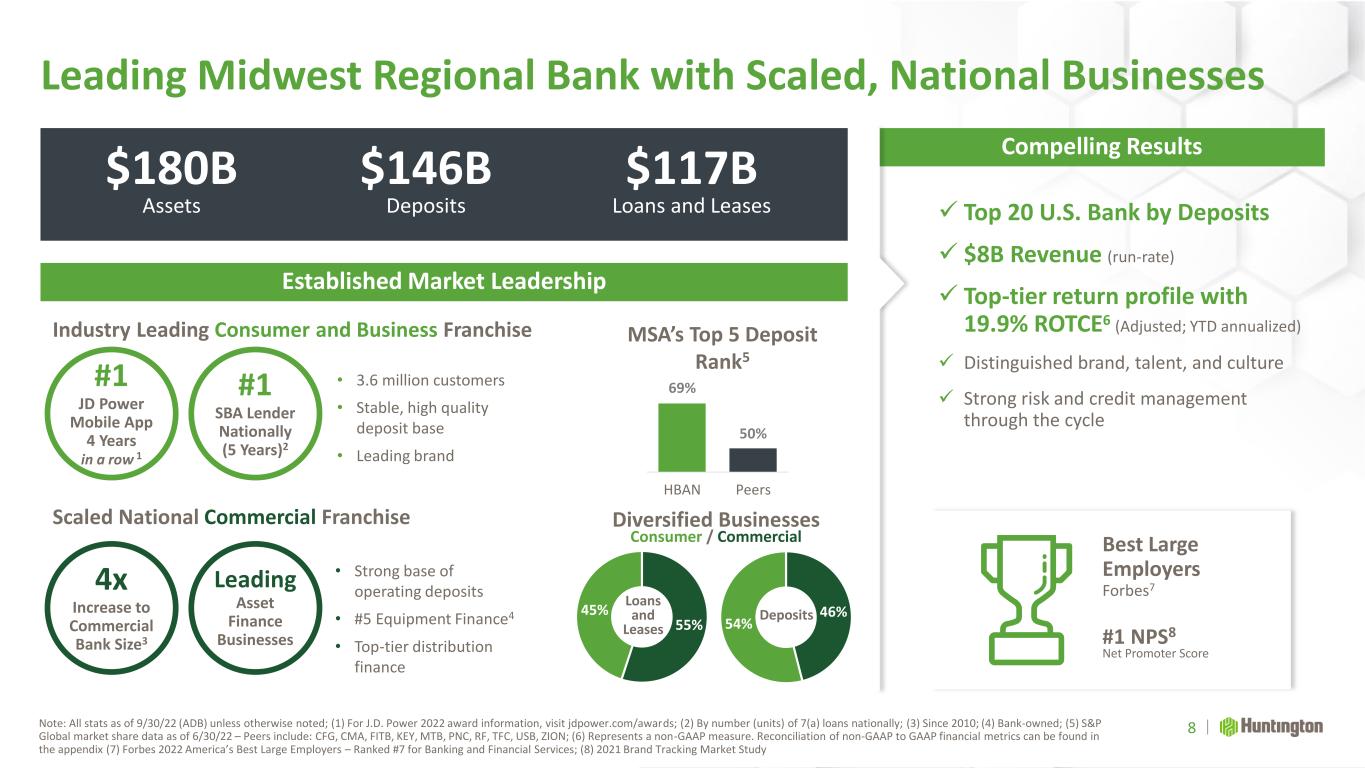
46% 54% #1 SBA Lender Nationally (5 Years)2 #1 NPS8 Net Promoter Score 4x Increase to Commercial Bank Size3 Leading Asset Finance Businesses Best Large Employers Forbes7 #1 JD Power Mobile App 4 Years in a row 1 Leading Midwest Regional Bank with Scaled, National Businesses Note: All stats as of 9/30/22 (ADB) unless otherwise noted; (1) For J.D. Power 2022 award information, visit jdpower.com/awards; (2) By number (units) of 7(a) loans nationally; (3) Since 2010; (4) Bank-owned; (5) S&P Global market share data as of 6/30/22 – Peers include: CFG, CMA, FITB, KEY, MTB, PNC, RF, TFC, USB, ZION; (6) Represents a non-GAAP measure. Reconciliation of non-GAAP to GAAP financial metrics can be found in the appendix (7) Forbes 2022 America’s Best Large Employers – Ranked #7 for Banking and Financial Services; (8) 2021 Brand Tracking Market Study 8 $180B Assets $146B Deposits $117B Loans and Leases 69% 50% HBAN Peers MSA’s Top 5 Deposit Rank5 ✓ Top 20 U.S. Bank by Deposits ✓ $8B Revenue (run-rate) ✓ Top-tier return profile with 19.9% ROTCE6 (Adjusted; YTD annualized) ✓ Distinguished brand, talent, and culture ✓ Strong risk and credit management through the cycle Established Market Leadership Compelling Results Industry Leading Consumer and Business Franchise Scaled National Commercial Franchise 55% 45% Loans and Leases Deposits Diversified Businesses Consumer / Commercial • 3.6 million customers • Stable, high quality deposit base • Leading brand • Strong base of operating deposits • #5 Equipment Finance4 • Top-tier distribution finance
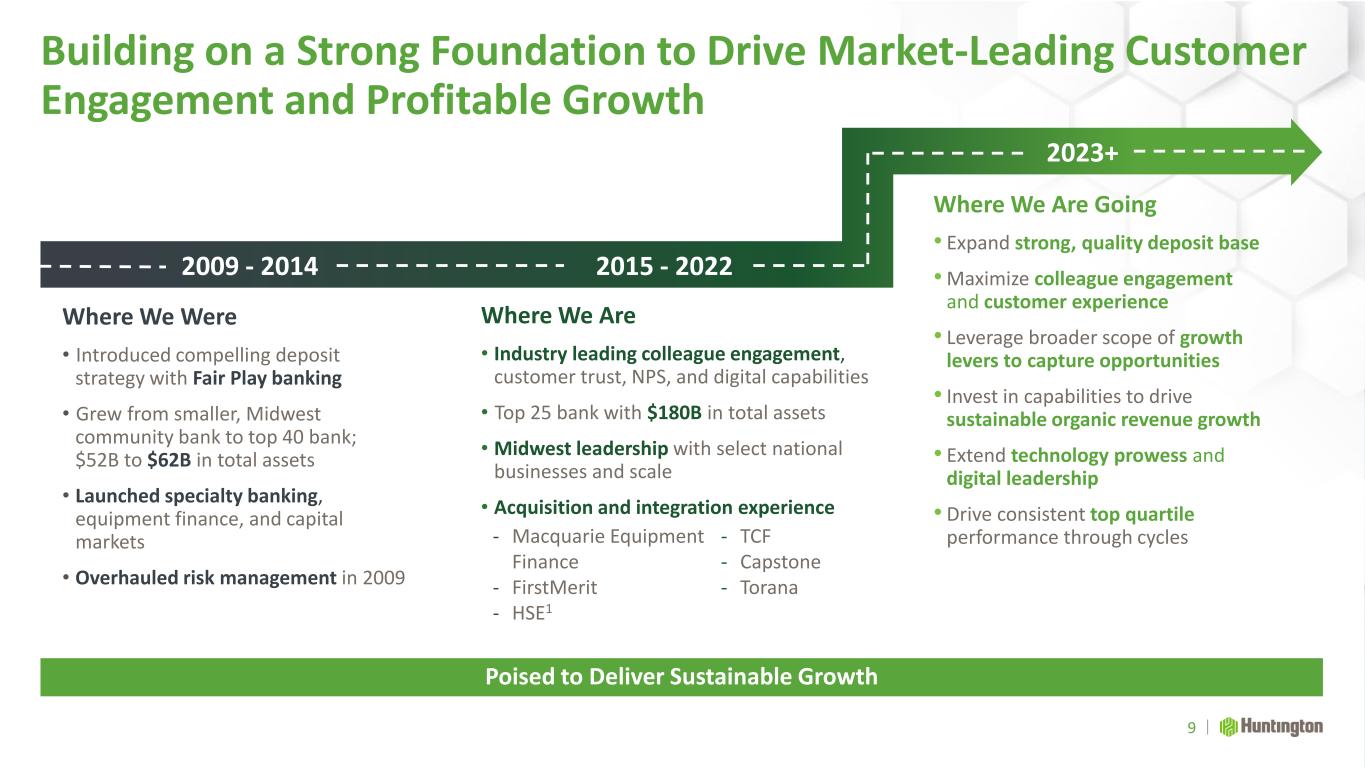
Building on a Strong Foundation to Drive Market-Leading Customer Engagement and Profitable Growth 9 Poised to Deliver Sustainable Growth Where We Were • Introduced compelling deposit strategy with Fair Play banking • Grew from smaller, Midwest community bank to top 40 bank; $52B to $62B in total assets • Launched specialty banking, equipment finance, and capital markets • Overhauled risk management in 2009 Where We Are • Industry leading colleague engagement, customer trust, NPS, and digital capabilities • Top 25 bank with $180B in total assets • Midwest leadership with select national businesses and scale • Acquisition and integration experience Where We Are Going • Expand strong, quality deposit base •Maximize colleague engagement and customer experience • Leverage broader scope of growth levers to capture opportunities • Invest in capabilities to drive sustainable organic revenue growth • Extend technology prowess and digital leadership • Drive consistent top quartile performance through cycles 2023+ 2009 - 2014 2015 - 2022 - Macquarie Equipment Finance - FirstMerit - HSE1 - TCF - Capstone - Torana
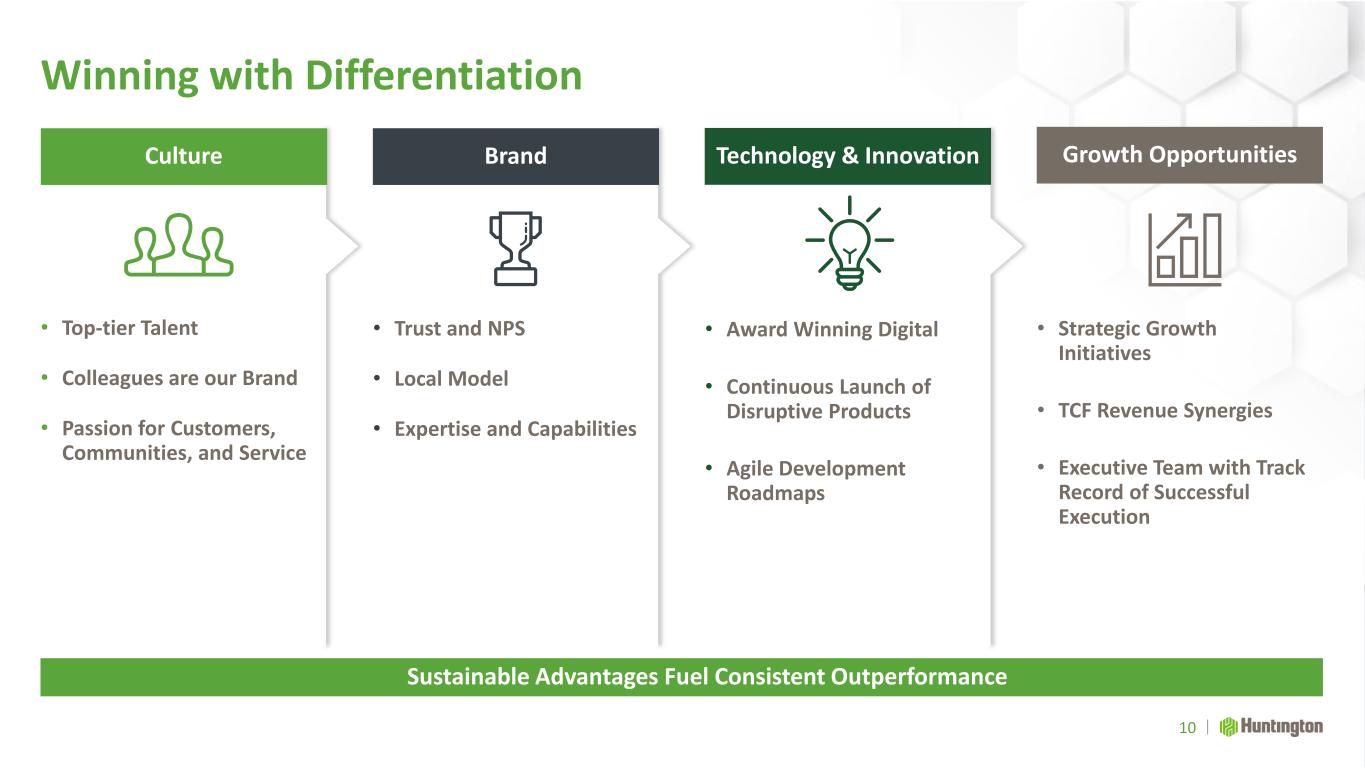
Winning with Differentiation Sustainable Advantages Fuel Consistent Outperformance • Strategic Growth Initiatives • TCF Revenue Synergies • Executive Team with Track Record of Successful Execution • Award Winning Digital • Continuous Launch of Disruptive Products • Agile Development Roadmaps • Top-tier Talent • Colleagues are our Brand • Passion for Customers, Communities, and Service Culture Brand 10 Technology & Innovation Growth Opportunities • Trust and NPS • Local Model • Expertise and Capabilities
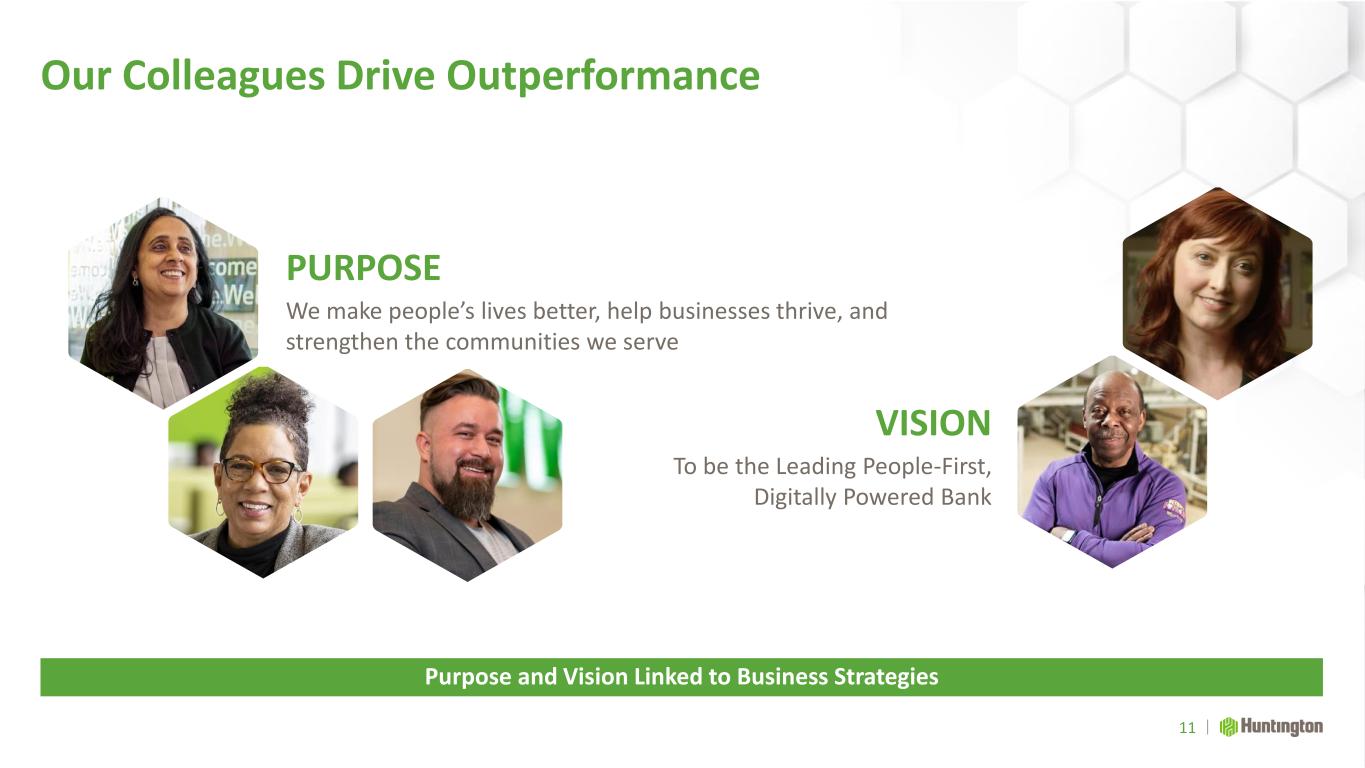
Our Colleagues Drive Outperformance 11 Purpose and Vision Linked to Business Strategies PURPOSE We make people’s lives better, help businesses thrive, and strengthen the communities we serve VISION To be the Leading People-First, Digitally Powered Bank
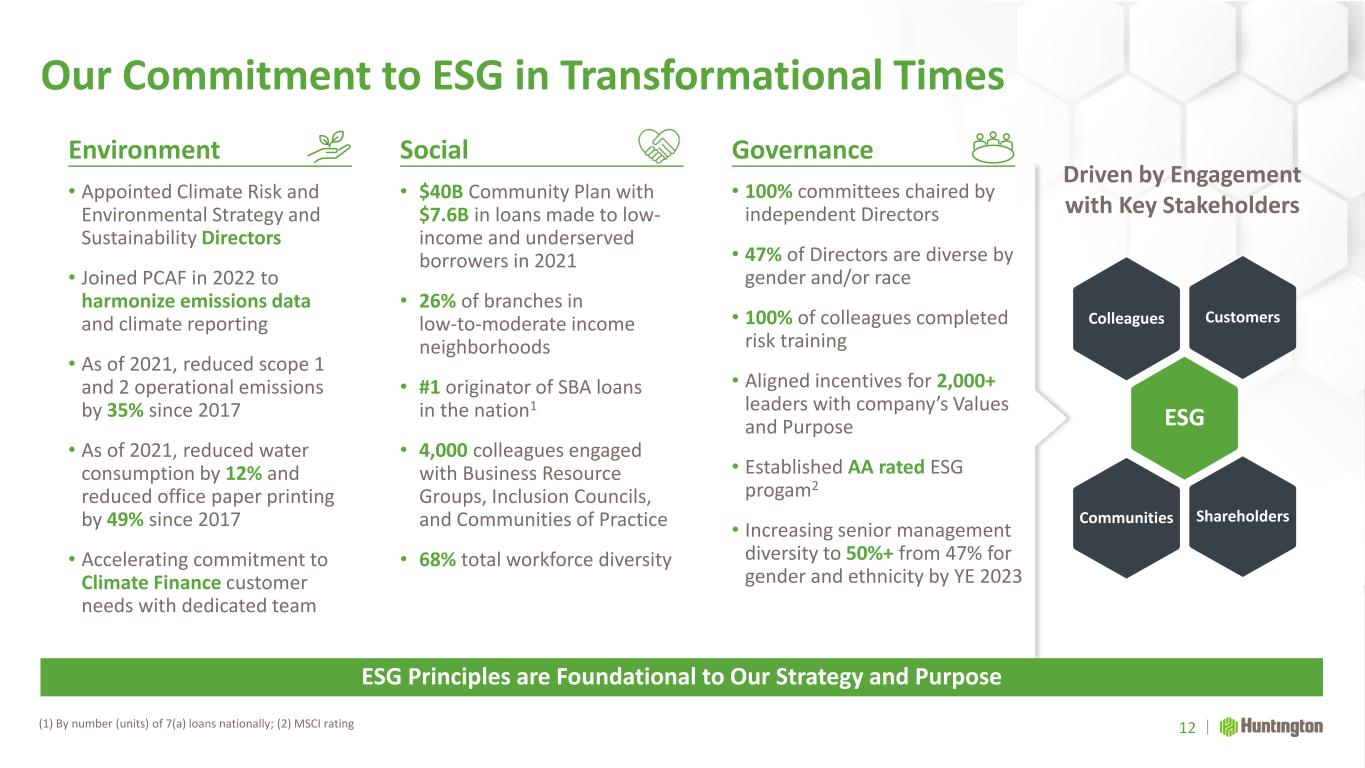
Our Commitment to ESG in Transformational Times (1) By number (units) of 7(a) loans nationally; (2) MSCI rating 12 ESG Principles are Foundational to Our Strategy and Purpose Driven by Engagement with Key Stakeholders Colleagues Customers ESG Communities Shareholders Environment Social Governance • Appointed Climate Risk and Environmental Strategy and Sustainability Directors • Joined PCAF in 2022 to harmonize emissions data and climate reporting • As of 2021, reduced scope 1 and 2 operational emissions by 35% since 2017 • As of 2021, reduced water consumption by 12% and reduced office paper printing by 49% since 2017 • Accelerating commitment to Climate Finance customer needs with dedicated team • $40B Community Plan with $7.6B in loans made to low- income and underserved borrowers in 2021 • 26% of branches in low-to-moderate income neighborhoods • #1 originator of SBA loans in the nation1 • 4,000 colleagues engaged with Business Resource Groups, Inclusion Councils, and Communities of Practice • 68% total workforce diversity • 100% committees chaired by independent Directors • 47% of Directors are diverse by gender and/or race • 100% of colleagues completed risk training • Aligned incentives for 2,000+ leaders with company’s Values and Purpose • Established AA rated ESG progam2 • Increasing senior management diversity to 50%+ from 47% for gender and ethnicity by YE 2023
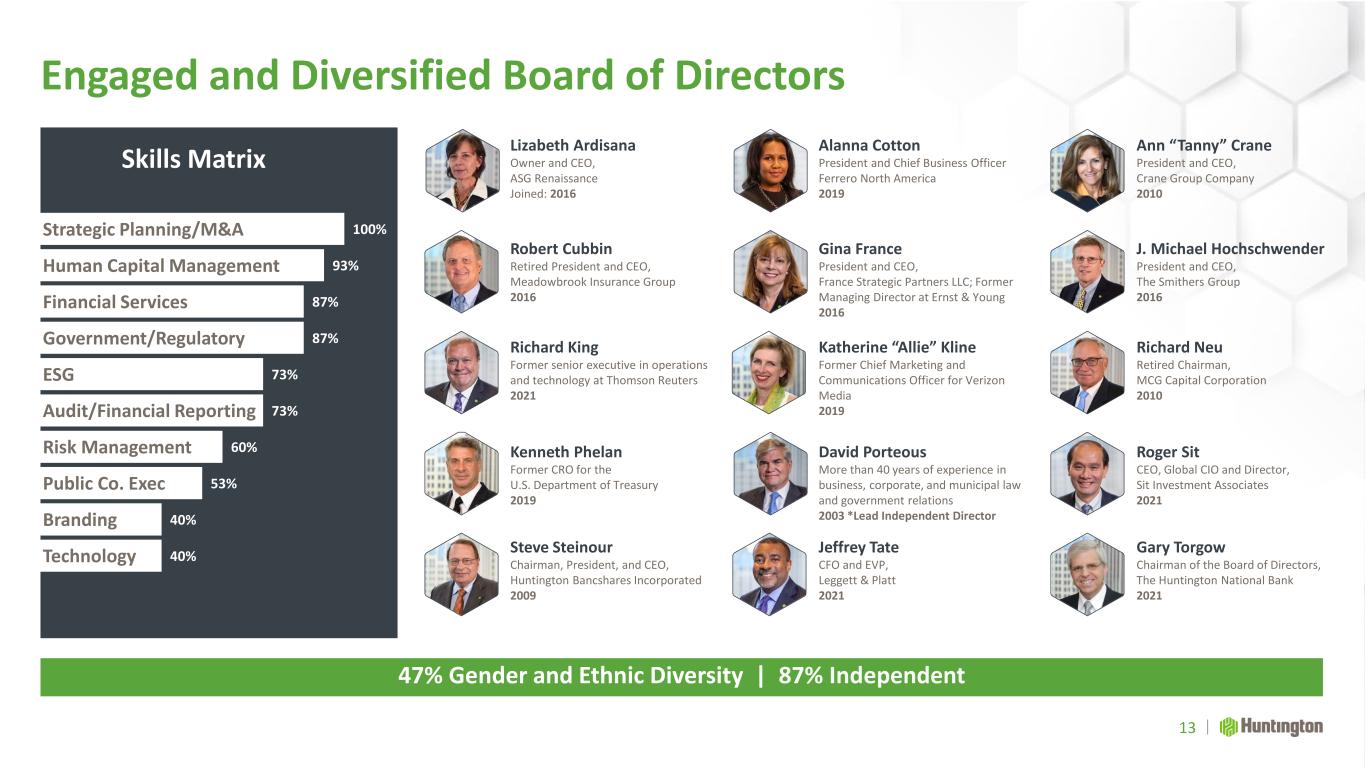
Engaged and Diversified Board of Directors 13 47% Gender and Ethnic Diversity | 87% Independent 100% 93% 87% 87% 73% 73% 60% 53% 40% 40% Skills Matrix Government/Regulatory ESG Public Co. Exec Strategic Planning/M&A Human Capital Management Financial Services Risk Management Branding Technology Audit/Financial Reporting Richard Neu Retired Chairman, MCG Capital Corporation 2010 Roger Sit CEO, Global CIO and Director, Sit Investment Associates 2021 Gary Torgow Chairman of the Board of Directors, The Huntington National Bank 2021 Ann “Tanny” Crane President and CEO, Crane Group Company 2010 Katherine “Allie” Kline Former Chief Marketing and Communications Officer for Verizon Media 2019 David Porteous More than 40 years of experience in business, corporate, and municipal law and government relations 2003 *Lead Independent Director Jeffrey Tate CFO and EVP, Leggett & Platt 2021 Alanna Cotton President and Chief Business Officer Ferrero North America 2019 Gina France President and CEO, France Strategic Partners LLC; Former Managing Director at Ernst & Young 2016 J. Michael Hochschwender President and CEO, The Smithers Group 2016 Richard King Former senior executive in operations and technology at Thomson Reuters 2021 Kenneth Phelan Former CRO for the U.S. Department of Treasury 2019 Steve Steinour Chairman, President, and CEO, Huntington Bancshares Incorporated 2009 Robert Cubbin Retired President and CEO, Meadowbrook Insurance Group 2016 Lizabeth Ardisana Owner and CEO, ASG Renaissance Joined: 2016
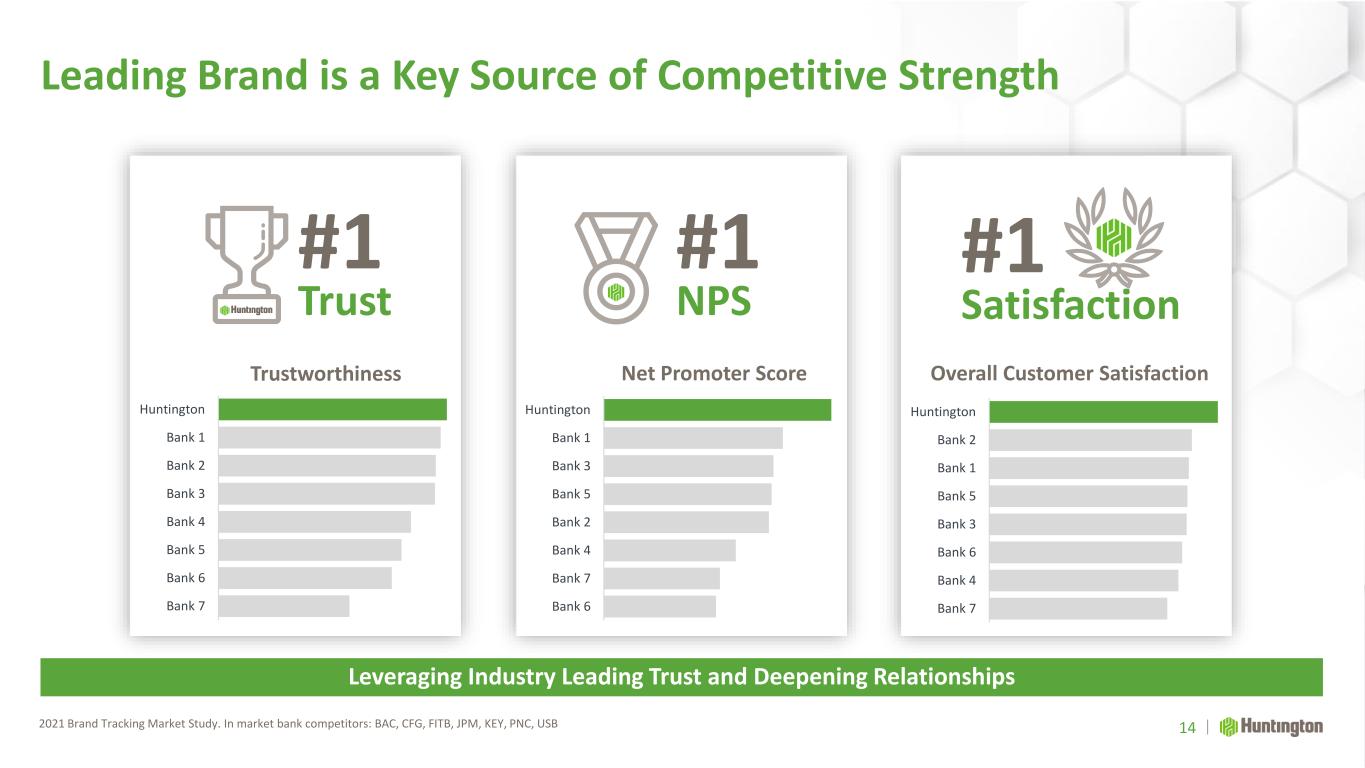
Leading Brand is a Key Source of Competitive Strength 2021 Brand Tracking Market Study. In market bank competitors: BAC, CFG, FITB, JPM, KEY, PNC, USB 14 Leveraging Industry Leading Trust and Deepening Relationships Huntington Bank 1 Bank 3 Bank 5 Bank 2 Bank 4 Bank 7 Bank 6 Huntington Bank 1 Bank 2 Bank 3 Bank 4 Bank 5 Bank 6 Bank 7 Huntington Bank 2 Bank 1 Bank 5 Bank 3 Bank 6 Bank 4 Bank 7 #1 Trust #1 NPS Trustworthiness Net Promoter Score Overall Customer Satisfaction #1 Satisfaction
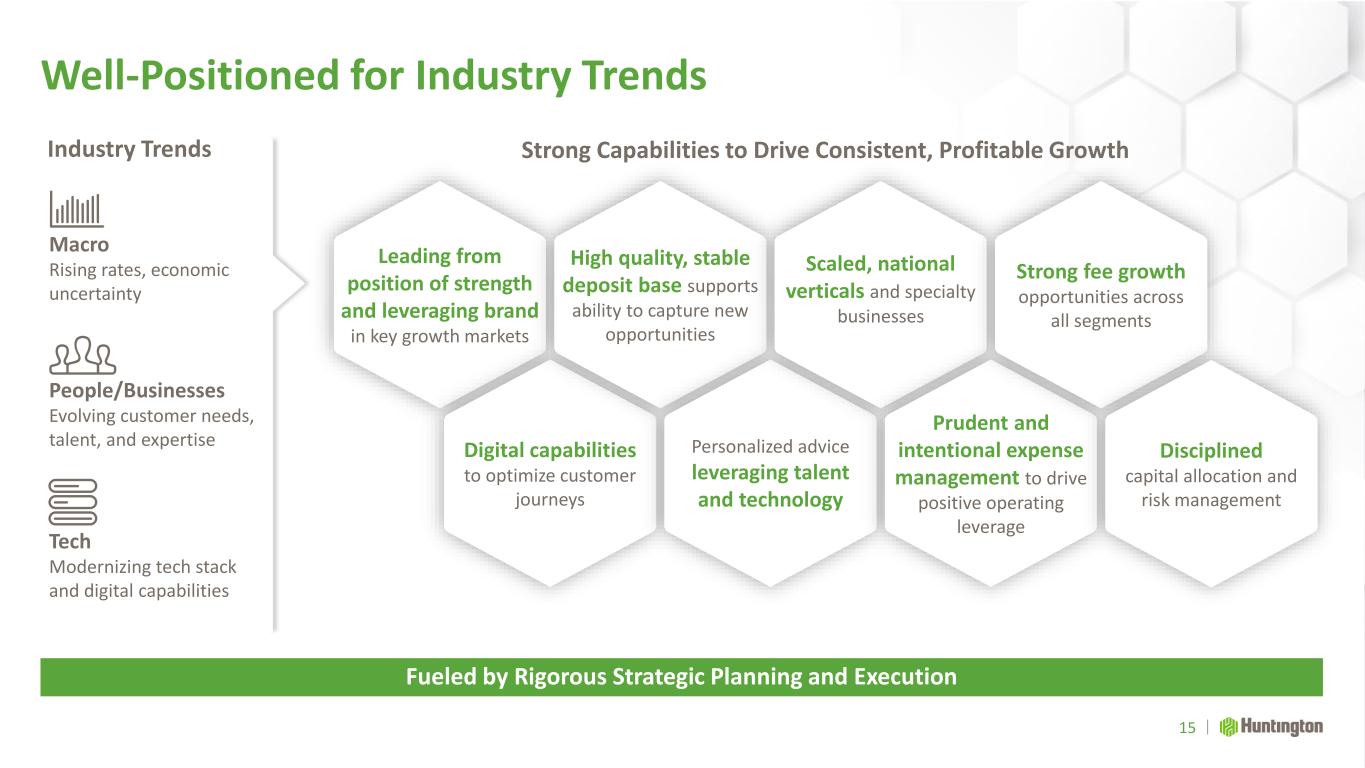
Well-Positioned for Industry Trends 15 Fueled by Rigorous Strategic Planning and Execution Strong Capabilities to Drive Consistent, Profitable Growth People/Businesses Evolving customer needs, talent, and expertise Tech Modernizing tech stack and digital capabilities Industry Trends Macro Rising rates, economic uncertainty Leading from position of strength and leveraging brand in key growth markets Digital capabilities to optimize customer journeys High quality, stable deposit base supports ability to capture new opportunities Personalized advice leveraging talent and technology Scaled, national verticals and specialty businesses Prudent and intentional expense management to drive positive operating leverage Strong fee growth opportunities across all segments Disciplined capital allocation and risk management
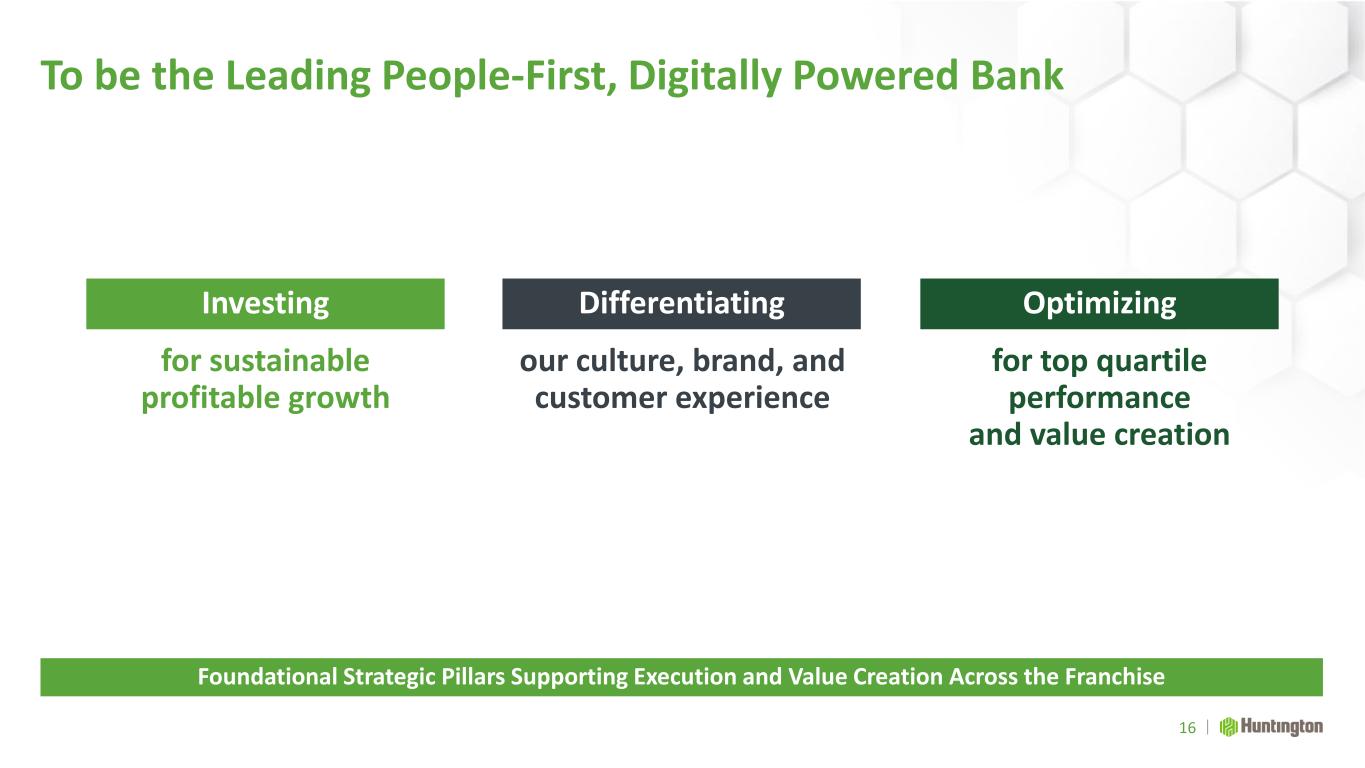
To be the Leading People-First, Digitally Powered Bank 16 Foundational Strategic Pillars Supporting Execution and Value Creation Across the Franchise Investing Optimizing Differentiating for sustainable profitable growth for top quartile performance and value creation our culture, brand, and customer experience
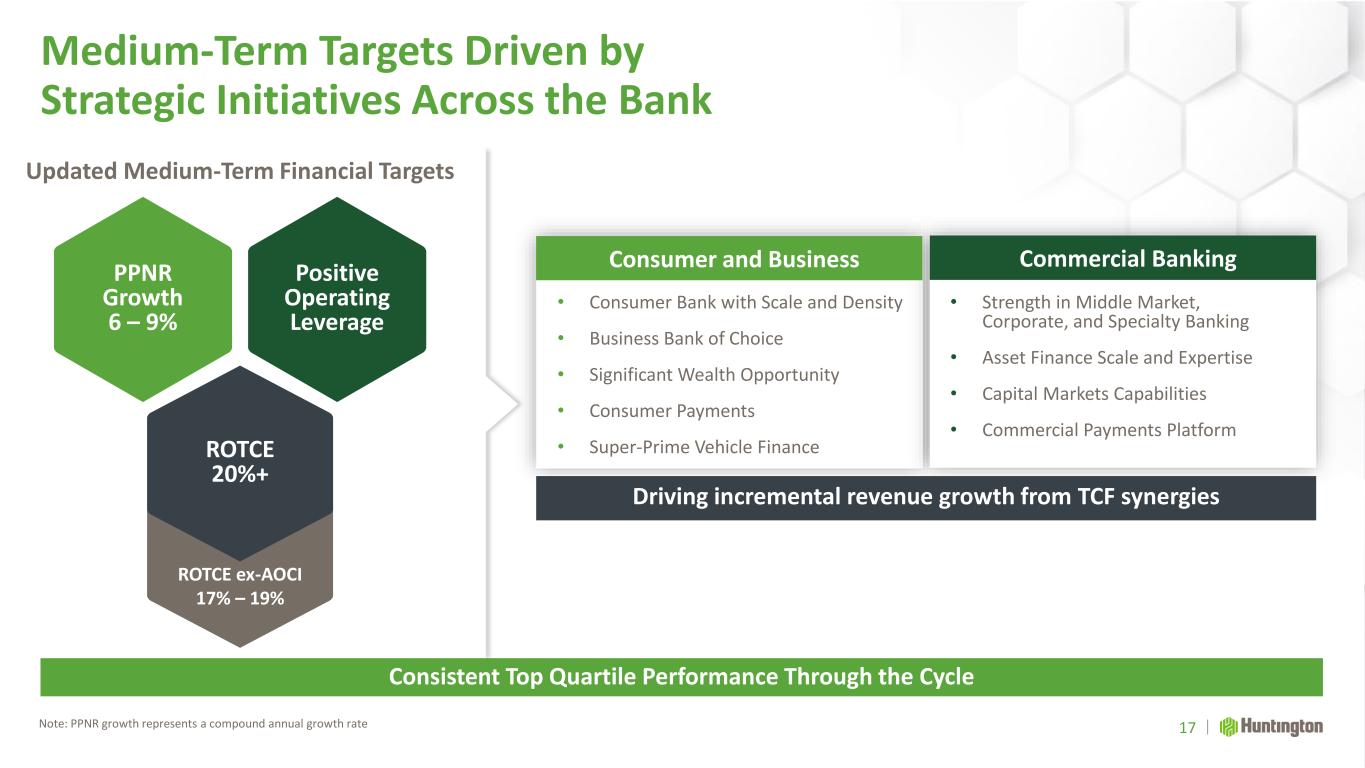
PPNR Growth 6 – 9% Positive Operating Leverage ROTCE ex-AOCI 17% – 19% ROTCE 20%+ Medium-Term Targets Driven by Strategic Initiatives Across the Bank 17 Consistent Top Quartile Performance Through the Cycle • Strength in Middle Market, Corporate, and Specialty Banking • Asset Finance Scale and Expertise • Capital Markets Capabilities • Commercial Payments Platform • Consumer Bank with Scale and Density • Business Bank of Choice • Significant Wealth Opportunity • Consumer Payments • Super-Prime Vehicle Finance Consumer and Business Commercial Banking Driving incremental revenue growth from TCF synergies Updated Medium-Term Financial Targets Note: PPNR growth represents a compound annual growth rate
Consumer Banking Making Banking Easier to Grow and Deepen Relationships Brant Standridge SEVP and President, Consumer and Business Banking
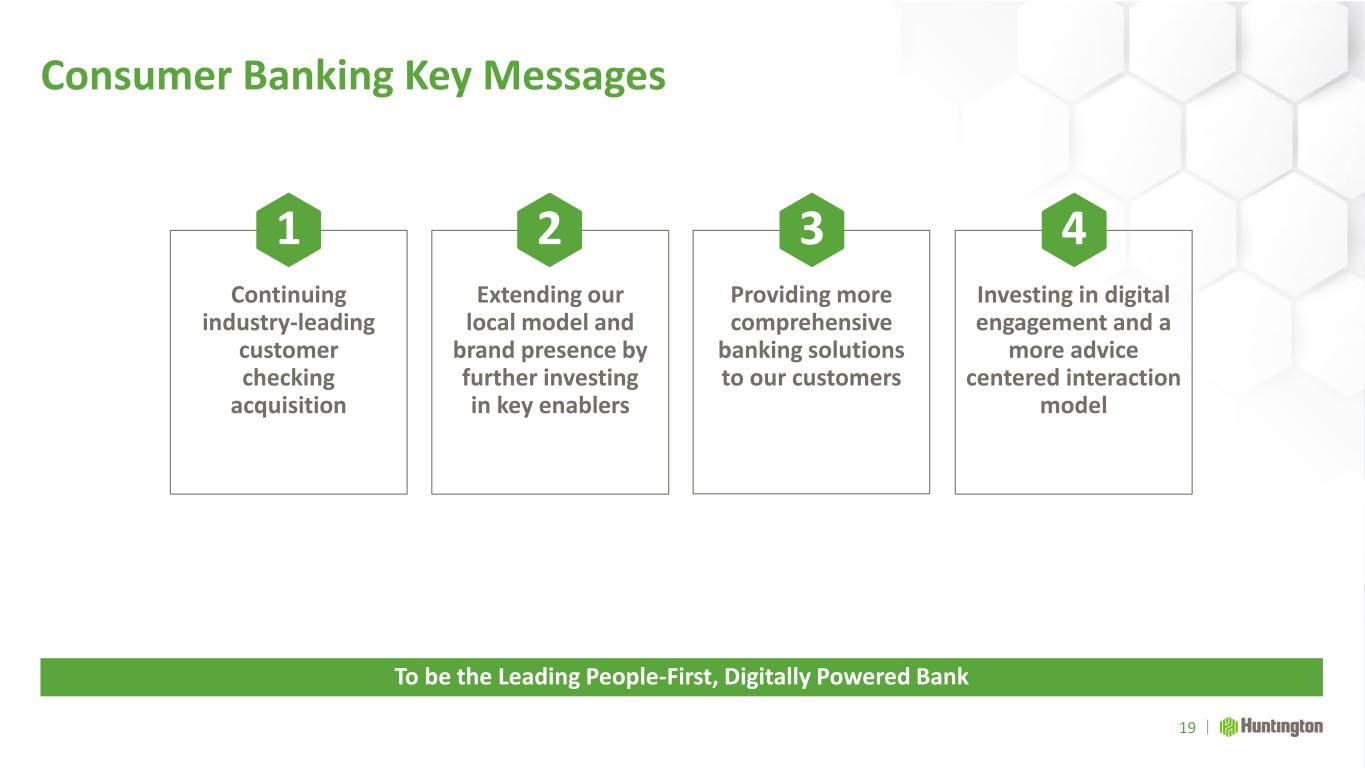
Consumer Banking Key Messages To be the Leading People-First, Digitally Powered Bank Investing in digital engagement and a more advice centered interaction model Providing more comprehensive banking solutions to our customers Extending our local model and brand presence by further investing in key enablers Continuing industry-leading customer checking acquisition 1 2 3 4 19
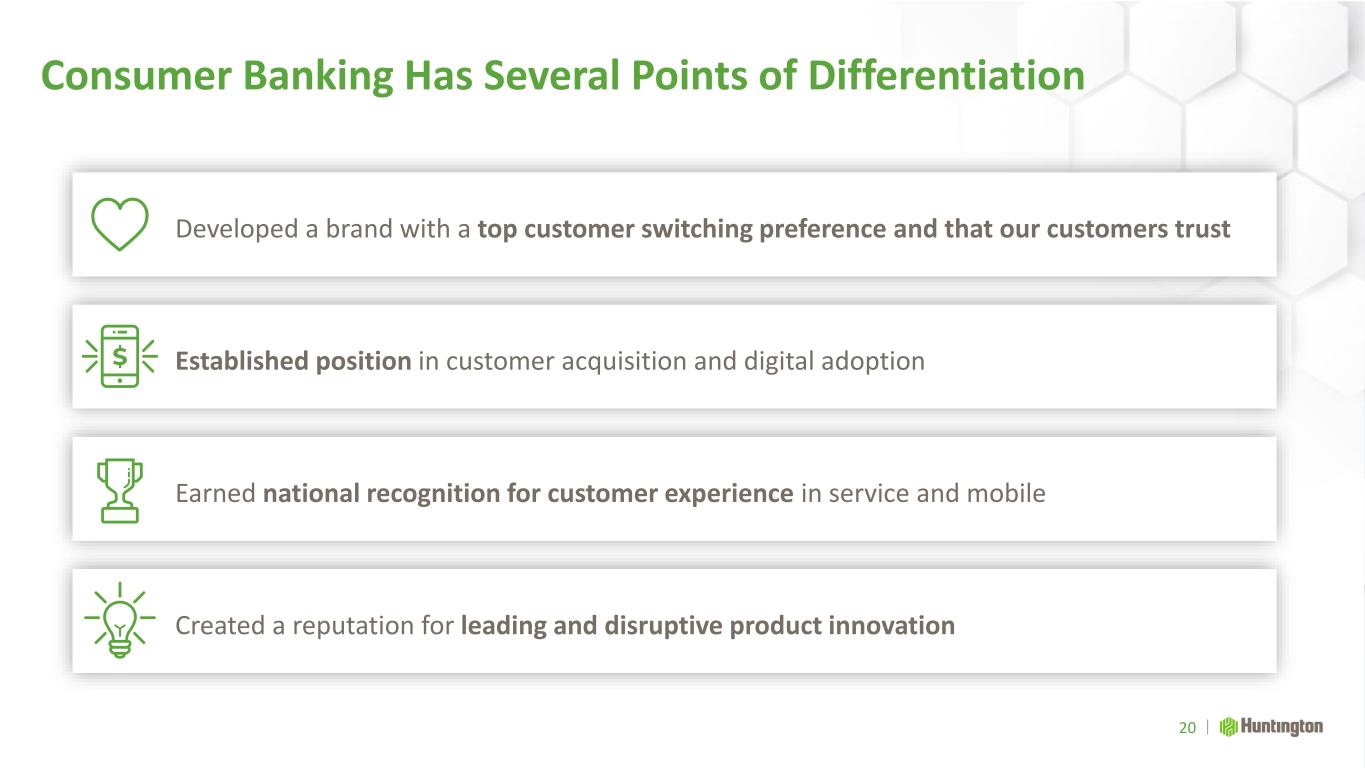
Consumer Banking Has Several Points of Differentiation 20 Earned national recognition for customer experience in service and mobile Created a reputation for leading and disruptive product innovation Established position in customer acquisition and digital adoption Developed a brand with a top customer switching preference and that our customers trust
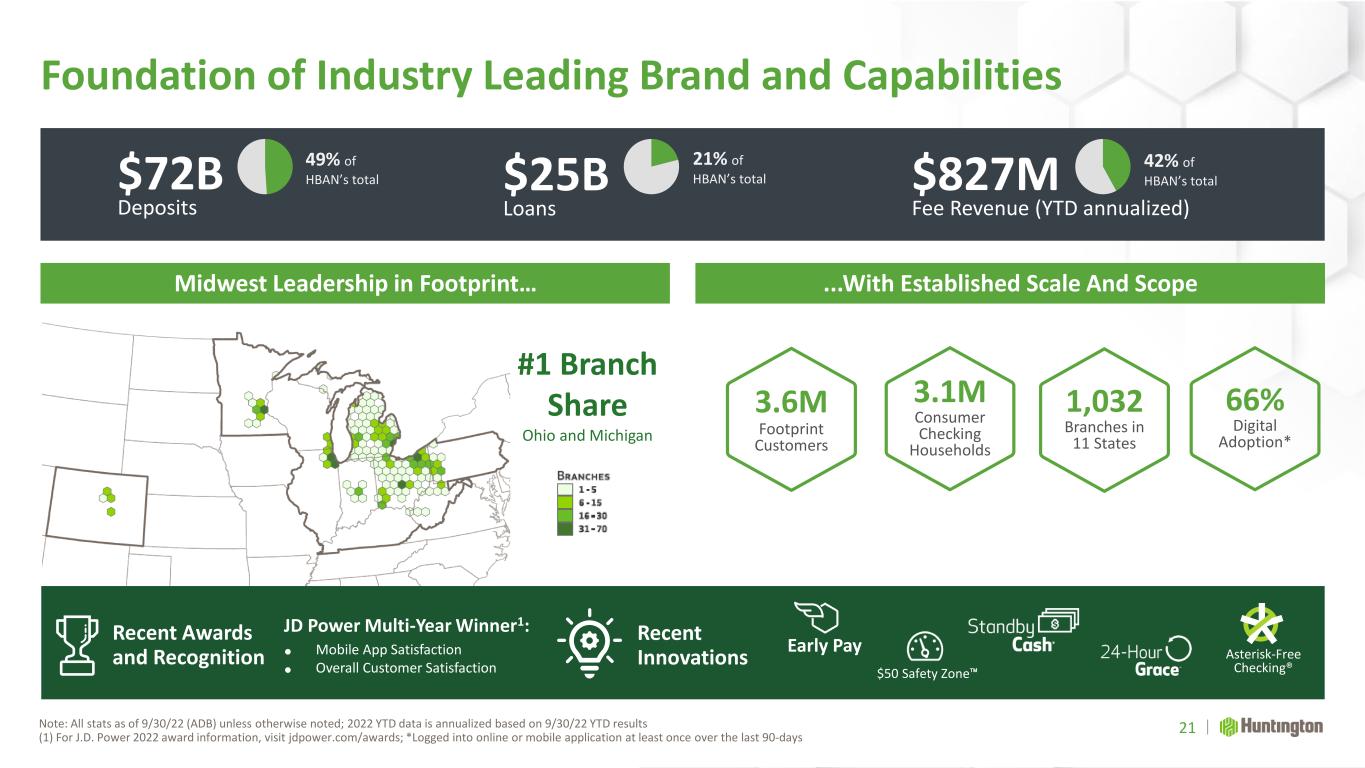
Recent Awards and Recognition JD Power Multi-Year Winner1: • Mobile App Satisfaction • Overall Customer Satisfaction Recent Innovations Midwest Leadership in Footprint… $429M YTD Fee Revenue Foundation of Industry Leading Brand and Capabilities Note: All stats as of 9/30/22 (ADB) unless otherwise noted; 2022 YTD data is annualized based on 9/30/22 YTD results (1) For J.D. Power 2022 award information, visit jdpower.com/awards; *Logged into online or mobile application at least once over the last 90-days 21 3.6M Footprint Customers 3.1M Consumer Checking Households 1,032 Branches in 11 States 66% Digital Adoption* #1 Branch Share Ohio and Michigan ...With Established Scale And Scope $72B Deposits 49% of HBAN’s total $25B Loans 21% of HBAN’s total $827M Fee Revenue (YTD annualized) 42% of HBAN’s total Early Pay $50 Safety Zone™ Asterisk-Free Checking®
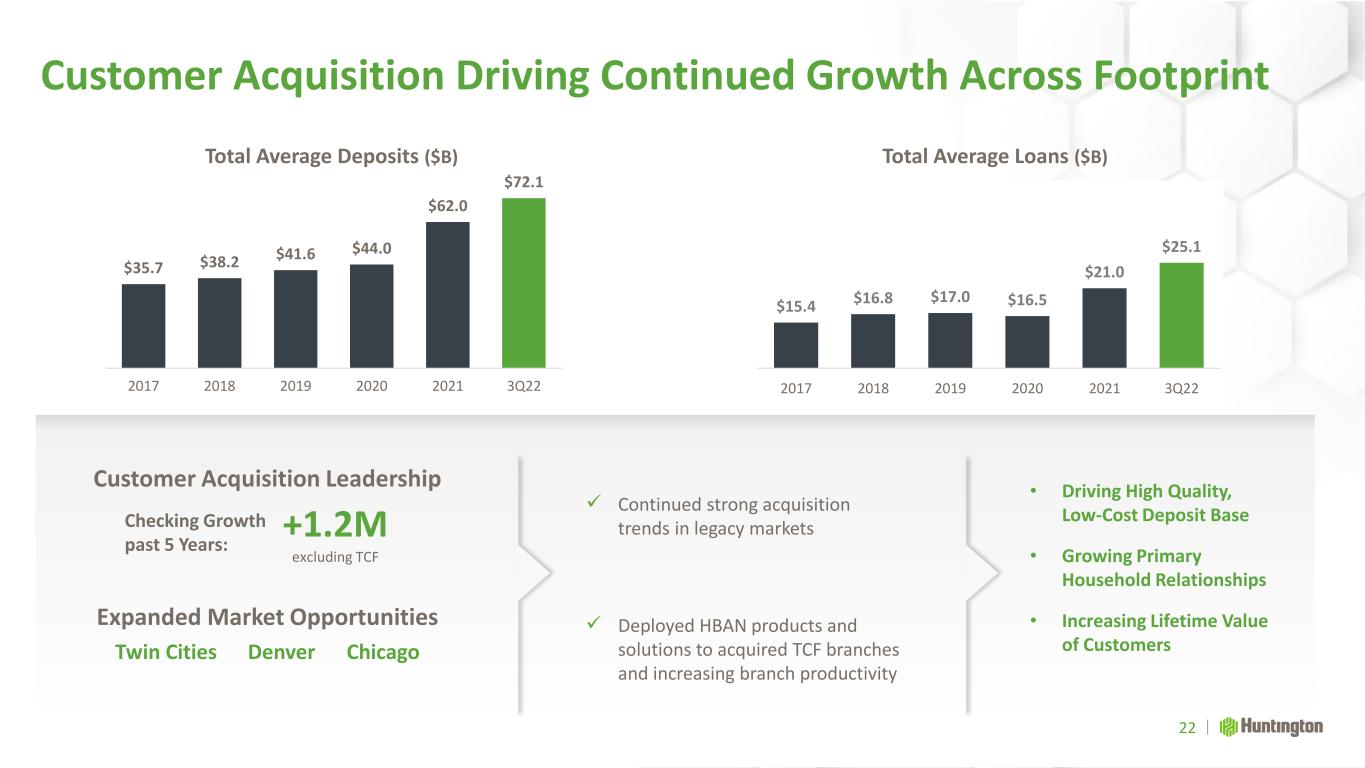
$15.4 $16.8 $17.0 $16.5 $21.0 $25.1 2017 2018 2019 2020 2021 3Q22 Expanded Market Opportunities Twin Cities Denver Chicago Customer Acquisition Driving Continued Growth Across Footprint 22 Total Average Deposits ($B) $35.7 $38.2 $41.6 $44.0 $62.0 $72.1 2017 2018 2019 2020 2021 3Q22 +1.2M excluding TCF Checking Growth past 5 Years: Customer Acquisition Leadership Total Average Loans ($B) ✓ Continued strong acquisition trends in legacy markets ✓ Deployed HBAN products and solutions to acquired TCF branches and increasing branch productivity • Driving High Quality, Low-Cost Deposit Base • Growing Primary Household Relationships • Increasing Lifetime Value of Customers
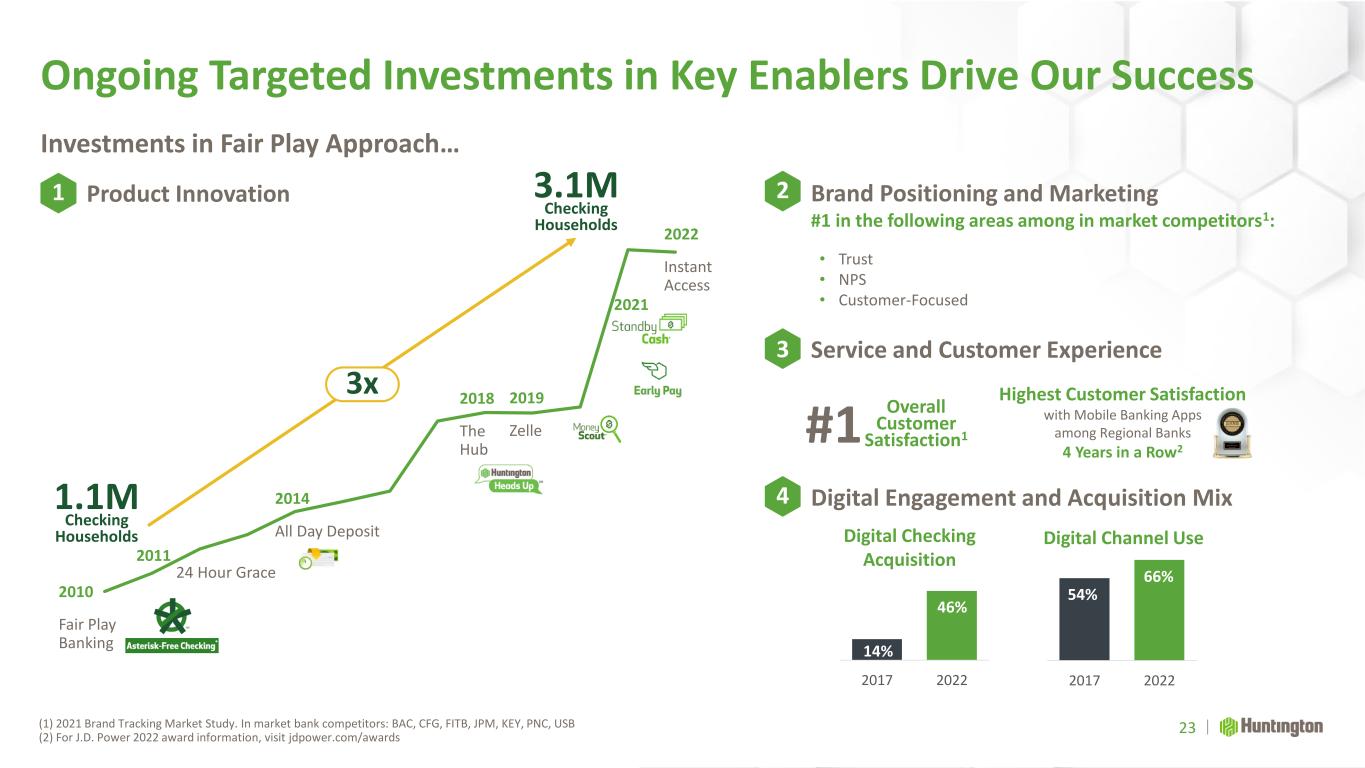
Highest Customer Satisfaction with Mobile Banking Apps among Regional Banks 4 Years in a Row2 Service and Customer Experience Investments in Fair Play Approach… Ongoing Targeted Investments in Key Enablers Drive Our Success (1) 2021 Brand Tracking Market Study. In market bank competitors: BAC, CFG, FITB, JPM, KEY, PNC, USB (2) For J.D. Power 2022 award information, visit jdpower.com/awards 23 1 Product Innovation 2 Brand Positioning and Marketing #1 in the following areas among in market competitors1: 3 4 Digital Engagement and Acquisition Mix Digital Checking Acquisition 2017 2022 14% 46% 2017 2022 Digital Channel Use 54% 66% 3x 2010 Fair Play Banking 2011 2014 All Day Deposit 2021 2022 Instant Access 2018 The Hub 2019 Zelle Checking Households 3.1M Checking Households 1.1M 24 Hour Grace • Trust • NPS • Customer-Focused #1 Overall Customer Satisfaction1
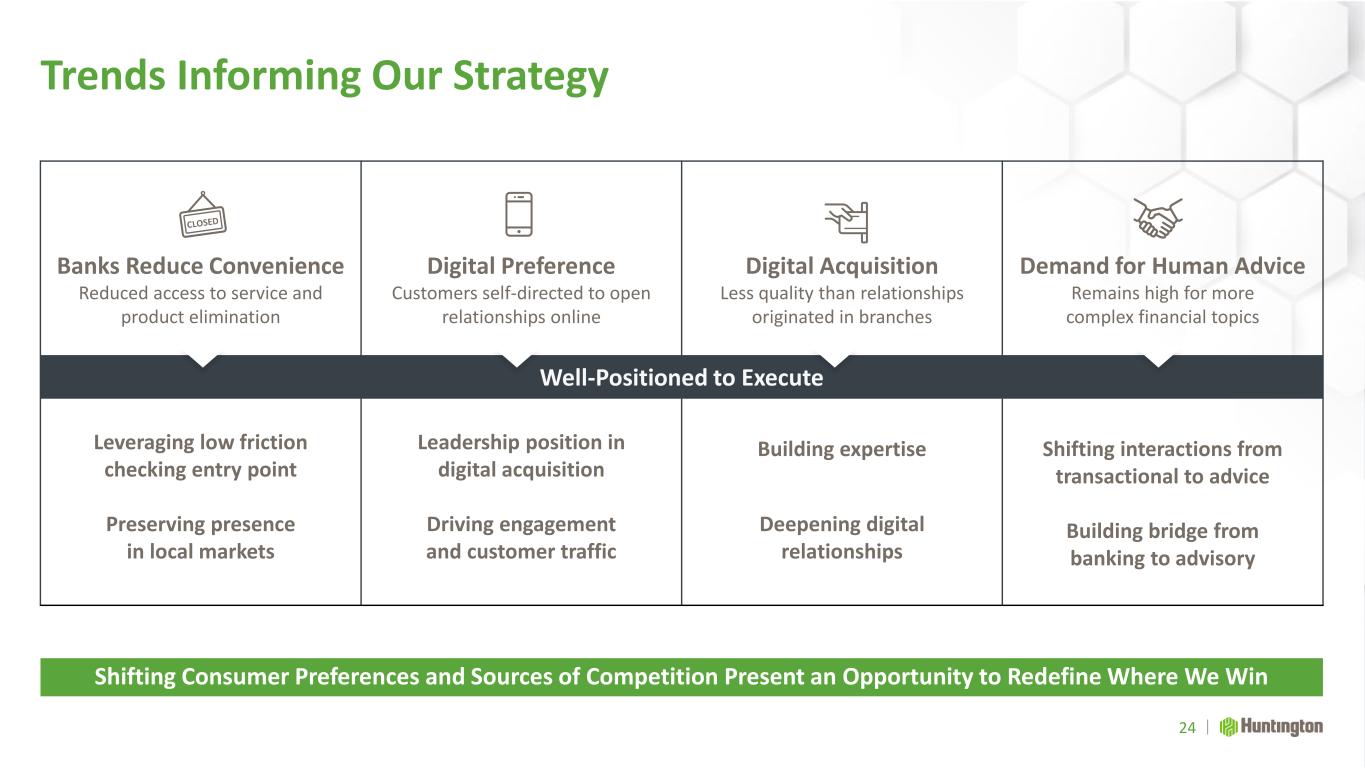
Trends Informing Our Strategy Banks Reduce Convenience Reduced access to service and product elimination Digital Preference Customers self-directed to open relationships online Digital Acquisition Less quality than relationships originated in branches Demand for Human Advice Remains high for more complex financial topics Well-Positioned to Execute Leveraging low friction checking entry point Preserving presence in local markets Leadership position in digital acquisition Driving engagement and customer traffic Building expertise Deepening digital relationships Shifting interactions from transactional to advice Building bridge from banking to advisory 24 Shifting Consumer Preferences and Sources of Competition Present an Opportunity to Redefine Where We Win
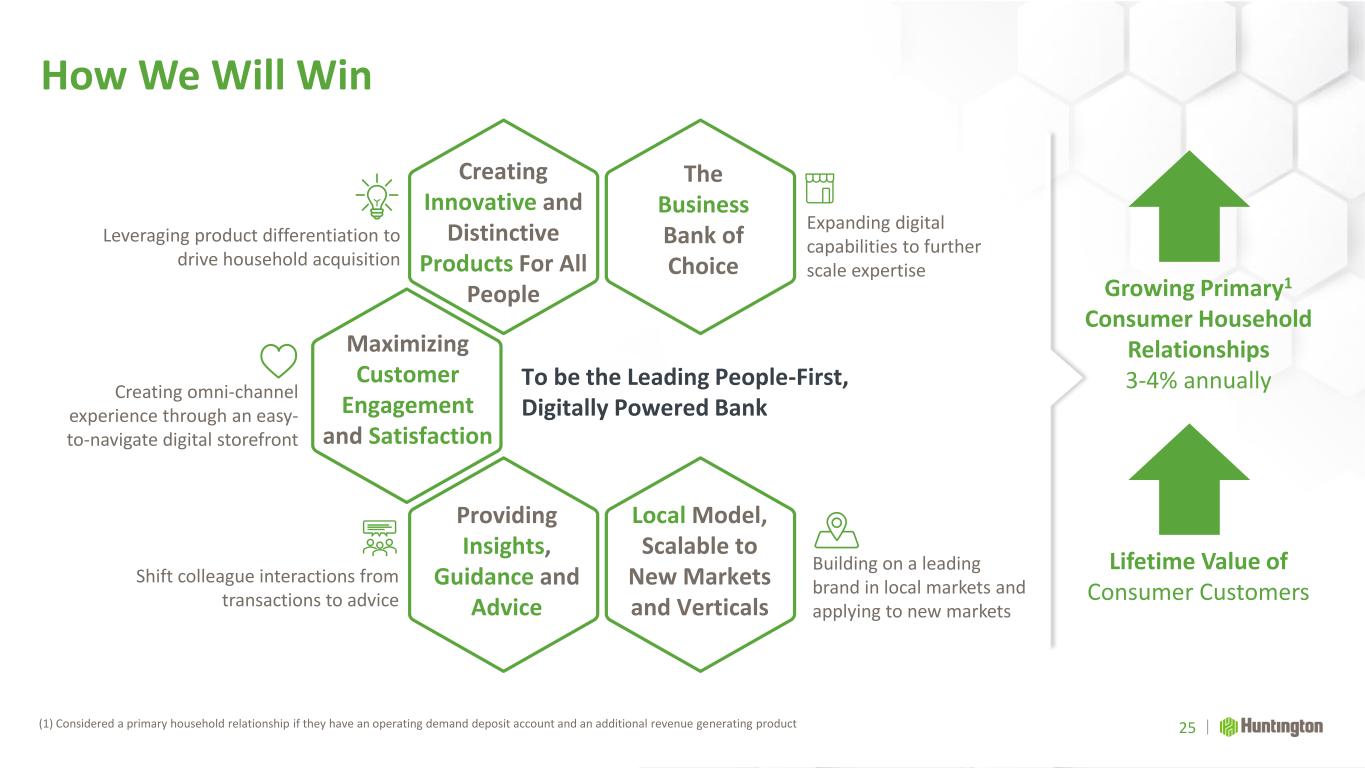
How We Will Win (1) Considered a primary household relationship if they have an operating demand deposit account and an additional revenue generating product 25 Creating Innovative and Distinctive Products For All People The Business Bank of Choice Maximizing Customer Engagement and Satisfaction Local Model, Scalable to New Markets and Verticals Leveraging product differentiation to drive household acquisition Providing Insights, Guidance and Advice Expanding digital capabilities to further scale expertise Shift colleague interactions from transactions to advice Building on a leading brand in local markets and applying to new markets Creating omni-channel experience through an easy- to-navigate digital storefront To be the Leading People-First, Digitally Powered Bank Growing Primary1 Consumer Household Relationships 3-4% annually Lifetime Value of Consumer Customers
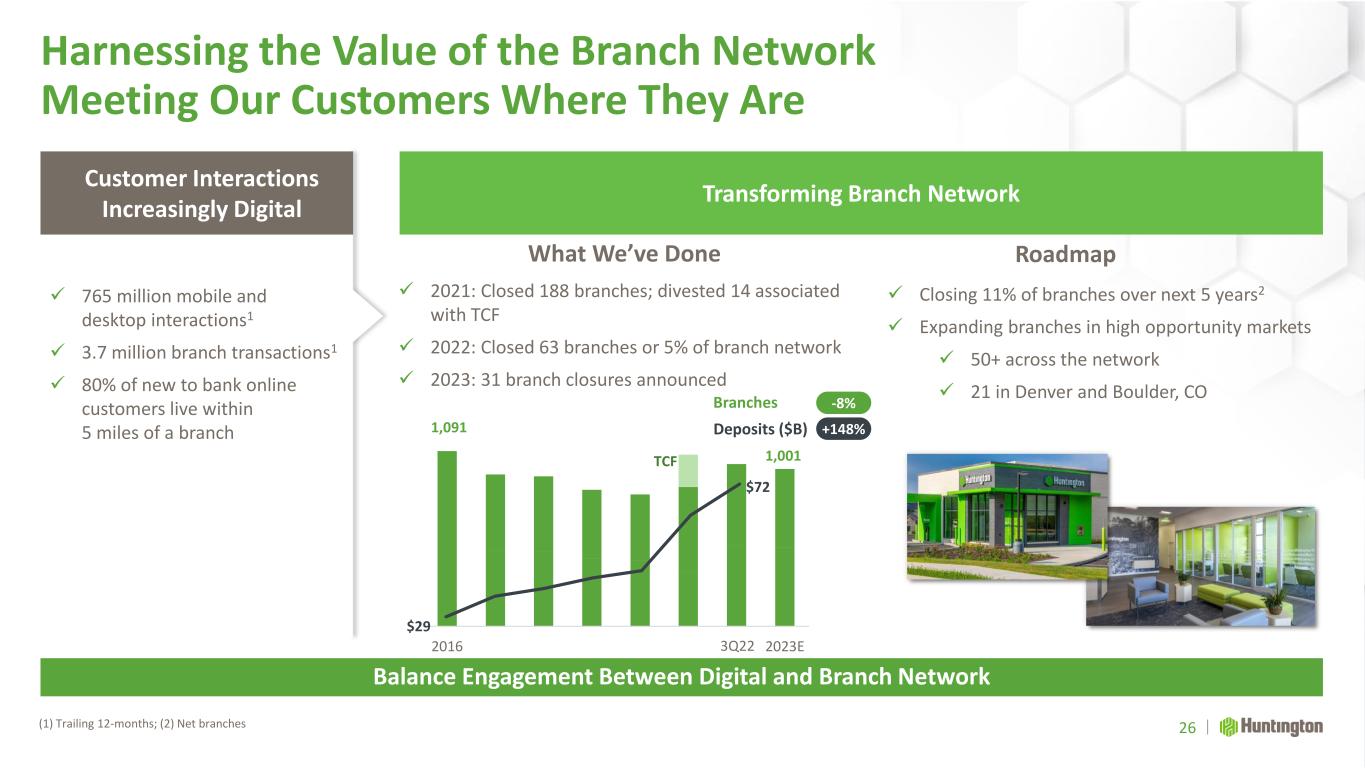
✓ 2021: Closed 188 branches; divested 14 associated with TCF ✓ 2022: Closed 63 branches or 5% of branch network ✓ 2023: 31 branch closures announced 2016 2023E 1,091 TCF Branches Deposits ($B) 1,001 +148% -8% $29 $72 Harnessing the Value of the Branch Network Meeting Our Customers Where They Are (1) Trailing 12-months; (2) Net branches 26 Balance Engagement Between Digital and Branch Network Customer Interactions Increasingly Digital Transforming Branch Network ✓ 765 million mobile and desktop interactions1 ✓ 3.7 million branch transactions1 ✓ 80% of new to bank online customers live within 5 miles of a branch ✓ Closing 11% of branches over next 5 years2 ✓ Expanding branches in high opportunity markets ✓ 50+ across the network ✓ 21 in Denver and Boulder, CO What We’ve Done Roadmap 3Q22
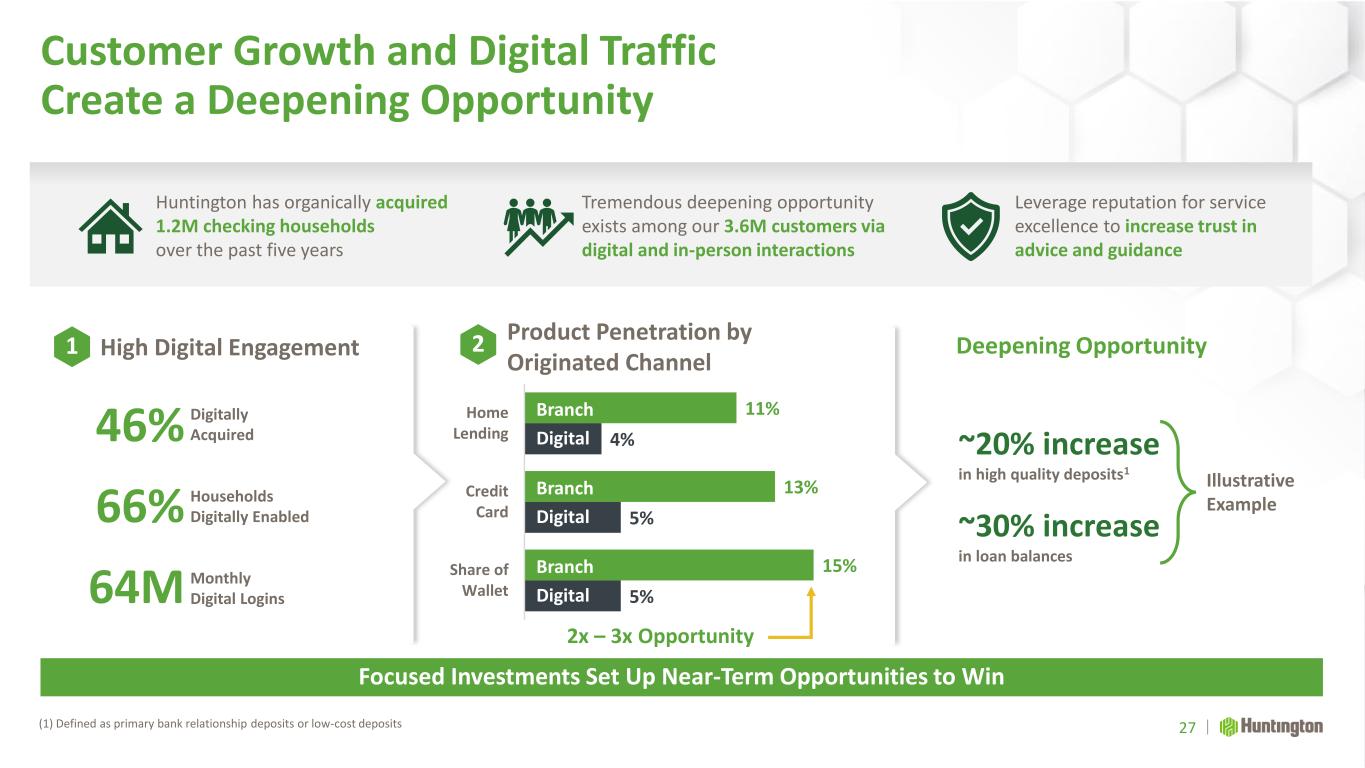
5% 5% 4% 15% 13% 11% Share of Wallet Credit Card Home Lending Branch Digital Branch Digital Branch Digital Customer Growth and Digital Traffic Create a Deepening Opportunity (1) Defined as primary bank relationship deposits or low-cost deposits 27 Focused Investments Set Up Near-Term Opportunities to Win Leverage reputation for service excellence to increase trust in advice and guidance Huntington has organically acquired 1.2M checking households over the past five years Tremendous deepening opportunity exists among our 3.6M customers via digital and in-person interactions 1 2High Digital Engagement Product Penetration by Originated Channel Deepening Opportunity 46% 66% 64M Digitally Acquired Households Digitally Enabled Monthly Digital Logins ~20% increase in high quality deposits1 ~30% increase in loan balances Illustrative Example 2x – 3x Opportunity
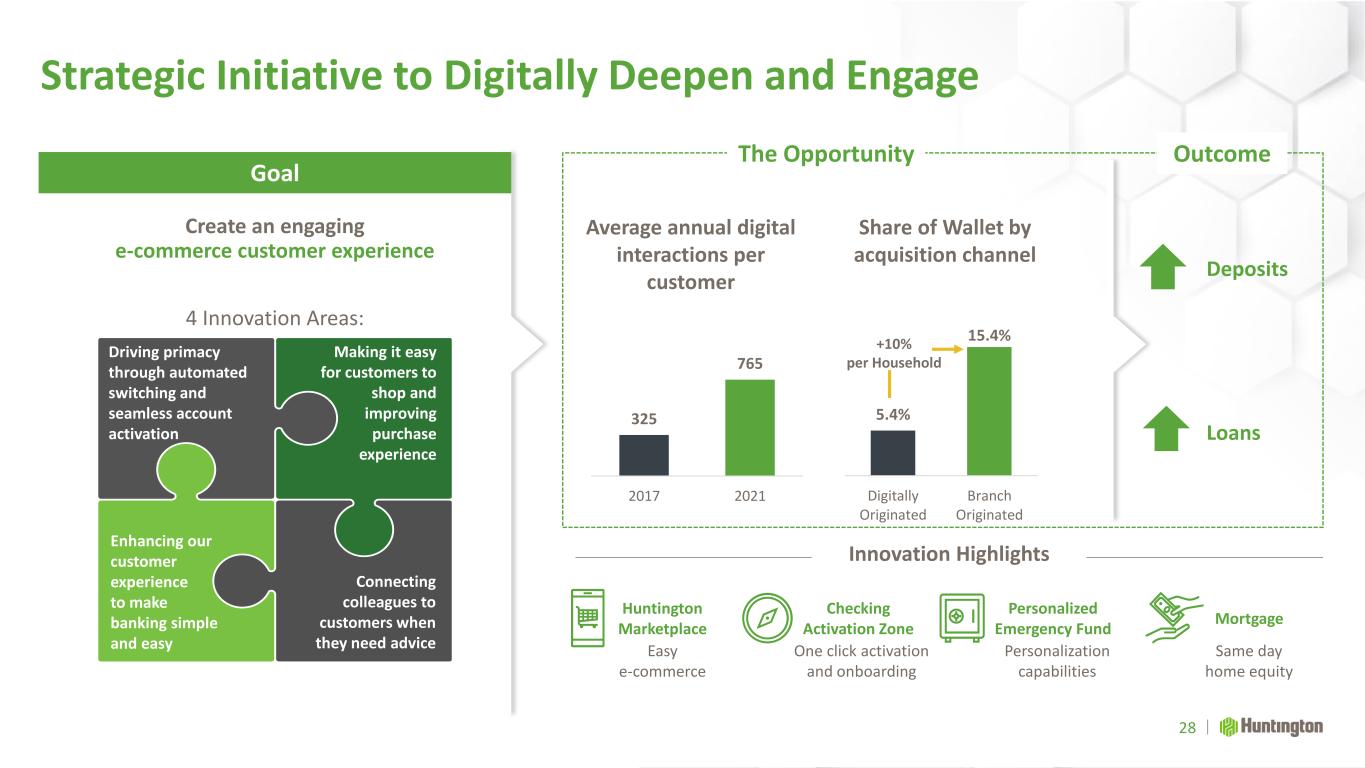
Create an engaging e-commerce customer experience Goal Strategic Initiative to Digitally Deepen and Engage 28 Innovation Highlights Easy e-commerce Huntington Marketplace One click activation and onboarding Checking Activation Zone Personalization capabilities Personalized Emergency Fund Same day home equity Mortgage 325 765 2017 2021 5.4% 15.4% Digitally Originated Branch Originated +10% per Household Average annual digital interactions per customer Share of Wallet by acquisition channel The Opportunity Making it easy for customers to shop and improving purchase experience Driving primacy through automated switching and seamless account activation Connecting colleagues to customers when they need advice Enhancing our customer experience to make banking simple and easy 4 Innovation Areas: Deposits Loans Outcome
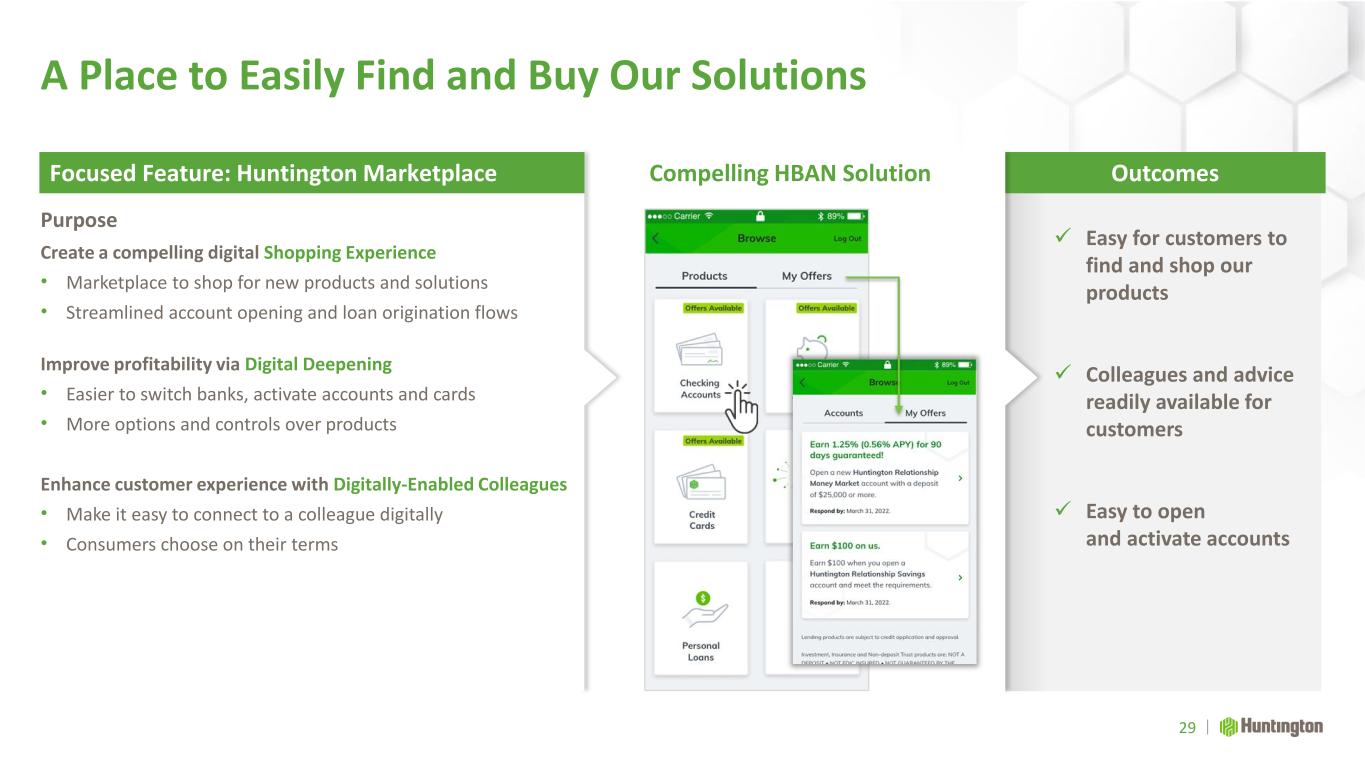
A Place to Easily Find and Buy Our Solutions Purpose Create a compelling digital Shopping Experience • Marketplace to shop for new products and solutions • Streamlined account opening and loan origination flows Improve profitability via Digital Deepening • Easier to switch banks, activate accounts and cards • More options and controls over products Enhance customer experience with Digitally-Enabled Colleagues • Make it easy to connect to a colleague digitally • Consumers choose on their terms 29 Compelling HBAN Solution ✓ Easy for customers to find and shop our products ✓ Colleagues and advice readily available for customers ✓ Easy to open and activate accounts Focused Feature: Huntington Marketplace Outcomes
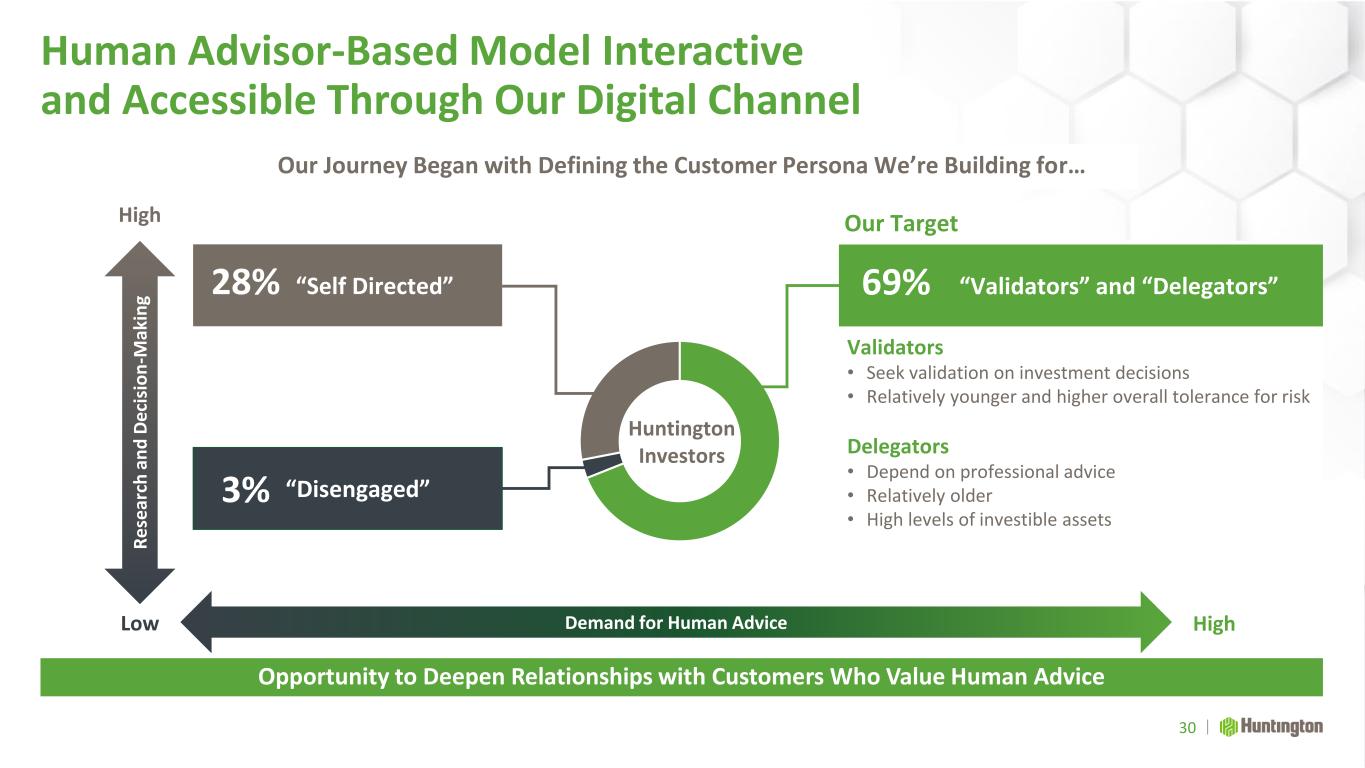
“Self Directed” 30 Opportunity to Deepen Relationships with Customers Who Value Human Advice Huntington Investors Our Target Validators • Seek validation on investment decisions • Relatively younger and higher overall tolerance for risk Delegators • Depend on professional advice • Relatively older • High levels of investible assets Low High High Human Advisor-Based Model Interactive and Accessible Through Our Digital Channel R e se ar ch a n d D e ci si o n -M ak in g Demand for Human Advice “Validators” and “Delegators”69%28% “Disengaged”3% Our Journey Began with Defining the Customer Persona We’re Building for…
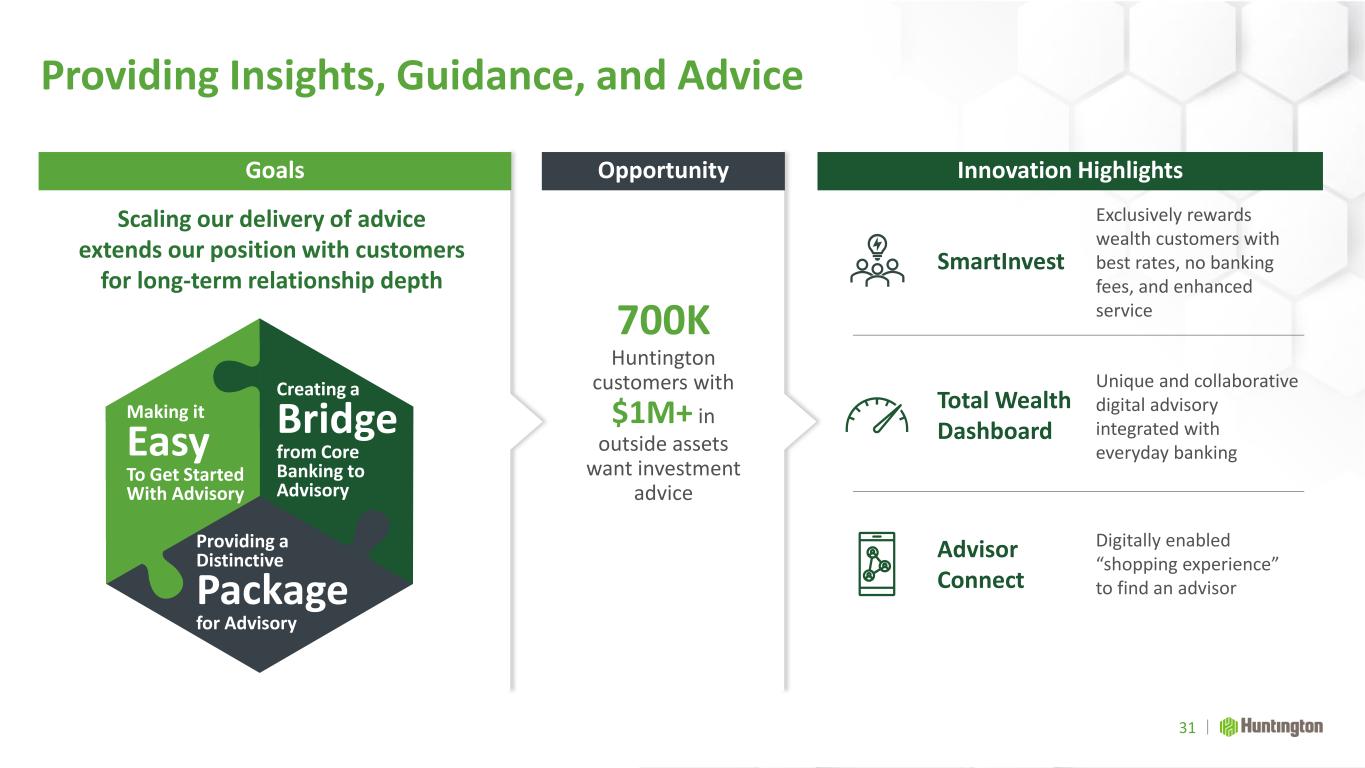
Goals Providing Insights, Guidance, and Advice 31 Target Customer Outcomes Scaling our delivery of advice extends our position with customers for long-term relationship depth 700K Huntington customers with $1M+ in outside assets want investment advice Opportunity Innovation Highlights Total Wealth Dashboard Unique and collaborative digital advisory integrated with everyday banking SmartInvest Exclusively rewards wealth customers with best rates, no banking fees, and enhanced service Advisor Connect Digitally enabled “shopping experience” to find an advisor Making it Easy To Get Started With Advisory Creating a Bridge from Core Banking to Advisory Providing a Distinctive Package for Advisory
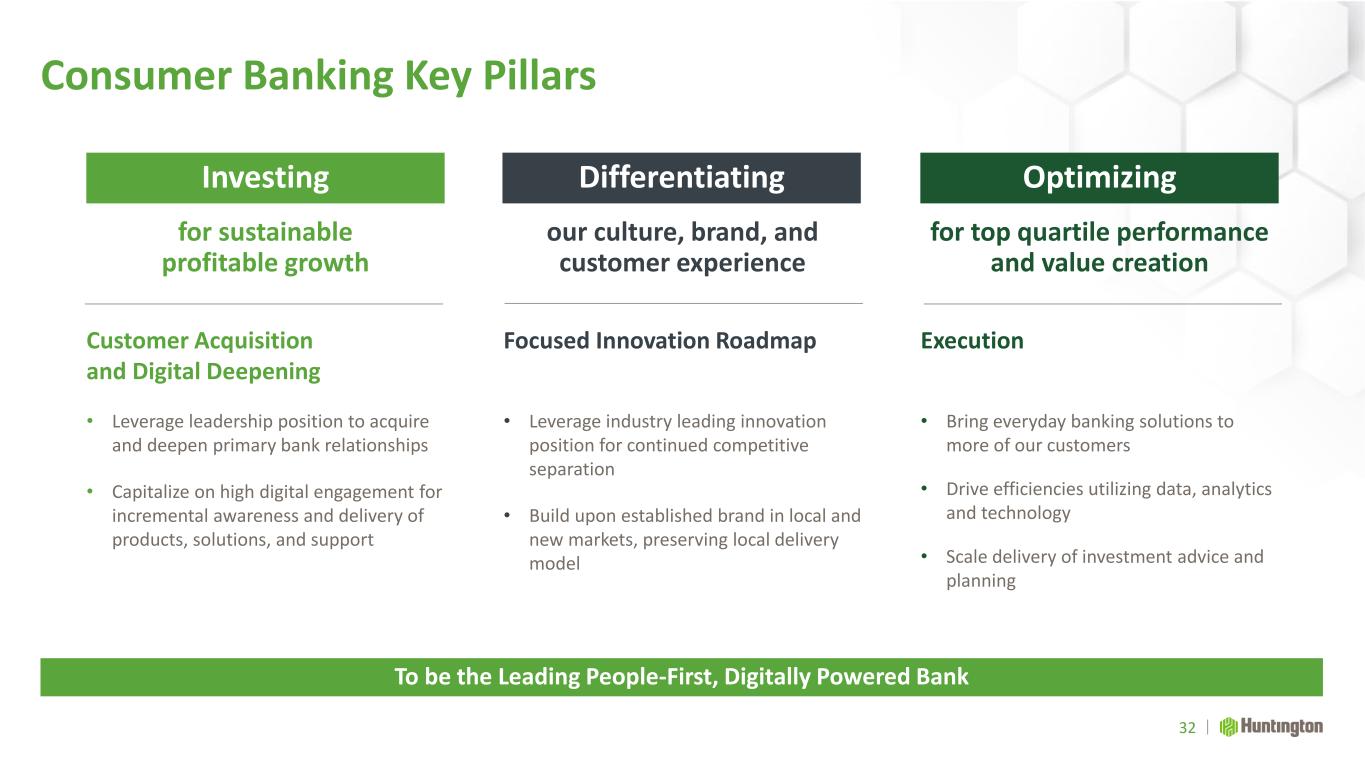
Consumer Banking Key Pillars Execution • Bring everyday banking solutions to more of our customers • Drive efficiencies utilizing data, analytics and technology • Scale delivery of investment advice and planning 32 To be the Leading People-First, Digitally Powered Bank Focused Innovation Roadmap • Leverage industry leading innovation position for continued competitive separation • Build upon established brand in local and new markets, preserving local delivery model Customer Acquisition and Digital Deepening • Leverage leadership position to acquire and deepen primary bank relationships • Capitalize on high digital engagement for incremental awareness and delivery of products, solutions, and support Investing Optimizing Differentiating for sustainable profitable growth for top quartile performance and value creation our culture, brand, and customer experience
Wealth Management Delivering Advisory Expertise and Enhancing Digital Capabilities to Capture Significant Opportunity Sandy Pierce SEVP, Private Client Group and Regional Banking Director
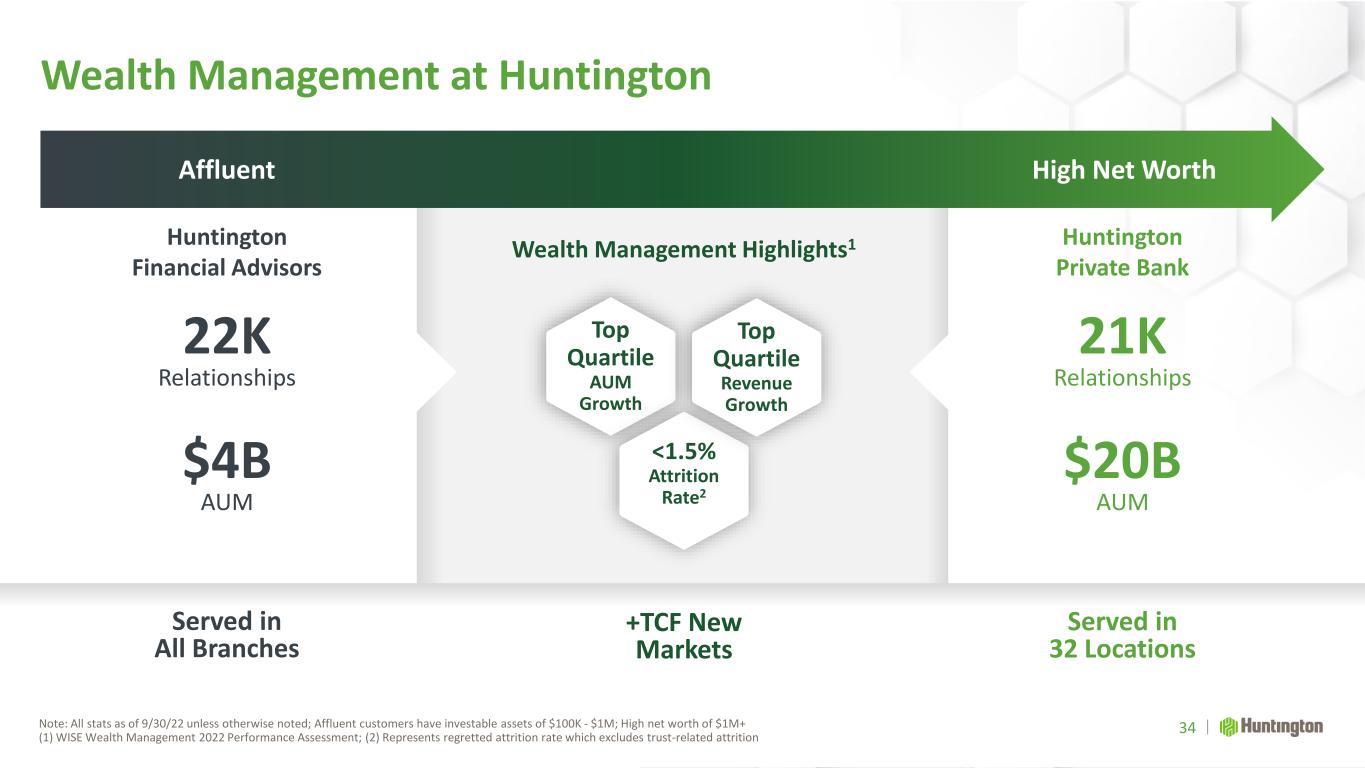
Wealth Management at Huntington Note: All stats as of 9/30/22 unless otherwise noted; Affluent customers have investable assets of $100K - $1M; High net worth of $1M+ (1) WISE Wealth Management 2022 Performance Assessment; (2) Represents regretted attrition rate which excludes trust-related attrition 34 Top Quartile AUM Growth <1.5% Attrition Rate2 Wealth Management Highlights1 Affluent High Net Worth Huntington Financial Advisors Huntington Private Bank Top Quartile Revenue Growth 22K Relationships $4B AUM Served in All Branches +TCF New Markets Served in 32 Locations 21K Relationships $20B AUM
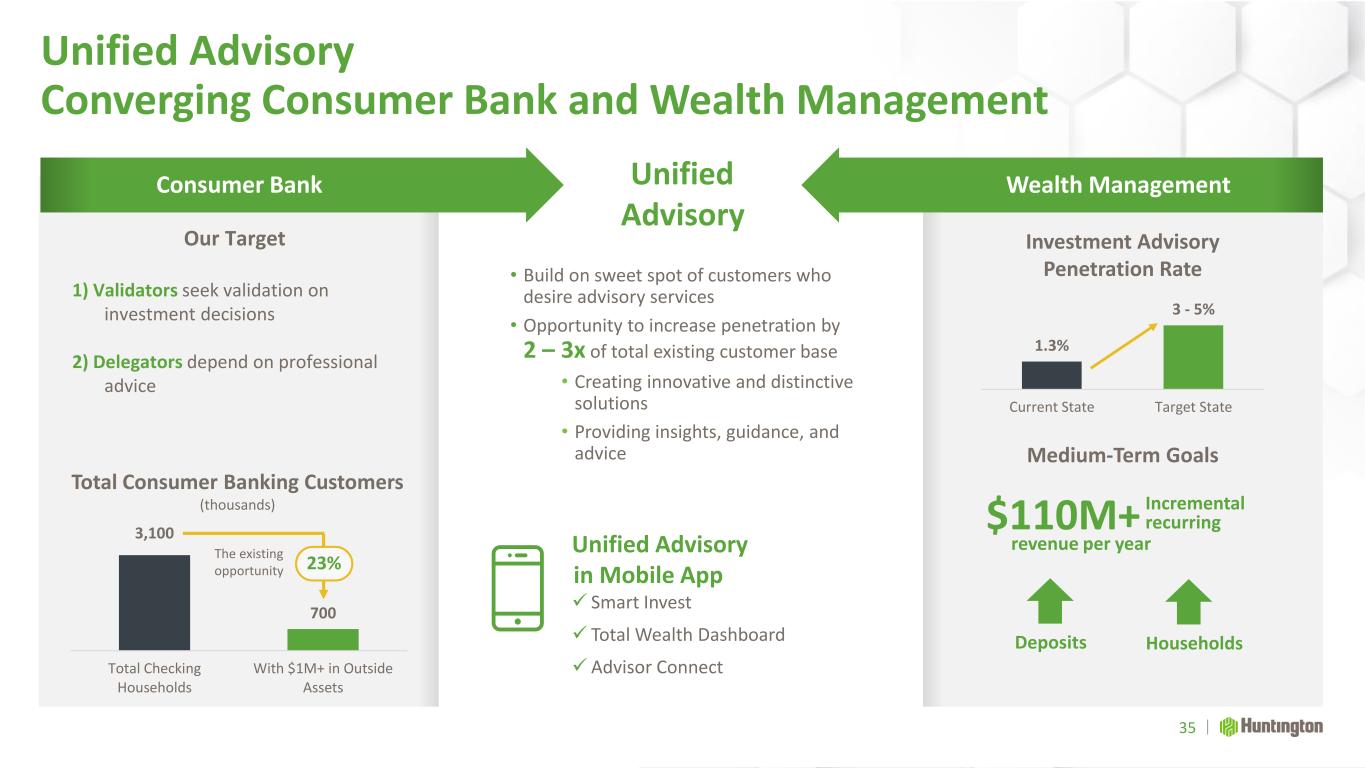
1) Validators seek validation on investment decisions 2) Delegators depend on professional advice Unified Advisory Converging Consumer Bank and Wealth Management 35 • Build on sweet spot of customers who desire advisory services • Opportunity to increase penetration by 2 – 3x of total existing customer base • Creating innovative and distinctive solutions • Providing insights, guidance, and advice 3,100 700 Total Checking Households With $1M+ in Outside Assets Unified Advisory Total Consumer Banking Customers (thousands) Consumer Bank Wealth Management 1.3% 3 - 5% Current State Target State Investment Advisory Penetration Rate Medium-Term Goals Our Target The existing opportunity Unified Advisory in Mobile App ✓ Smart Invest ✓ Total Wealth Dashboard ✓ Advisor Connect Deposits Households revenue per year $110M+ Incremental recurring 23%
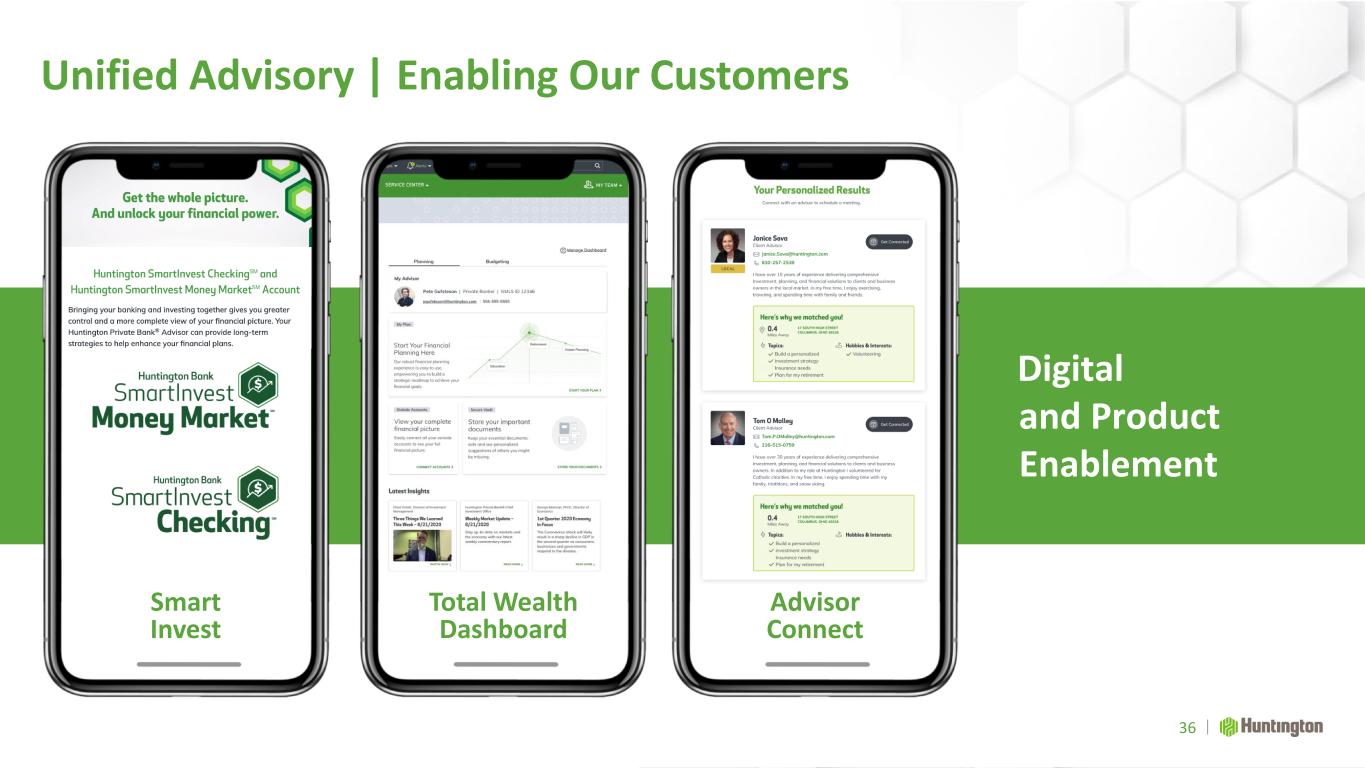
Unified Advisory | Enabling Our Customers 36 Digital and Product Enablement Total Wealth Dashboard Smart Invest Advisor Connect
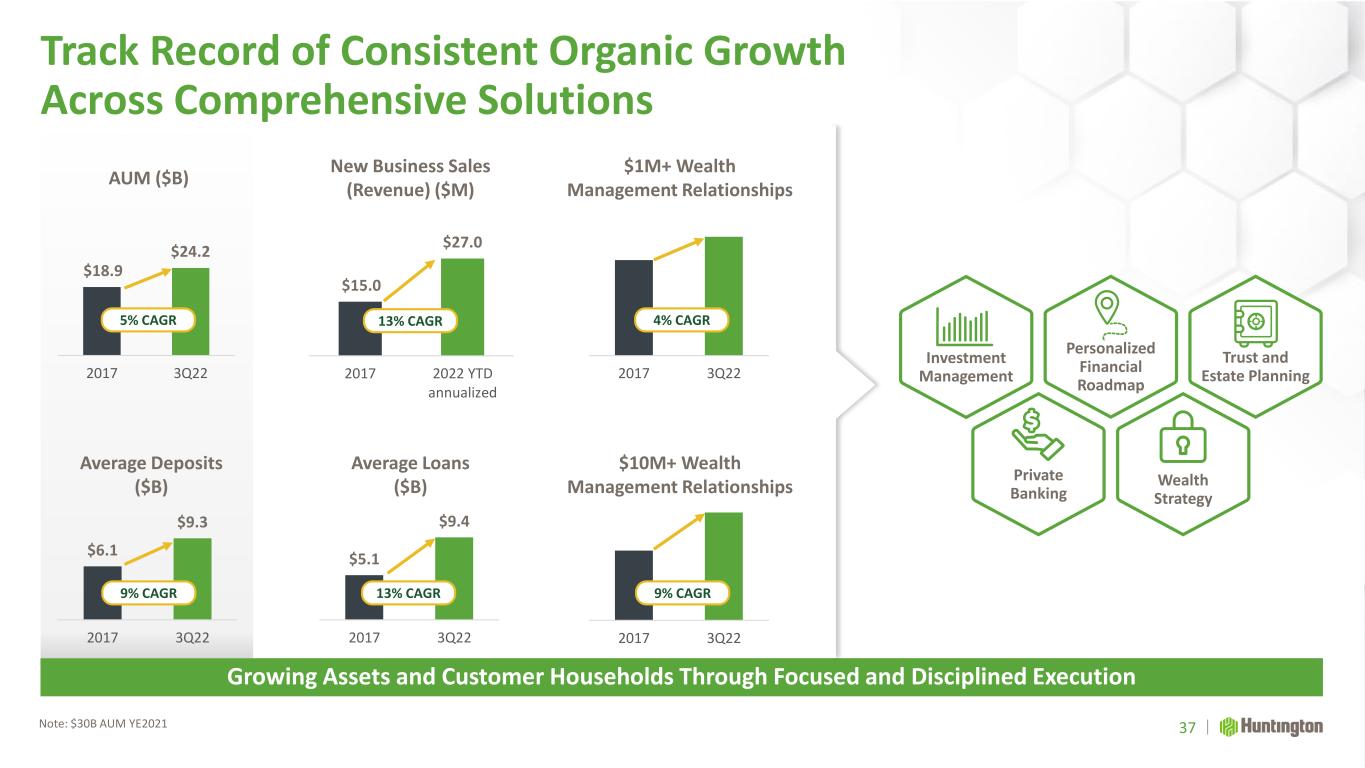
$18.9 $24.2 2017 3Q22 5% CAGR $5.1 $9.4 2017 3Q22 $6.1 $9.3 2017 3Q22 Average Loans ($B) Track Record of Consistent Organic Growth Across Comprehensive Solutions Note: $30B AUM YE2021 Growing Assets and Customer Households Through Focused and Disciplined Execution Investment Management Private Banking Personalized Financial Roadmap Trust and Estate Planning Wealth Strategy Average Deposits ($B) AUM ($B) 37 $1M+ Wealth Management Relationships 2017 3Q22 $10M+ Wealth Management Relationships 2017 3Q22 4% CAGR 9% CAGR New Business Sales (Revenue) ($M) $15.0 $27.0 2017 2022 YTD annualized 13% CAGR 9% CAGR 13% CAGR
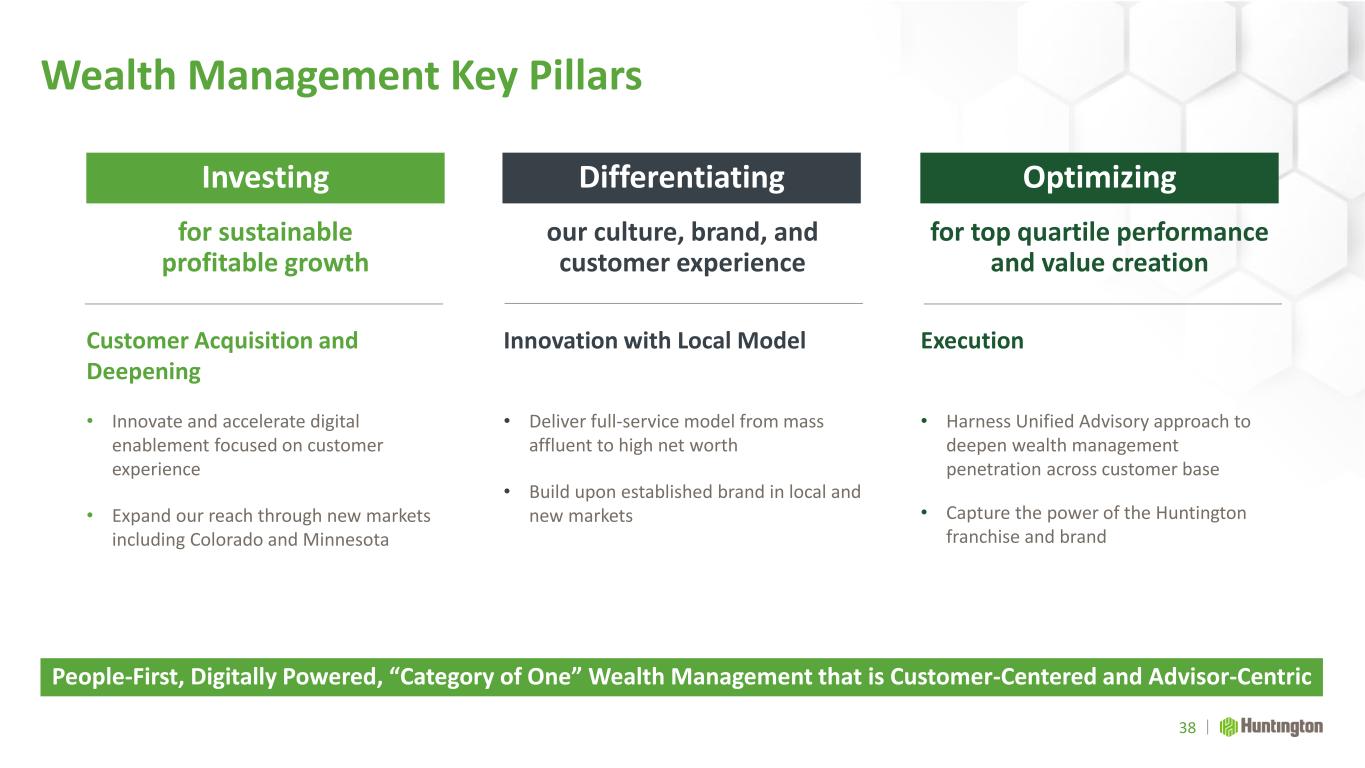
Wealth Management Key Pillars Execution • Harness Unified Advisory approach to deepen wealth management penetration across customer base • Capture the power of the Huntington franchise and brand 38 People-First, Digitally Powered, “Category of One” Wealth Management that is Customer-Centered and Advisor-Centric Innovation with Local Model • Deliver full-service model from mass affluent to high net worth • Build upon established brand in local and new markets Customer Acquisition and Deepening • Innovate and accelerate digital enablement focused on customer experience • Expand our reach through new markets including Colorado and Minnesota Investing Optimizing Differentiating for sustainable profitable growth for top quartile performance and value creation our culture, brand, and customer experience
Business Banking Expanding and Accelerating Our Business Banking Franchise Brant Standridge SEVP and President, Consumer and Business Banking
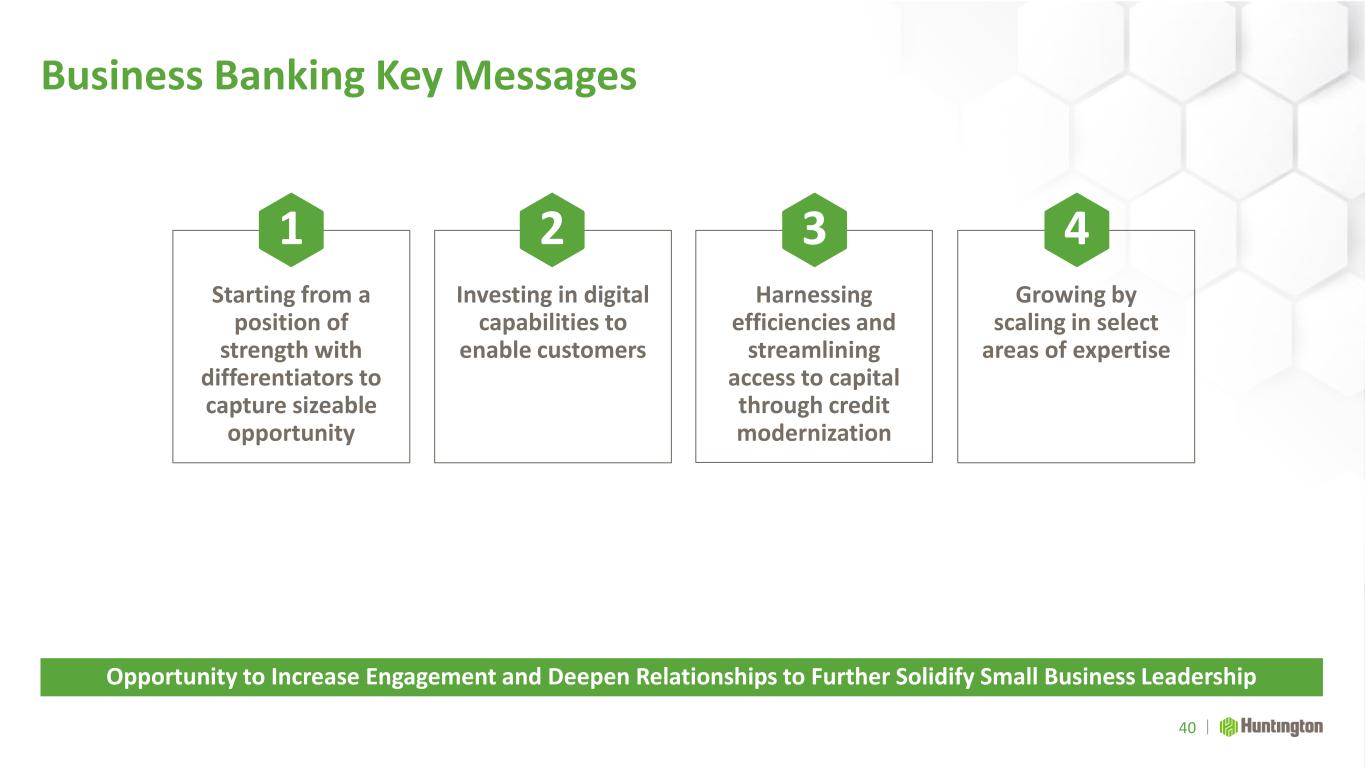
Business Banking Key Messages 40 Opportunity to Increase Engagement and Deepen Relationships to Further Solidify Small Business Leadership Growing by scaling in select areas of expertise Harnessing efficiencies and streamlining access to capital through credit modernization Investing in digital capabilities to enable customers Starting from a position of strength with differentiators to capture sizeable opportunity 1 2 3 4
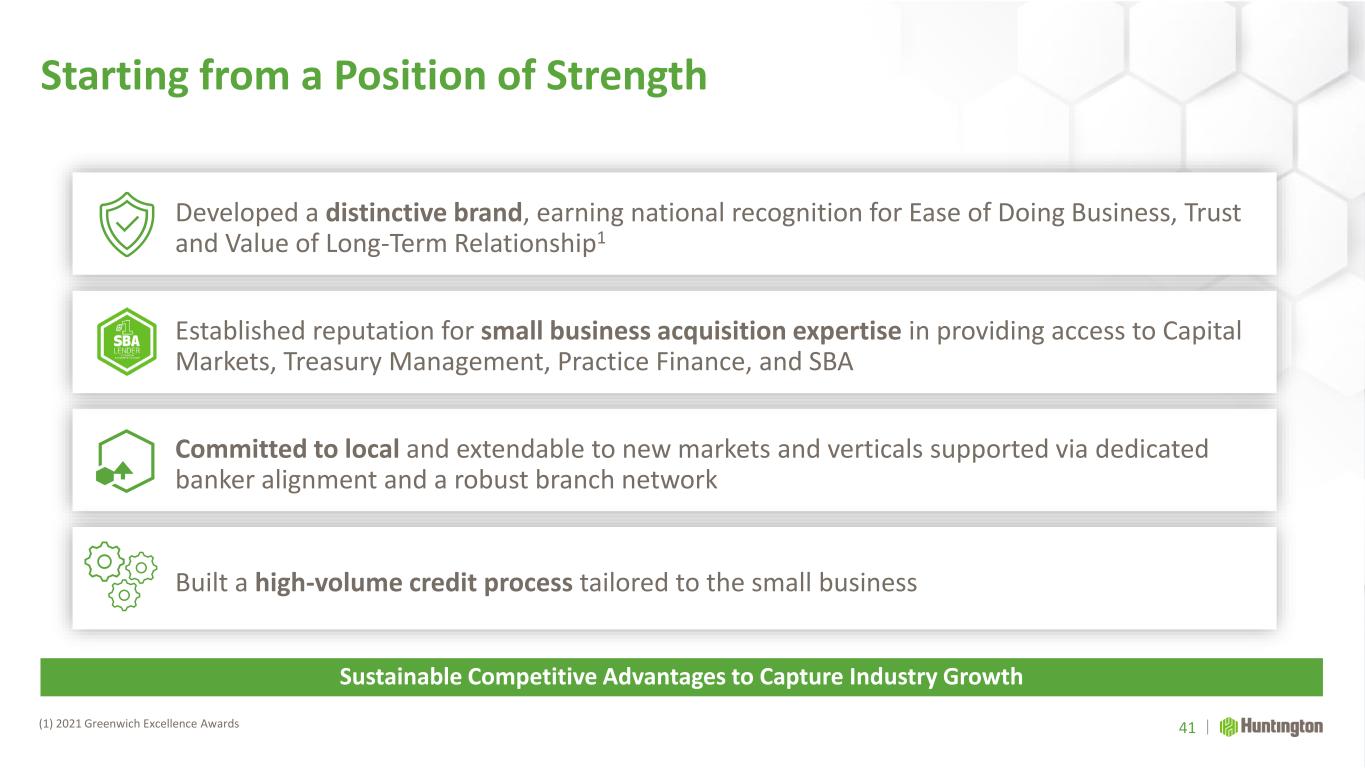
Starting from a Position of Strength (1) 2021 Greenwich Excellence Awards 41 Sustainable Competitive Advantages to Capture Industry Growth Committed to local and extendable to new markets and verticals supported via dedicated banker alignment and a robust branch network Built a high-volume credit process tailored to the small business Established reputation for small business acquisition expertise in providing access to Capital Markets, Treasury Management, Practice Finance, and SBA Developed a distinctive brand, earning national recognition for Ease of Doing Business, Trust and Value of Long-Term Relationship1
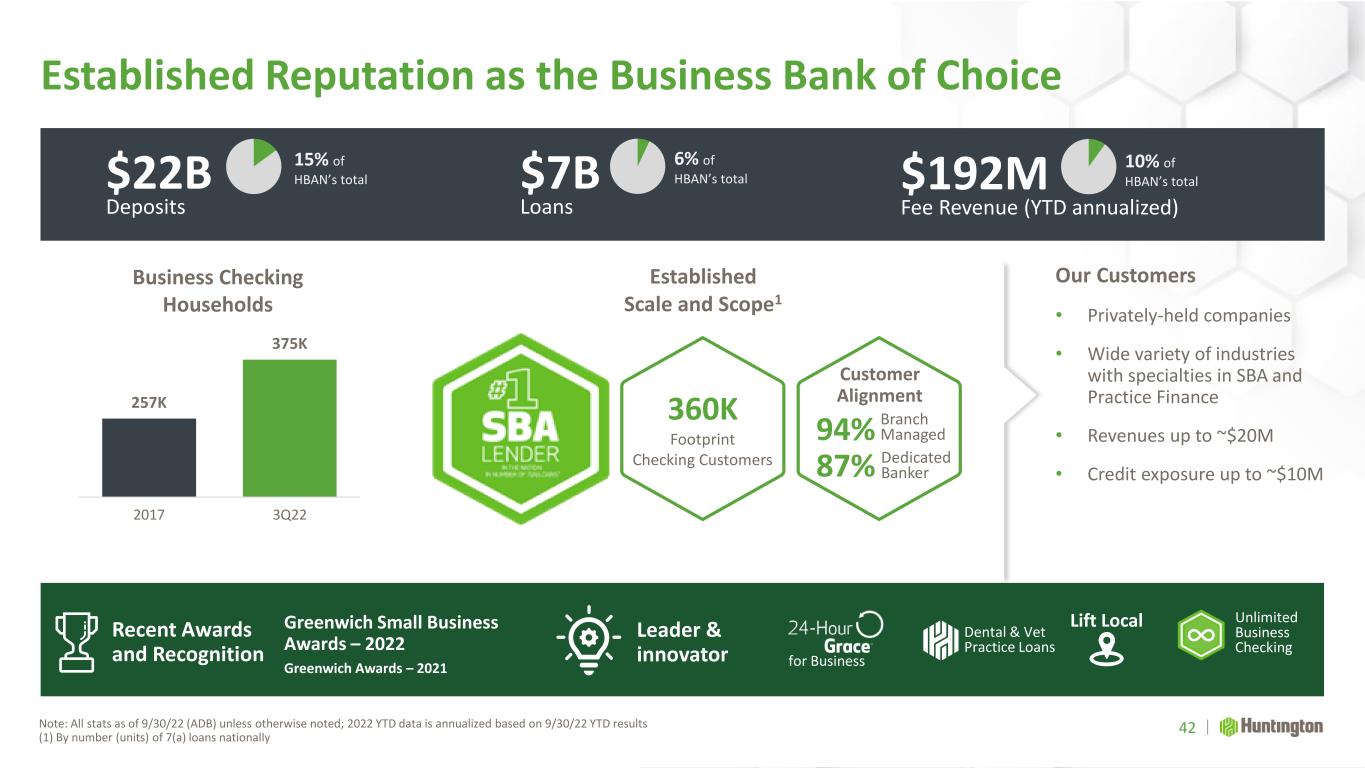
Recent Awards and Recognition Leader & innovator Established Reputation as the Business Bank of Choice Note: All stats as of 9/30/22 (ADB) unless otherwise noted; 2022 YTD data is annualized based on 9/30/22 YTD results (1) By number (units) of 7(a) loans nationally Leader & Innovator Our Customers • Privately-held companies • Wide variety of industries with specialties in SBA and Practice Finance • Revenues up to ~$20M • Credit exposure up to ~$10M Business Checking Households 257K 375K 2017 3Q22 Established Scale and Scope1 Greenwich Small Business Awards – 2022 Greenwich Awards – 2021 Unlimited Business Checking 42 $22B Deposits 15% of HBAN’s total $7B Loans 6% of HBAN’s total $192M Fee Revenue (YTD annualized) 10% of HBAN’s total for Business Dental & Vet Practice Loans Lift Local 360K Footprint Checking Customers Customer Alignment Branch Managed94% 87% Dedicated Banker
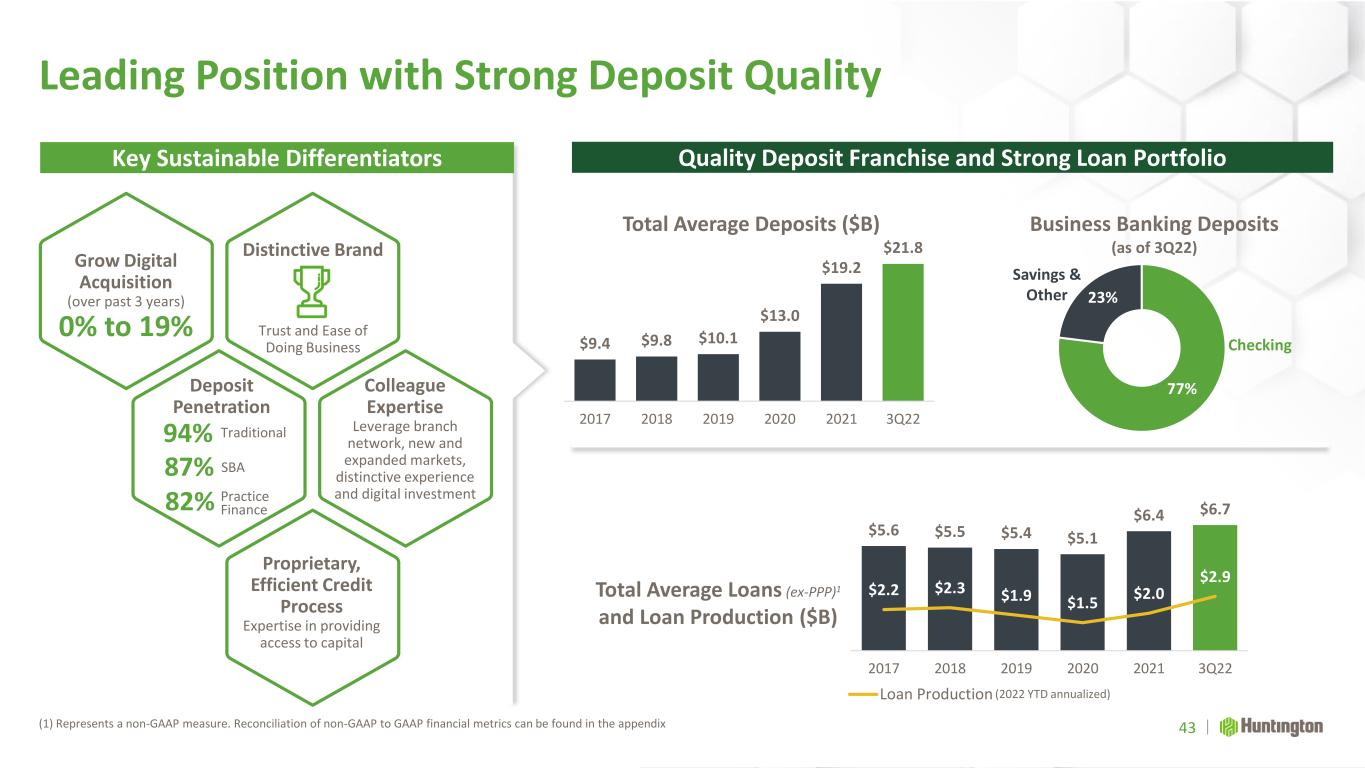
Distinctive Brand Trust and Ease of Doing Business Leading Position with Strong Deposit Quality 43 Grow Digital Acquisition (over past 3 years) 0% to 19% $9.4 $9.8 $10.1 $13.0 $19.2 $21.8 2017 2018 2019 2020 2021 3Q22 Total Average Deposits ($B) 77% 23% Business Banking Deposits (as of 3Q22) Total Average Loans (ex-PPP)1 and Loan Production ($B) $5.6 $5.5 $5.4 $5.1 $6.4 $6.7 $2.2 $2.3 $1.9 $1.5 $2.0 $2.9 2017 2018 2019 2020 2021 3Q22 Loan Production Key Sustainable Differentiators Quality Deposit Franchise and Strong Loan Portfolio (2022 YTD annualized) Deposit Penetration Traditional Colleague Expertise Leverage branch network, new and expanded markets, distinctive experience and digital investment Proprietary, Efficient Credit Process Expertise in providing access to capital 94% 87% 82% SBA Practice Finance Checking Savings & Other (1) Represents a non-GAAP measure. Reconciliation of non-GAAP to GAAP financial metrics can be found in the appendix
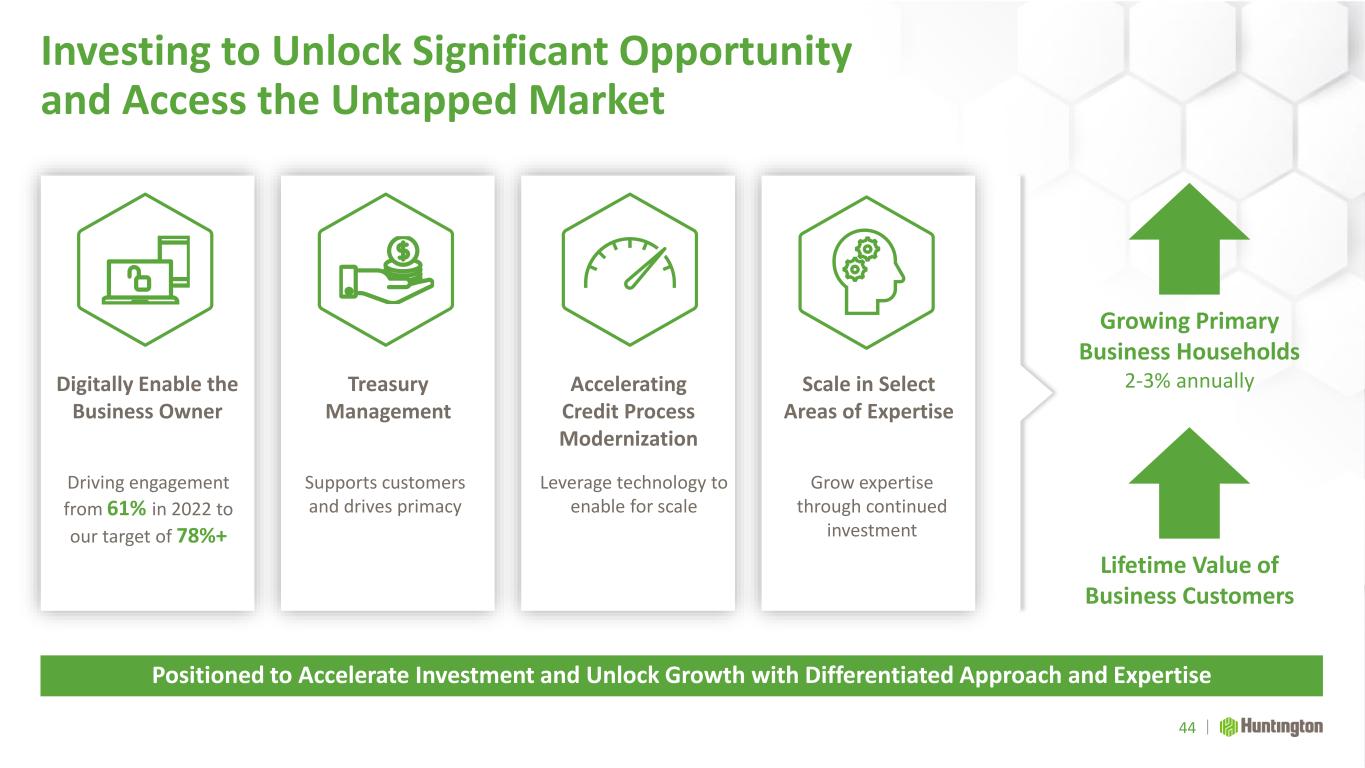
Investing to Unlock Significant Opportunity and Access the Untapped Market 44 Positioned to Accelerate Investment and Unlock Growth with Differentiated Approach and Expertise Digitally Enable the Business Owner Scale in Select Areas of Expertise Accelerating Credit Process Modernization Treasury Management Growing Primary Business Households 2-3% annually Lifetime Value of Business Customers Driving engagement from 61% in 2022 to our target of 78%+ Supports customers and drives primacy Leverage technology to enable for scale Grow expertise through continued investment
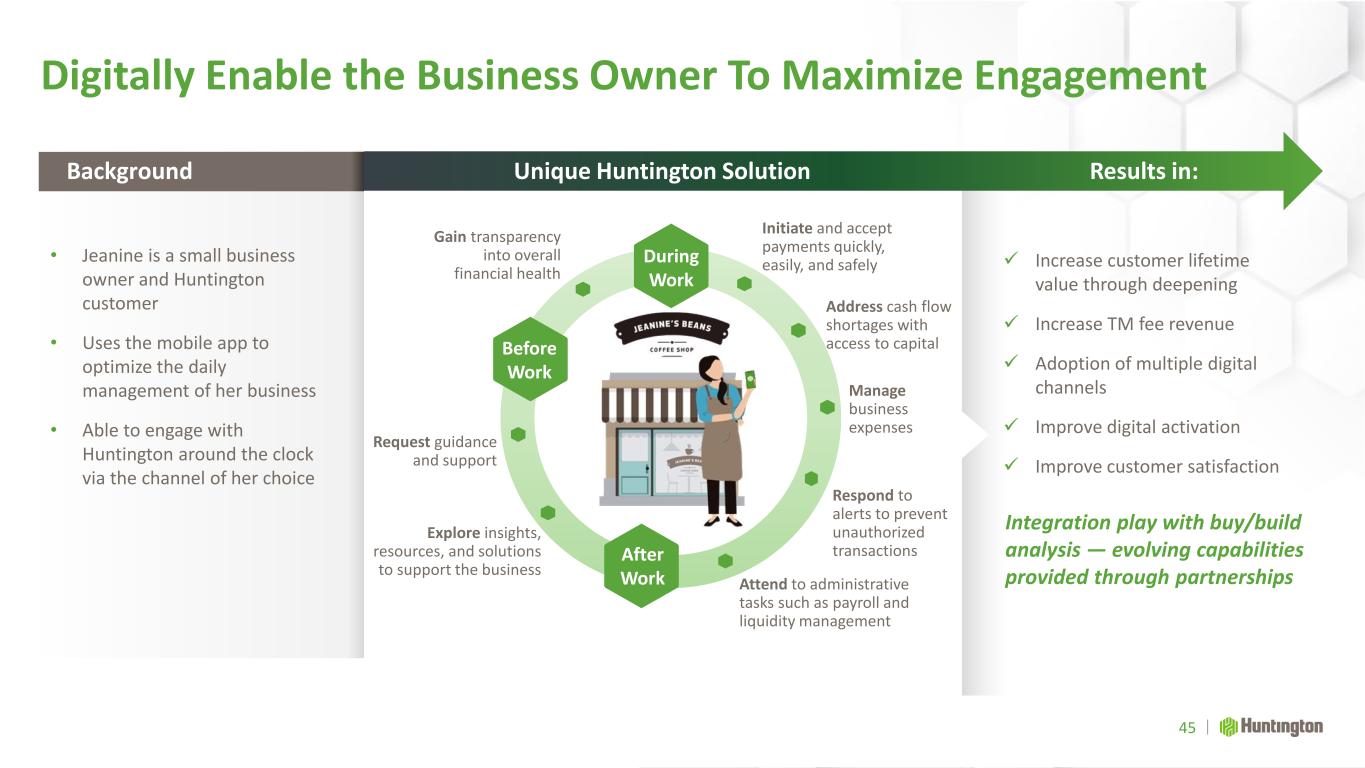
Unique Huntington Solution Results in: Digitally Enable the Business Owner To Maximize Engagement During Work After Work Before Work Initiate and accept payments quickly, easily, and safely Address cash flow shortages with access to capital Manage business expenses Gain transparency into overall financial health Respond to alerts to prevent unauthorized transactions Explore insights, resources, and solutions to support the business Attend to administrative tasks such as payroll and liquidity management Request guidance and support Integration play with buy/build analysis — evolving capabilities provided through partnerships ✓ Increase customer lifetime value through deepening ✓ Increase TM fee revenue ✓ Adoption of multiple digital channels ✓ Improve digital activation ✓ Improve customer satisfaction 45 Background • Jeanine is a small business owner and Huntington customer • Uses the mobile app to optimize the daily management of her business • Able to engage with Huntington around the clock via the channel of her choice
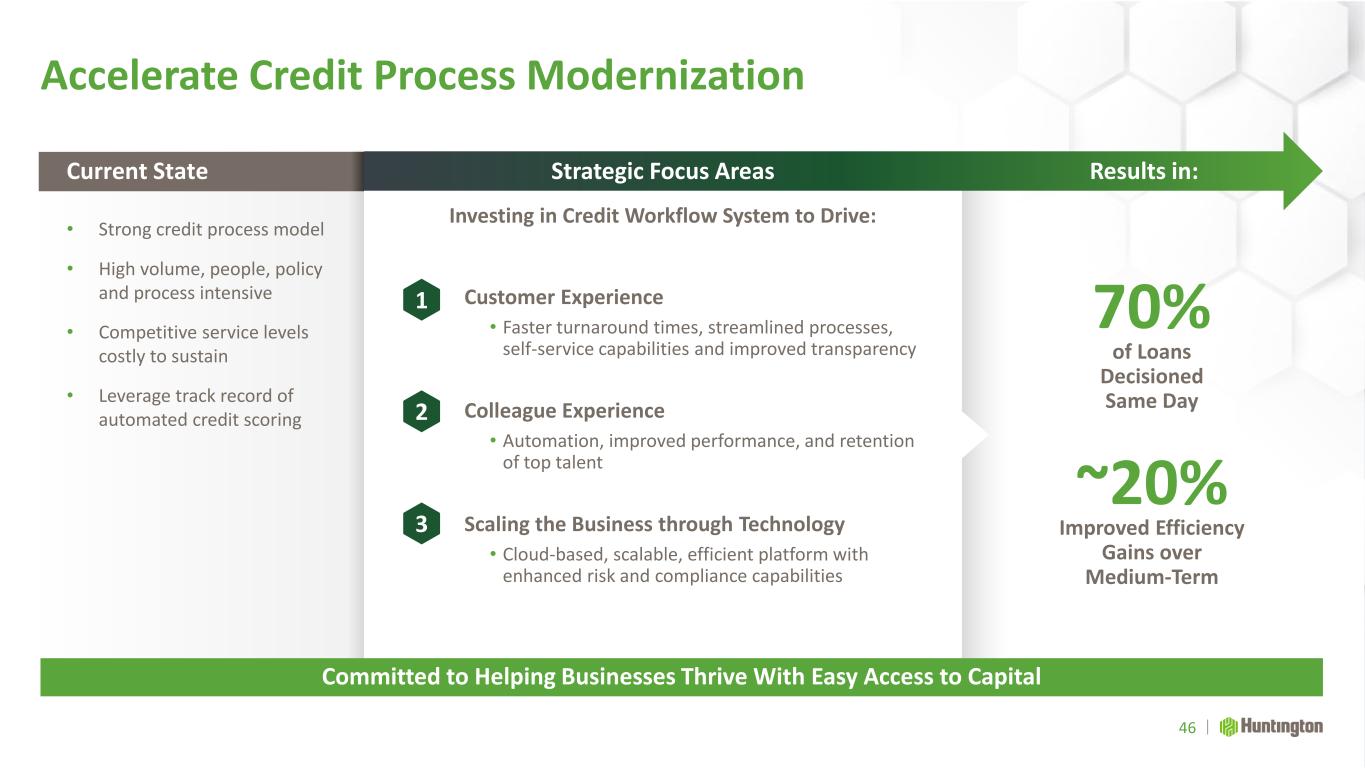
Strategic Focus Areas Accelerate Credit Process Modernization 46 Committed to Helping Businesses Thrive With Easy Access to Capital Customer Experience • Faster turnaround times, streamlined processes, self-service capabilities and improved transparency Colleague Experience • Automation, improved performance, and retention of top talent Scaling the Business through Technology • Cloud-based, scalable, efficient platform with enhanced risk and compliance capabilities Investing in Credit Workflow System to Drive: 70% 3 2 1 Results in:Current State • Strong credit process model • High volume, people, policy and process intensive • Competitive service levels costly to sustain • Leverage track record of automated credit scoring Improved Efficiency Gains over Medium-Term ~20% of Loans Decisioned Same Day
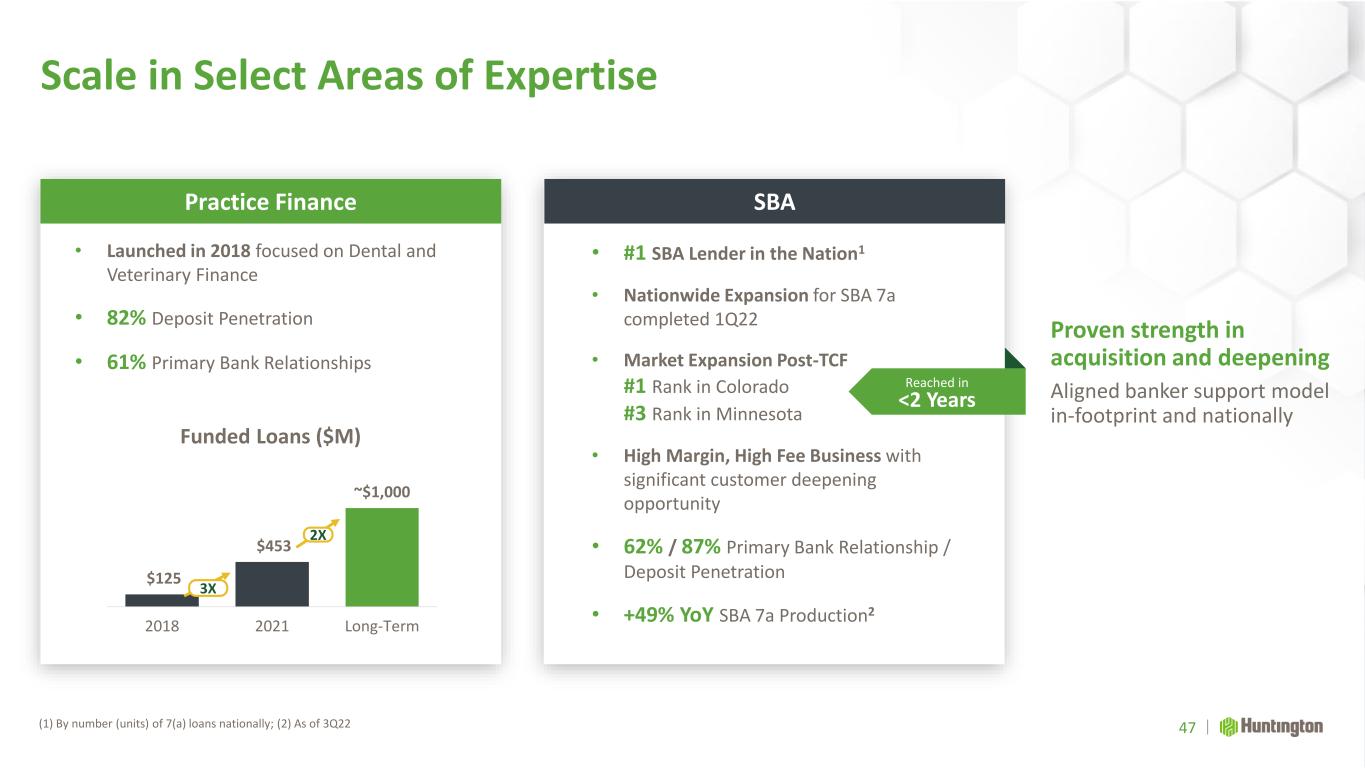
Proven strength in acquisition and deepening Aligned banker support model in-footprint and nationally • Launched in 2018 focused on Dental and Veterinary Finance • 82% Deposit Penetration • 61% Primary Bank Relationships Scale in Select Areas of Expertise (1) By number (units) of 7(a) loans nationally; (2) As of 3Q22 47 • #1 SBA Lender in the Nation1 • Nationwide Expansion for SBA 7a completed 1Q22 • Market Expansion Post-TCF #1 Rank in Colorado #3 Rank in Minnesota • High Margin, High Fee Business with significant customer deepening opportunity • 62% / 87% Primary Bank Relationship / Deposit Penetration • +49% YoY SBA 7a Production2 Practice Finance SBA Funded Loans ($M) Reached in <2 Years $125 $453 ~$1,000 2018 2021 Long-Term 3X 2X
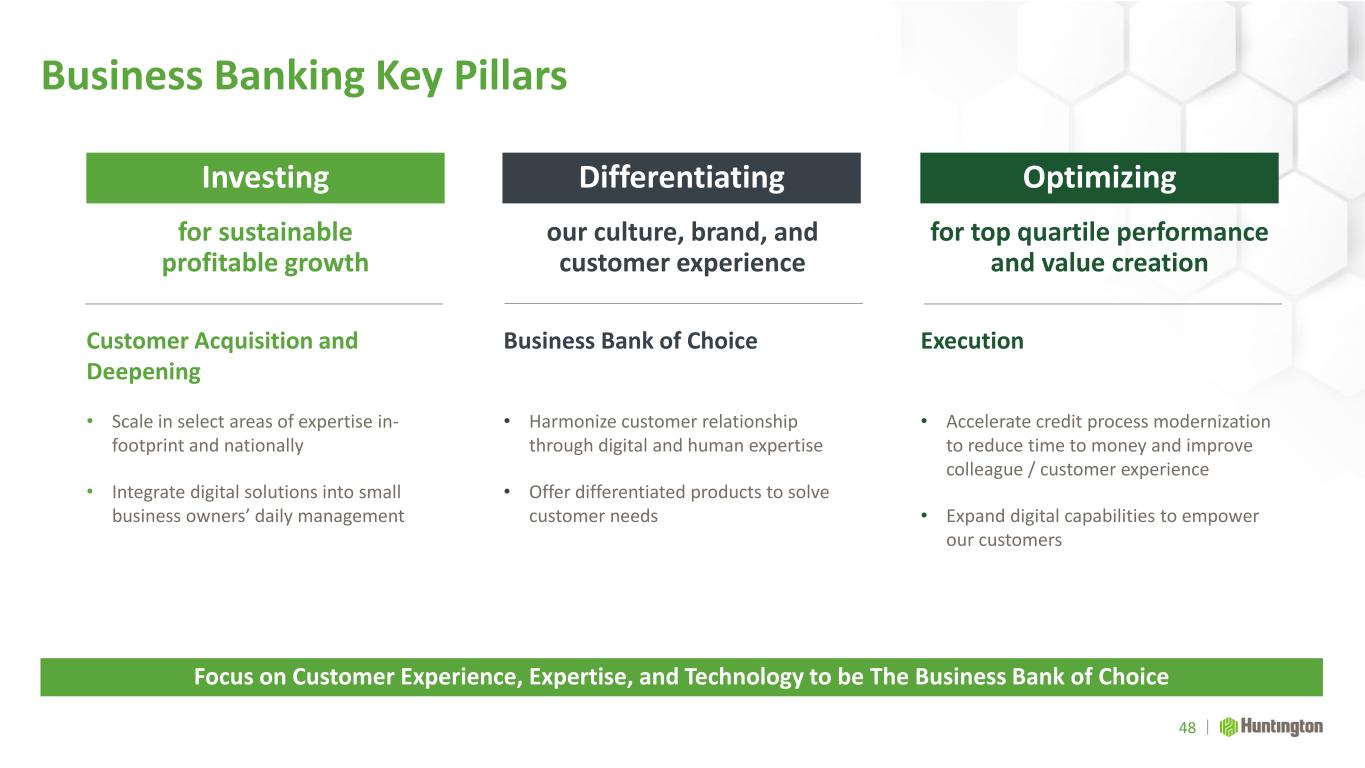
Business Banking Key Pillars Execution • Accelerate credit process modernization to reduce time to money and improve colleague / customer experience • Expand digital capabilities to empower our customers 48 Focus on Customer Experience, Expertise, and Technology to be The Business Bank of Choice Business Bank of Choice • Harmonize customer relationship through digital and human expertise • Offer differentiated products to solve customer needs Customer Acquisition and Deepening • Scale in select areas of expertise in- footprint and nationally • Integrate digital solutions into small business owners’ daily management Investing Optimizing Differentiating for sustainable profitable growth for top quartile performance and value creation our culture, brand, and customer experience
Commercial Banking Serving the Needs of Businesses and Institutions across the Nation through Our Commercial Bank Scott Kleinman SEVP and President, Commercial Bank
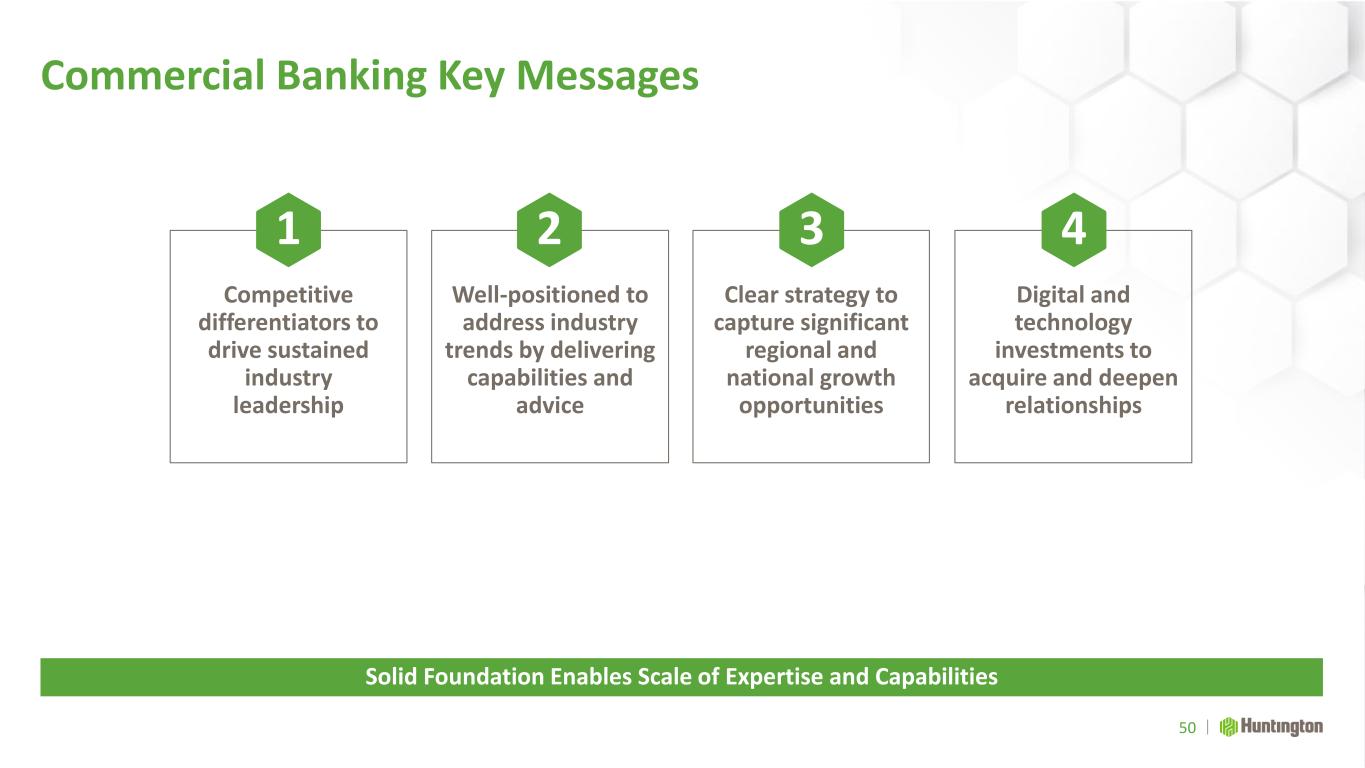
Commercial Banking Key Messages 50 Solid Foundation Enables Scale of Expertise and Capabilities Digital and technology investments to acquire and deepen relationships Clear strategy to capture significant regional and national growth opportunities Well-positioned to address industry trends by delivering capabilities and advice Competitive differentiators to drive sustained industry leadership 1 2 3 4
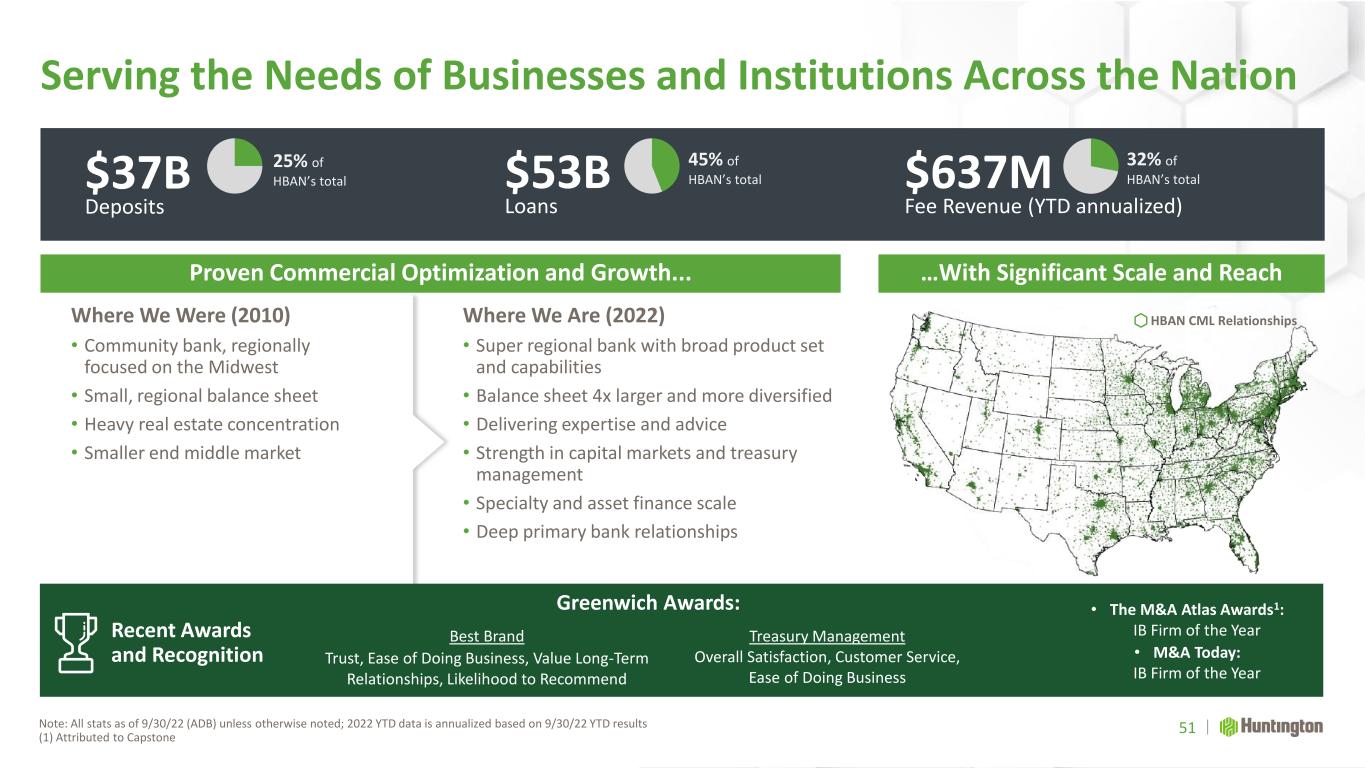
Recent Awards and Recognition Serving the Needs of Businesses and Institutions Across the Nation Note: All stats as of 9/30/22 (ADB) unless otherwise noted; 2022 YTD data is annualized based on 9/30/22 YTD results (1) Attributed to Capstone Proven Commercial Optimization and Growth... …With Significant Scale and Reach $53B Loans 45% of HBAN’s total $637M Fee Revenue (YTD annualized) 32% of HBAN’s total Best Brand Trust, Ease of Doing Business, Value Long-Term Relationships, Likelihood to Recommend Treasury Management Overall Satisfaction, Customer Service, Ease of Doing Business • The M&A Atlas Awards1: IB Firm of the Year • M&A Today: IB Firm of the Year Where We Were (2010) • Community bank, regionally focused on the Midwest • Small, regional balance sheet • Heavy real estate concentration • Smaller end middle market Where We Are (2022) • Super regional bank with broad product set and capabilities • Balance sheet 4x larger and more diversified • Delivering expertise and advice • Strength in capital markets and treasury management • Specialty and asset finance scale • Deep primary bank relationships 51 $37B Deposits 25% of HBAN’s total HBAN CML Relationships Greenwich Awards:
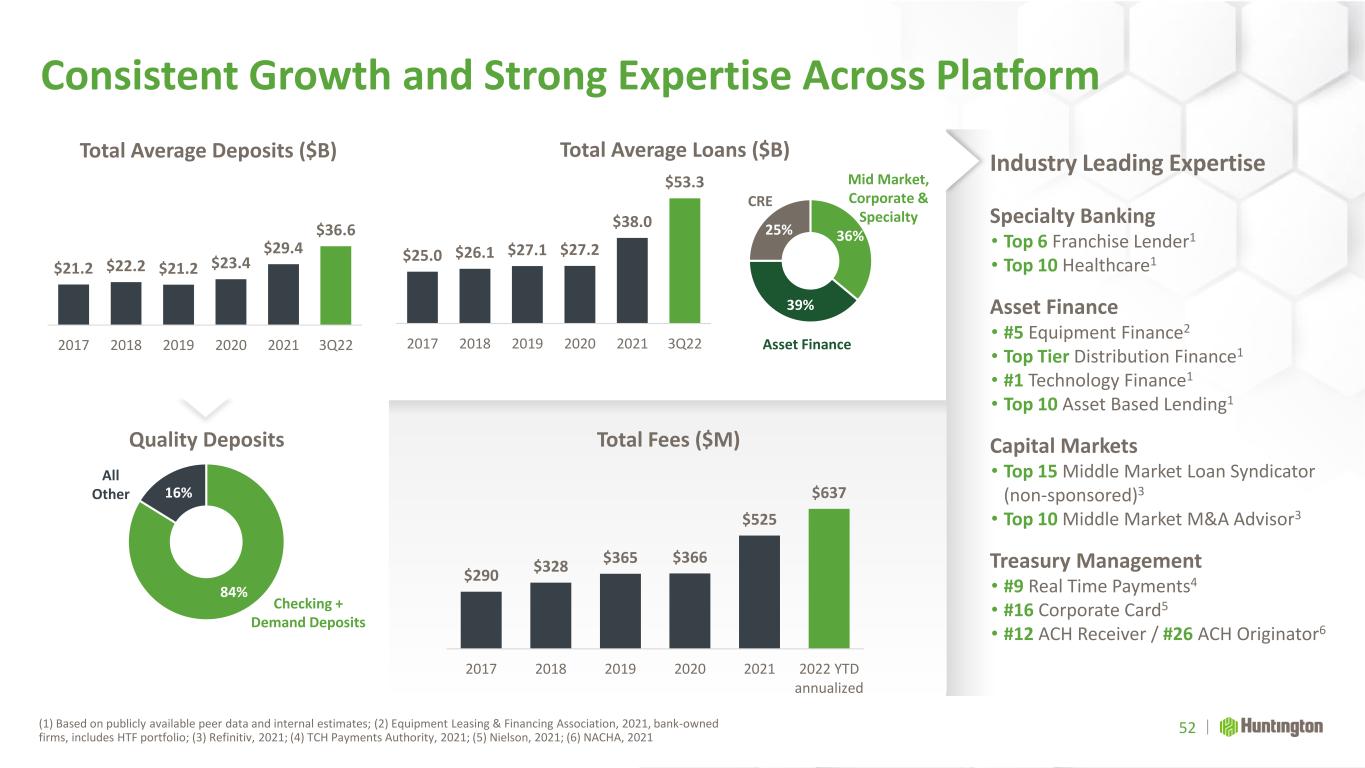
84% 16% 36% 39% 25% Consistent Growth and Strong Expertise Across Platform (1) Based on publicly available peer data and internal estimates; (2) Equipment Leasing & Financing Association, 2021, bank-owned firms, includes HTF portfolio; (3) Refinitiv, 2021; (4) TCH Payments Authority, 2021; (5) Nielson, 2021; (6) NACHA, 2021 $290 $328 $365 $366 $525 $637 2017 2018 2019 2020 2021 2022 YTD annualized Total Fees ($M) Industry Leading Expertise Specialty Banking • Top 6 Franchise Lender1 • Top 10 Healthcare1 Asset Finance • #5 Equipment Finance2 • Top Tier Distribution Finance1 • #1 Technology Finance1 • Top 10 Asset Based Lending1 Capital Markets • Top 15 Middle Market Loan Syndicator (non-sponsored)3 • Top 10 Middle Market M&A Advisor3 Treasury Management • #9 Real Time Payments4 • #16 Corporate Card5 • #12 ACH Receiver / #26 ACH Originator6 $25.0 $26.1 $27.1 $27.2 $38.0 $53.3 2017 2018 2019 2020 2021 3Q22 Total Average Loans ($B) $21.2 $22.2 $21.2 $23.4 $29.4 $36.6 2017 2018 2019 2020 2021 3Q22 Total Average Deposits ($B) 52 Quality Deposits CRE Asset Finance Mid Market, Corporate & Specialty Checking + Demand Deposits All Other
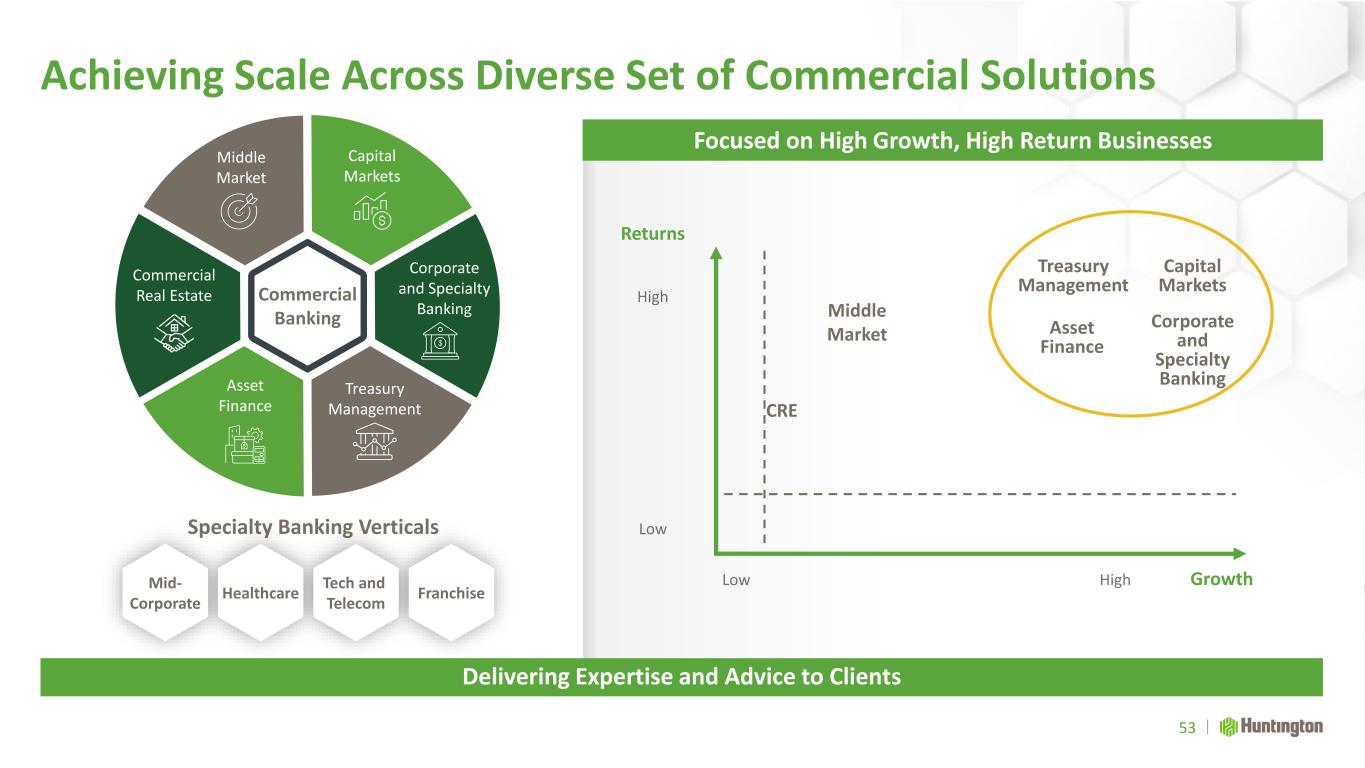
Achieving Scale Across Diverse Set of Commercial Solutions Delivering Expertise and Advice to Clients Specialty Banking Verticals Commercial Banking Corporate and Specialty Banking Commercial Real Estate Asset Finance Capital Markets Treasury Management Returns High Low Low High Growth Middle Market CRE Asset Finance Corporate and Specialty Banking Capital Markets Treasury Management Focused on High Growth, High Return Businesses 53 Mid- Corporate Healthcare Tech and Telecom Franchise Middle Market
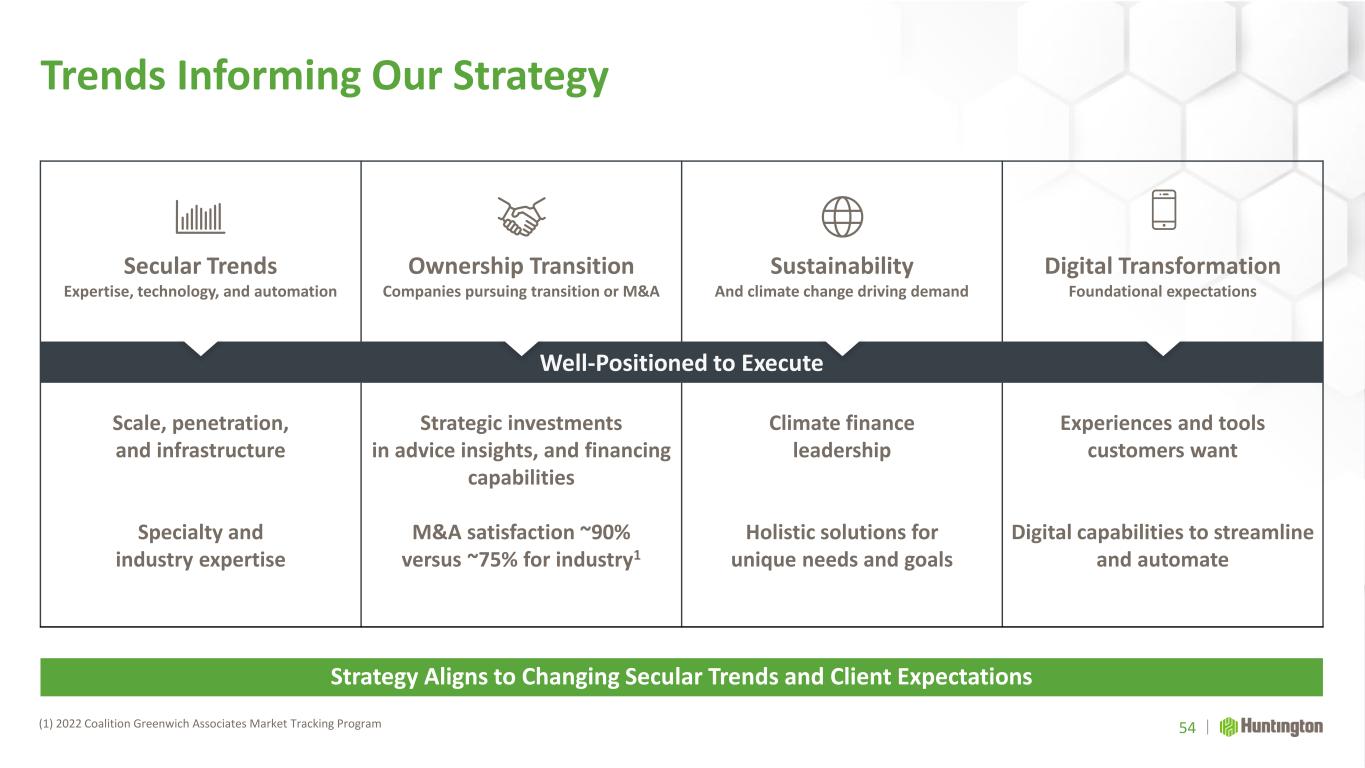
Secular Trends Expertise, technology, and automation Ownership Transition Companies pursuing transition or M&A Sustainability And climate change driving demand Digital Transformation Foundational expectations Well-Positioned to Execute Scale, penetration, and infrastructure Specialty and industry expertise Strategic investments in advice insights, and financing capabilities M&A satisfaction ~90% versus ~75% for industry1 Climate finance leadership Holistic solutions for unique needs and goals Experiences and tools customers want Digital capabilities to streamline and automate Trends Informing Our Strategy (1) 2022 Coalition Greenwich Associates Market Tracking Program 54 Strategy Aligns to Changing Secular Trends and Client Expectations
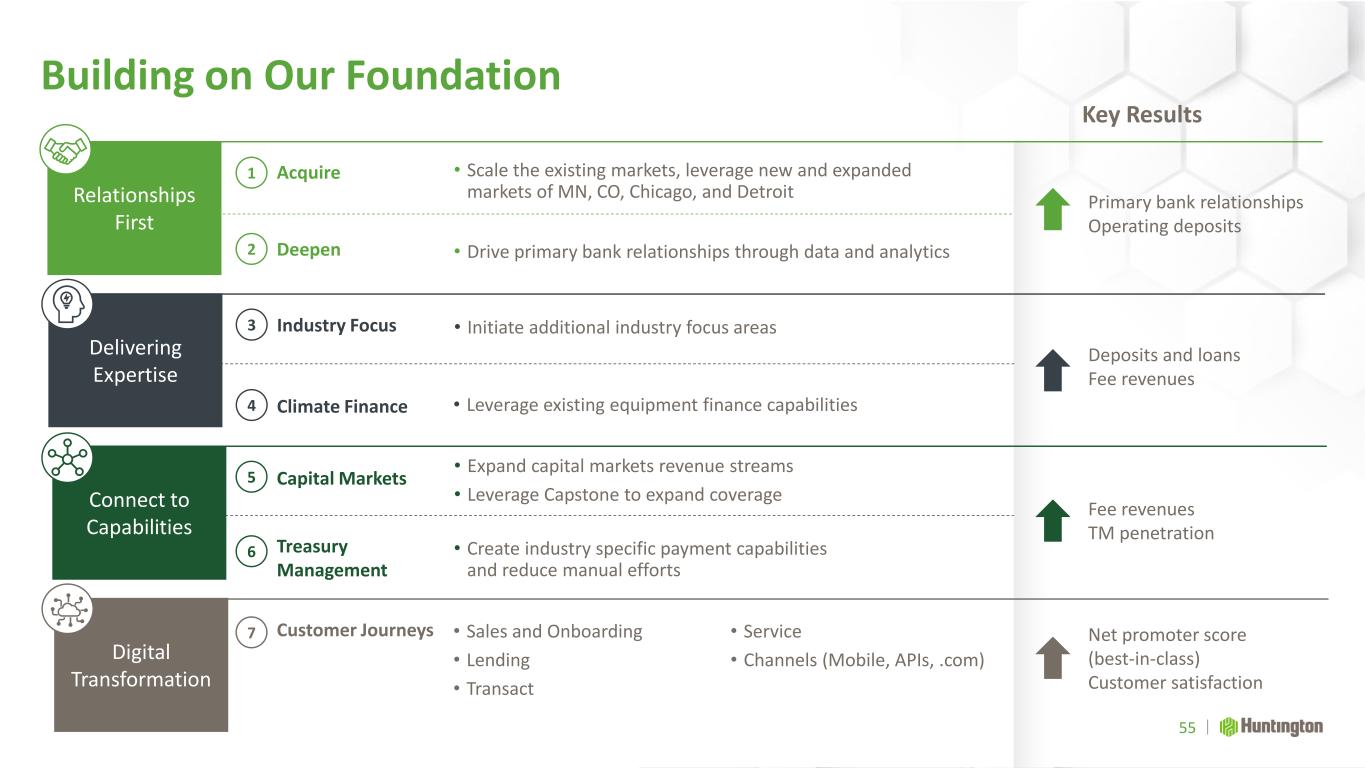
Building on Our Foundation Delivering Expertise Connect to Capabilities Digital Transformation Key Results Primary bank relationships Operating deposits Relationships First Acquire Deepen • Scale the existing markets, leverage new and expanded markets of MN, CO, Chicago, and Detroit 1 2 Deposits and loans Fee revenues • Initiate additional industry focus areas Fee revenues TM penetration • Expand capital markets revenue streams • Leverage Capstone to expand coverage Net promoter score (best-in-class) Customer satisfaction Industry Focus Climate Finance 3 4 Capital Markets Treasury Management 5 6 Customer Journeys7 • Drive primary bank relationships through data and analytics • Leverage existing equipment finance capabilities • Create industry specific payment capabilities and reduce manual efforts 55 • Sales and Onboarding • Lending • Transact • Service • Channels (Mobile, APIs, .com)
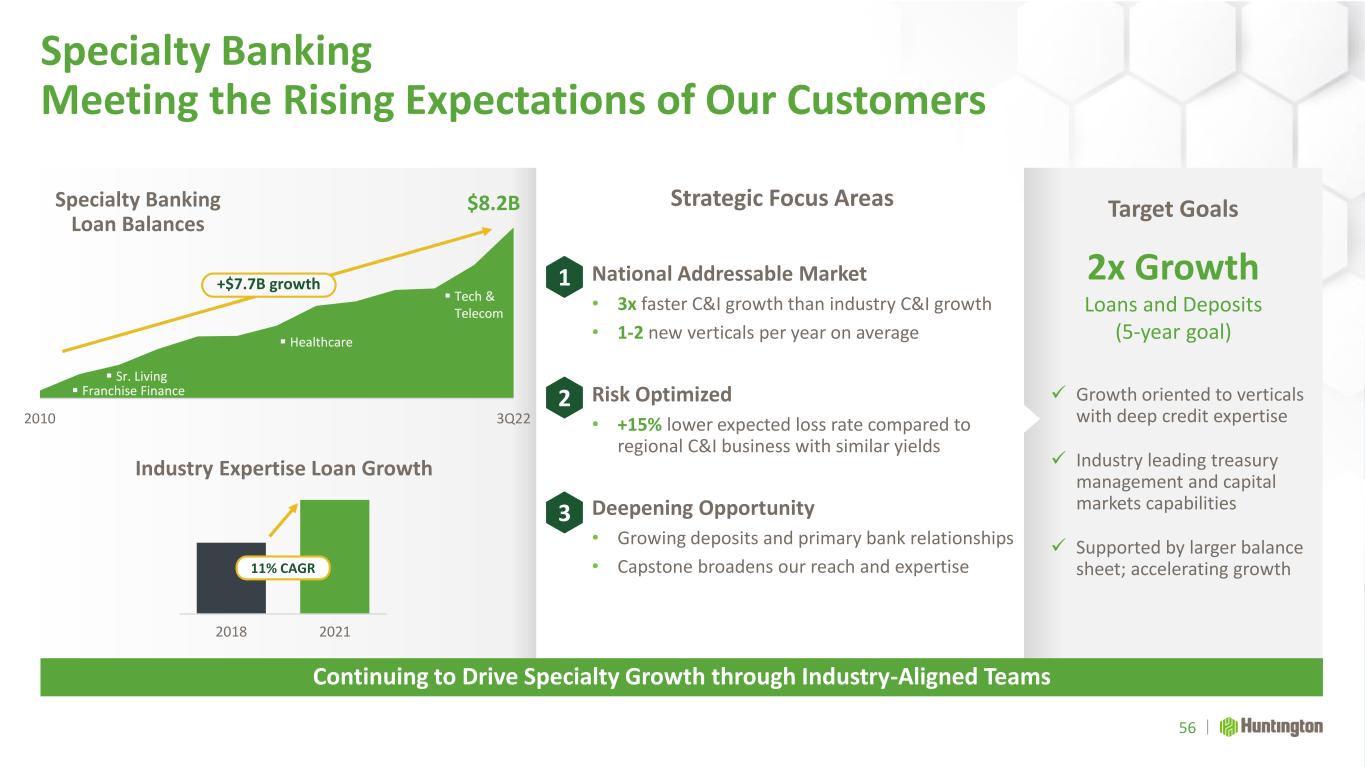
Strategic Focus Areas National Addressable Market • 3x faster C&I growth than industry C&I growth • 1-2 new verticals per year on average Risk Optimized • +15% lower expected loss rate compared to regional C&I business with similar yields Deepening Opportunity • Growing deposits and primary bank relationships • Capstone broadens our reach and expertise 2018 2021 Industry Expertise Loan Growth 2010 3Q22 $8.2BSpecialty Banking Loan Balances ▪ Healthcare ▪ Tech & Telecom ▪ Franchise Finance Specialty Banking Meeting the Rising Expectations of Our Customers Continuing to Drive Specialty Growth through Industry-Aligned Teams 3 2 1 56 ▪ Sr. Living Target GoalsStrategic Focus Areas 2x Growth Loans and Deposits (5-year goal) ✓ Growth oriented to verticals with deep credit expertise ✓ Industry leading treasury management and capital markets capabilities ✓ Supported by larger balance sheet; accelerating growth11% CAGR +$7.7B growth
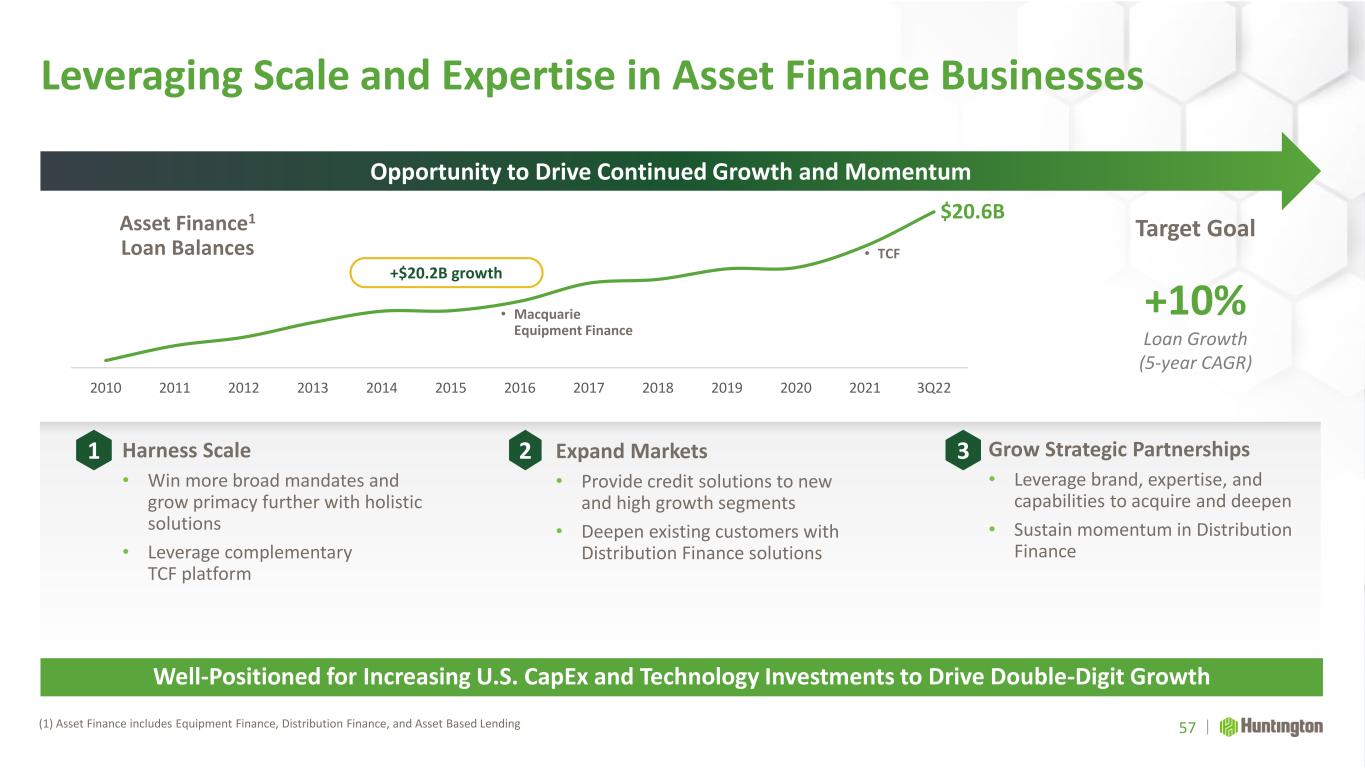
Leveraging Scale and Expertise in Asset Finance Businesses (1) Asset Finance includes Equipment Finance, Distribution Finance, and Asset Based Lending Well-Positioned for Increasing U.S. CapEx and Technology Investments to Drive Double-Digit Growth Grow Strategic Partnerships • Leverage brand, expertise, and capabilities to acquire and deepen • Sustain momentum in Distribution Finance Harness Scale • Win more broad mandates and grow primacy further with holistic solutions • Leverage complementary TCF platform Expand Markets • Provide credit solutions to new and high growth segments • Deepen existing customers with Distribution Finance solutions 2010 2011 2012 2013 2014 2015 2016 2017 2018 2019 2020 2021 3Q22 +$20.2B growth $20.6B Asset Finance1 Loan Balances • Macquarie Equipment Finance • TCF 57 Opportunity to Drive Continued Growth and Momentum Target Goal +10% Loan Growth (5-year CAGR) 321
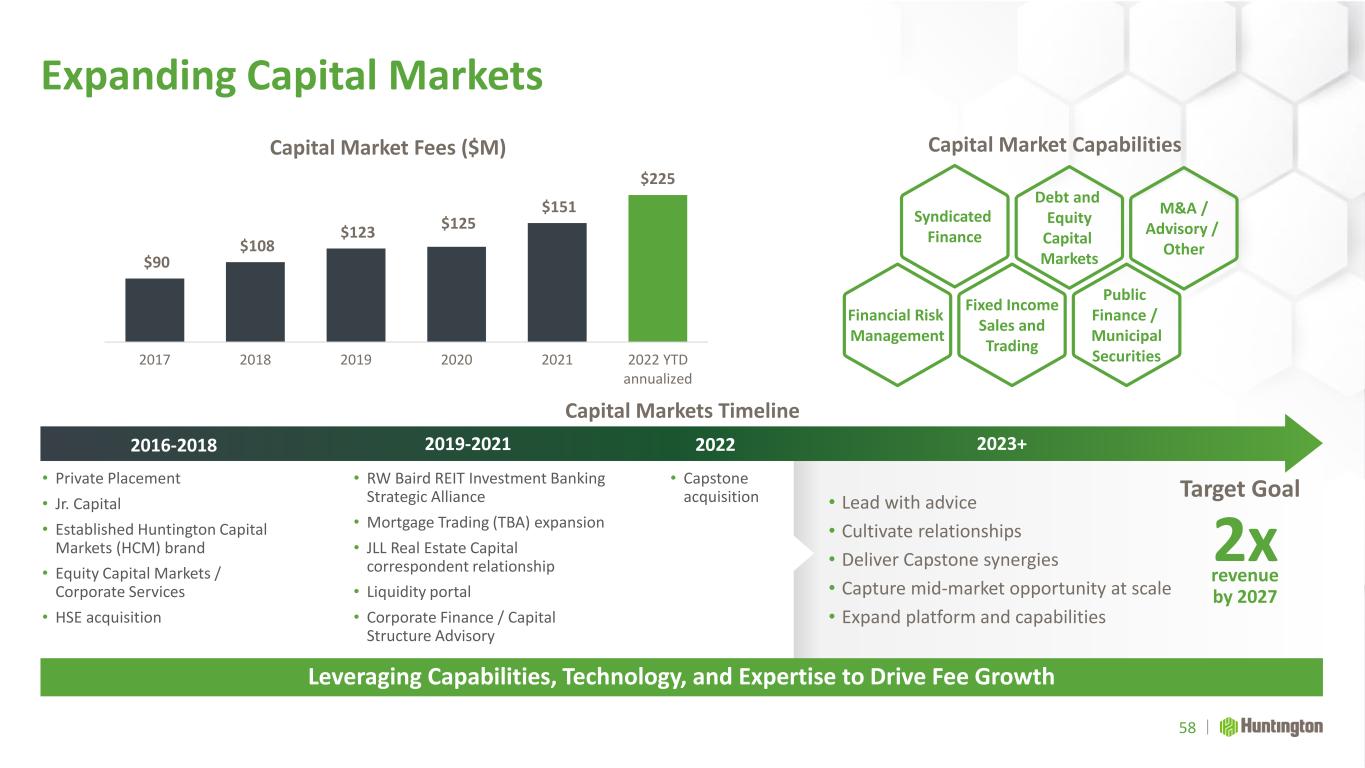
Expanding Capital Markets Leveraging Capabilities, Technology, and Expertise to Drive Fee Growth Capital Markets Timeline 2016-2018 • Private Placement • Jr. Capital • Established Huntington Capital Markets (HCM) brand • Equity Capital Markets / Corporate Services • HSE acquisition 2019-2021 • RW Baird REIT Investment Banking Strategic Alliance • Mortgage Trading (TBA) expansion • JLL Real Estate Capital correspondent relationship • Liquidity portal • Corporate Finance / Capital Structure Advisory 2022 • Capstone acquisition $90 $108 $123 $125 $151 $225 2017 2018 2019 2020 2021 2022 YTD annualized Capital Market Fees ($M) Capital Market Capabilities Financial Risk Management Syndicated Finance Debt and Equity Capital Markets Fixed Income Sales and Trading M&A / Advisory / Other Public Finance / Municipal Securities 2023+ • Lead with advice • Cultivate relationships • Deliver Capstone synergies • Capture mid-market opportunity at scale • Expand platform and capabilities 2x 58 revenue by 2027 Target Goal
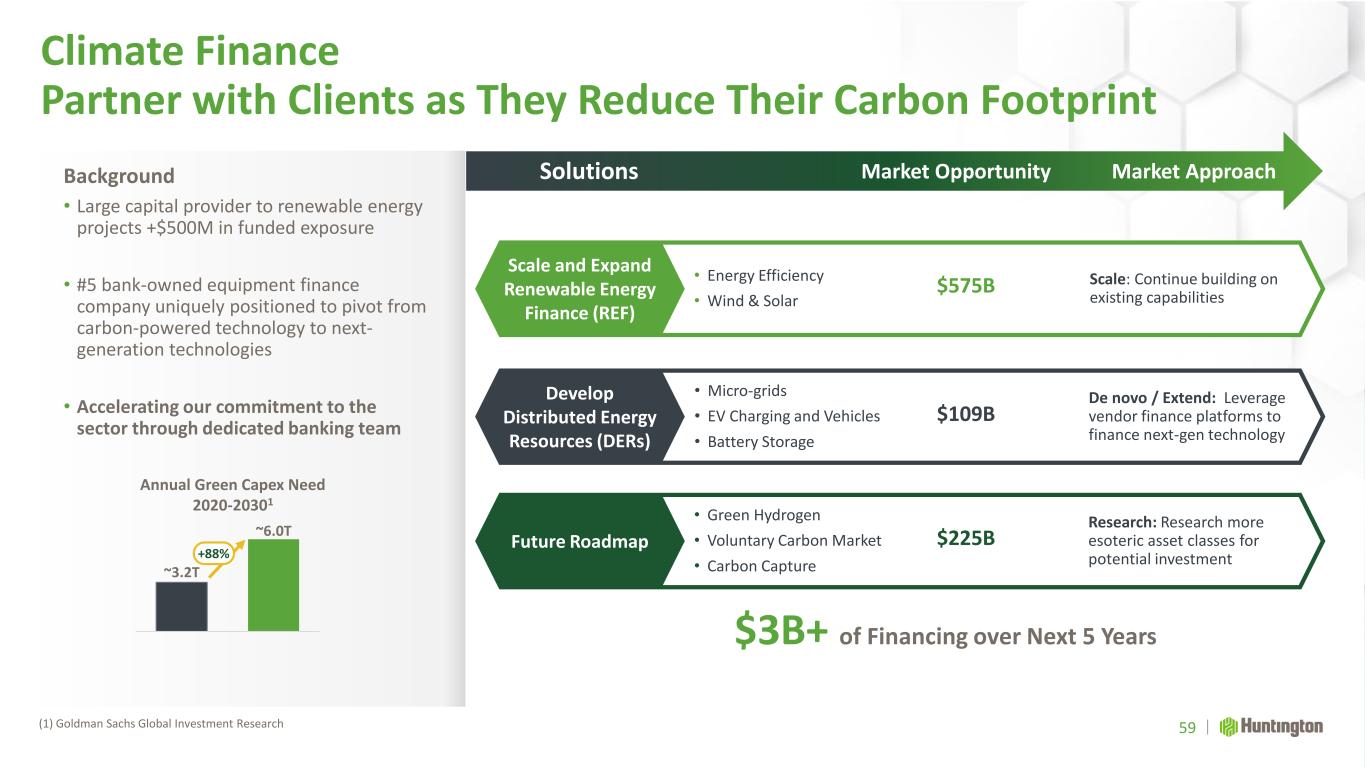
Climate Finance Partner with Clients as They Reduce Their Carbon Footprint (1) Goldman Sachs Global Investment Research Background • Large capital provider to renewable energy projects +$500M in funded exposure • #5 bank-owned equipment finance company uniquely positioned to pivot from carbon-powered technology to next- generation technologies • Accelerating our commitment to the sector through dedicated banking team Annual Green Capex Need 2020-20301 ~3.2T ~6.0T • Energy Efficiency • Wind & Solar $575B Scale and Expand Renewable Energy Finance (REF) Develop Distributed Energy Resources (DERs) Future Roadmap • Micro-grids • EV Charging and Vehicles • Battery Storage • Green Hydrogen • Voluntary Carbon Market • Carbon Capture $109B $225B Scale: Continue building on existing capabilities De novo / Extend: Leverage vendor finance platforms to finance next-gen technology Research: Research more esoteric asset classes for potential investment $3B+ of Financing over Next 5 Years Solutions Market Opportunity Market Approach 59 +88%
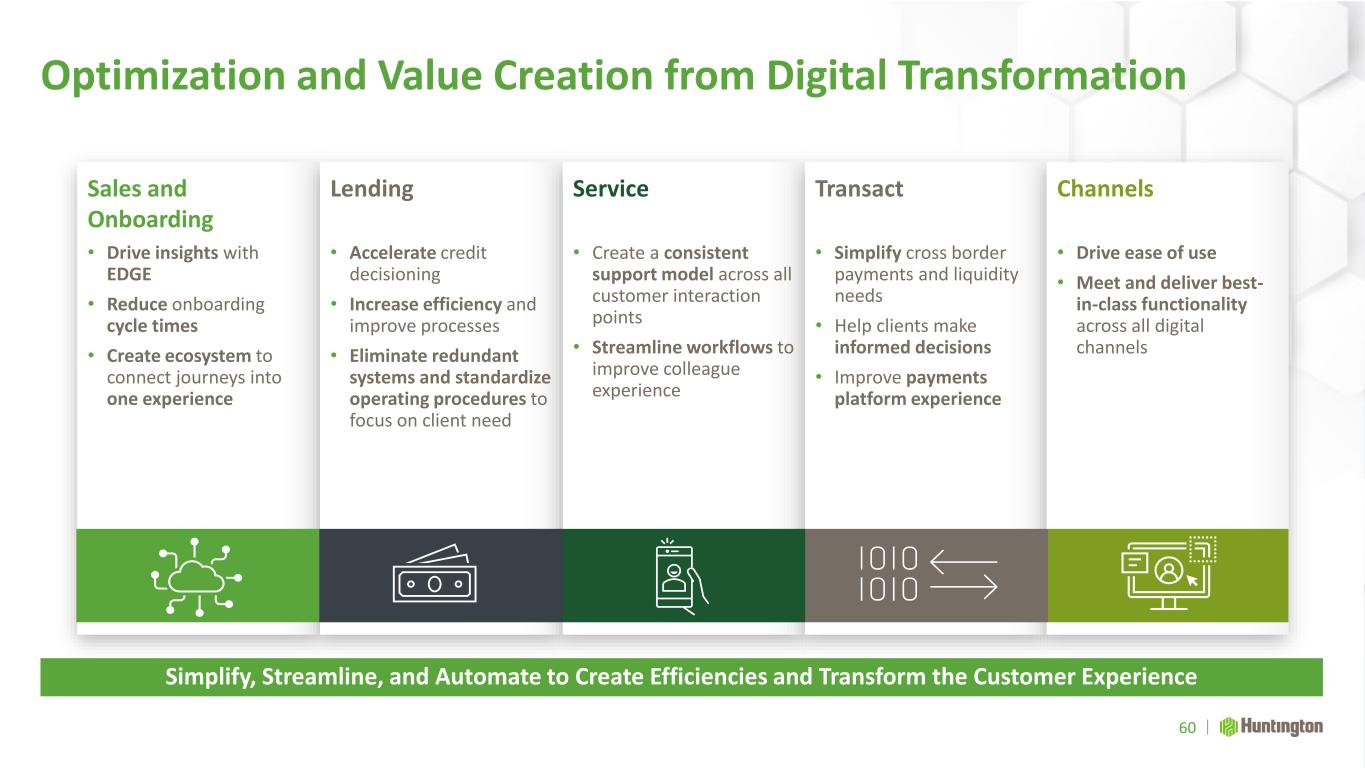
Optimization and Value Creation from Digital Transformation 60 Simplify, Streamline, and Automate to Create Efficiencies and Transform the Customer Experience Sales and Onboarding • Drive insights with EDGE • Reduce onboarding cycle times • Create ecosystem to connect journeys into one experience Lending • Accelerate credit decisioning • Increase efficiency and improve processes • Eliminate redundant systems and standardize operating procedures to focus on client need Service • Create a consistent support model across all customer interaction points • Streamline workflows to improve colleague experience Transact • Simplify cross border payments and liquidity needs • Help clients make informed decisions • Improve payments platform experience Channels • Drive ease of use • Meet and deliver best- in-class functionality across all digital channels
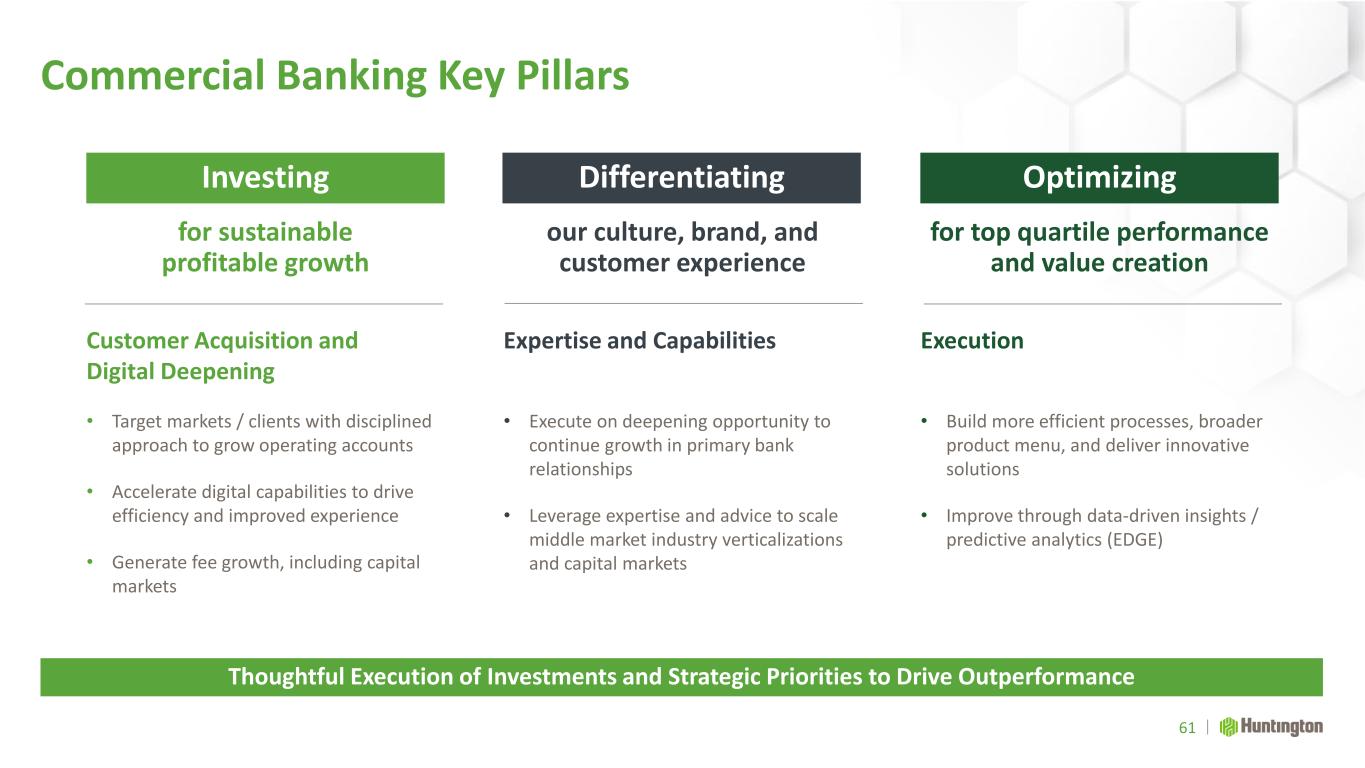
Commercial Banking Key Pillars Execution • Build more efficient processes, broader product menu, and deliver innovative solutions • Improve through data-driven insights / predictive analytics (EDGE) 61 Thoughtful Execution of Investments and Strategic Priorities to Drive Outperformance Expertise and Capabilities • Execute on deepening opportunity to continue growth in primary bank relationships • Leverage expertise and advice to scale middle market industry verticalizations and capital markets Customer Acquisition and Digital Deepening • Target markets / clients with disciplined approach to grow operating accounts • Accelerate digital capabilities to drive efficiency and improved experience • Generate fee growth, including capital markets Investing Optimizing Differentiating for sustainable profitable growth for top quartile performance and value creation our culture, brand, and customer experience
Enterprise Payments Capturing Significant Growth Opportunities in Payments Amit Dhingra EVP, Head of Enterprise Payments
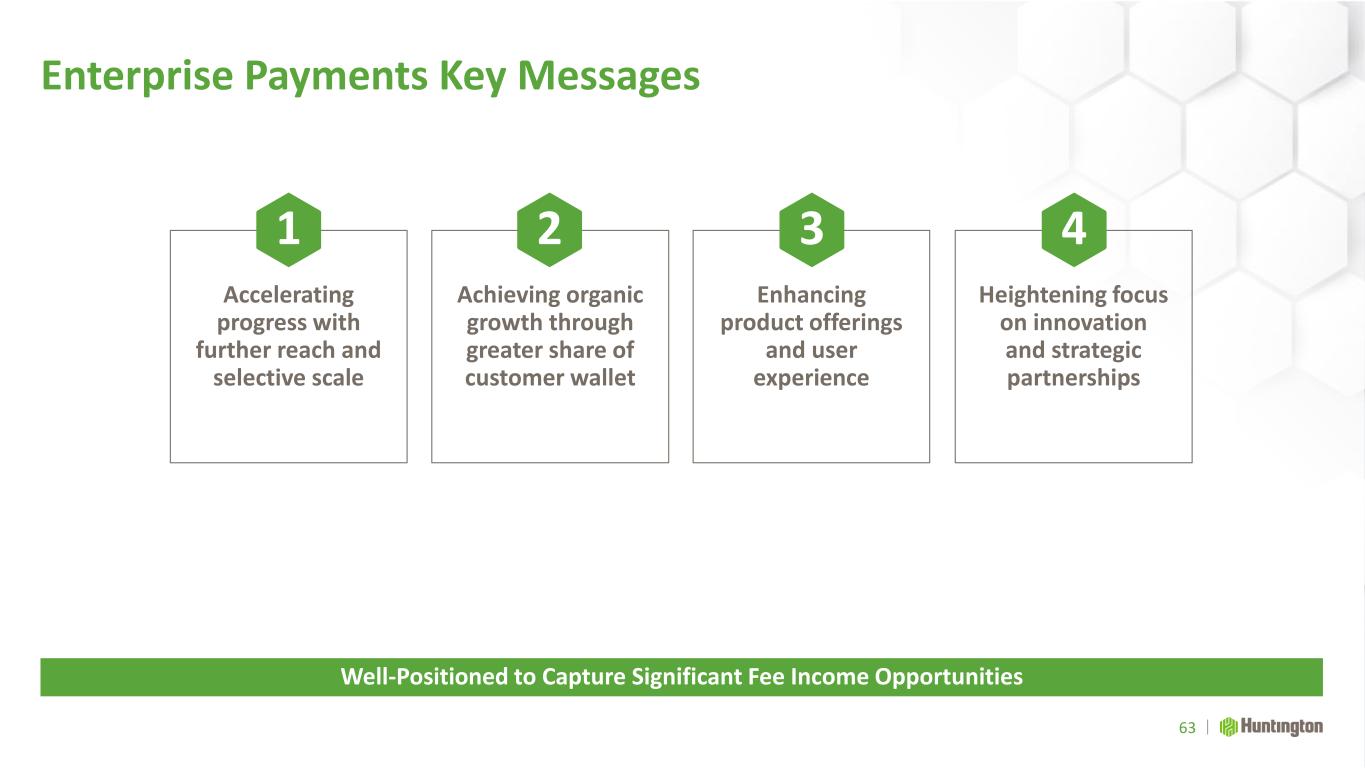
Enterprise Payments Key Messages Well-Positioned to Capture Significant Fee Income Opportunities Heightening focus on innovation and strategic partnerships Enhancing product offerings and user experience Achieving organic growth through greater share of customer wallet Accelerating progress with further reach and selective scale 1 2 3 4 63
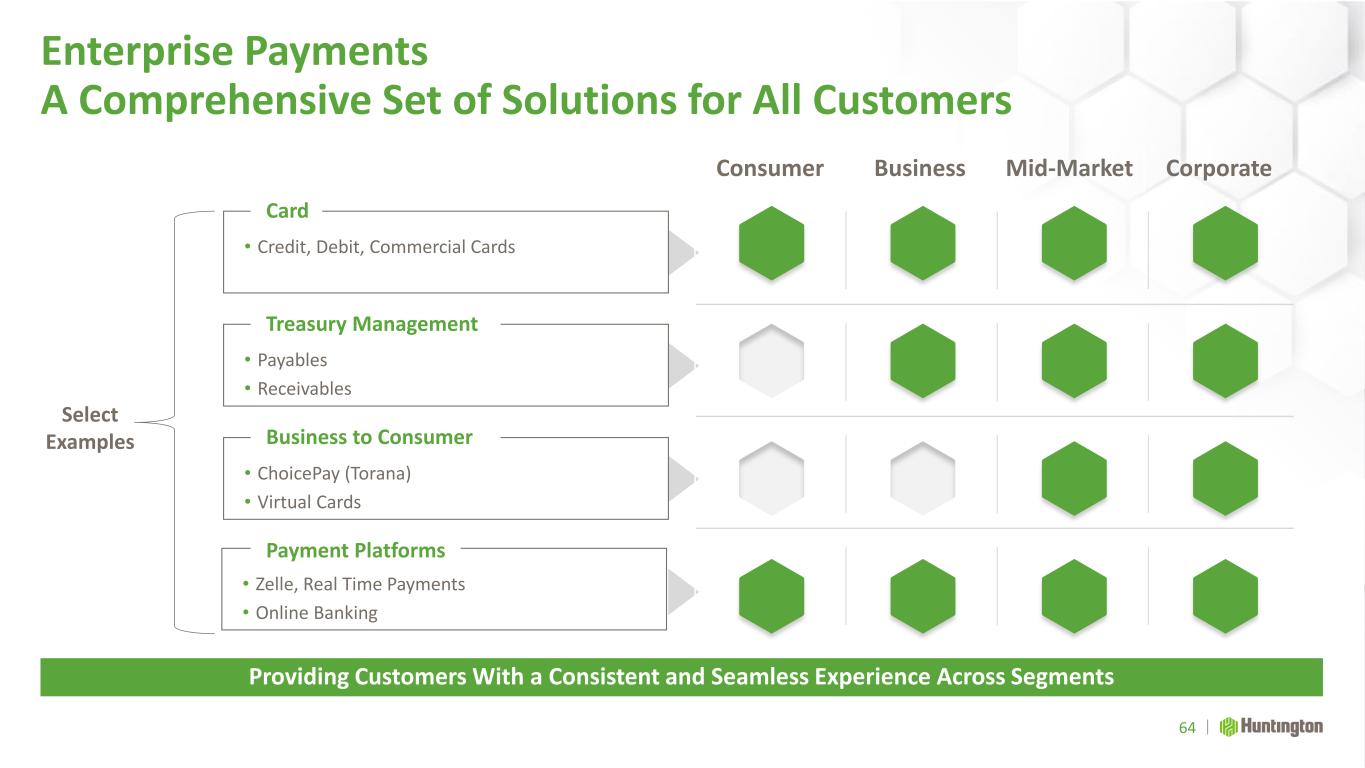
• Zelle, Real Time Payments • Online Banking Enterprise Payments A Comprehensive Set of Solutions for All Customers Providing Customers With a Consistent and Seamless Experience Across Segments Consumer Business Mid-Market Corporate 64 • Credit, Debit, Commercial Cards Card • Payables • Receivables Treasury Management • ChoicePay (Torana) • Virtual Cards Business to Consumer Payment Platforms Select Examples
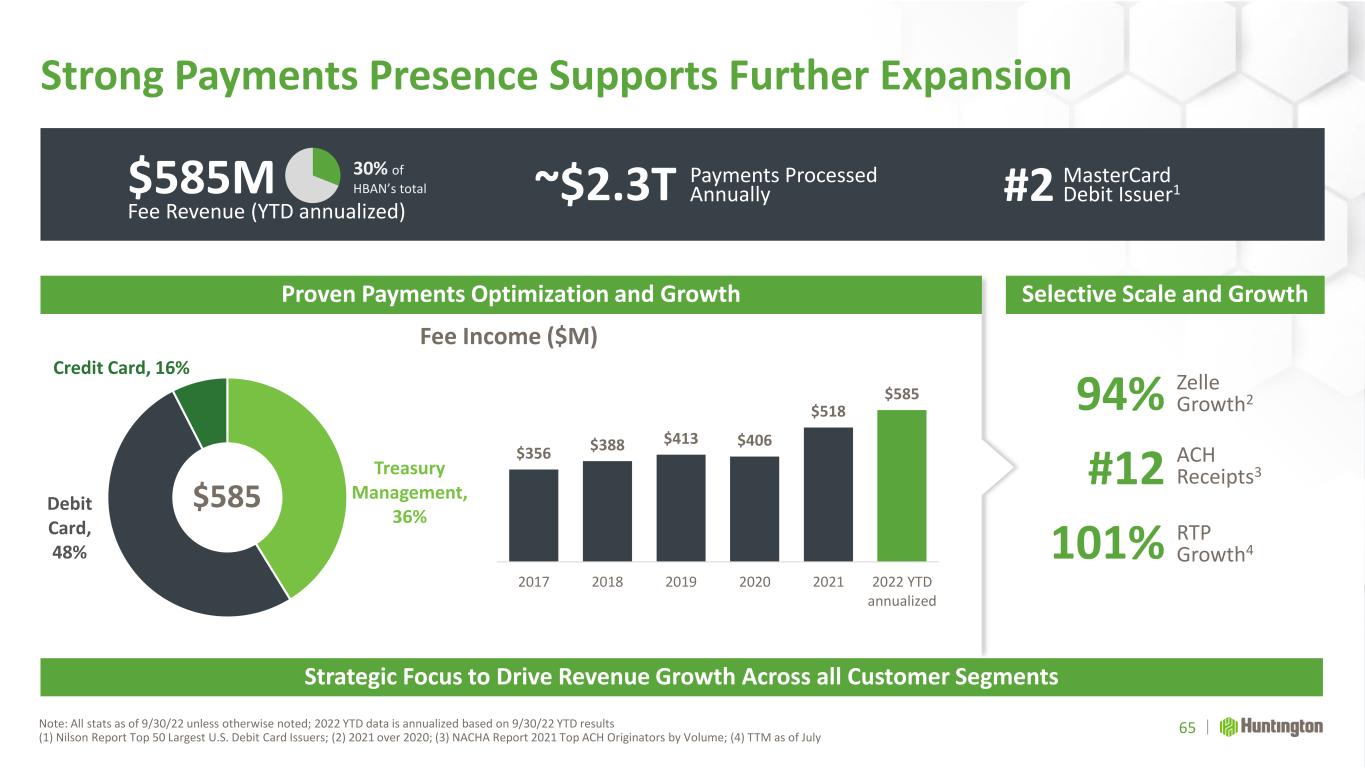
$585M Fee Revenue (YTD annualized) 30% of HBAN’s total ~$2.3T #2 Treasury Management, 36% Debit Card, 48% Credit Card, 16% Strong Payments Presence Supports Further Expansion Proven Payments Optimization and Growth Selective Scale and Growth $356 $388 $413 $406 $518 $585 2017 2018 2019 2020 2021 2022 YTD annualized $585 Strategic Focus to Drive Revenue Growth Across all Customer Segments 65 Fee Income ($M) Note: All stats as of 9/30/22 unless otherwise noted; 2022 YTD data is annualized based on 9/30/22 YTD results (1) Nilson Report Top 50 Largest U.S. Debit Card Issuers; (2) 2021 over 2020; (3) NACHA Report 2021 Top ACH Originators by Volume; (4) TTM as of July ACH Receipts3 RTP Growth4 Zelle Growth294% #12 101% Payments Processed Annually MasterCard Debit Issuer1
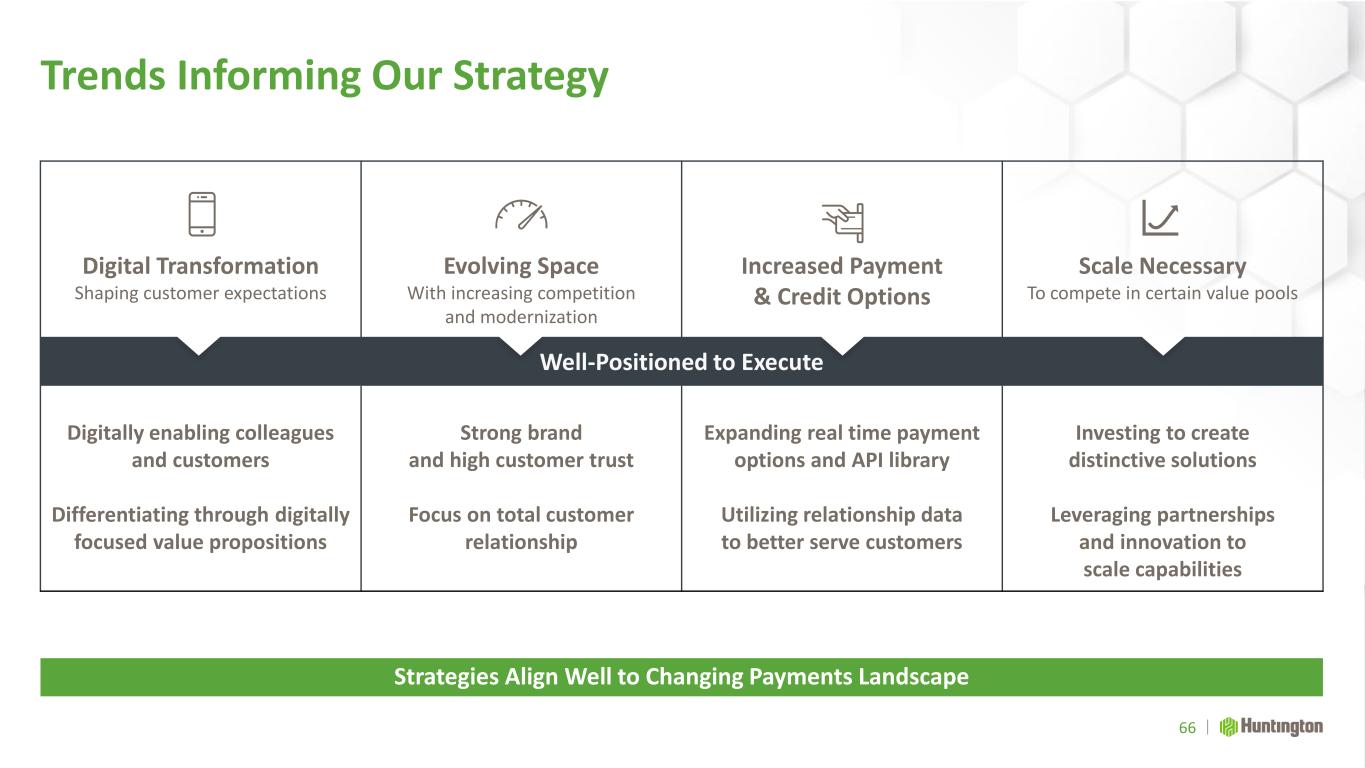
Trends Informing Our Strategy Digital Transformation Shaping customer expectations Evolving Space With increasing competition and modernization Increased Payment & Credit Options Scale Necessary To compete in certain value pools Well-Positioned to Execute Digitally enabling colleagues and customers Differentiating through digitally focused value propositions Strong brand and high customer trust Focus on total customer relationship Expanding real time payment options and API library Utilizing relationship data to better serve customers Investing to create distinctive solutions Leveraging partnerships and innovation to scale capabilities 66 Strategies Align Well to Changing Payments Landscape
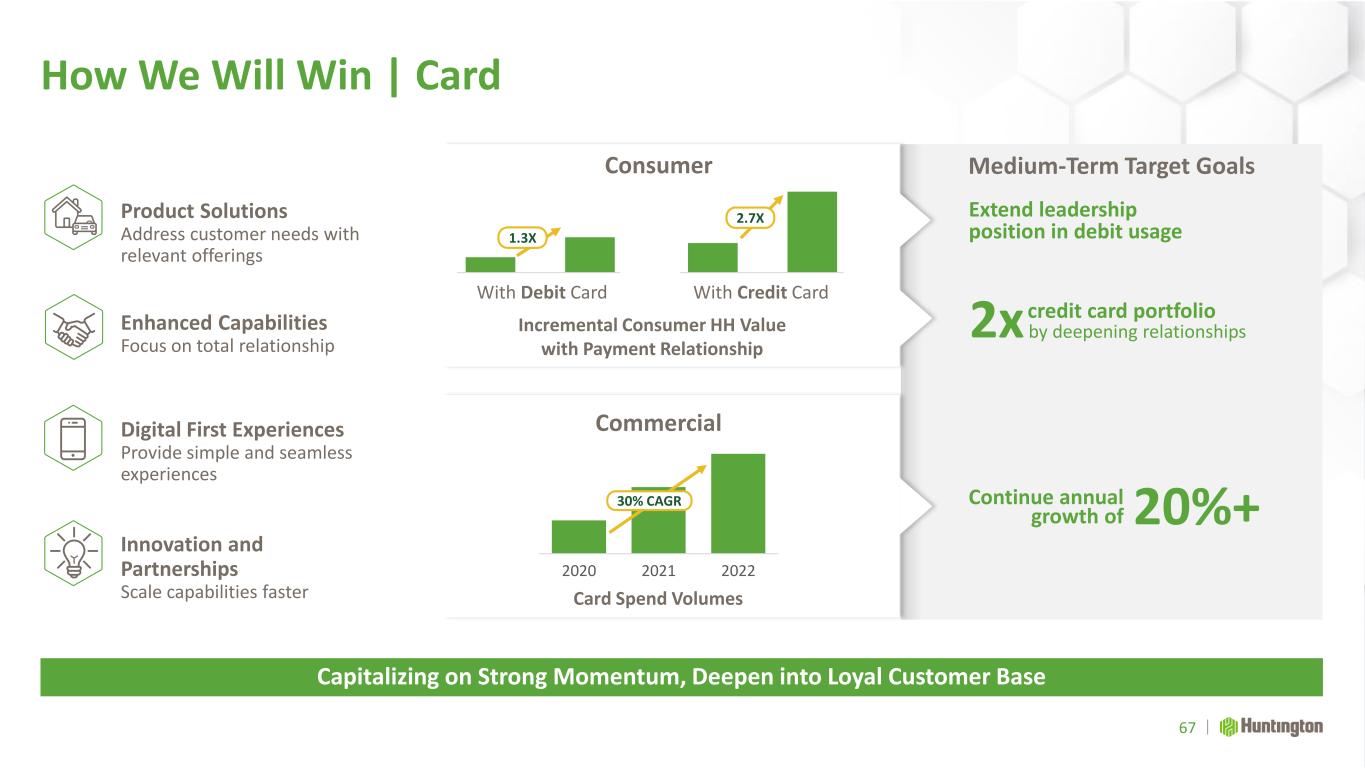
How We Will Win | Card Capitalizing on Strong Momentum, Deepen into Loyal Customer Base Product Solutions Address customer needs with relevant offerings Enhanced Capabilities Focus on total relationship Digital First Experiences Provide simple and seamless experiences Innovation and Partnerships Scale capabilities faster Incremental Consumer HH Value with Payment Relationship Consumer Commercial With Debit Card With Credit Card 2020 2021 2022 Card Spend Volumes Medium-Term Target Goals Extend leadership position in debit usage 67 Continue annual growth of 20%+ credit card portfolio by deepening relationships2x 30% CAGR 1.3X 2.7X
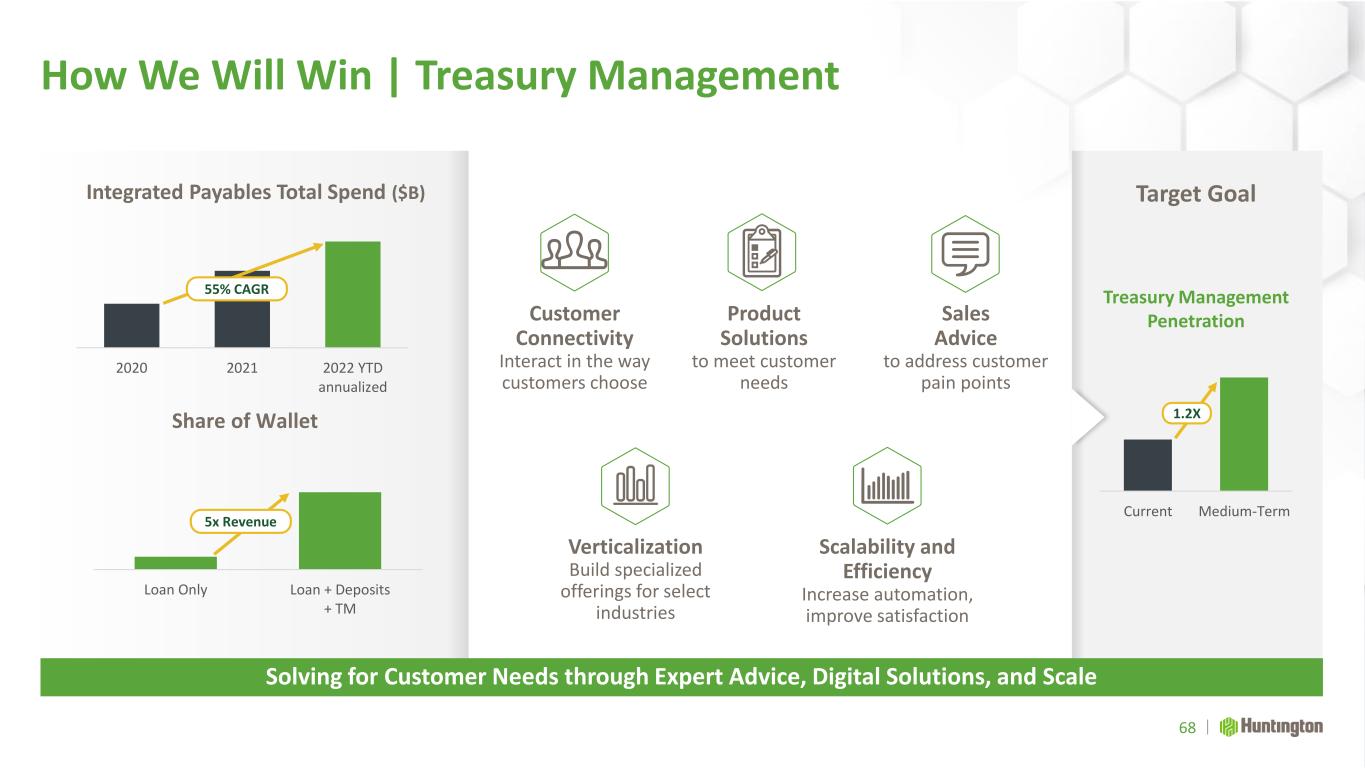
How We Will Win | Treasury Management Target Goal Share of Wallet Integrated Payables Total Spend ($B) Loan Only Loan + Deposits + TM 2020 2021 2022 YTD annualized Customer Connectivity Interact in the way customers choose Product Solutions to meet customer needs Scalability and Efficiency Increase automation, improve satisfaction Verticalization Build specialized offerings for select industries Sales Advice to address customer pain points 68 55% CAGR 5x Revenue Solving for Customer Needs through Expert Advice, Digital Solutions, and Scale Current Medium-Term Treasury Management Penetration 1.2X
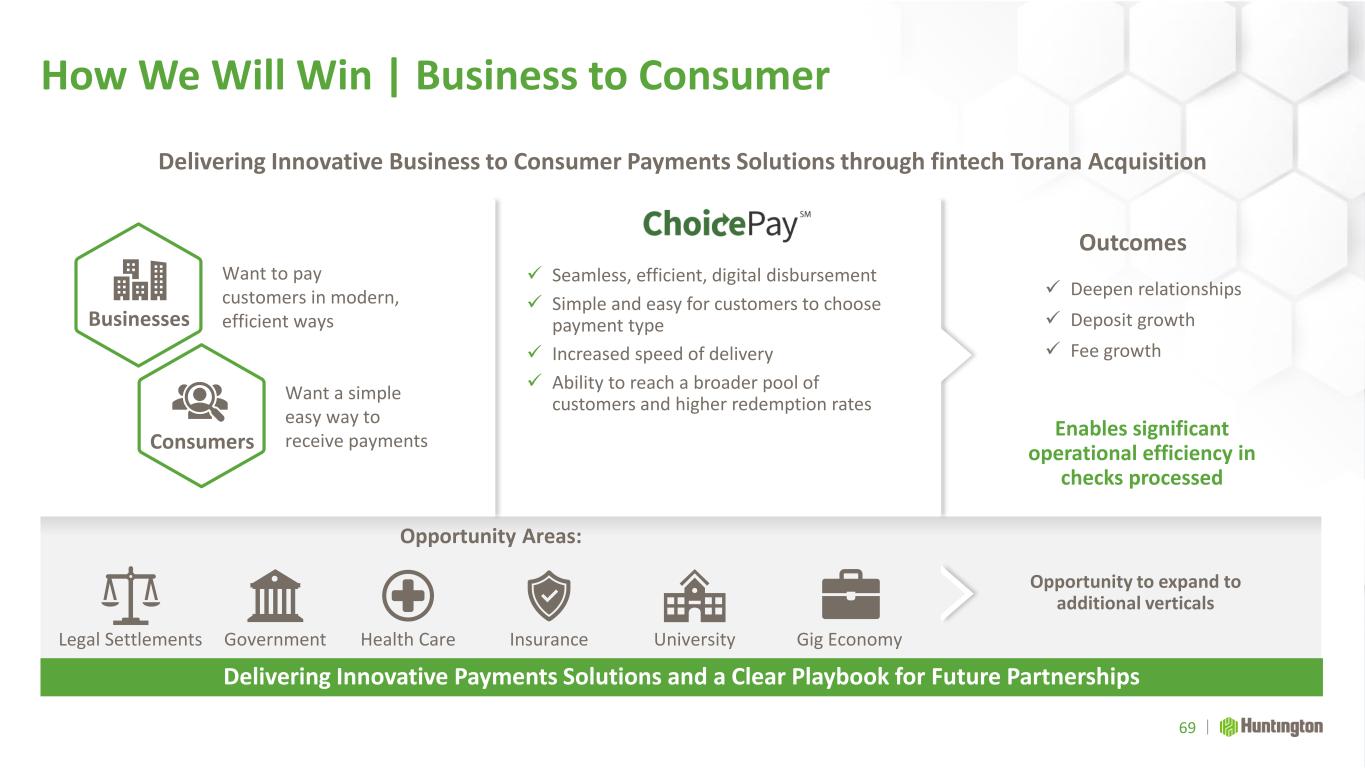
How We Will Win | Business to Consumer Delivering Innovative Payments Solutions and a Clear Playbook for Future Partnerships Opportunity Areas: Legal Settlements Government UniversityHealth Care Insurance Want to pay customers in modern, efficient ways ✓ Seamless, efficient, digital disbursement ✓ Simple and easy for customers to choose payment type ✓ Increased speed of delivery ✓ Ability to reach a broader pool of customers and higher redemption rates Want a simple easy way to receive payments Businesses Consumers 69 Gig Economy Delivering Innovative Business to Consumer Payments Solutions through fintech Torana Acquisition Outcomes Opportunity to expand to additional verticals ✓ Deepen relationships ✓ Fee growth ✓ Deposit growth Enables significant operational efficiency in checks processed
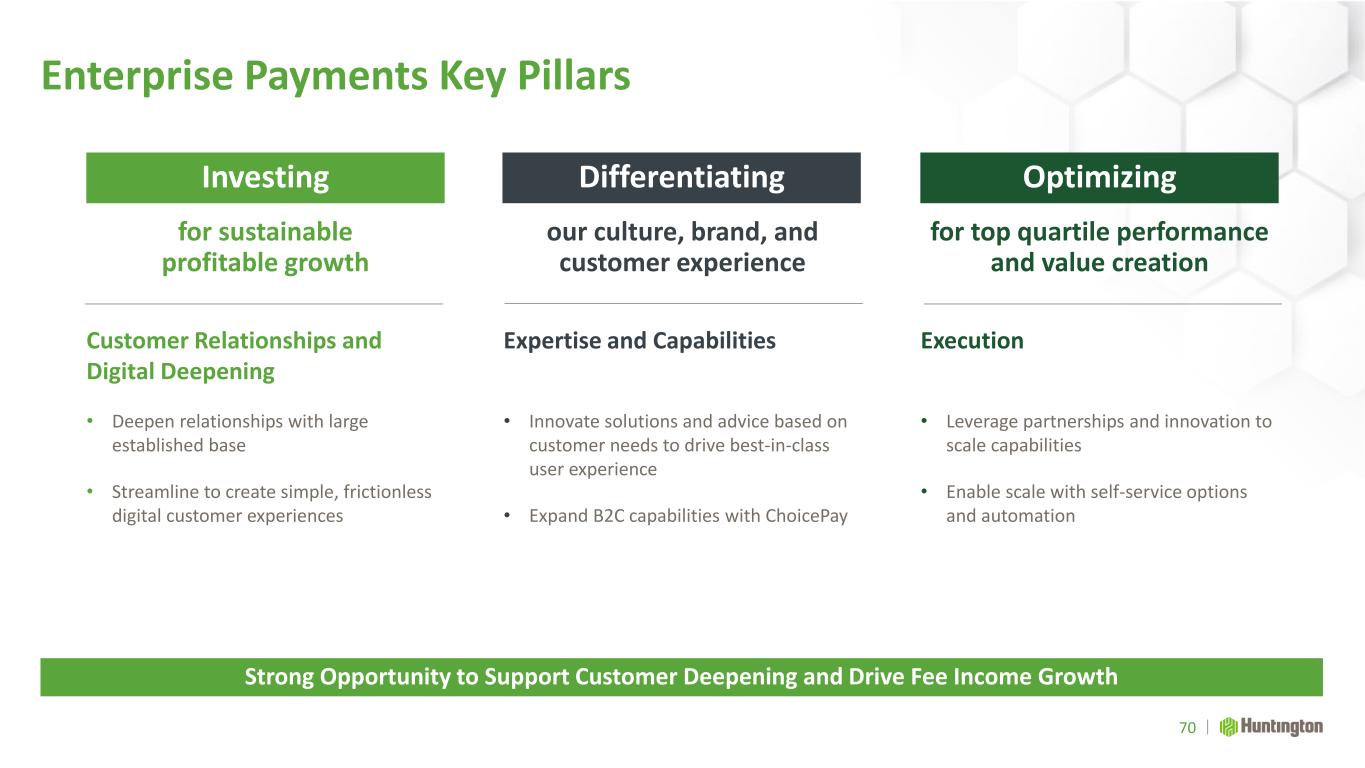
Investing Optimizing Differentiating for sustainable profitable growth for top quartile performance and value creation our culture, brand, and customer experience Enterprise Payments Key Pillars Execution • Leverage partnerships and innovation to scale capabilities • Enable scale with self-service options and automation 70 Strong Opportunity to Support Customer Deepening and Drive Fee Income Growth Expertise and Capabilities • Innovate solutions and advice based on customer needs to drive best-in-class user experience • Expand B2C capabilities with ChoicePay Customer Relationships and Digital Deepening • Deepen relationships with large established base • Streamline to create simple, frictionless digital customer experiences
Vehicle Finance Powerful Franchise Opportunity Delivering Sustainable Results Through the Cycle Rich Porrello EVP and President, Vehicle Finance and Dealer Services
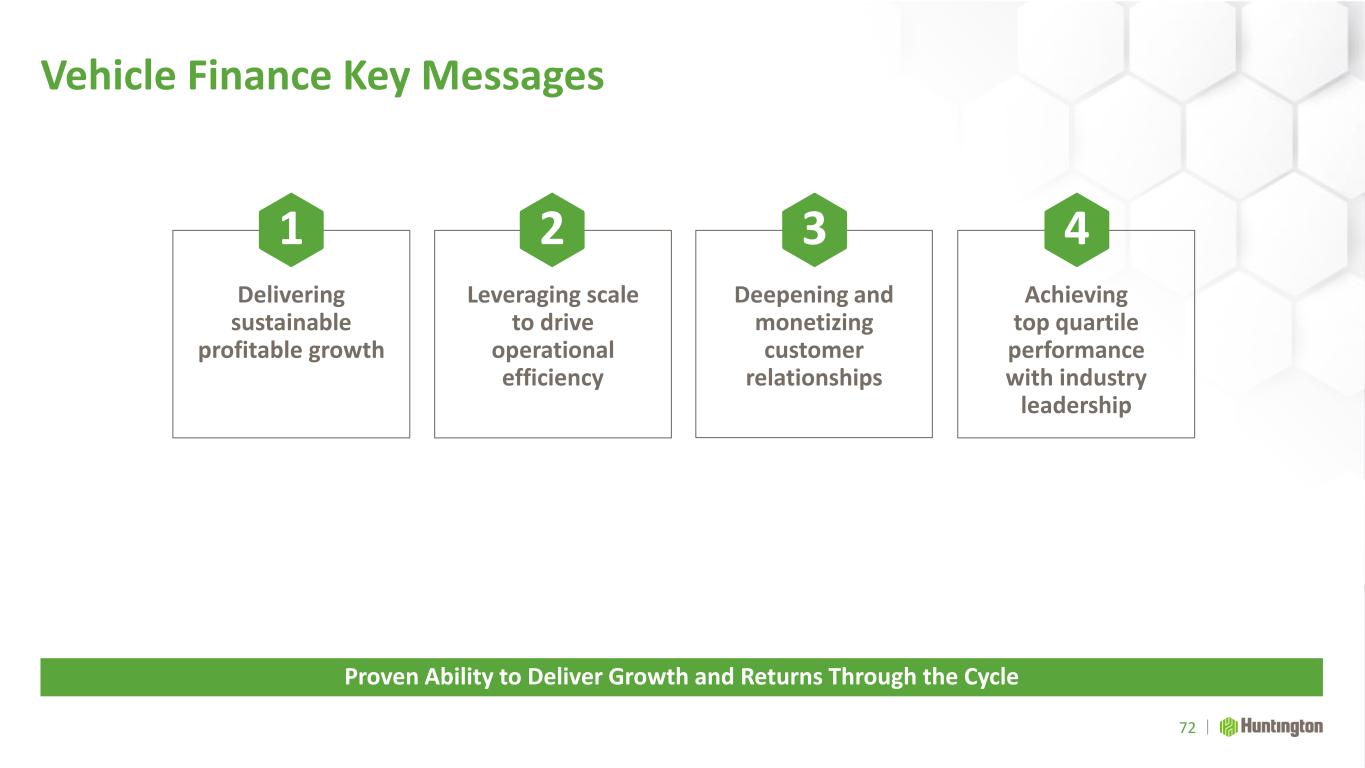
Vehicle Finance Key Messages 72 Proven Ability to Deliver Growth and Returns Through the Cycle Achieving top quartile performance with industry leadership Deepening and monetizing customer relationships Leveraging scale to drive operational efficiency Delivering sustainable profitable growth 1 2 3 4
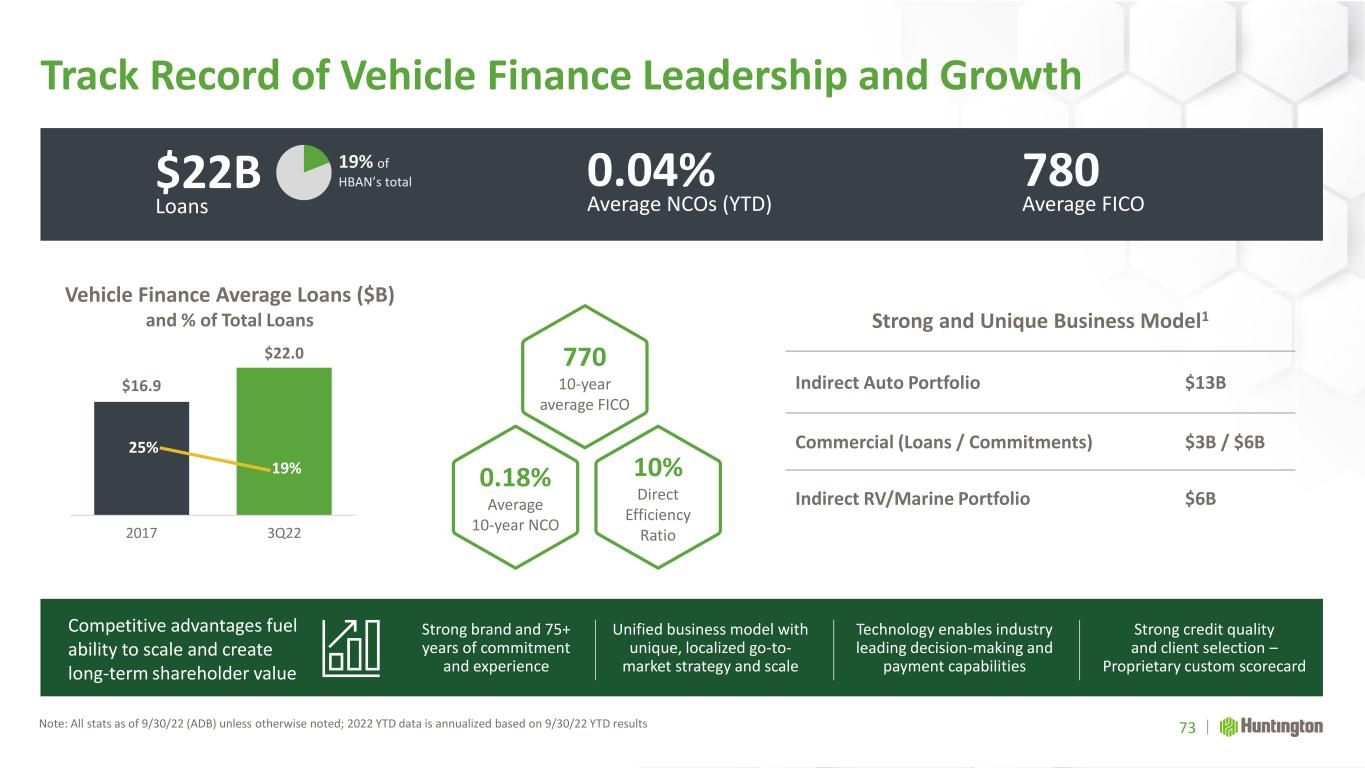
Track Record of Vehicle Finance Leadership and Growth Note: All stats as of 9/30/22 (ADB) unless otherwise noted; 2022 YTD data is annualized based on 9/30/22 YTD results 73 $16.9 $22.0 2017 3Q22 Vehicle Finance Average Loans ($B) and % of Total Loans Competitive advantages fuel ability to scale and create long-term shareholder value Technology enables industry leading decision-making and payment capabilities Strong credit quality and client selection – Proprietary custom scorecard Unified business model with unique, localized go-to- market strategy and scale Strong brand and 75+ years of commitment and experience 10% Direct Efficiency Ratio 0.18% Average 10-year NCO $22B Loans 19% of HBAN’s total 0.04% Average NCOs (YTD) 780 Average FICO Strong and Unique Business Model1 Indirect Auto Portfolio $13B Commercial (Loans / Commitments) $3B / $6B Indirect RV/Marine Portfolio $6B 770 10-year average FICO 25% 19%
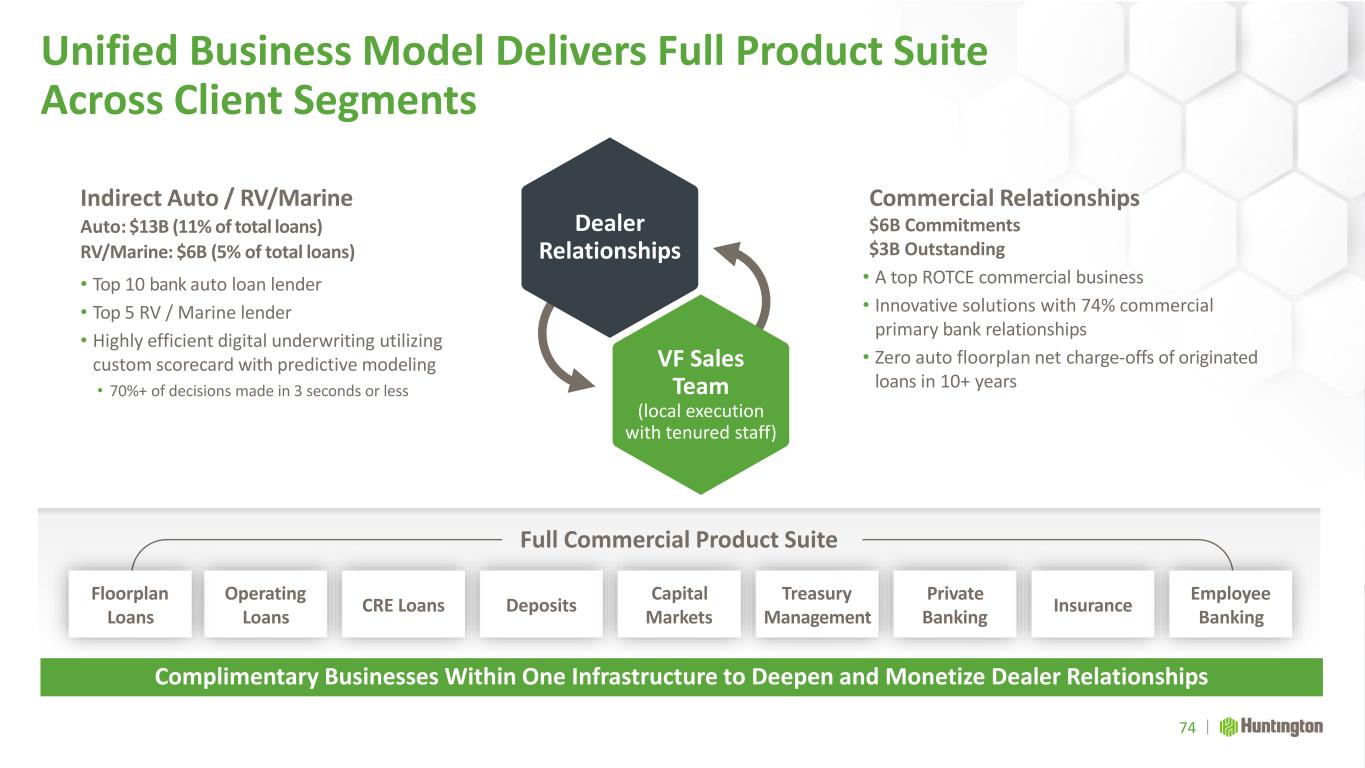
Full Commercial Product Suite Unified Business Model Delivers Full Product Suite Across Client Segments 74 Complimentary Businesses Within One Infrastructure to Deepen and Monetize Dealer Relationships Indirect Auto / RV/Marine Auto: $13B (11% of total loans) RV/Marine: $6B (5% of total loans) • Top 10 bank auto loan lender • Top 5 RV / Marine lender • Highly efficient digital underwriting utilizing custom scorecard with predictive modeling • 70%+ of decisions made in 3 seconds or less Commercial Relationships $6B Commitments $3B Outstanding • A top ROTCE commercial business • Innovative solutions with 74% commercial primary bank relationships • Zero auto floorplan net charge-offs of originated loans in 10+ years Deposits Treasury Management Capital Markets Operating Loans CRE Loans Private Banking Insurance VF Sales Team (local execution with tenured staff) Dealer Relationships Floorplan Loans Employee Banking
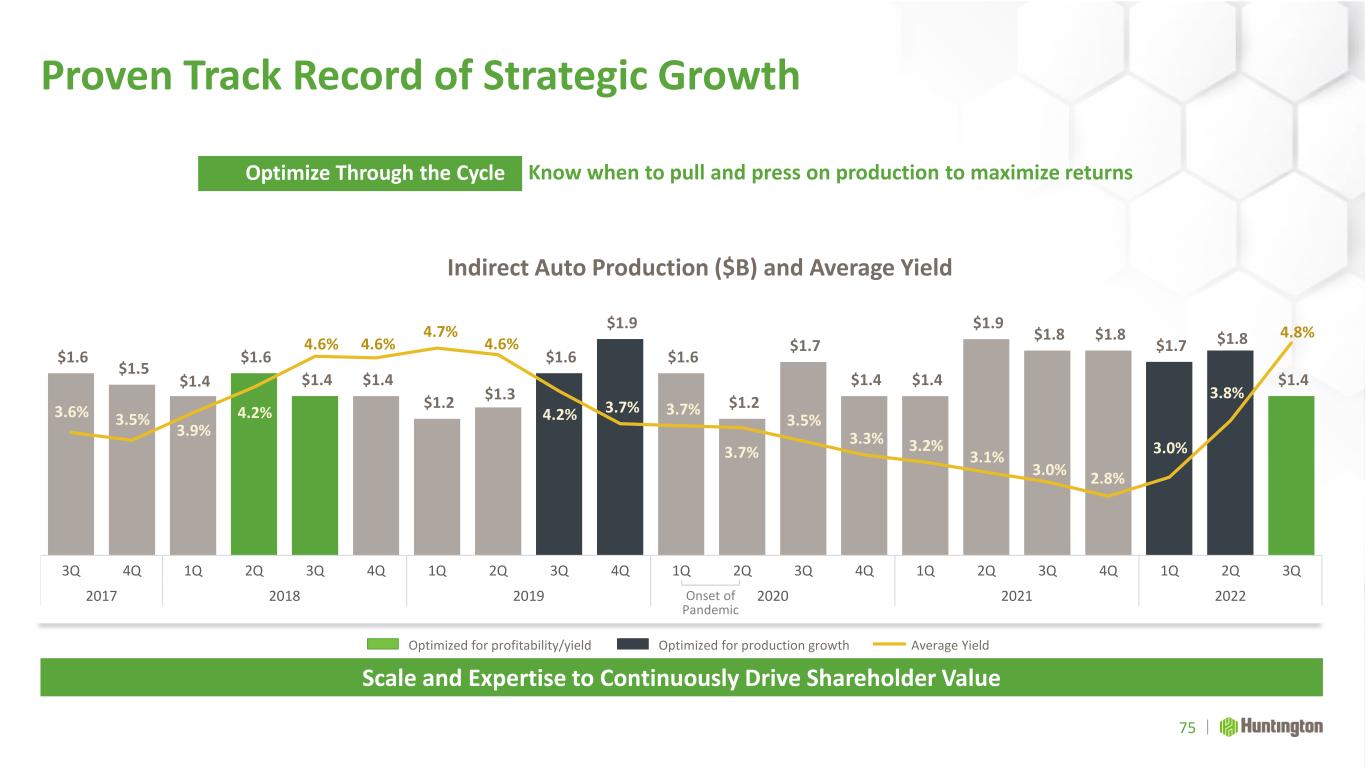
$1.6 $1.5 $1.4 $1.6 $1.4 $1.4 $1.2 $1.3 $1.6 $1.9 $1.6 $1.2 $1.7 $1.4 $1.4 $1.9 $1.8 $1.8 $1.7 $1.8 $1.4 3.6% 3.5% 3.9% 4.2% 4.6% 4.6% 4.7% 4.6% 4.2% 3.7% 3.7% 3.7% 3.5% 3.3% 3.2% 3.1% 3.0% 2.8% 3.0% 3.8% 4.8% 3Q 4Q 1Q 2Q 3Q 4Q 1Q 2Q 3Q 4Q 1Q 2Q 3Q 4Q 1Q 2Q 3Q 4Q 1Q 2Q 3Q 2017 2018 2019 2020 2021 2022 Indirect Auto Production ($B) and Average Yield Proven Track Record of Strategic Growth Scale and Expertise to Continuously Drive Shareholder Value 75 Optimize Through the Cycle Know when to pull and press on production to maximize returns Onset of Pandemic Optimized for profitability/yield Optimized for production growth Average Yield
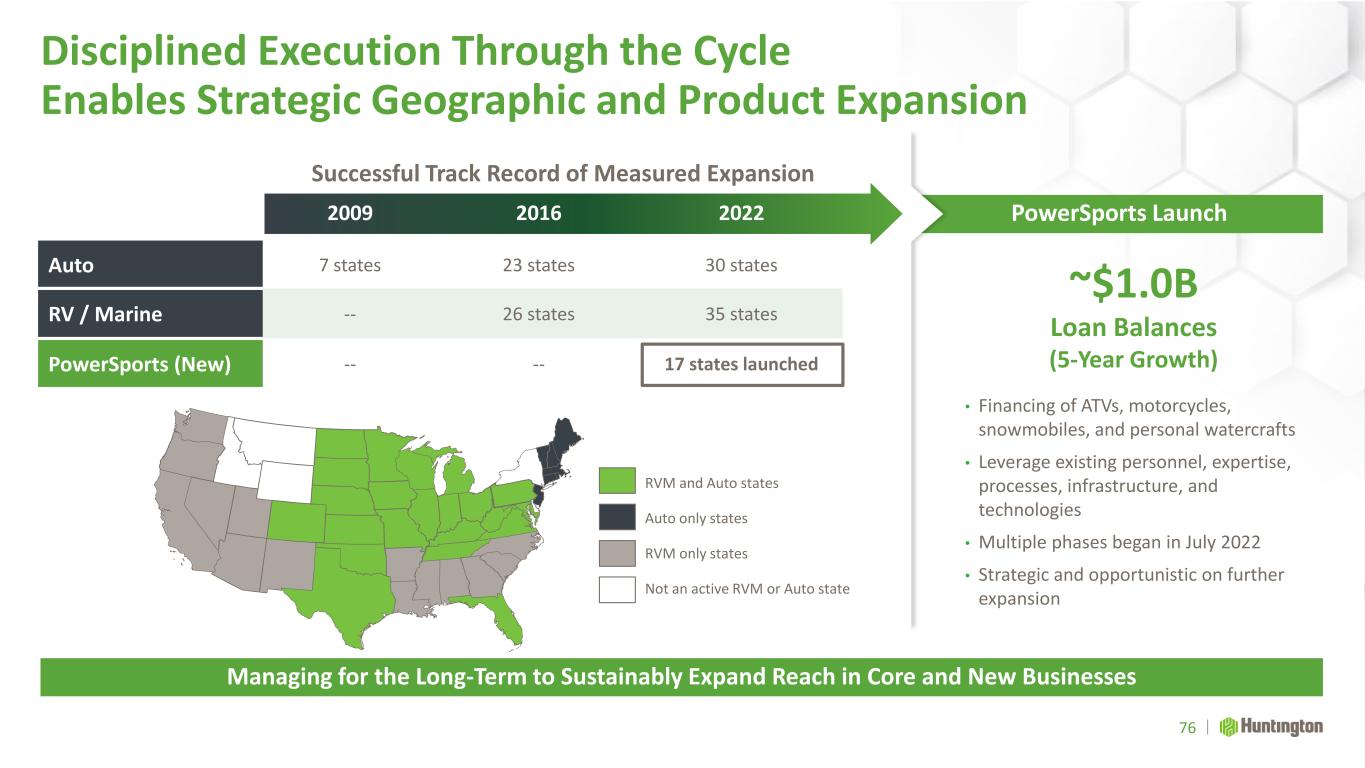
2009 2016 2022 Auto 7 states 23 states 30 states RV / Marine -- 26 states 35 states PowerSports (New) -- -- 17 states launched PowerSports Launch Successful Track Record of Measured Expansion Disciplined Execution Through the Cycle Enables Strategic Geographic and Product Expansion 76 Managing for the Long-Term to Sustainably Expand Reach in Core and New Businesses • Financing of ATVs, motorcycles, snowmobiles, and personal watercrafts • Leverage existing personnel, expertise, processes, infrastructure, and technologies • Multiple phases began in July 2022 • Strategic and opportunistic on further expansion ~$1.0B Loan Balances (5-Year Growth) RVM and Auto states Auto only states RVM only states Not an active RVM or Auto state
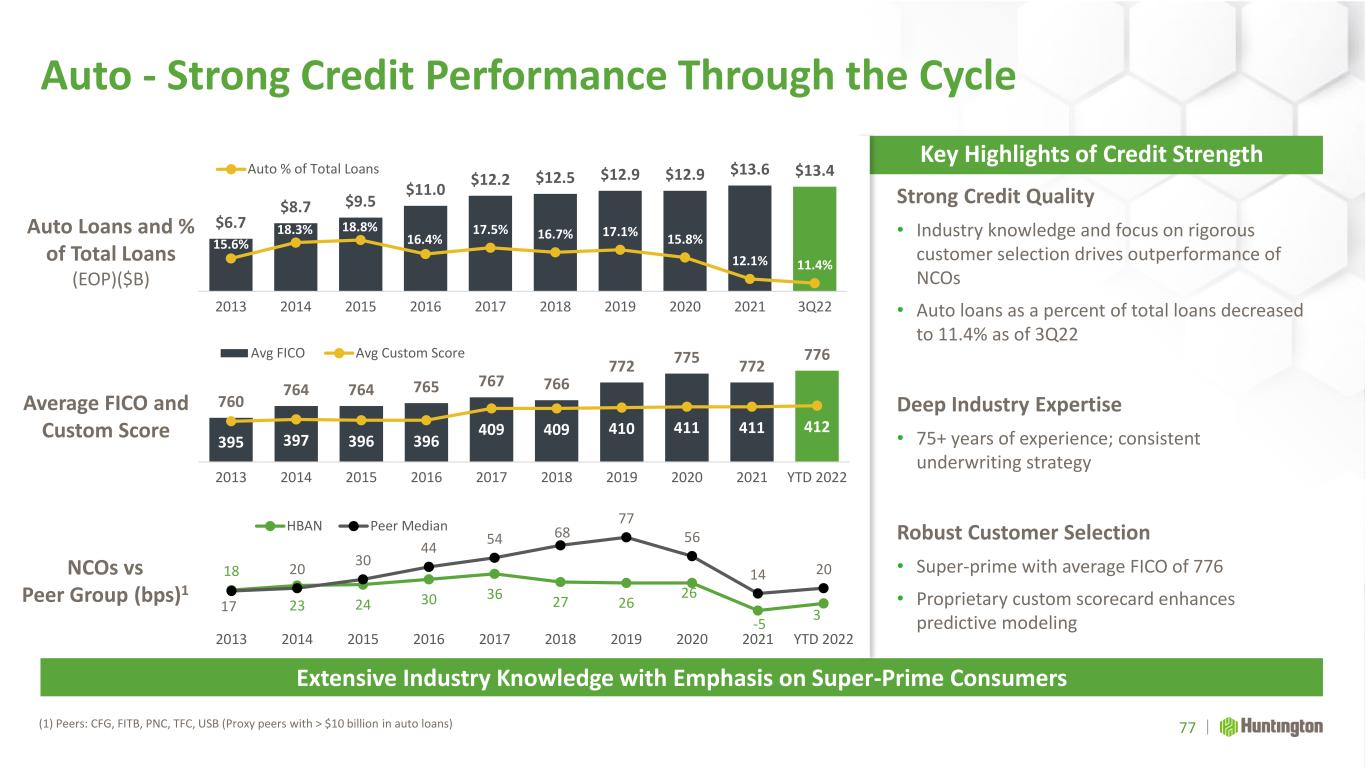
Auto - Strong Credit Performance Through the Cycle (1) Peers: CFG, FITB, PNC, TFC, USB (Proxy peers with > $10 billion in auto loans) Extensive Industry Knowledge with Emphasis on Super-Prime Consumers Strong Credit Quality • Industry knowledge and focus on rigorous customer selection drives outperformance of NCOs • Auto loans as a percent of total loans decreased to 11.4% as of 3Q22 Deep Industry Expertise • 75+ years of experience; consistent underwriting strategy Robust Customer Selection • Super-prime with average FICO of 776 • Proprietary custom scorecard enhances predictive modeling Key Highlights of Credit Strength 77 $6.7 $8.7 $9.5 $11.0 $12.2 $12.5 $12.9 $12.9 $13.6 $13.4 15.6% 18.3% 18.8% 16.4% 17.5% 16.7% 17.1% 15.8% 12.1% 11.4% 2013 2014 2015 2016 2017 2018 2019 2020 2021 3Q22 Auto % of Total Loans 760 764 764 765 767 766 772 775 772 776 395 397 396 396 409 409 410 411 411 412 2013 2014 2015 2016 2017 2018 2019 2020 2021 YTD 2022 Avg FICO Avg Custom Score 18 23 24 30 36 27 26 26 -5 3 17 20 30 44 54 68 77 56 14 20 2013 2014 2015 2016 2017 2018 2019 2020 2021 YTD 2022 HBAN Peer Median Average FICO and Custom Score Auto Loans and % of Total Loans (EOP)($B) NCOs vs Peer Group (bps)1
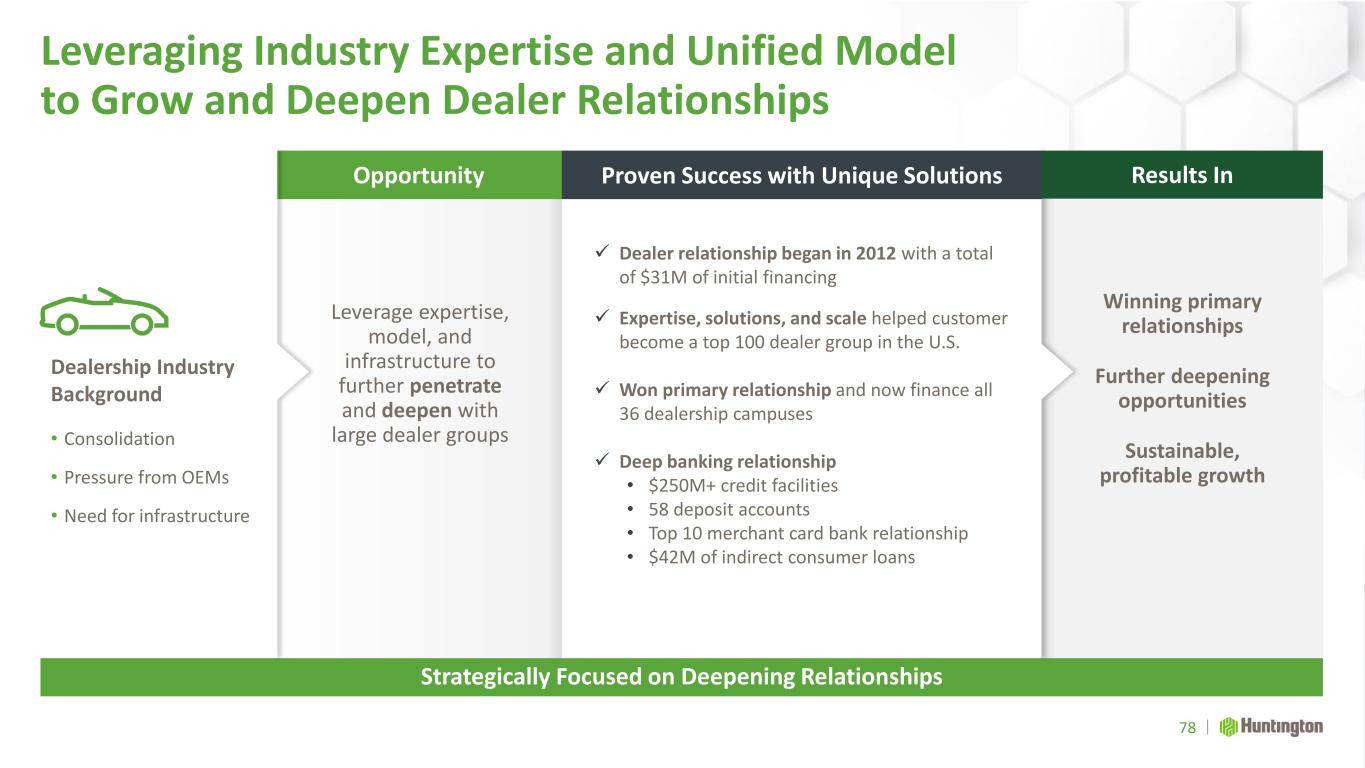
Leveraging Industry Expertise and Unified Model to Grow and Deepen Dealer Relationships 78 Strategically Focused on Deepening Relationships Leverage expertise, model, and infrastructure to further penetrate and deepen with large dealer groups Winning primary relationships Further deepening opportunities Sustainable, profitable growth ✓ Dealer relationship began in 2012 with a total of $31M of initial financing ✓ Expertise, solutions, and scale helped customer become a top 100 dealer group in the U.S. ✓ Won primary relationship and now finance all 36 dealership campuses ✓ Deep banking relationship • $250M+ credit facilities • 58 deposit accounts • Top 10 merchant card bank relationship • $42M of indirect consumer loans • Consolidation • Pressure from OEMs • Need for infrastructure Dealership Industry Background Opportunity Results InProven Success with Unique Solutions
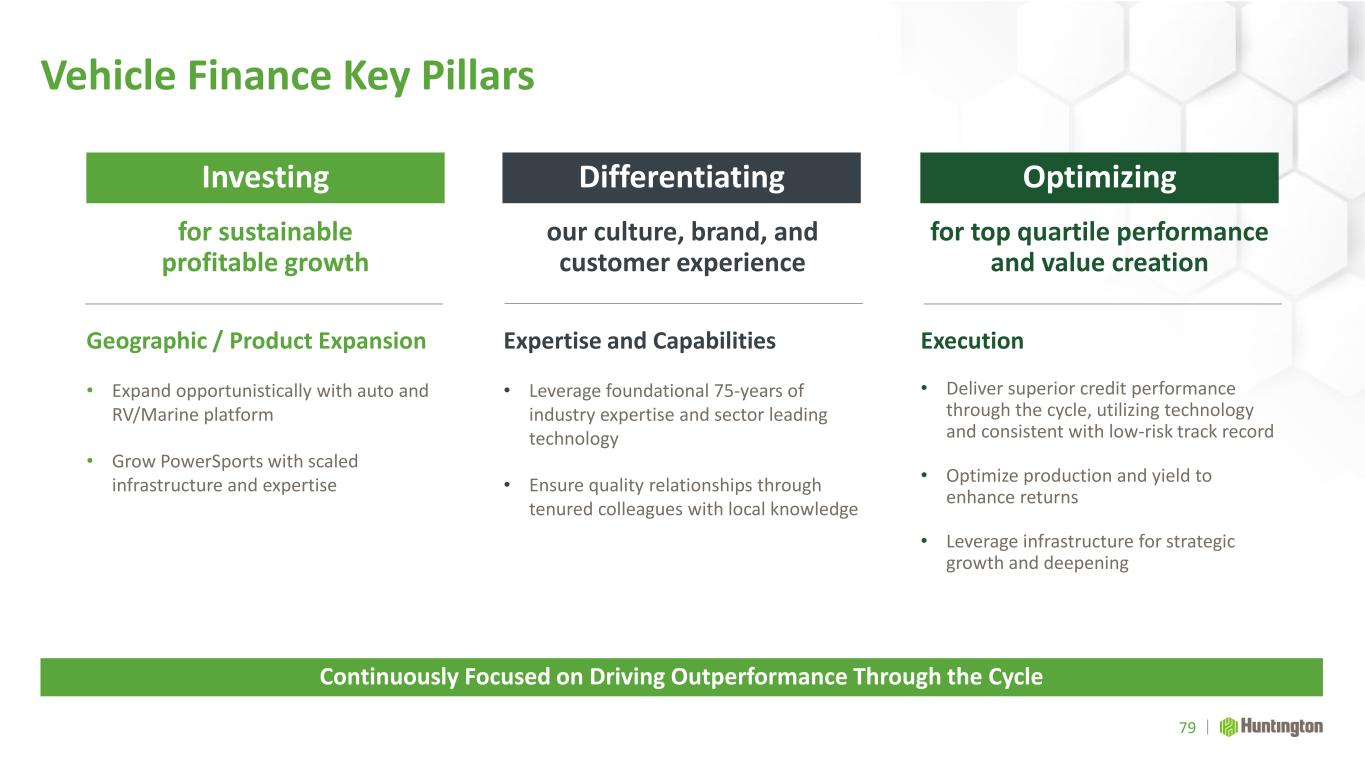
Investing Optimizing Differentiating for sustainable profitable growth for top quartile performance and value creation our culture, brand, and customer experience Vehicle Finance Key Pillars Execution • Deliver superior credit performance through the cycle, utilizing technology and consistent with low-risk track record • Optimize production and yield to enhance returns • Leverage infrastructure for strategic growth and deepening 79 Continuously Focused on Driving Outperformance Through the Cycle Expertise and Capabilities • Leverage foundational 75-years of industry expertise and sector leading technology • Ensure quality relationships through tenured colleagues with local knowledge Geographic / Product Expansion • Expand opportunistically with auto and RV/Marine platform • Grow PowerSports with scaled infrastructure and expertise

Q&A

Break
Technology Technology Strategy and Execution Fuels Scale and Product Distinctiveness Paul Heller Prashant Nateri EVP, Chief Transformation Officer SEVP, Chief Technology and Operations Officer
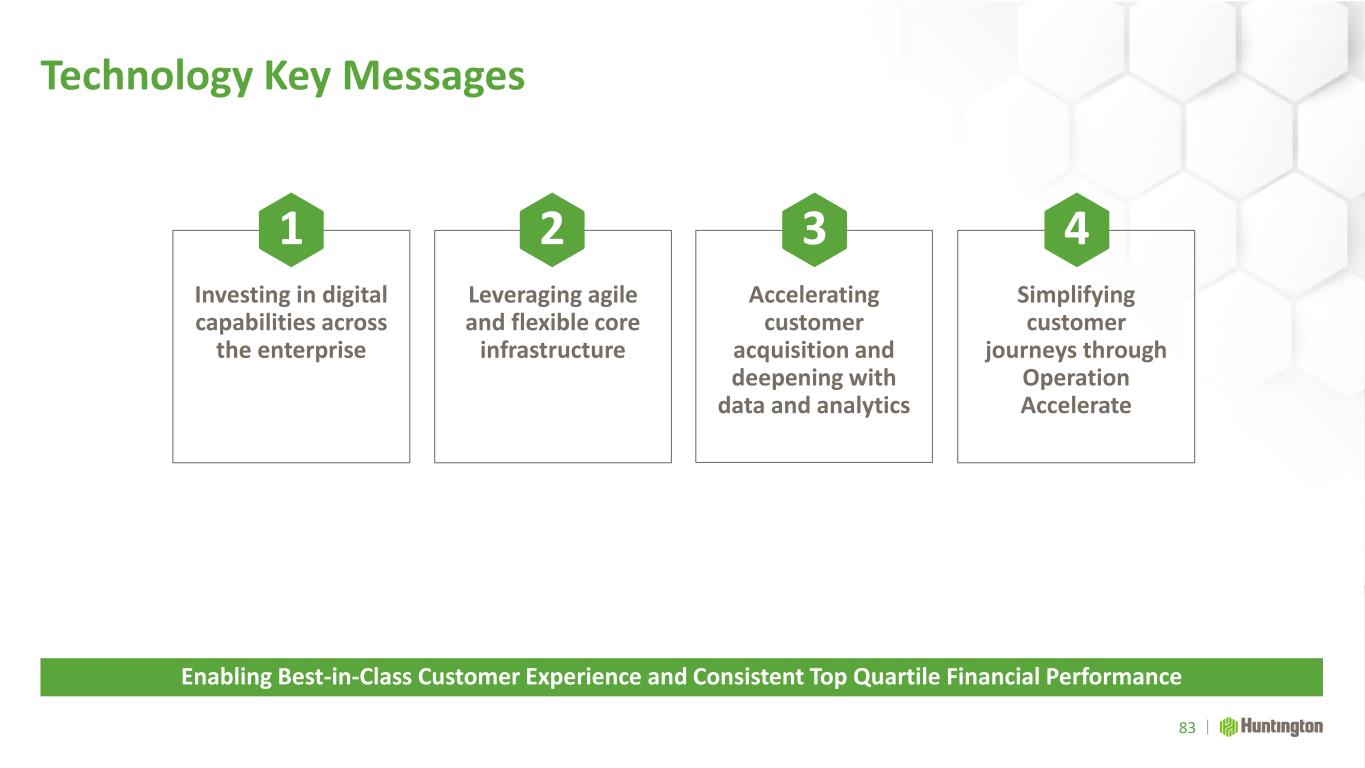
Technology Key Messages 83 Enabling Best-in-Class Customer Experience and Consistent Top Quartile Financial Performance Simplifying customer journeys through Operation Accelerate Accelerating customer acquisition and deepening with data and analytics Leveraging agile and flexible core infrastructure Investing in digital capabilities across the enterprise 1 2 3 4
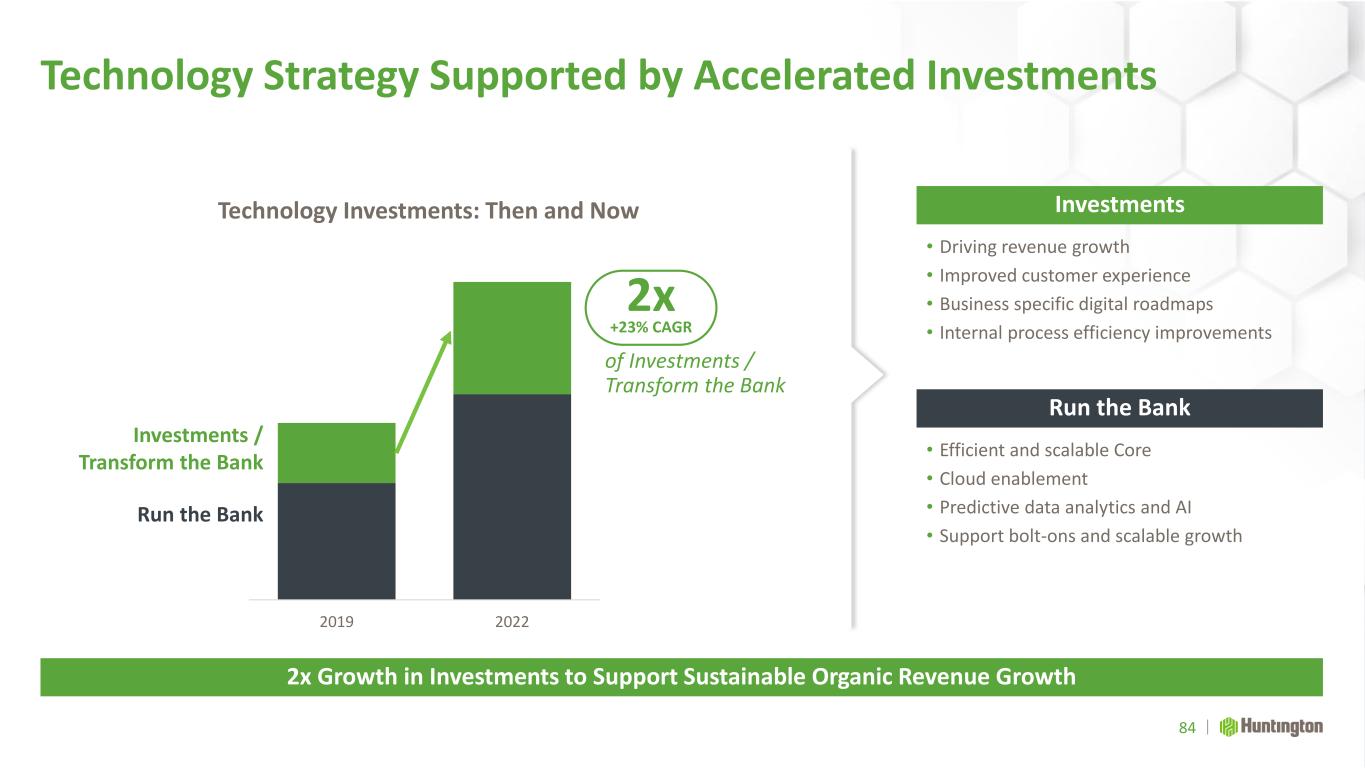
Technology Strategy Supported by Accelerated Investments 2x Growth in Investments to Support Sustainable Organic Revenue Growth 2019 2022 Run the Bank Investments / Transform the Bank Technology Investments: Then and Now • Driving revenue growth • Improved customer experience • Business specific digital roadmaps • Internal process efficiency improvements Investments • Efficient and scalable Core • Cloud enablement • Predictive data analytics and AI • Support bolt-ons and scalable growth Run the Bank 84 2x +23% CAGR of Investments / Transform the Bank
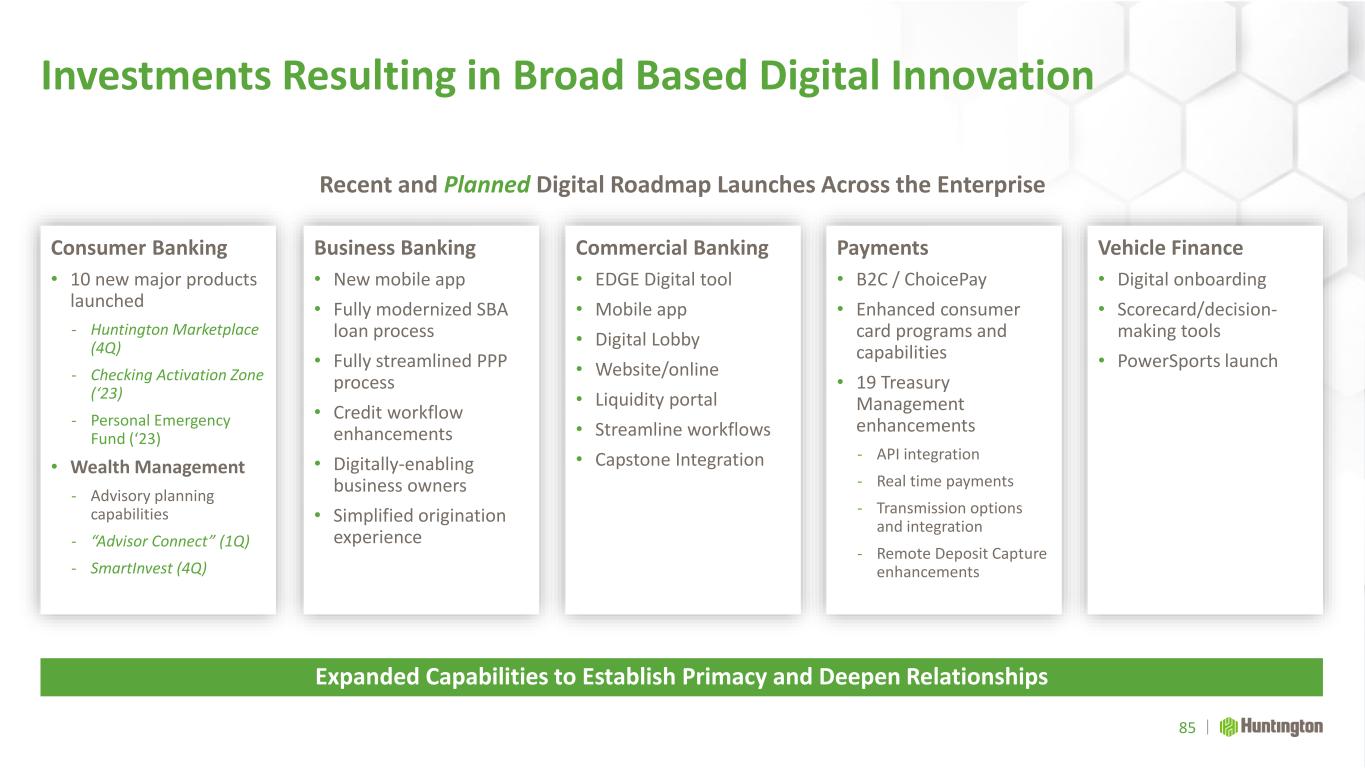
Expanded Capabilities to Establish Primacy and Deepen Relationships Consumer Banking • 10 new major products launched - Huntington Marketplace (4Q) - Checking Activation Zone (‘23) - Personal Emergency Fund (‘23) • Wealth Management - Advisory planning capabilities - “Advisor Connect” (1Q) - SmartInvest (4Q) Vehicle Finance • Digital onboarding • Scorecard/decision- making tools • PowerSports launch Commercial Banking • EDGE Digital tool • Mobile app • Digital Lobby • Website/online • Liquidity portal • Streamline workflows • Capstone Integration Payments • B2C / ChoicePay • Enhanced consumer card programs and capabilities • 19 Treasury Management enhancements - API integration - Real time payments - Transmission options and integration - Remote Deposit Capture enhancements Business Banking • New mobile app • Fully modernized SBA loan process • Fully streamlined PPP process • Credit workflow enhancements • Digitally-enabling business owners • Simplified origination experience Investments Resulting in Broad Based Digital Innovation 85 Recent and Planned Digital Roadmap Launches Across the Enterprise
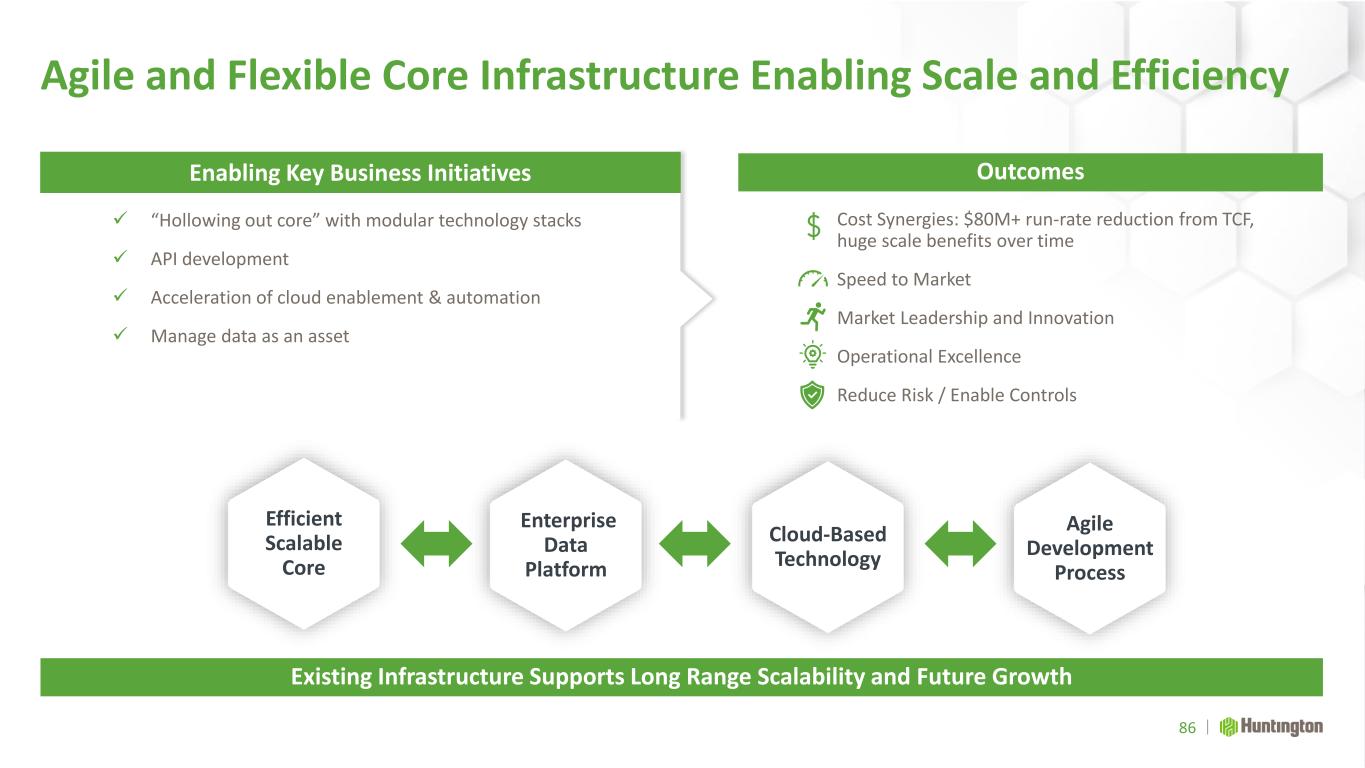
Agile and Flexible Core Infrastructure Enabling Scale and Efficiency Existing Infrastructure Supports Long Range Scalability and Future Growth ✓ “Hollowing out core” with modular technology stacks ✓ API development ✓ Acceleration of cloud enablement & automation ✓ Manage data as an asset Outcomes Enterprise Data Platform Agile Development Process Efficient Scalable Core Cloud-Based Technology Cost Synergies: $80M+ run-rate reduction from TCF, huge scale benefits over time Speed to Market Market Leadership and Innovation Operational Excellence Reduce Risk / Enable Controls Enabling Key Business Initiatives 86
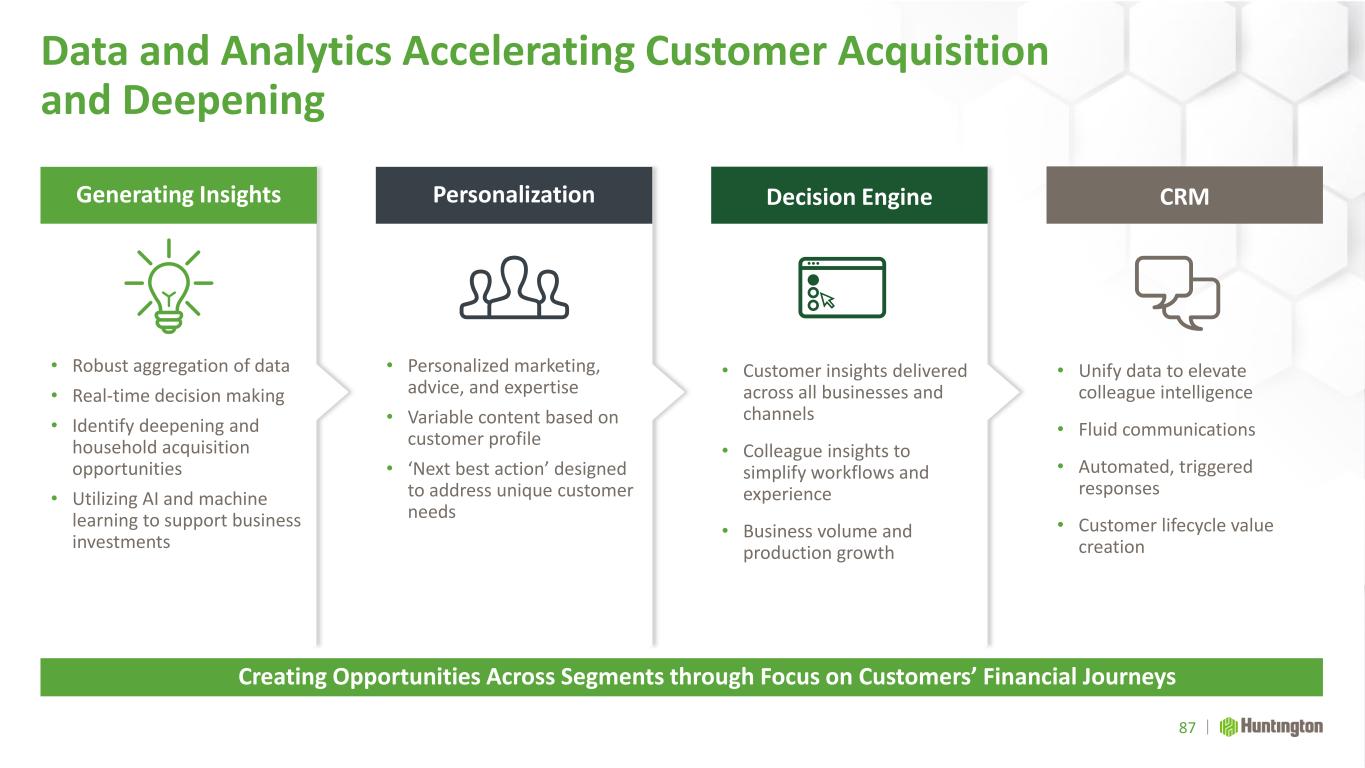
Data and Analytics Accelerating Customer Acquisition and Deepening Creating Opportunities Across Segments through Focus on Customers’ Financial Journeys • Unify data to elevate colleague intelligence • Fluid communications • Automated, triggered responses • Customer lifecycle value creation • Customer insights delivered across all businesses and channels • Colleague insights to simplify workflows and experience • Business volume and production growth • Robust aggregation of data • Real-time decision making • Identify deepening and household acquisition opportunities • Utilizing AI and machine learning to support business investments • Personalized marketing, advice, and expertise • Variable content based on customer profile • ‘Next best action’ designed to address unique customer needs CRMDecision EngineGenerating Insights Personalization 87
Operation Accelerate Transforming Customer and Colleague Experience, Driving Efficiency and Revenue
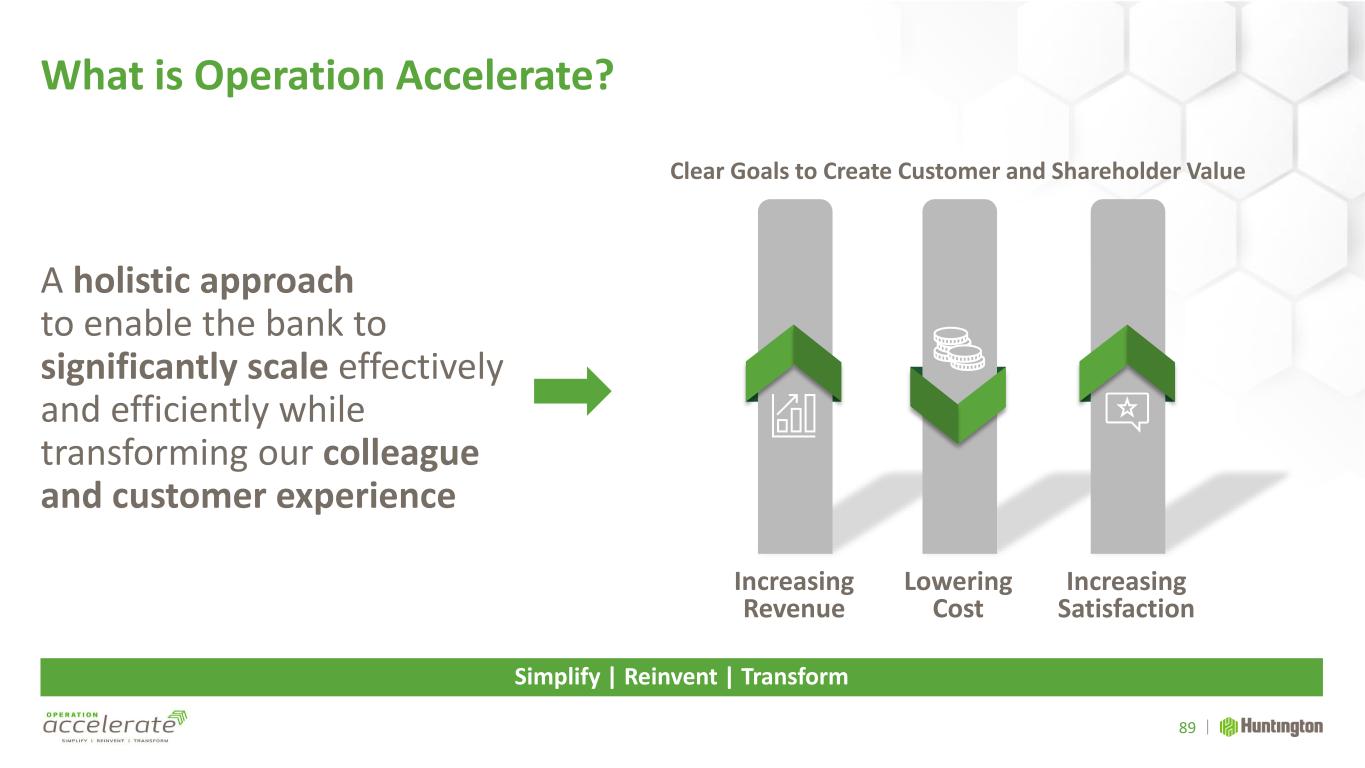
What is Operation Accelerate? A holistic approach to enable the bank to significantly scale effectively and efficiently while transforming our colleague and customer experience 89 Simplify | Reinvent | Transform Increasing Revenue Lowering Cost Increasing Satisfaction Clear Goals to Create Customer and Shareholder Value
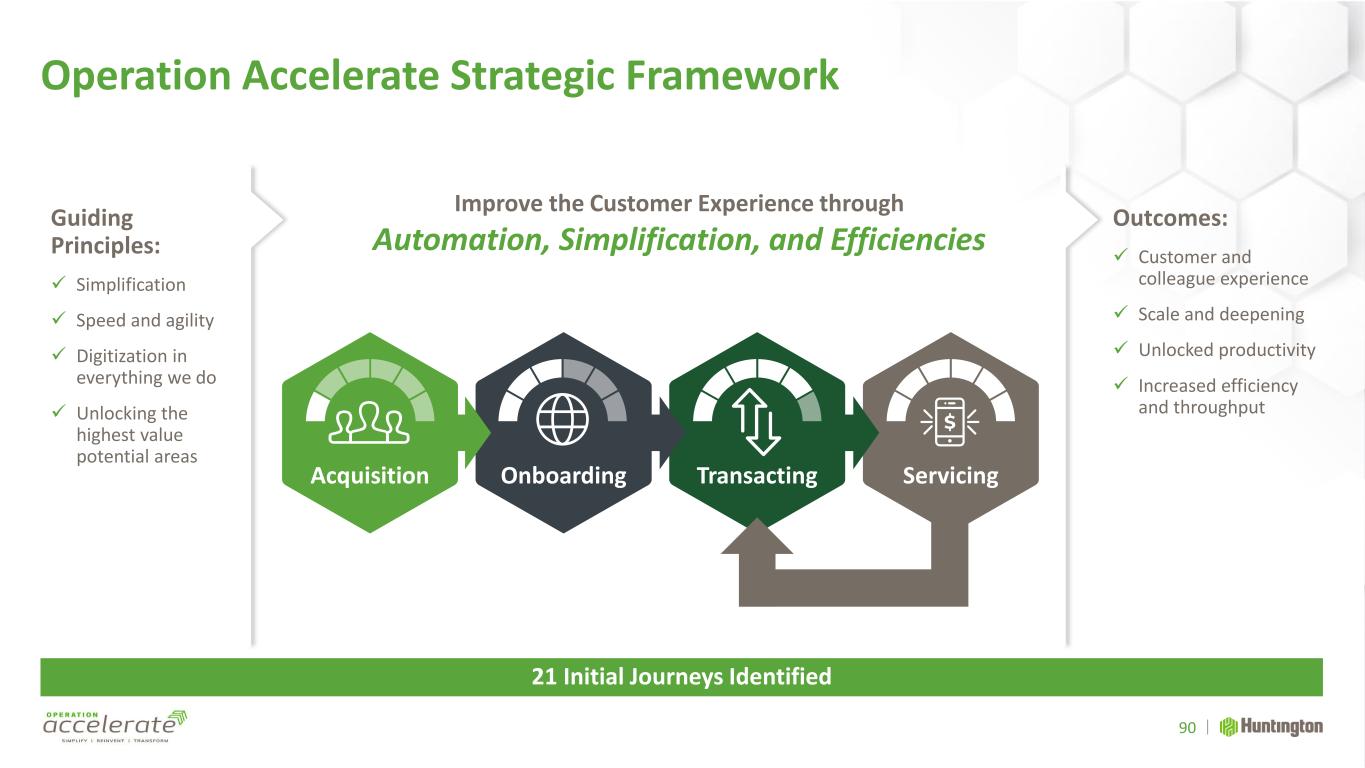
Operation Accelerate Strategic Framework 21 Initial Journeys Identified Outcomes: ✓ Customer and colleague experience ✓ Scale and deepening ✓ Unlocked productivity ✓ Increased efficiency and throughput Improve the Customer Experience through Automation, Simplification, and Efficiencies Acquisition Onboarding Transacting Servicing 90 Guiding Principles: ✓ Simplification ✓ Speed and agility ✓ Digitization in everything we do ✓ Unlocking the highest value potential areas
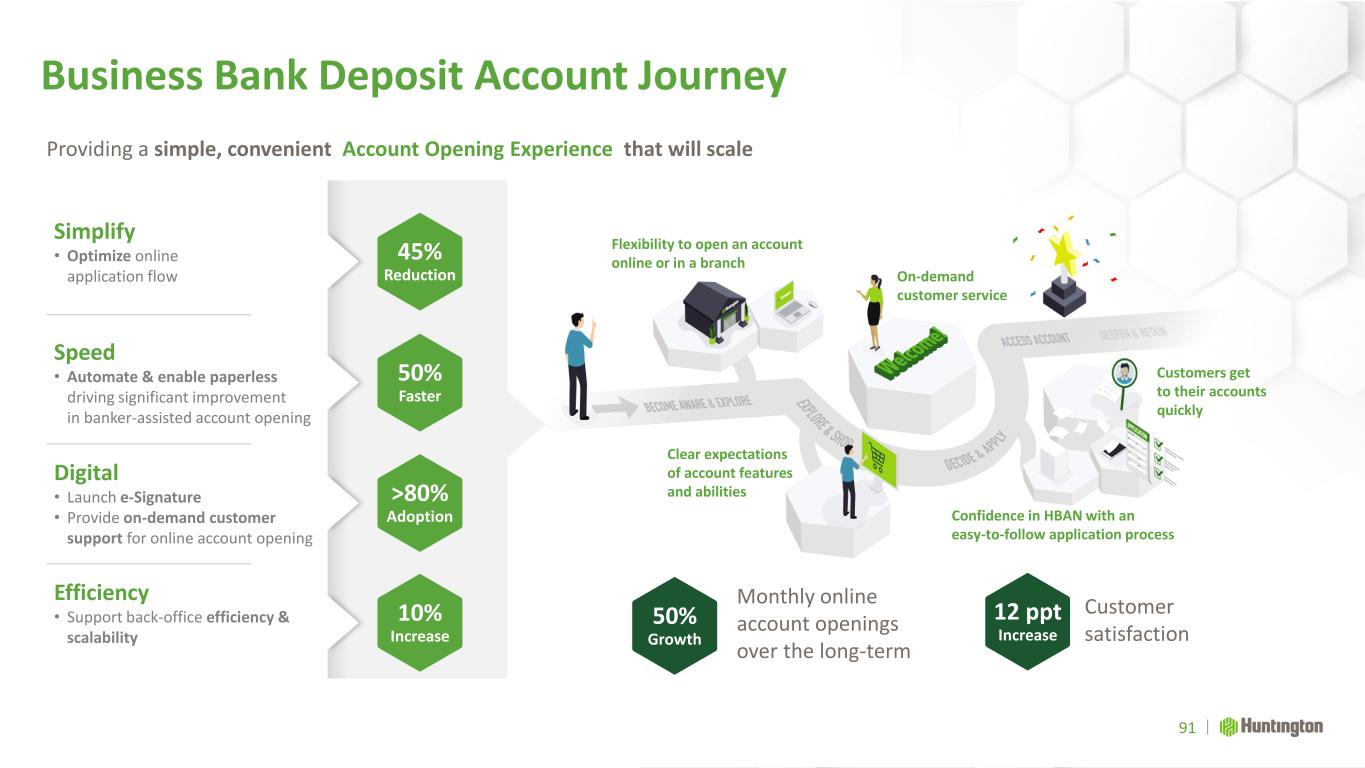
Clear expectations of account features and abilities Confidence in HBAN with an easy-to-follow application process Customers get to their accounts quickly On-demand customer service Flexibility to open an account online or in a branch Simplify • Optimize online application flow Business Bank Deposit Account Journey 91 Providing a simple, convenient Account Opening Experience that will scale 50% Faster 45% Reduction >80% Adoption 10% Increase Monthly online account openings over the long-term 50% Growth 12 ppt Increase Customer satisfaction Speed • Automate & enable paperless driving significant improvement in banker-assisted account opening Digital • Launch e-Signature • Provide on-demand customer support for online account opening Efficiency • Support back-office efficiency & scalability
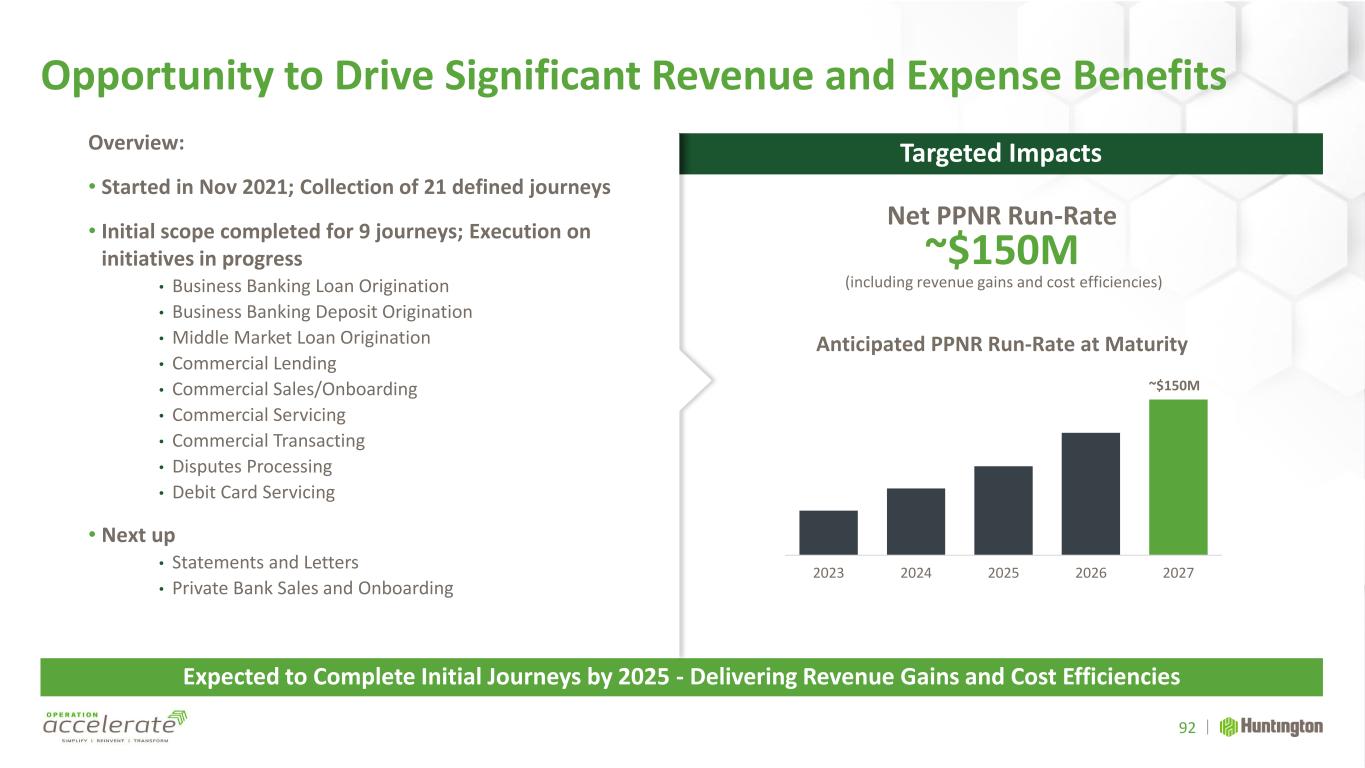
Opportunity to Drive Significant Revenue and Expense Benefits Expected to Complete Initial Journeys by 2025 - Delivering Revenue Gains and Cost Efficiencies Targeted Impacts Net PPNR Run-Rate ~$150M (including revenue gains and cost efficiencies) Overview: • Started in Nov 2021; Collection of 21 defined journeys • Initial scope completed for 9 journeys; Execution on initiatives in progress • Business Banking Loan Origination • Business Banking Deposit Origination • Middle Market Loan Origination • Commercial Lending • Commercial Sales/Onboarding • Commercial Servicing • Commercial Transacting • Disputes Processing • Debit Card Servicing • Next up • Statements and Letters • Private Bank Sales and Onboarding ~$150M 2023 2024 2025 2026 2027 Anticipated PPNR Run-Rate at Maturity 92
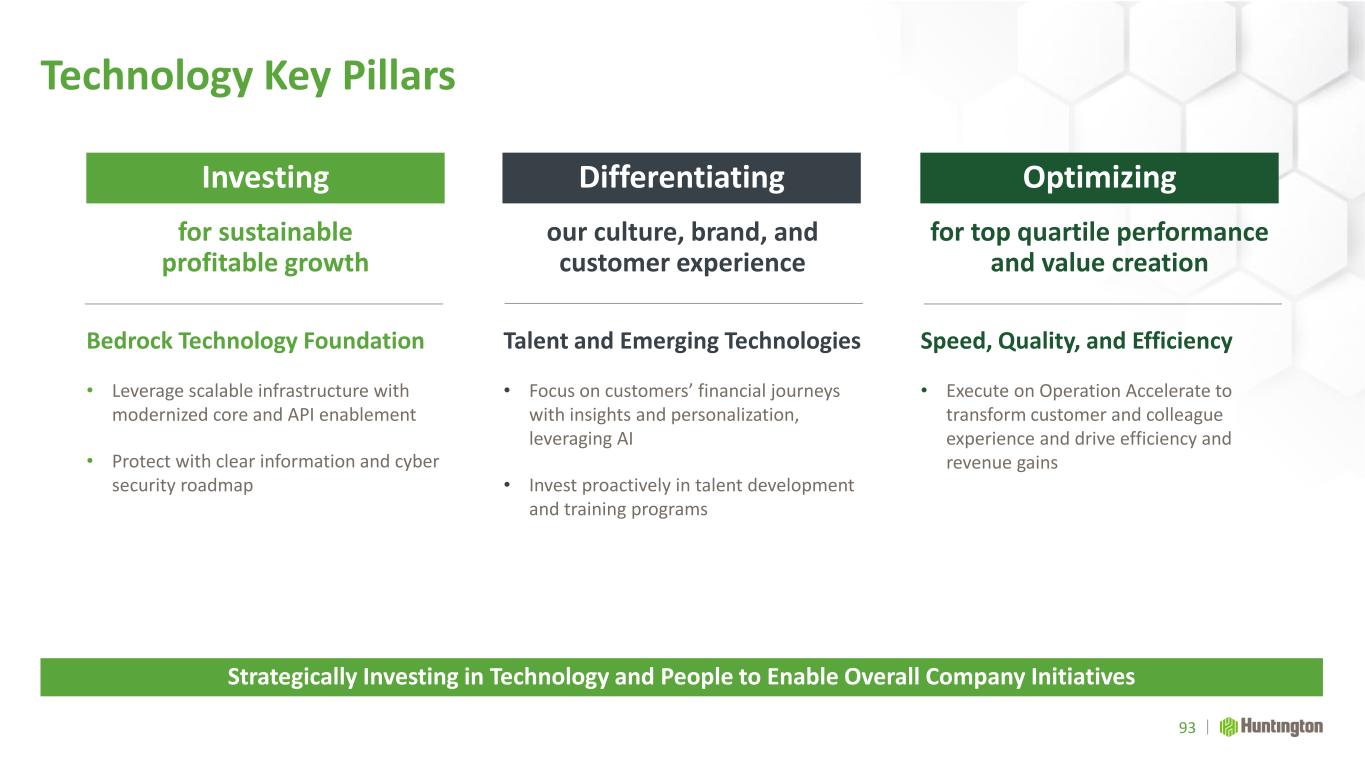
Investing Optimizing Differentiating for sustainable profitable growth for top quartile performance and value creation our culture, brand, and customer experience Technology Key Pillars Speed, Quality, and Efficiency • Execute on Operation Accelerate to transform customer and colleague experience and drive efficiency and revenue gains 93 Strategically Investing in Technology and People to Enable Overall Company Initiatives Talent and Emerging Technologies • Focus on customers’ financial journeys with insights and personalization, leveraging AI • Invest proactively in talent development and training programs Bedrock Technology Foundation • Leverage scalable infrastructure with modernized core and API enablement • Protect with clear information and cyber security roadmap
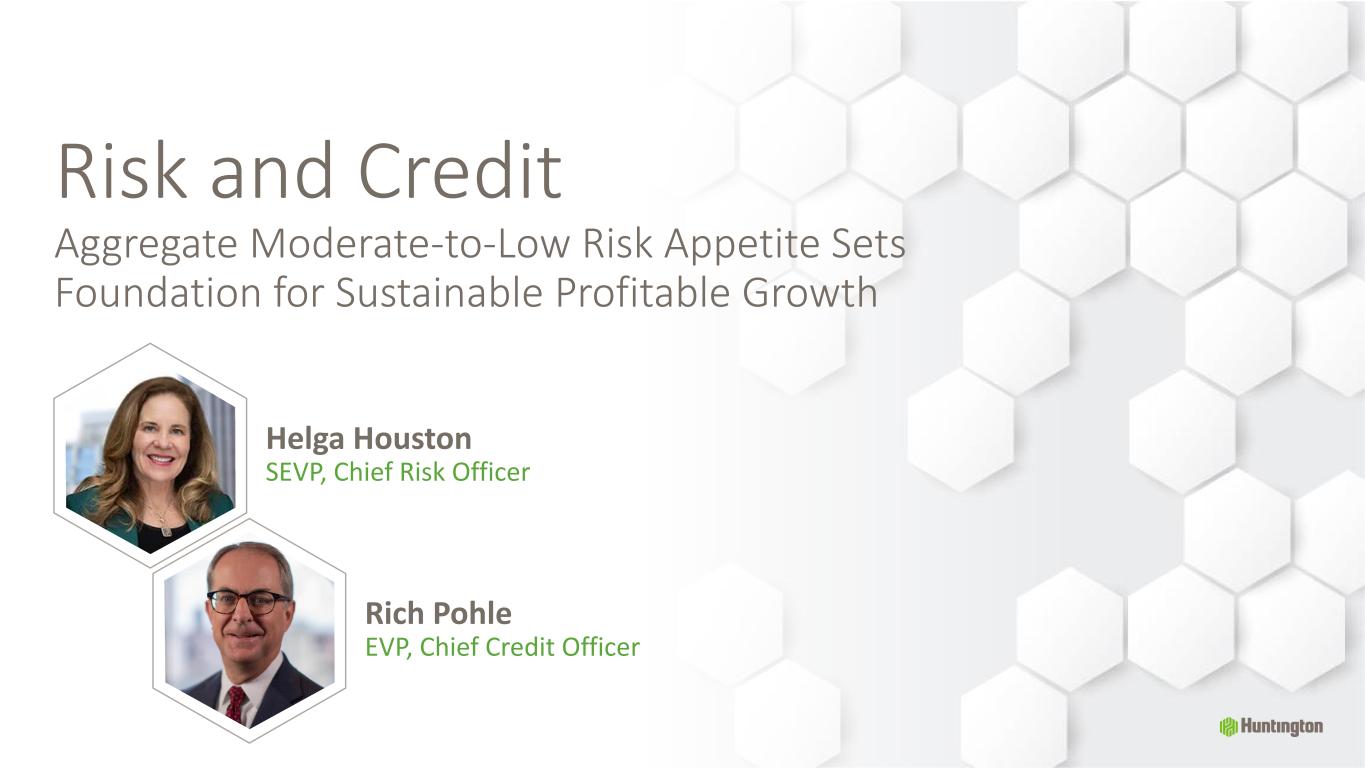
Risk and Credit Aggregate Moderate-to-Low Risk Appetite Sets Foundation for Sustainable Profitable Growth Helga Houston Rich Pohle EVP, Chief Credit Officer SEVP, Chief Risk Officer
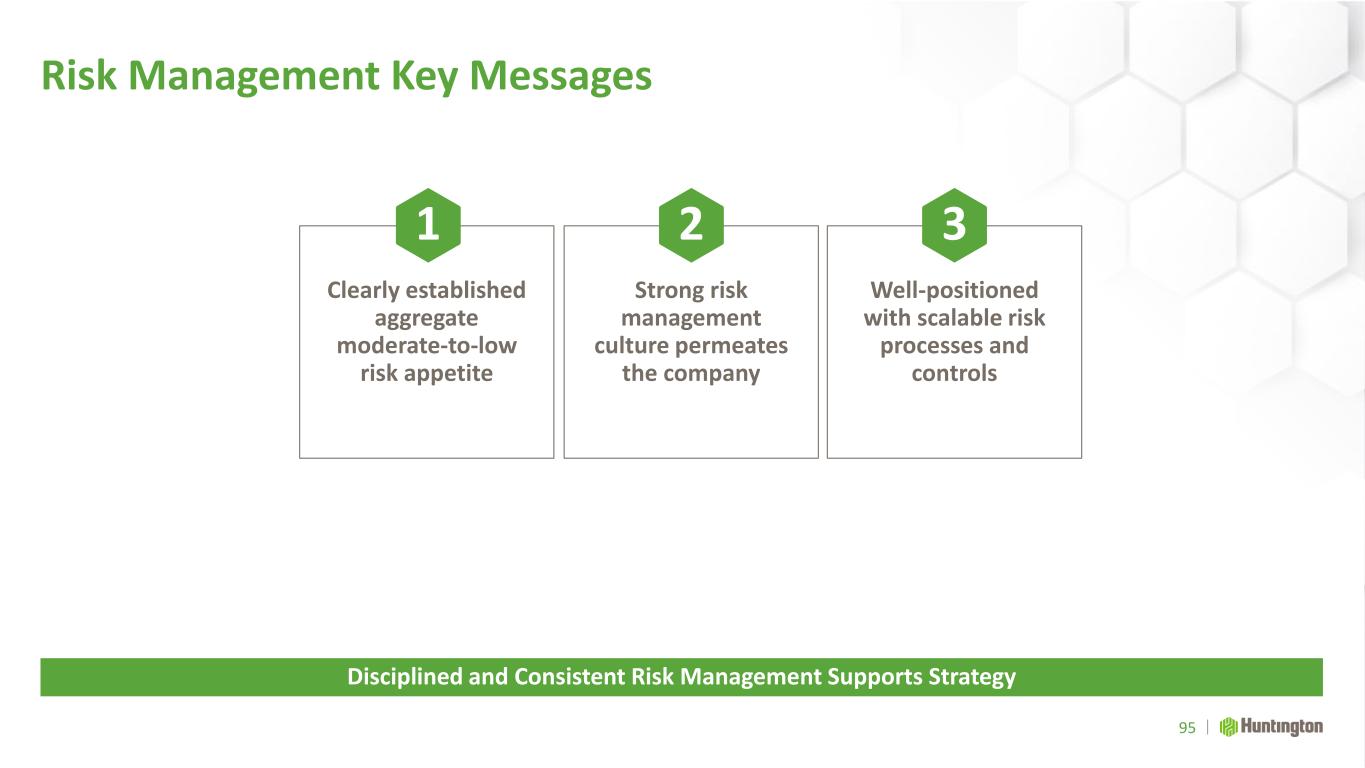
Risk Management Key Messages 95 Disciplined and Consistent Risk Management Supports Strategy Strong risk management culture permeates the company 2 Clearly established aggregate moderate-to-low risk appetite 1 Well-positioned with scalable risk processes and controls 3
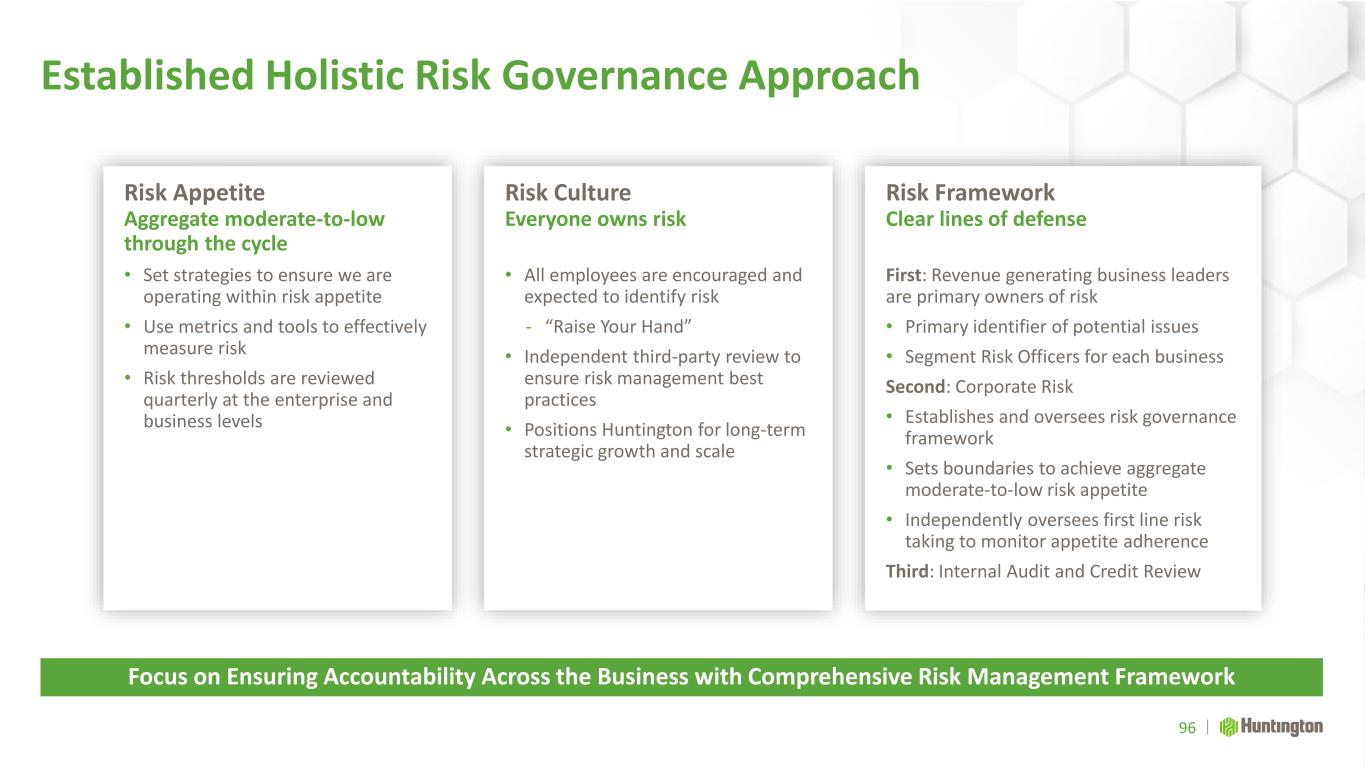
Established Holistic Risk Governance Approach 96 Focus on Ensuring Accountability Across the Business with Comprehensive Risk Management Framework Risk Culture Everyone owns risk • All employees are encouraged and expected to identify risk - “Raise Your Hand” • Independent third-party review to ensure risk management best practices • Positions Huntington for long-term strategic growth and scale Risk Appetite Aggregate moderate-to-low through the cycle • Set strategies to ensure we are operating within risk appetite • Use metrics and tools to effectively measure risk • Risk thresholds are reviewed quarterly at the enterprise and business levels Risk Framework Clear lines of defense First: Revenue generating business leaders are primary owners of risk • Primary identifier of potential issues • Segment Risk Officers for each business Second: Corporate Risk • Establishes and oversees risk governance framework • Sets boundaries to achieve aggregate moderate-to-low risk appetite • Independently oversees first line risk taking to monitor appetite adherence Third: Internal Audit and Credit Review
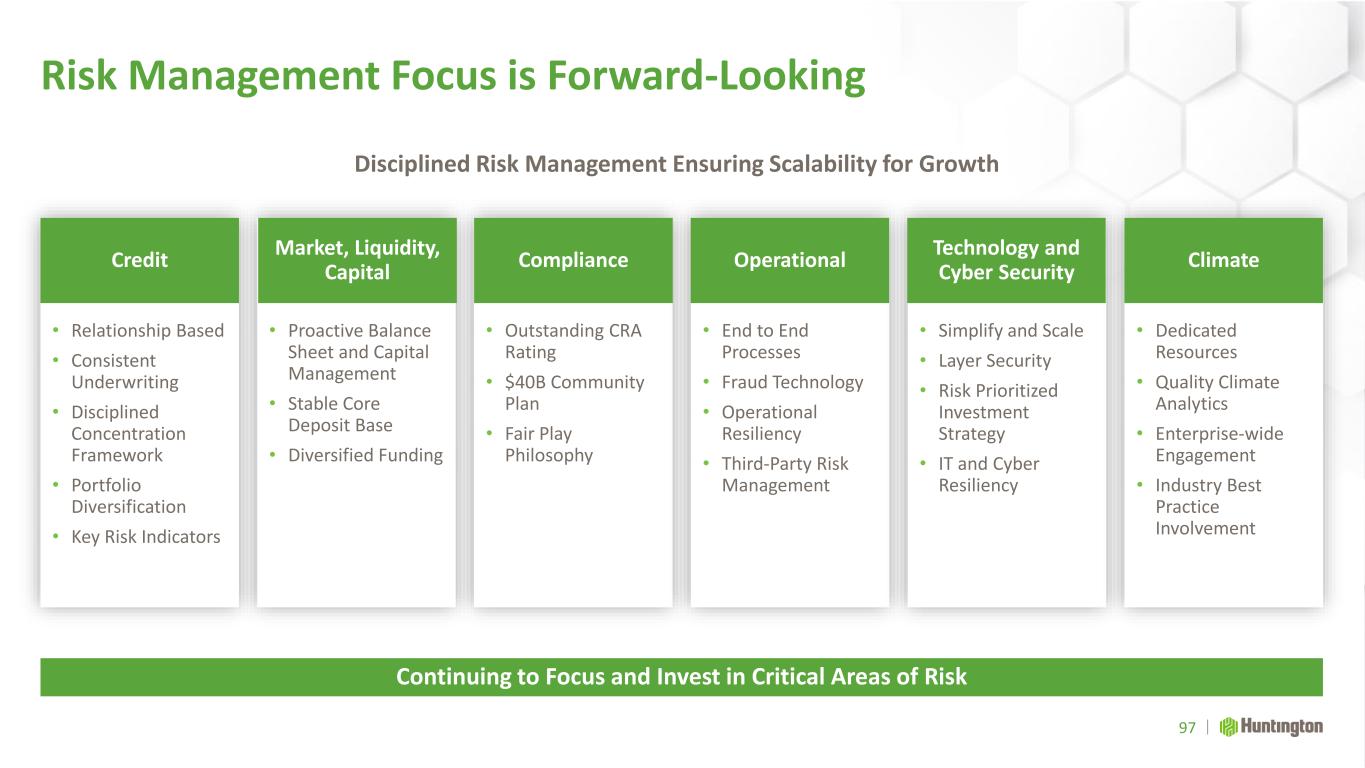
Risk Management Focus is Forward-Looking 97 Continuing to Focus and Invest in Critical Areas of Risk Disciplined Risk Management Ensuring Scalability for Growth • Outstanding CRA Rating • $40B Community Plan • Fair Play Philosophy • End to End Processes • Fraud Technology • Operational Resiliency • Third-Party Risk Management • Simplify and Scale • Layer Security • Risk Prioritized Investment Strategy • IT and Cyber Resiliency • Proactive Balance Sheet and Capital Management • Stable Core Deposit Base • Diversified Funding • Relationship Based • Consistent Underwriting • Disciplined Concentration Framework • Portfolio Diversification • Key Risk Indicators • Dedicated Resources • Quality Climate Analytics • Enterprise-wide Engagement • Industry Best Practice Involvement Credit Market, Liquidity, Capital Compliance Operational Technology and Cyber Security Climate
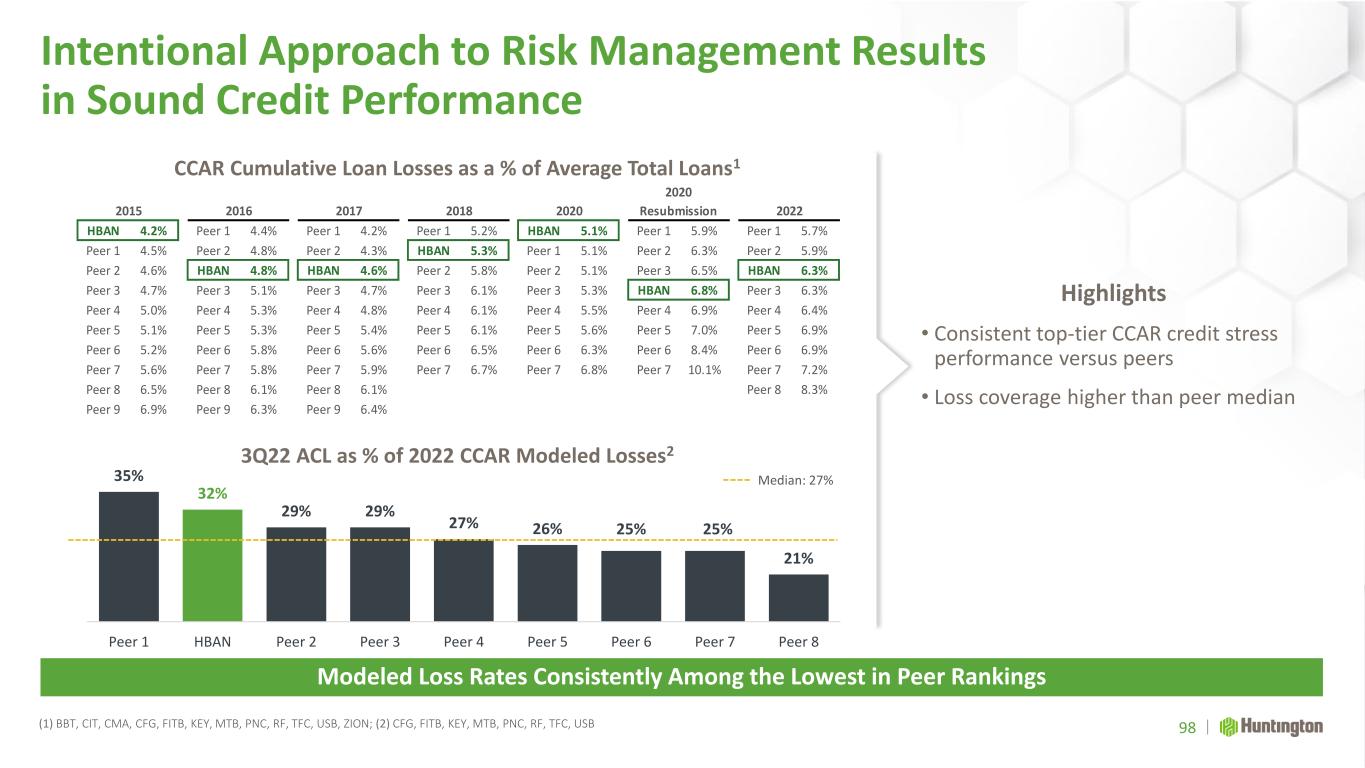
35% 32% 29% 29% 27% 26% 25% 25% 21% Peer 1 HBAN Peer 2 Peer 3 Peer 4 Peer 5 Peer 6 Peer 7 Peer 8 Intentional Approach to Risk Management Results in Sound Credit Performance (1) BBT, CIT, CMA, CFG, FITB, KEY, MTB, PNC, RF, TFC, USB, ZION; (2) CFG, FITB, KEY, MTB, PNC, RF, TFC, USB Modeled Loss Rates Consistently Among the Lowest in Peer Rankings Highlights • Consistent top-tier CCAR credit stress performance versus peers • Loss coverage higher than peer median CCAR Cumulative Loan Losses as a % of Average Total Loans1 3Q22 ACL as % of 2022 CCAR Modeled Losses2 Median: 27% HBAN 4.2% Peer 1 4.4% Peer 1 4.2% Peer 1 5.2% HBAN 5.1% Peer 1 5.9% Peer 1 5.7% Peer 1 4.5% Peer 2 4.8% Peer 2 4.3% HBAN 5.3% Peer 1 5.1% Peer 2 6.3% Peer 2 5.9% Peer 2 4.6% HBAN 4.8% HBAN 4.6% Peer 2 5.8% Peer 2 5.1% Peer 3 6.5% HBAN 6.3% Peer 3 4.7% Peer 3 5.1% Peer 3 4.7% Peer 3 6.1% Peer 3 5.3% HBAN 6.8% Peer 3 6.3% Peer 4 5.0% Peer 4 5.3% Peer 4 4.8% Peer 4 6.1% Peer 4 5.5% Peer 4 6.9% Peer 4 6.4% Peer 5 5.1% Peer 5 5.3% Peer 5 5.4% Peer 5 6.1% Peer 5 5.6% Peer 5 7.0% Peer 5 6.9% Peer 6 5.2% Peer 6 5.8% Peer 6 5.6% Peer 6 6.5% Peer 6 6.3% Peer 6 8.4% Peer 6 6.9% Peer 7 5.6% Peer 7 5.8% Peer 7 5.9% Peer 7 6.7% Peer 7 6.8% Peer 7 10.1% Peer 7 7.2% Peer 8 6.5% Peer 8 6.1% Peer 8 6.1% Peer 8 8.3% Peer 9 6.9% Peer 9 6.3% Peer 9 6.4% 20222015 2016 2017 2018 2020 2020 Resubmission 98
Credit Risk Management Credit Approach Supports Prudent Portfolio Growth
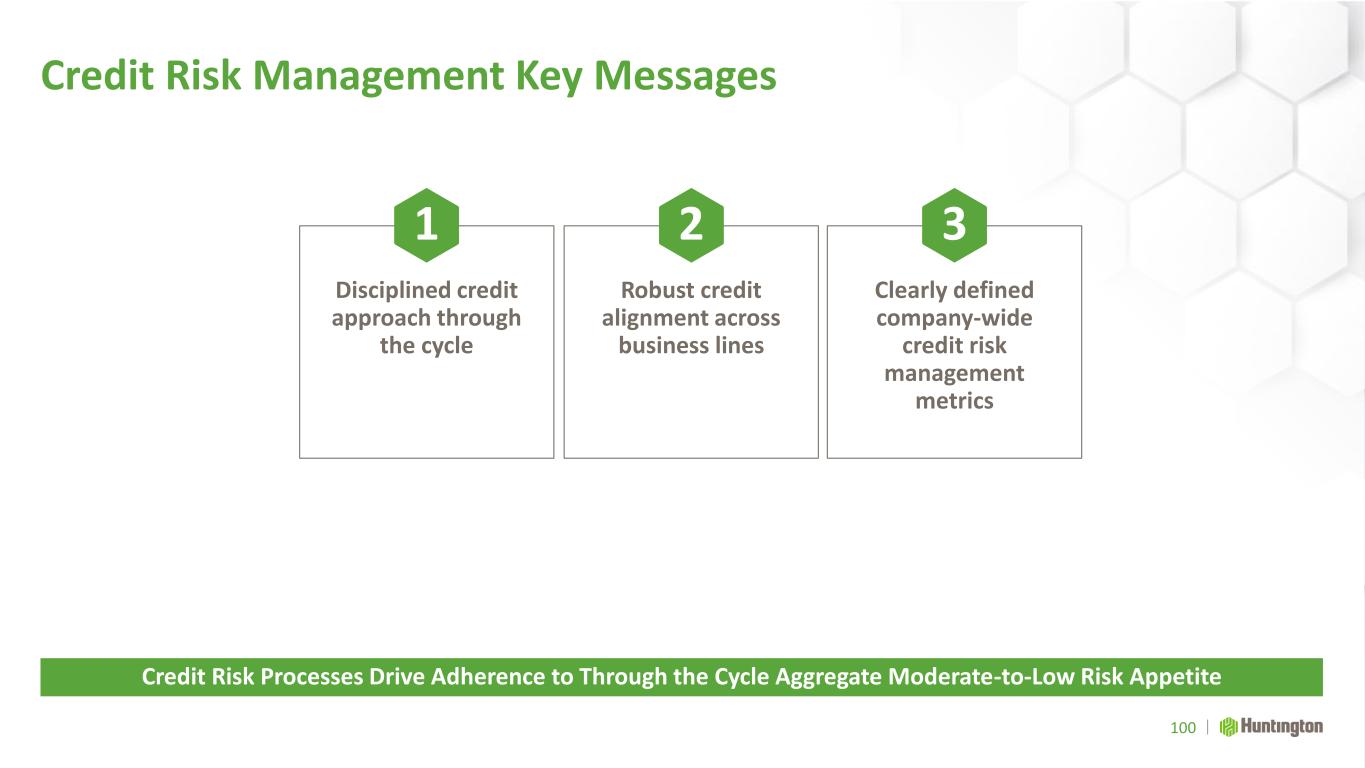
Credit Risk Management Key Messages 100 Credit Risk Processes Drive Adherence to Through the Cycle Aggregate Moderate-to-Low Risk Appetite Robust credit alignment across business lines 2 Disciplined credit approach through the cycle 1 Clearly defined company-wide credit risk management metrics 3
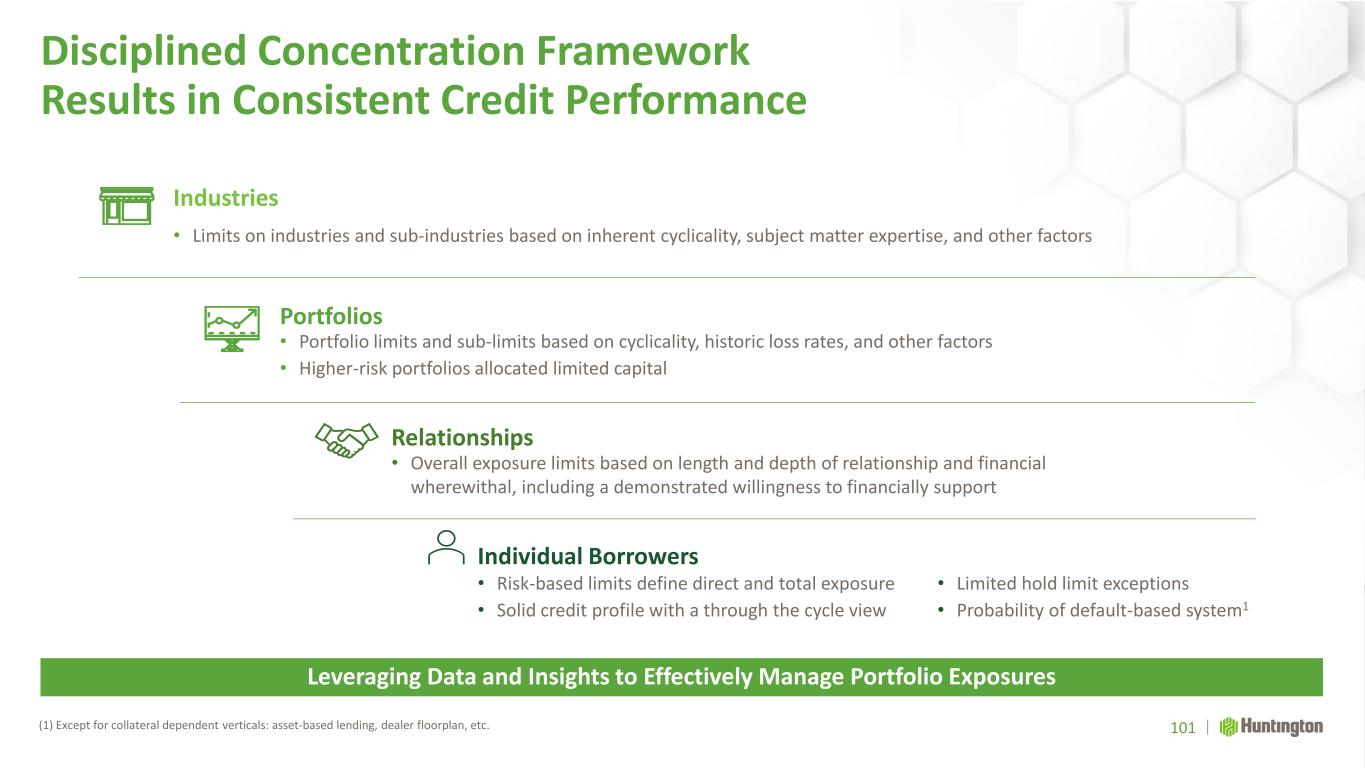
Disciplined Concentration Framework Results in Consistent Credit Performance (1) Except for collateral dependent verticals: asset-based lending, dealer floorplan, etc. 101 Leveraging Data and Insights to Effectively Manage Portfolio Exposures • Limits on industries and sub-industries based on inherent cyclicality, subject matter expertise, and other factors Industries • Portfolio limits and sub-limits based on cyclicality, historic loss rates, and other factors • Higher-risk portfolios allocated limited capital Portfolios • Overall exposure limits based on length and depth of relationship and financial wherewithal, including a demonstrated willingness to financially support Relationships • Risk-based limits define direct and total exposure • Solid credit profile with a through the cycle view • Limited hold limit exceptions • Probability of default-based system1 Individual Borrowers
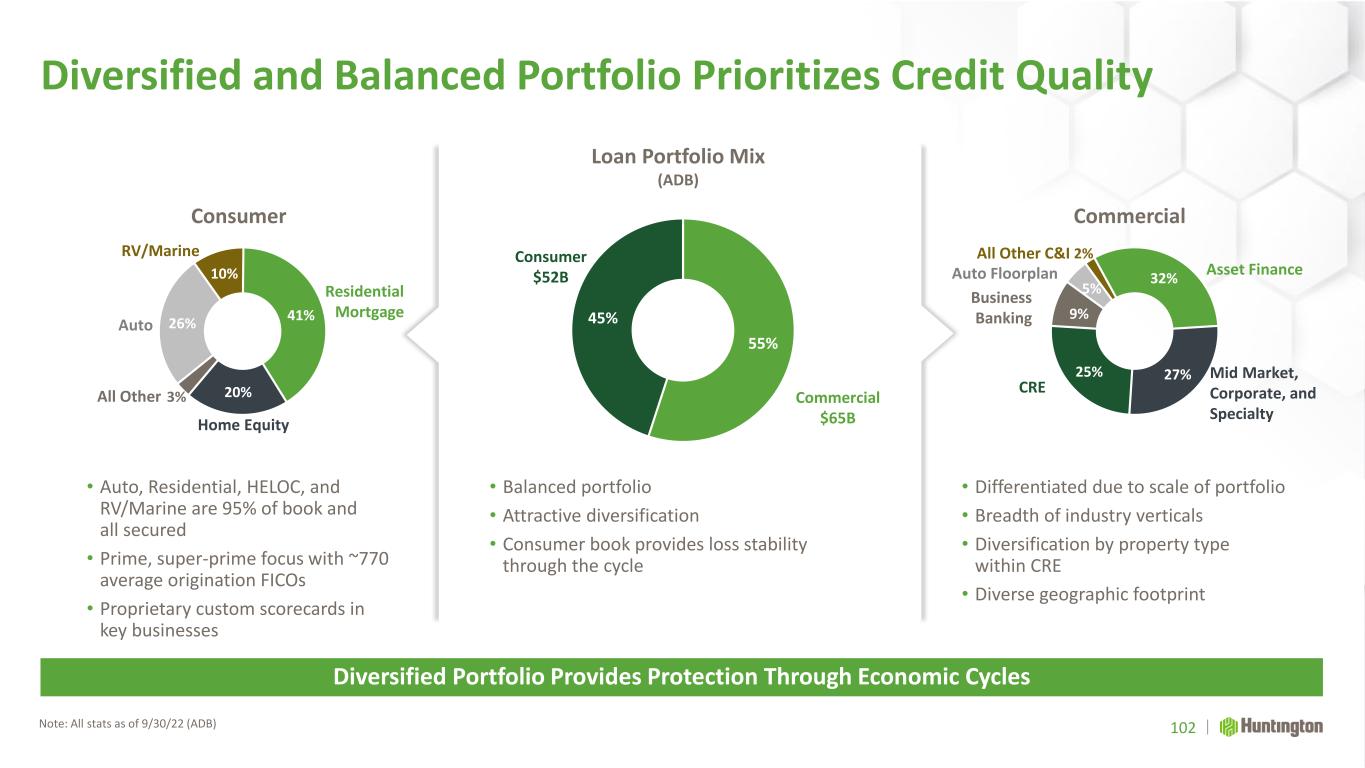
2% 32% 27%25% 9% 5% CRE Mid Market, Corporate, and Specialty Asset Finance Business Banking Auto Floorplan Commercial Diversified and Balanced Portfolio Prioritizes Credit Quality Note: All stats as of 9/30/22 (ADB) Diversified Portfolio Provides Protection Through Economic Cycles Consumer 55% 45% Consumer $52B Commercial $65B Loan Portfolio Mix (ADB) • Auto, Residential, HELOC, and RV/Marine are 95% of book and all secured • Prime, super-prime focus with ~770 average origination FICOs • Proprietary custom scorecards in key businesses • Balanced portfolio • Attractive diversification • Consumer book provides loss stability through the cycle • Differentiated due to scale of portfolio • Breadth of industry verticals • Diversification by property type within CRE • Diverse geographic footprint 26% 10% 41% 20%3% Residential Mortgage Home Equity RV/Marine Auto All Other 102 All Other C&I
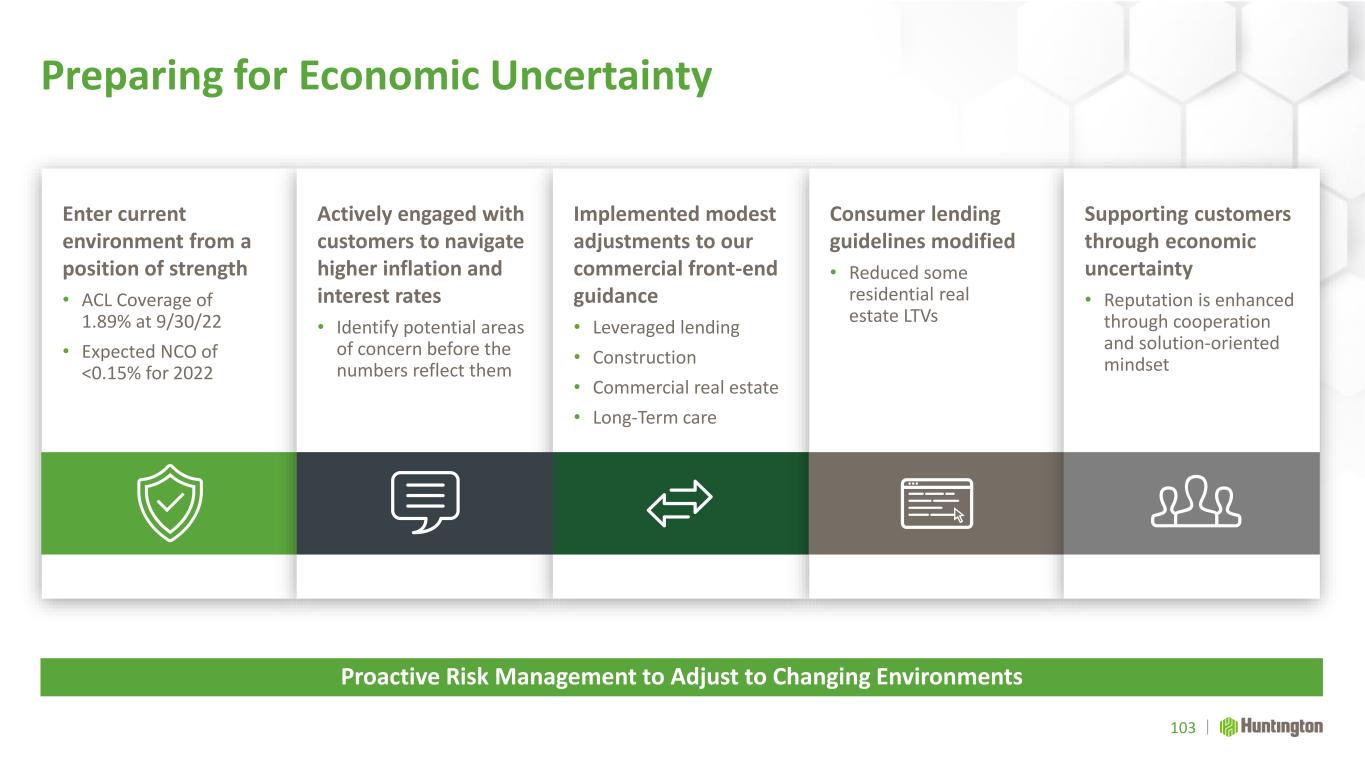
Enter current environment from a position of strength • ACL Coverage of 1.89% at 9/30/22 • Expected NCO of <0.15% for 2022 Actively engaged with customers to navigate higher inflation and interest rates • Identify potential areas of concern before the numbers reflect them Implemented modest adjustments to our commercial front-end guidance • Leveraged lending • Construction • Commercial real estate • Long-Term care Preparing for Economic Uncertainty 103 Proactive Risk Management to Adjust to Changing Environments Consumer lending guidelines modified • Reduced some residential real estate LTVs Supporting customers through economic uncertainty • Reputation is enhanced through cooperation and solution-oriented mindset
Risk Management Key Takeaways 104 Disciplined and Consistent Risk Management Supports Strategy Strong risk management culture permeates the company 2 Clearly established aggregate moderate-to-low risk appetite 1 Well-positioned with scalable risk processes and controls 3
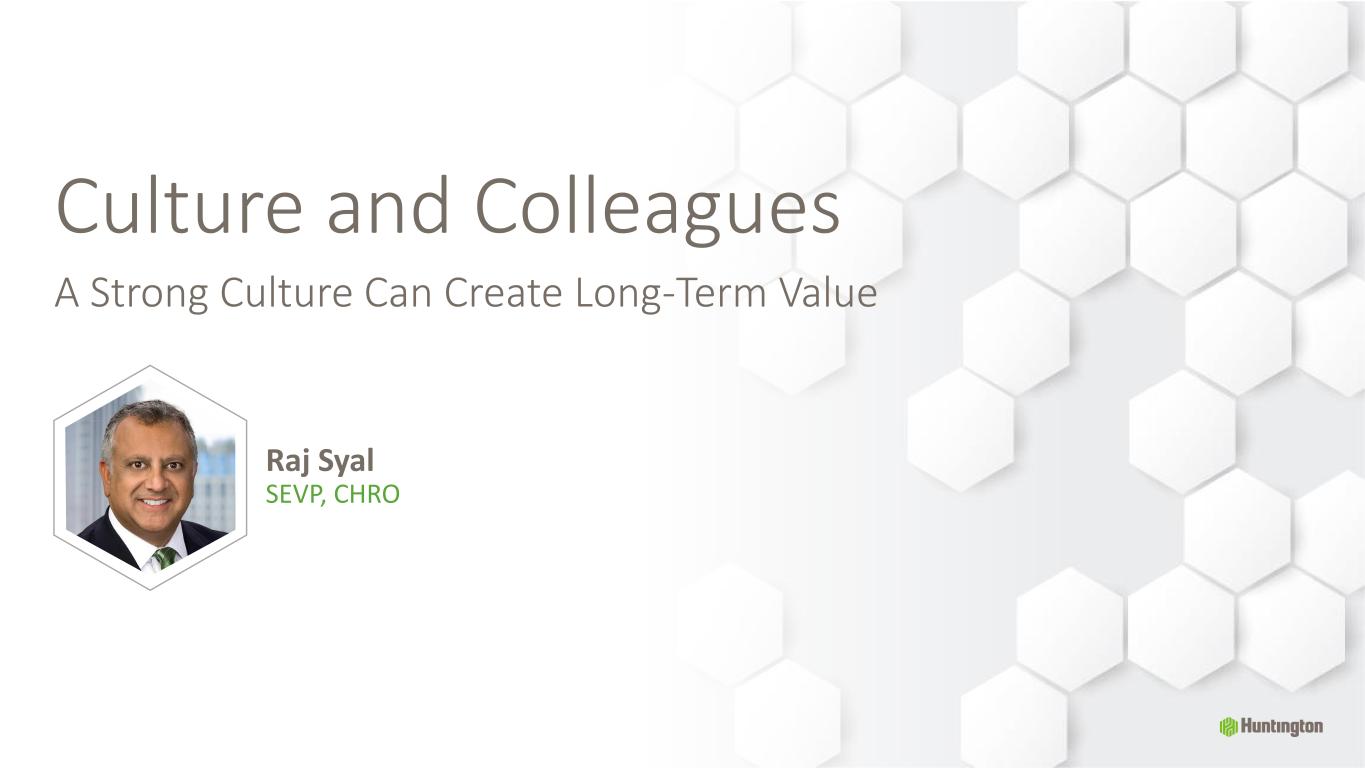
Culture and Colleagues A Strong Culture Can Create Long-Term Value Raj Syal SEVP, CHRO
Culture and Colleagues Key Messages 106 Prioritizing Experience, Top Talent, DE&I, and Culture Initiatives Driving outperformance through culture and DE&I Making Huntington the best place our colleagues will ever work Engaging, developing, retaining, and attracting the best talent Connecting colleague and customer experience 1 2 3 4
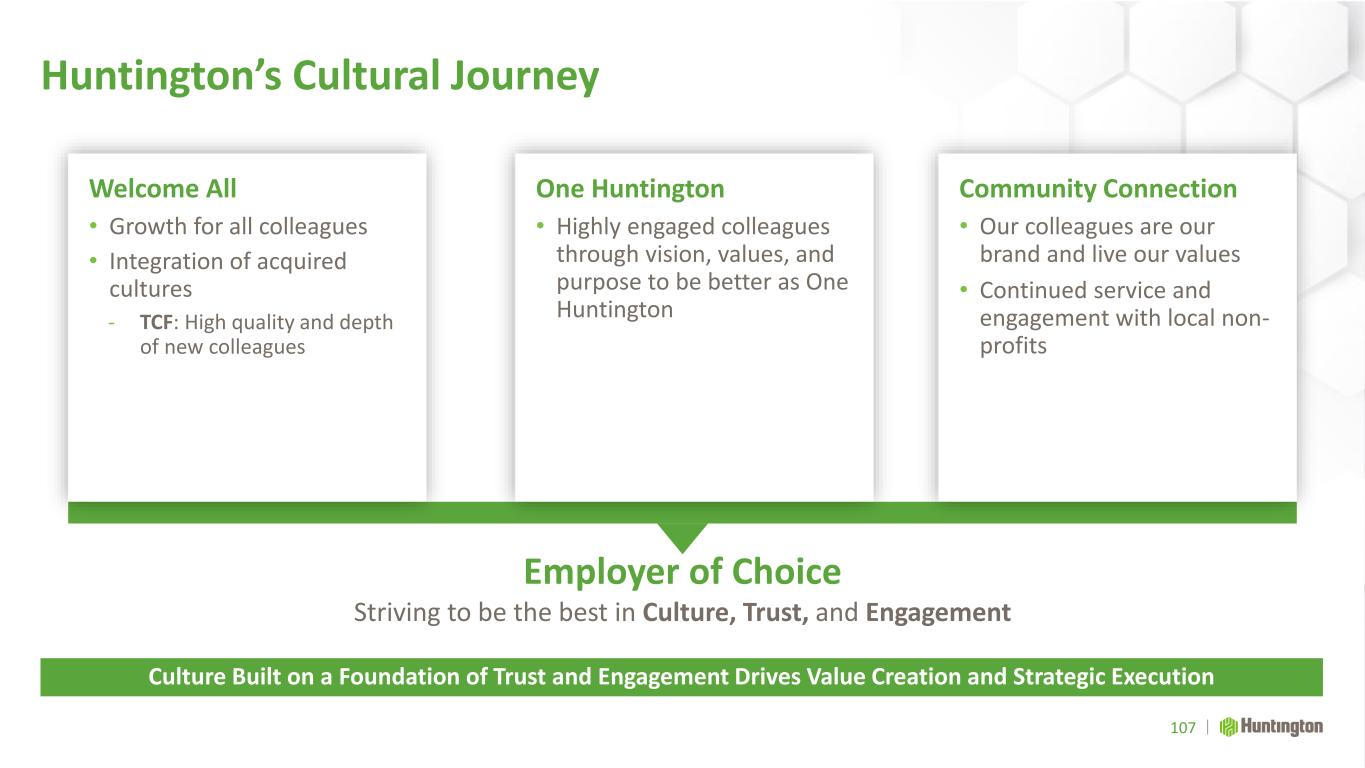
Huntington’s Cultural Journey Culture Built on a Foundation of Trust and Engagement Drives Value Creation and Strategic Execution Employer of Choice Striving to be the best in Culture, Trust, and Engagement Welcome All • Growth for all colleagues • Integration of acquired cultures - TCF: High quality and depth of new colleagues One Huntington • Highly engaged colleagues through vision, values, and purpose to be better as One Huntington Community Connection • Our colleagues are our brand and live our values • Continued service and engagement with local non- profits 107
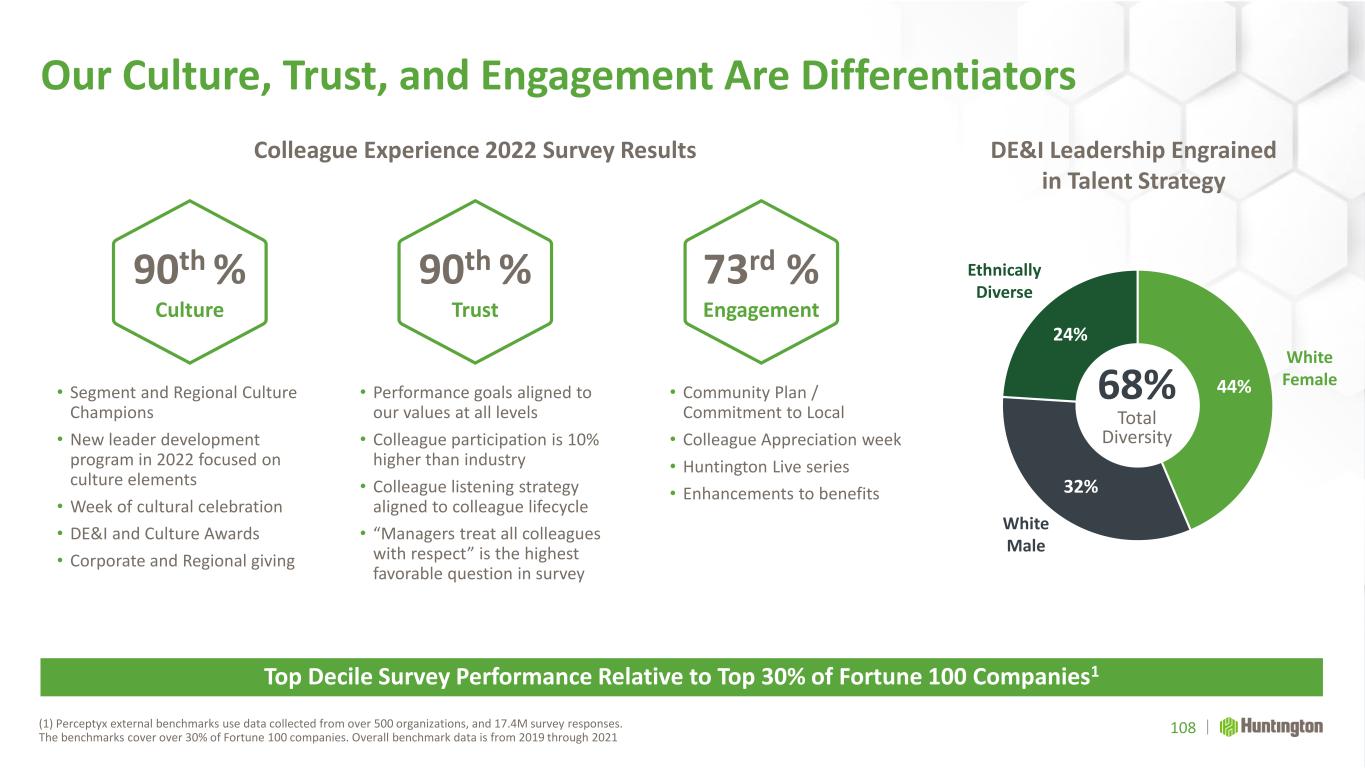
Our Culture, Trust, and Engagement Are Differentiators (1) Perceptyx external benchmarks use data collected from over 500 organizations, and 17.4M survey responses. The benchmarks cover over 30% of Fortune 100 companies. Overall benchmark data is from 2019 through 2021 Top Decile Survey Performance Relative to Top 30% of Fortune 100 Companies1 DE&I Leadership Engrained in Talent Strategy 44% 32% 24% 68% Total Diversity White Female Ethnically Diverse White Male Colleague Experience 2022 Survey Results 90th % Culture 73rd % Engagement 90th % Trust • Segment and Regional Culture Champions • New leader development program in 2022 focused on culture elements • Week of cultural celebration • DE&I and Culture Awards • Corporate and Regional giving • Performance goals aligned to our values at all levels • Colleague participation is 10% higher than industry • Colleague listening strategy aligned to colleague lifecycle • “Managers treat all colleagues with respect” is the highest favorable question in survey • Community Plan / Commitment to Local • Colleague Appreciation week • Huntington Live series • Enhancements to benefits 108
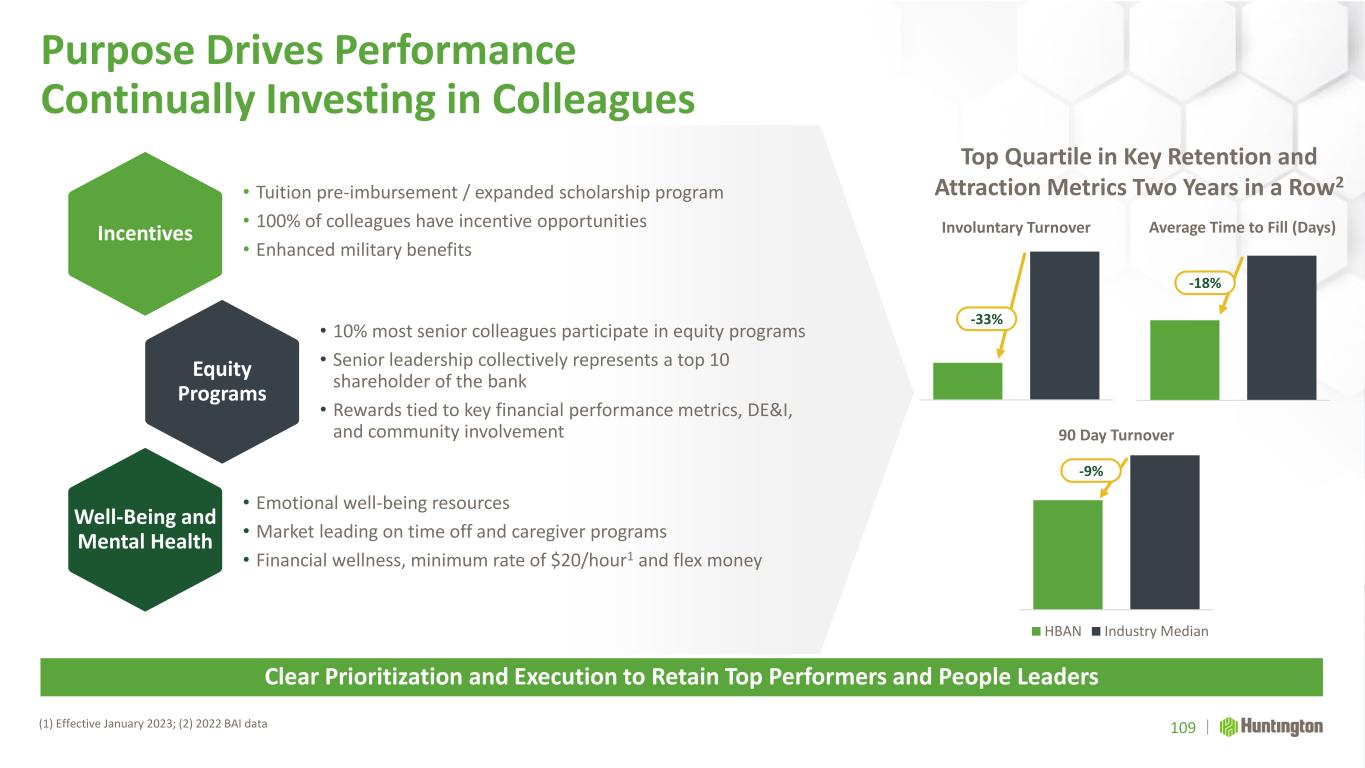
Purpose Drives Performance Continually Investing in Colleagues (1) Effective January 2023; (2) 2022 BAI data Clear Prioritization and Execution to Retain Top Performers and People Leaders Incentives Equity Programs Well-Being and Mental Health • Tuition pre-imbursement / expanded scholarship program • 100% of colleagues have incentive opportunities • Enhanced military benefits • 10% most senior colleagues participate in equity programs • Senior leadership collectively represents a top 10 shareholder of the bank • Rewards tied to key financial performance metrics, DE&I, and community involvement • Emotional well-being resources • Market leading on time off and caregiver programs • Financial wellness, minimum rate of $20/hour1 and flex money HBAN Industry Median 109 Top Quartile in Key Retention and Attraction Metrics Two Years in a Row2 -33% -18% -9% Involuntary Turnover Average Time to Fill (Days) 90 Day Turnover
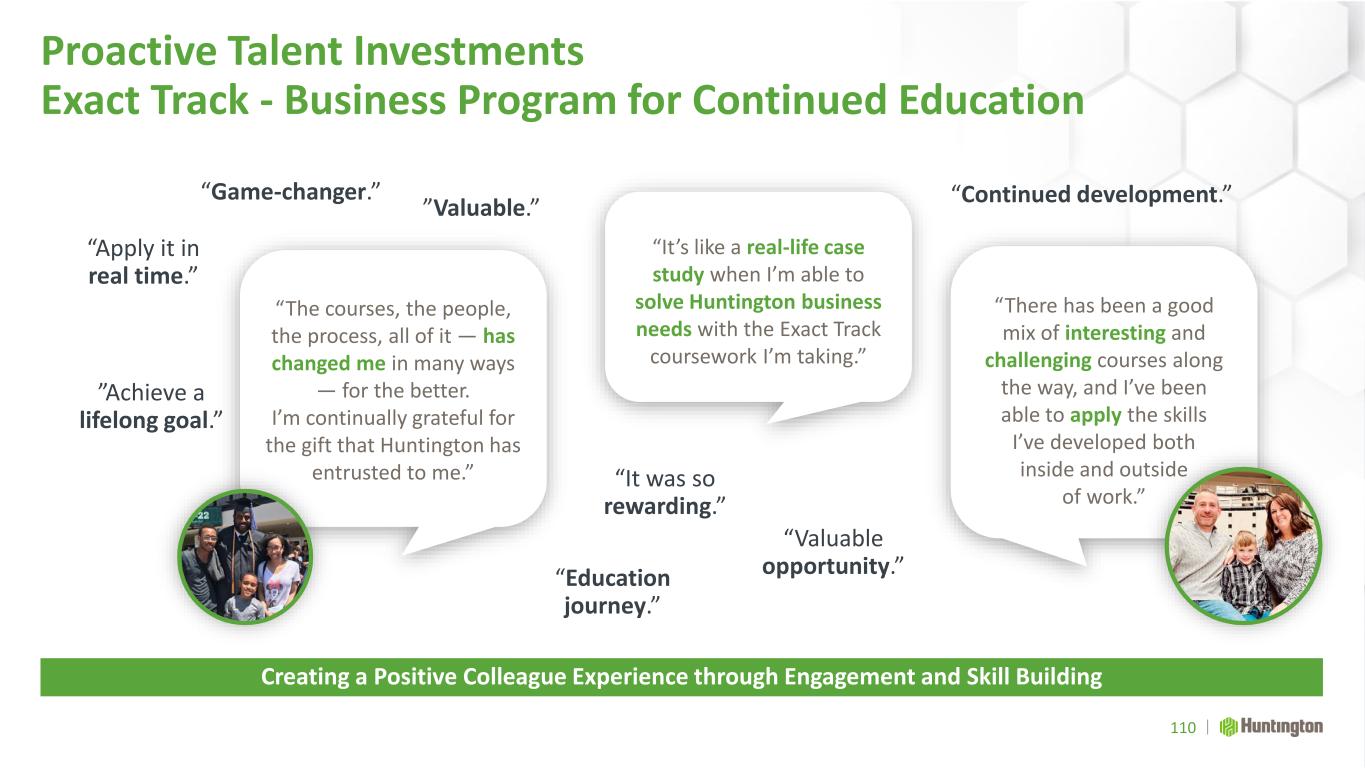
Proactive Talent Investments Exact Track - Business Program for Continued Education Creating a Positive Colleague Experience through Engagement and Skill Building “The courses, the people, the process, all of it — has changed me in many ways — for the better. I’m continually grateful for the gift that Huntington has entrusted to me.” ”Achieve a lifelong goal.” “It was so rewarding.” “Apply it in real time.” “Education journey.” “Valuable opportunity.” “Game-changer.” 110 “There has been a good mix of interesting and challenging courses along the way, and I’ve been able to apply the skills I’ve developed both inside and outside of work.” “It’s like a real-life case study when I’m able to solve Huntington business needs with the Exact Track coursework I’m taking.” ”Valuable.” “Continued development.”
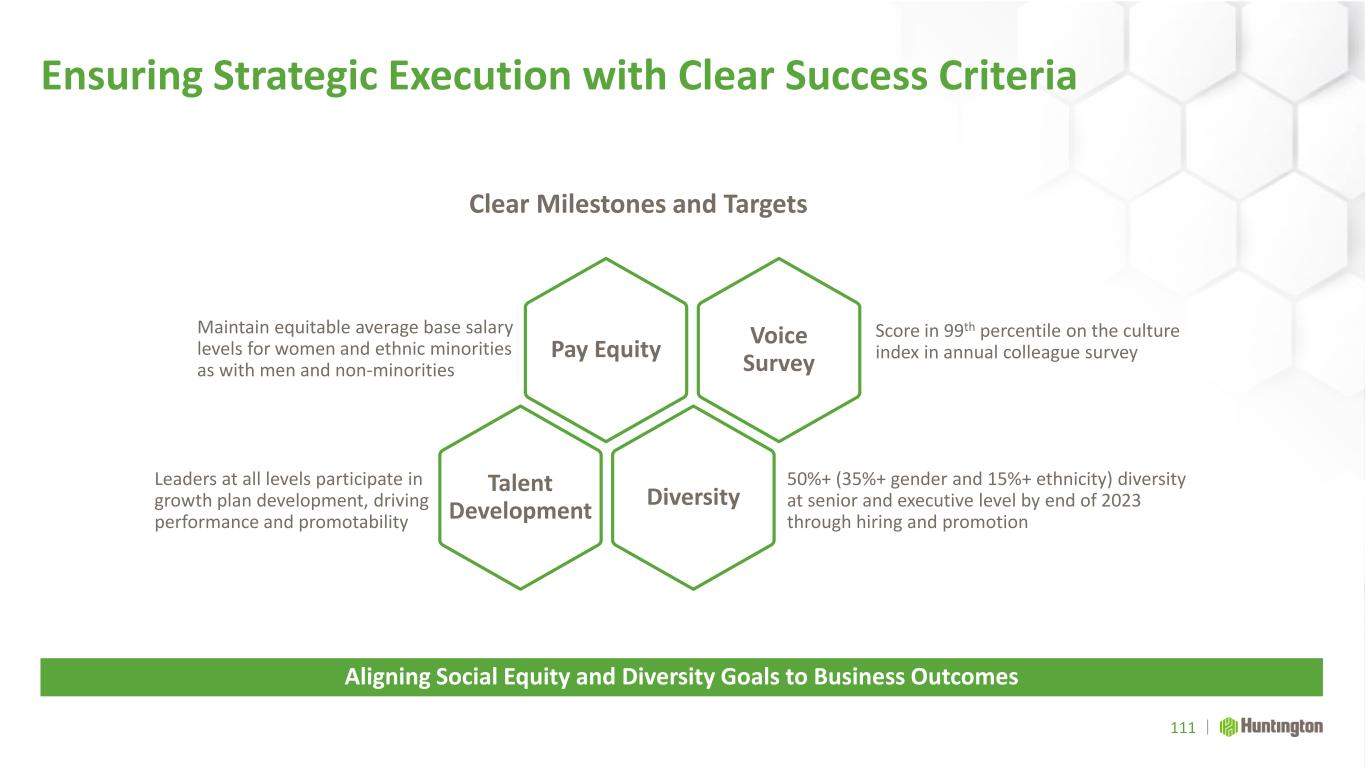
Ensuring Strategic Execution with Clear Success Criteria 111 Aligning Social Equity and Diversity Goals to Business Outcomes Clear Milestones and Targets Diversity Talent Development Pay Equity Voice Survey 50%+ (35%+ gender and 15%+ ethnicity) diversity at senior and executive level by end of 2023 through hiring and promotion Leaders at all levels participate in growth plan development, driving performance and promotability Maintain equitable average base salary levels for women and ethnic minorities as with men and non-minorities Score in 99th percentile on the culture index in annual colleague survey
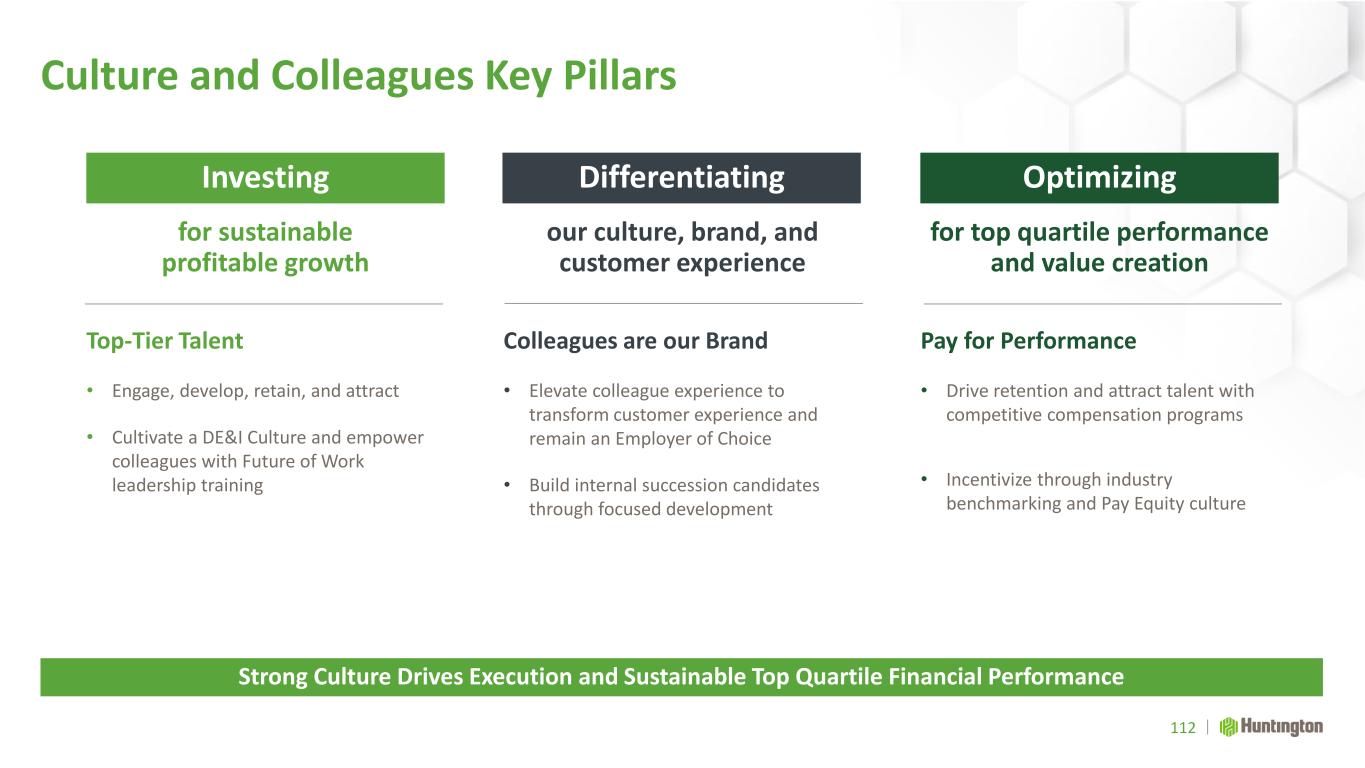
Investing Optimizing Differentiating for sustainable profitable growth for top quartile performance and value creation our culture, brand, and customer experience Culture and Colleagues Key Pillars Pay for Performance • Drive retention and attract talent with competitive compensation programs • Incentivize through industry benchmarking and Pay Equity culture 112 Strong Culture Drives Execution and Sustainable Top Quartile Financial Performance Colleagues are our Brand • Elevate colleague experience to transform customer experience and remain an Employer of Choice • Build internal succession candidates through focused development Top-Tier Talent • Engage, develop, retain, and attract • Cultivate a DE&I Culture and empower colleagues with Future of Work leadership training
Financial Outlook Consistent Top Quartile Financial Performance and Compounding Value Creation Zach Wasserman SEVP, CFO
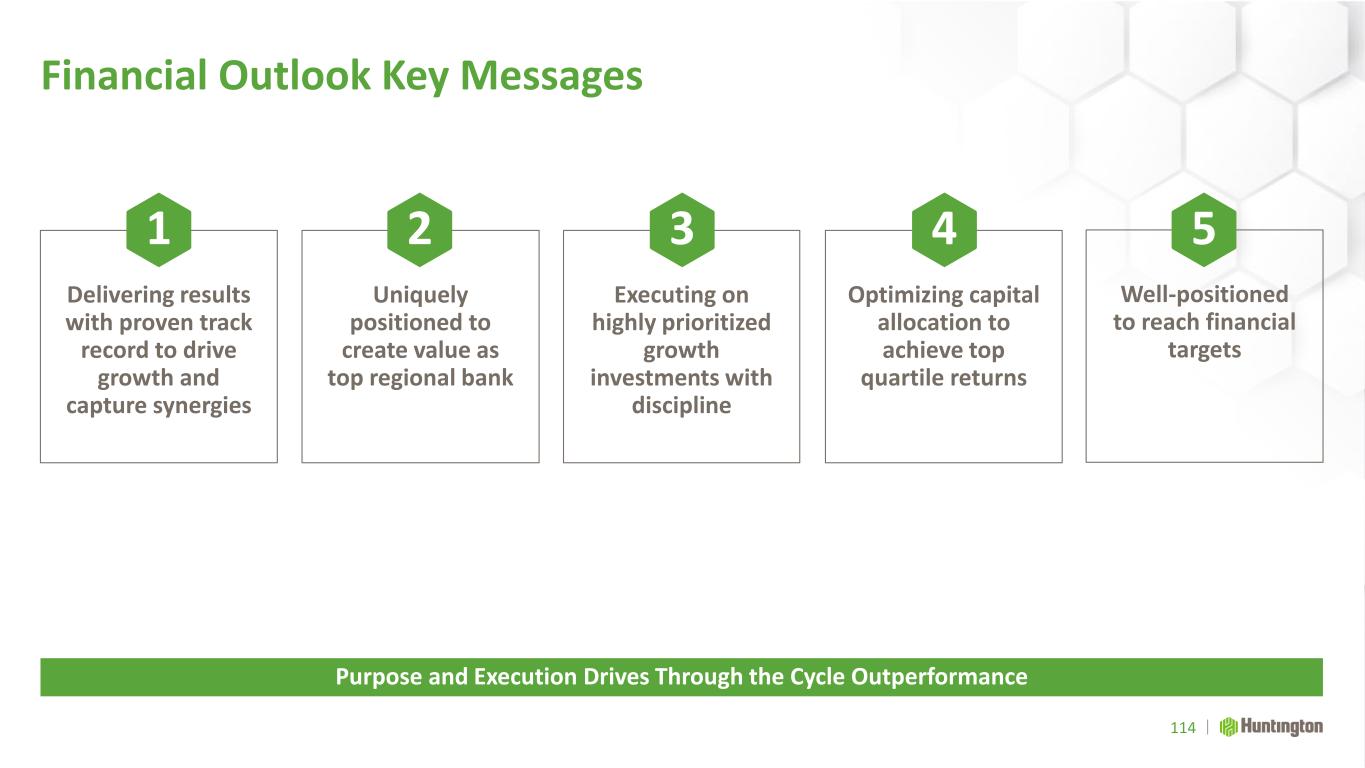
Financial Outlook Key Messages 114 Purpose and Execution Drives Through the Cycle Outperformance Optimizing capital allocation to achieve top quartile returns Executing on highly prioritized growth investments with discipline Uniquely positioned to create value as top regional bank Delivering results with proven track record to drive growth and capture synergies Well-positioned to reach financial targets 1 2 3 4 5
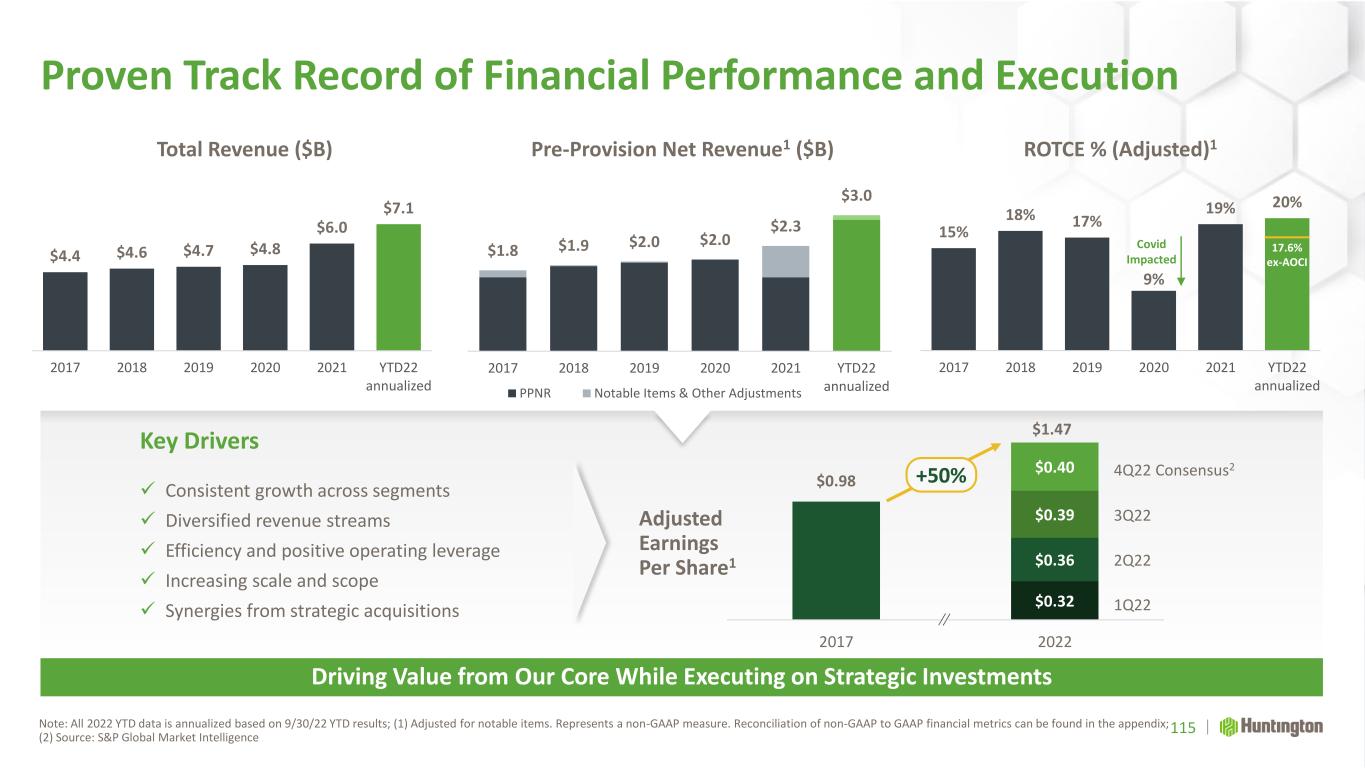
Proven Track Record of Financial Performance and Execution Note: All 2022 YTD data is annualized based on 9/30/22 YTD results; (1) Adjusted for notable items. Represents a non-GAAP measure. Reconciliation of non-GAAP to GAAP financial metrics can be found in the appendix; (2) Source: S&P Global Market Intelligence 115 Driving Value from Our Core While Executing on Strategic Investments $4.4 $4.6 $4.7 $4.8 $6.0 $7.1 2017 2018 2019 2020 2021 YTD22 annualized Total Revenue ($B) $1.8 $1.9 $2.0 $2.0 $2.3 $3.0 2017 2018 2019 2020 2021 YTD22 annualized Th o u sa n d s PPNR Notable Items & Other Adjustments Pre-Provision Net Revenue1 ($B) 15% 18% 17% 9% 19% 20% 2017 2018 2019 2020 2021 YTD22 annualized ROTCE % (Adjusted)1 Covid Impacted Adjusted Earnings Per Share1 $0.98 $0.32 $0.36 $0.39 $0.40 2017 2022 1Q22 2Q22 3Q22 $1.47 ✓ Consistent growth across segments ✓ Diversified revenue streams ✓ Efficiency and positive operating leverage ✓ Increasing scale and scope ✓ Synergies from strategic acquisitions Key Drivers 4Q22 Consensus2 +50% 17.6% ex-AOCI
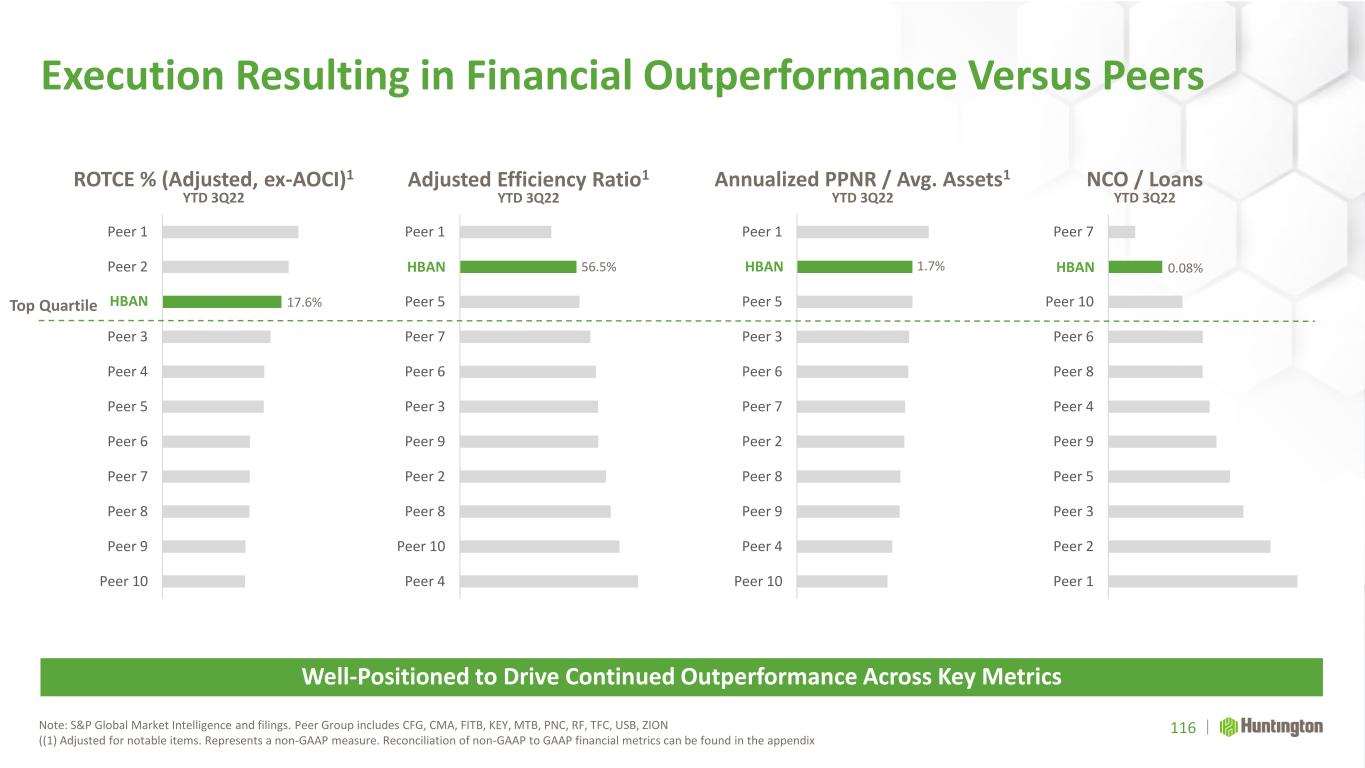
Peer 1 Peer 2 Peer 3 Peer 5 Peer 9 Peer 4 Peer 8 Peer 6 Peer 10 HBAN Peer 7 Peer 10 Peer 4 Peer 9 Peer 8 Peer 2 Peer 7 Peer 6 Peer 3 Peer 5 HBAN Peer 1 Peer 10 Peer 9 Peer 8 Peer 7 Peer 6 Peer 5 Peer 4 Peer 3 HBAN Peer 2 Peer 1 Peer 4 Peer 10 Peer 8 Peer 2 Peer 9 Peer 3 Peer 6 Peer 7 Peer 5 HBAN Peer 1 Execution Resulting in Financial Outperformance Versus Peers Note: S&P Global Market Intelligence and filings. Peer Group includes CFG, CMA, FITB, KEY, MTB, PNC, RF, TFC, USB, ZION ((1) Adjusted for notable items. Represents a non-GAAP measure. Reconciliation of non-GAAP to GAAP financial metrics can be found in the appendix 116 Well-Positioned to Drive Continued Outperformance Across Key Metrics ROTCE % (Adjusted, ex-AOCI)1 YTD 3Q22 Adjusted Efficiency Ratio1 YTD 3Q22 Annualized PPNR / Avg. Assets1 YTD 3Q22 NCO / Loans YTD 3Q22 17.6% 0.08%56.5% 1.7% Top Quartile
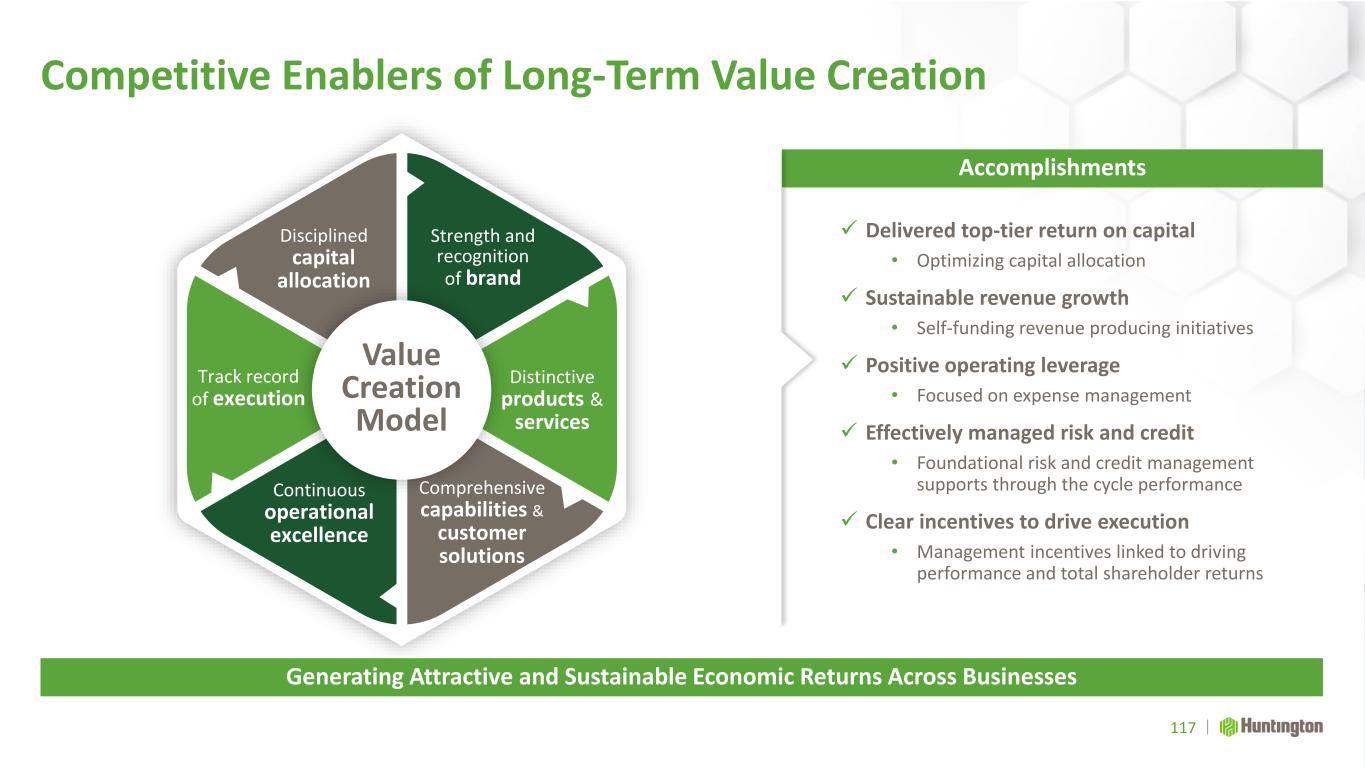
Competitive Enablers of Long-Term Value Creation Generating Attractive and Sustainable Economic Returns Across Businesses Disciplined capital allocation Comprehensive capabilities & customer solutions Strength and recognition of brand Distinctive products & services Continuous operational excellence Track record of execution Value Creation Model ✓ Delivered top-tier return on capital • Optimizing capital allocation ✓ Sustainable revenue growth • Self-funding revenue producing initiatives ✓ Positive operating leverage • Focused on expense management ✓ Effectively managed risk and credit • Foundational risk and credit management supports through the cycle performance ✓ Clear incentives to drive execution • Management incentives linked to driving performance and total shareholder returns Accomplishments 117
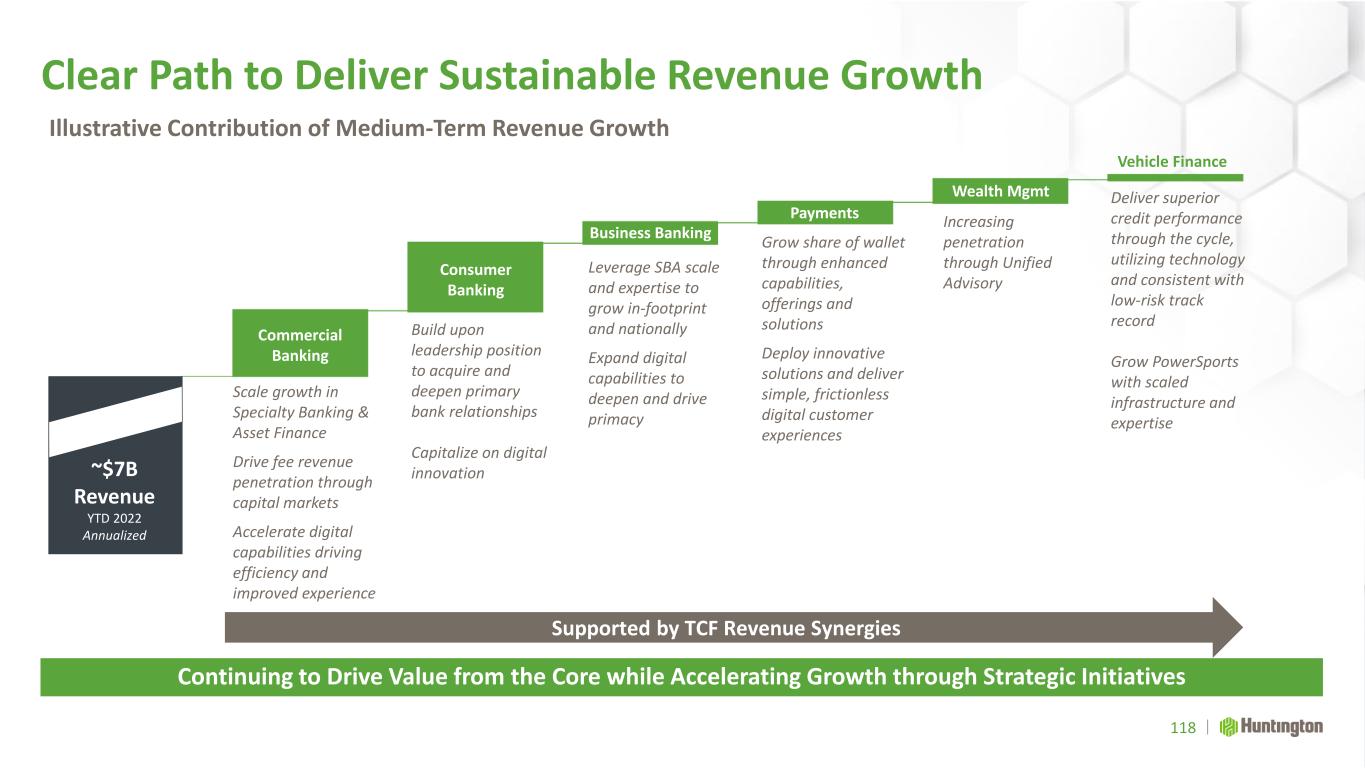
Clear Path to Deliver Sustainable Revenue Growth 118 Continuing to Drive Value from the Core while Accelerating Growth through Strategic Initiatives Illustrative Contribution of Medium-Term Revenue Growth Supported by TCF Revenue Synergies Commercial Banking Scale growth in Specialty Banking & Asset Finance Drive fee revenue penetration through capital markets Accelerate digital capabilities driving efficiency and improved experience Consumer Banking Build upon leadership position to acquire and deepen primary bank relationships Capitalize on digital innovation Business Banking Leverage SBA scale and expertise to grow in-footprint and nationally Expand digital capabilities to deepen and drive primacy Payments Grow share of wallet through enhanced capabilities, offerings and solutions Deploy innovative solutions and deliver simple, frictionless digital customer experiences Wealth Mgmt Increasing penetration through Unified Advisory Vehicle Finance Deliver superior credit performance through the cycle, utilizing technology and consistent with low-risk track record Grow PowerSports with scaled infrastructure and expertise ~$7B Revenue YTD 2022 Annualized
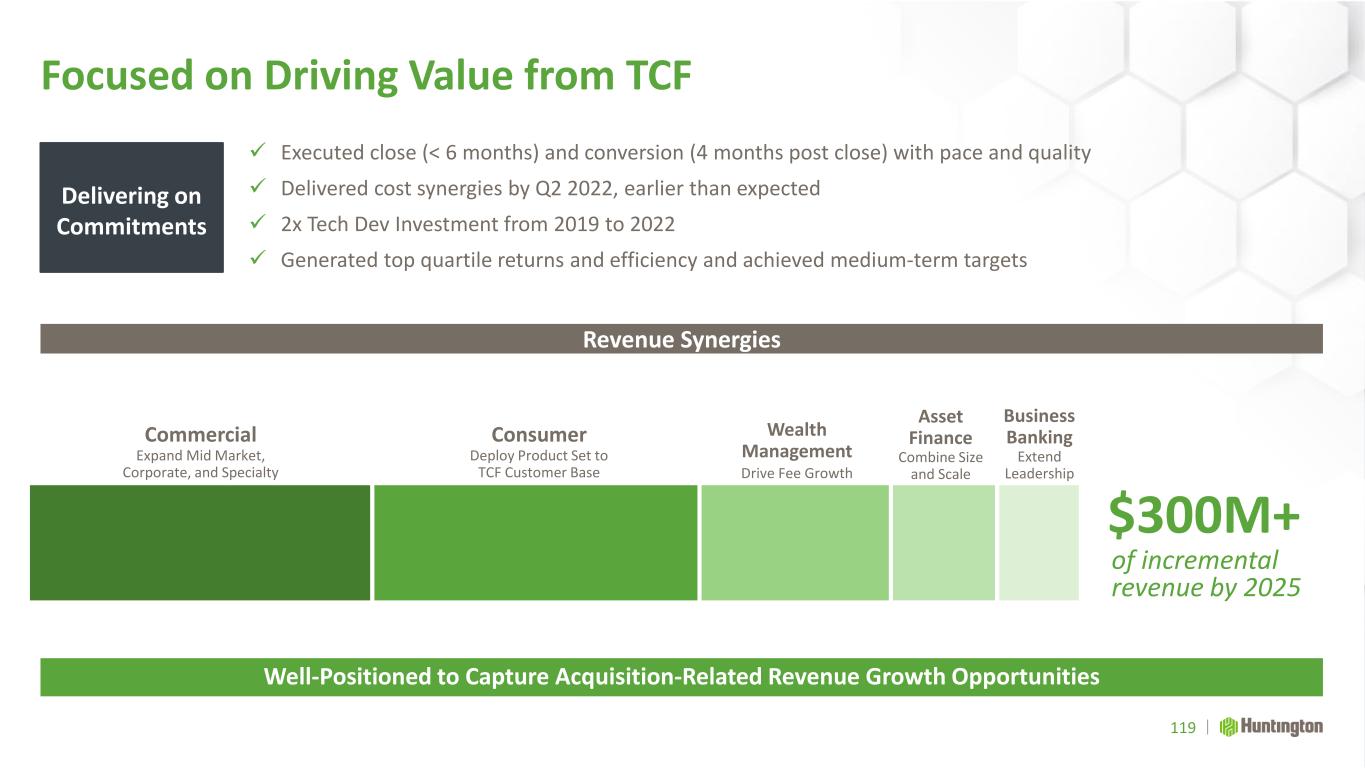
Focused on Driving Value from TCF Well-Positioned to Capture Acquisition-Related Revenue Growth Opportunities Revenue Synergies 119 of incremental revenue by 2025 Delivering on Commitments ✓ Executed close (< 6 months) and conversion (4 months post close) with pace and quality ✓ Delivered cost synergies by Q2 2022, earlier than expected ✓ 2x Tech Dev Investment from 2019 to 2022 ✓ Generated top quartile returns and efficiency and achieved medium-term targets $300M+ Commercial Expand Mid Market, Corporate, and Specialty Consumer Deploy Product Set to TCF Customer Base Wealth Management Drive Fee Growth Asset Finance Combine Size and Scale Business Banking Extend Leadership
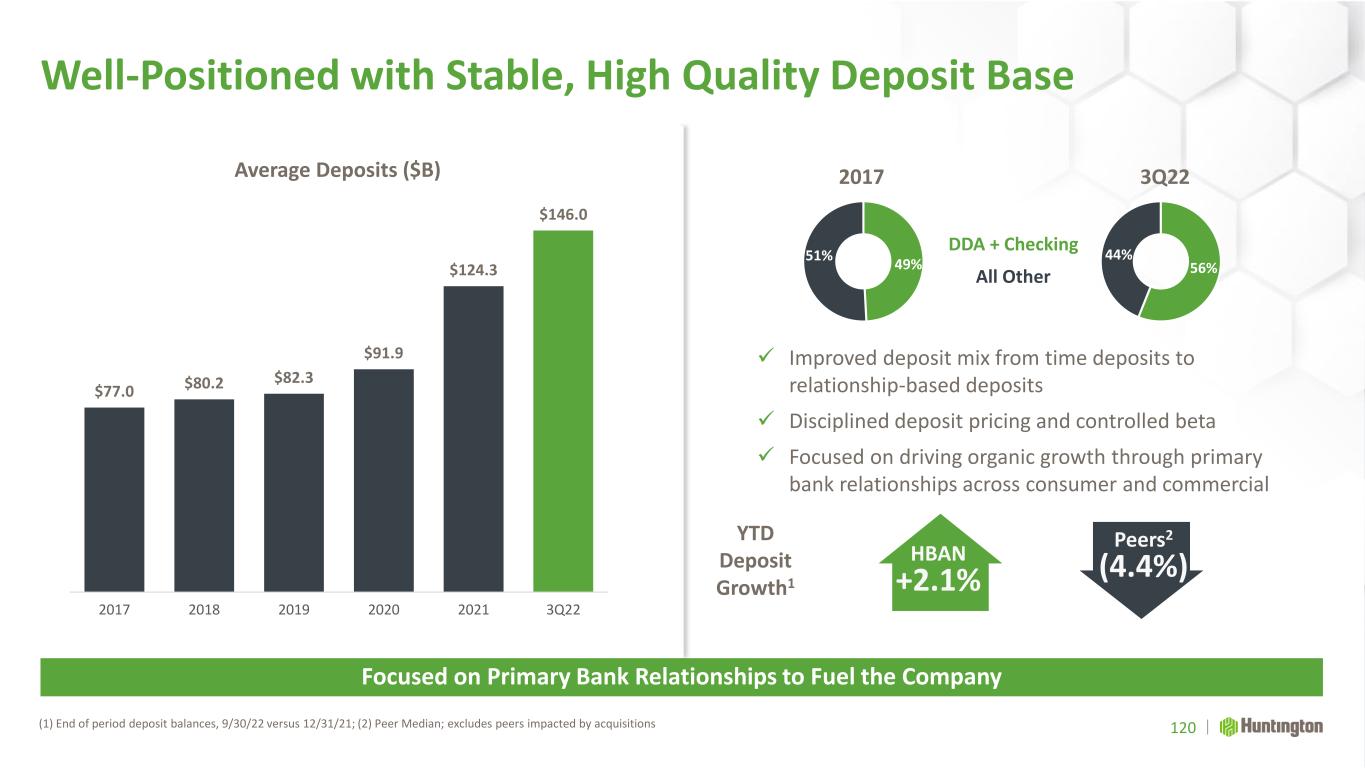
Well-Positioned with Stable, High Quality Deposit Base (1) End of period deposit balances, 9/30/22 versus 12/31/21; (2) Peer Median; excludes peers impacted by acquisitions Focused on Primary Bank Relationships to Fuel the Company 120 $77.0 $80.2 $82.3 $91.9 $124.3 $146.0 2017 2018 2019 2020 2021 3Q22 ✓ Improved deposit mix from time deposits to relationship-based deposits ✓ Disciplined deposit pricing and controlled beta ✓ Focused on driving organic growth through primary bank relationships across consumer and commercial YTD Deposit Growth1 Peers2 (4.4%) Average Deposits ($B) HBAN +2.1% 49% 51% 56% 44% DDA + Checking All Other 2017 3Q22
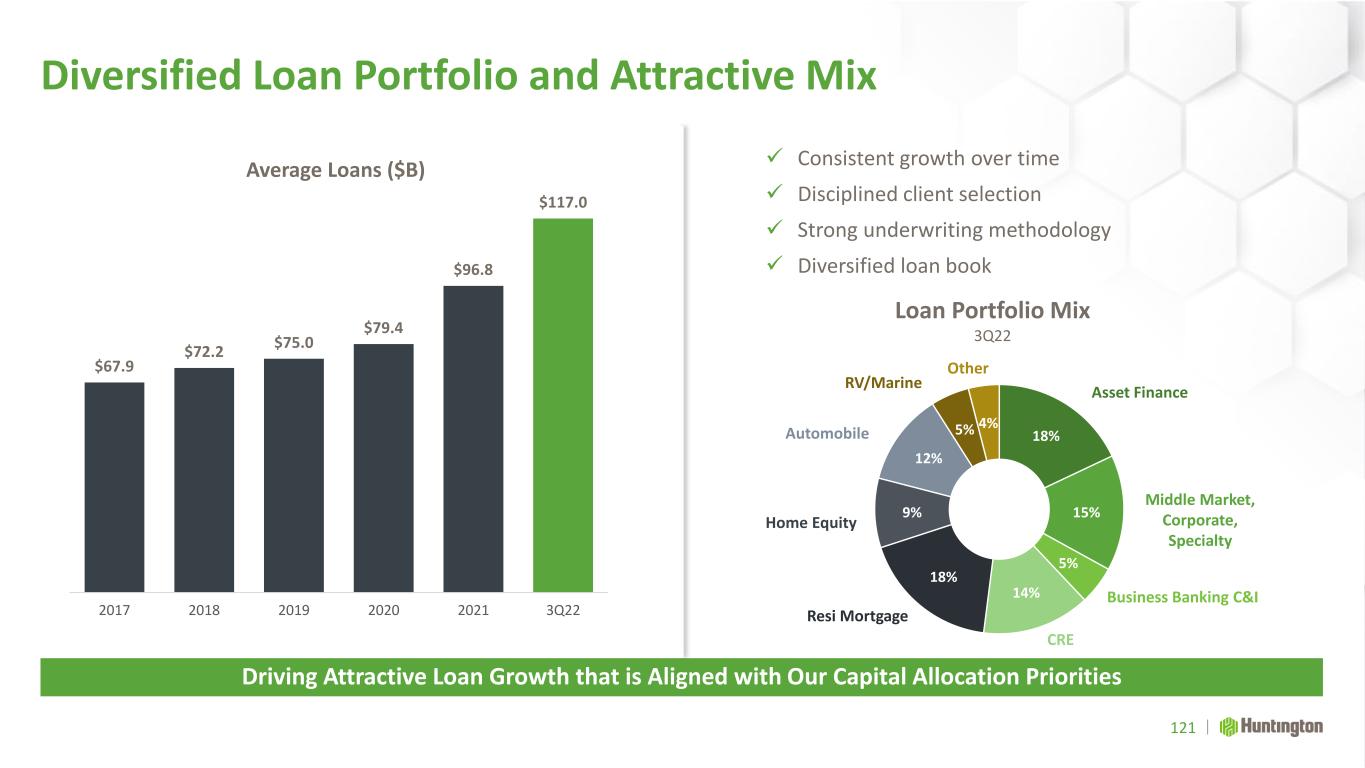
Diversified Loan Portfolio and Attractive Mix Driving Attractive Loan Growth that is Aligned with Our Capital Allocation Priorities 121 ✓ Consistent growth over time ✓ Disciplined client selection ✓ Strong underwriting methodology ✓ Diversified loan book $67.9 $72.2 $75.0 $79.4 $96.8 $117.0 2017 2018 2019 2020 2021 3Q22 Average Loans ($B) Loan Portfolio Mix 3Q22 18% 15% 5% 14% 18% 9% 12% 5% 4% Other RV/Marine Automobile Home Equity Resi Mortgage CRE Business Banking C&I Middle Market, Corporate, Specialty Asset Finance
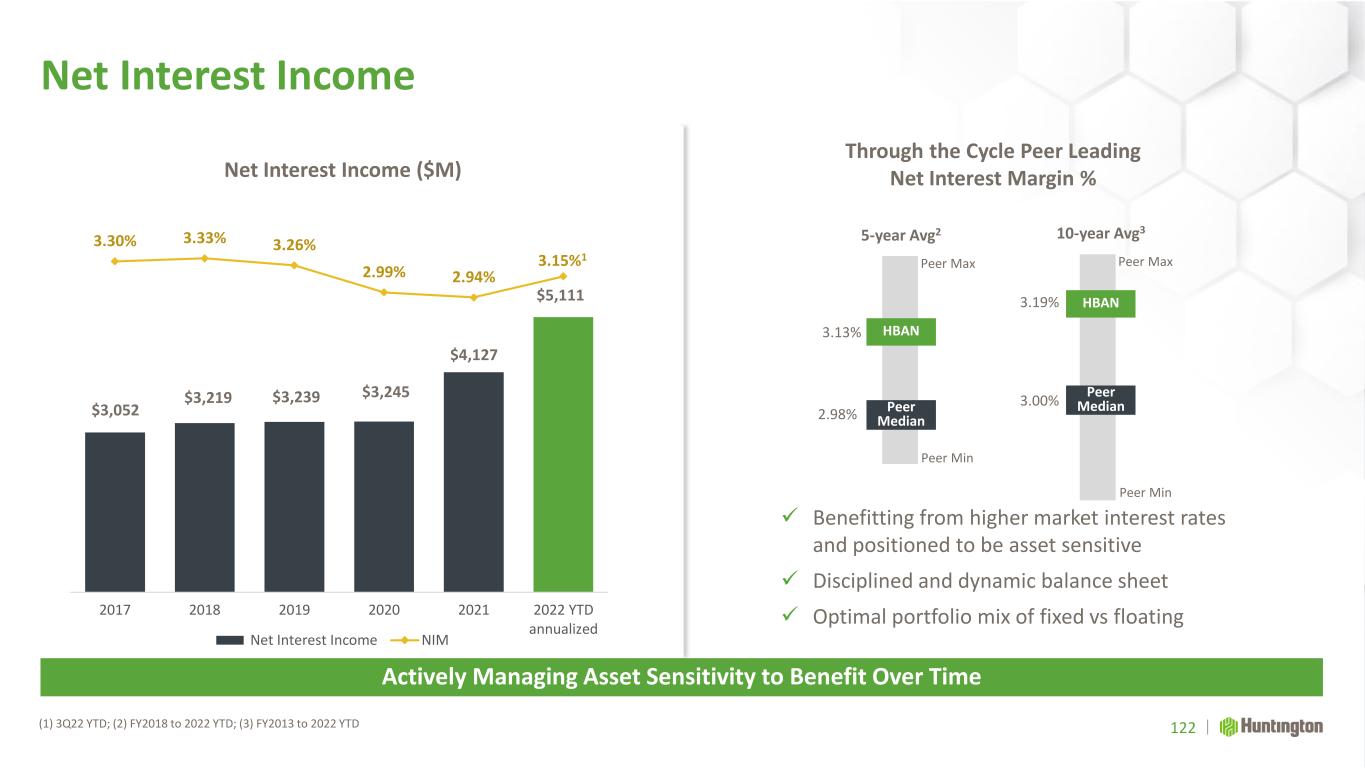
Peer Min Peer Min Net Interest Income Actively Managing Asset Sensitivity to Benefit Over Time 122 $3,052 $3,219 $3,239 $3,245 $4,127 $5,111 3.30% 3.33% 3.26% 2.99% 2.94% $20 0.00 $1,2 00.00 $2,2 00.00 $3,2 00.00 $4,2 00.00 $5,2 00.00 $6,2 00.00 2017 2018 2019 2020 2021 2022 YTD annualized Net Interest Income NIM 3.15%1 Net Interest Income ($M) ✓ Benefitting from higher market interest rates and positioned to be asset sensitive ✓ Disciplined and dynamic balance sheet ✓ Optimal portfolio mix of fixed vs floating Through the Cycle Peer Leading Net Interest Margin % 3.19% HBAN HBAN Peer Median Peer Median 5-year Avg2 10-year Avg3 2.98% 3.13% 3.00% Peer Max Peer Max (1) 3Q22 YTD; (2) FY2018 to 2022 YTD; (3) FY2013 to 2022 YTD
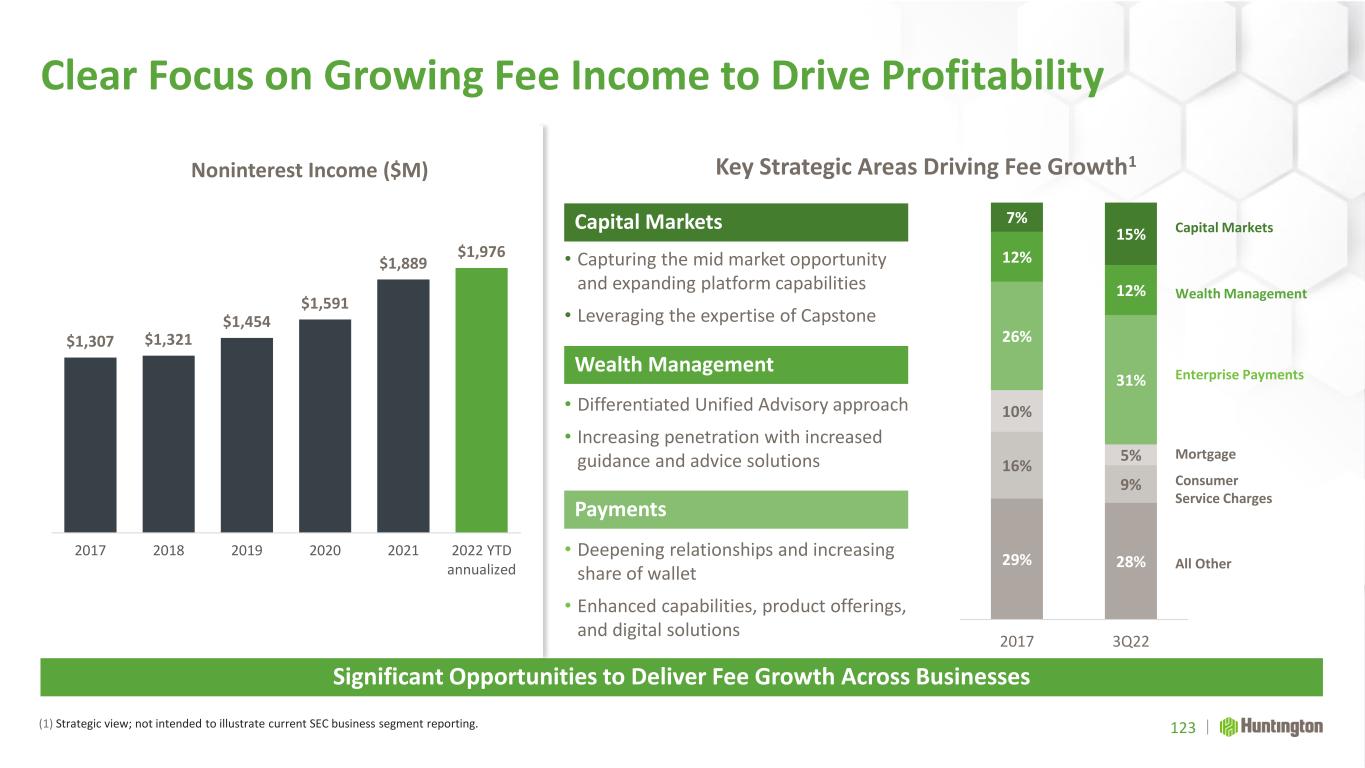
$1,307 $1,321 $1,454 $1,591 $1,889 $1,976 2017 2018 2019 2020 2021 2022 YTD annualized Clear Focus on Growing Fee Income to Drive Profitability Significant Opportunities to Deliver Fee Growth Across Businesses 123 Key Strategic Areas Driving Fee Growth1 Capital Markets Wealth Management Payments • Capturing the mid market opportunity and expanding platform capabilities • Leveraging the expertise of Capstone • Differentiated Unified Advisory approach • Increasing penetration with increased guidance and advice solutions • Deepening relationships and increasing share of wallet • Enhanced capabilities, product offerings, and digital solutions Noninterest Income ($M) 29% 28% 16% 9% 10% 5% 26% 31% 12% 12% 7% 15% 2017 3Q22 (1) Strategic view; not intended to illustrate current SEC business segment reporting. Capital Markets Wealth Management Enterprise Payments Mortgage Consumer Service Charges All Other
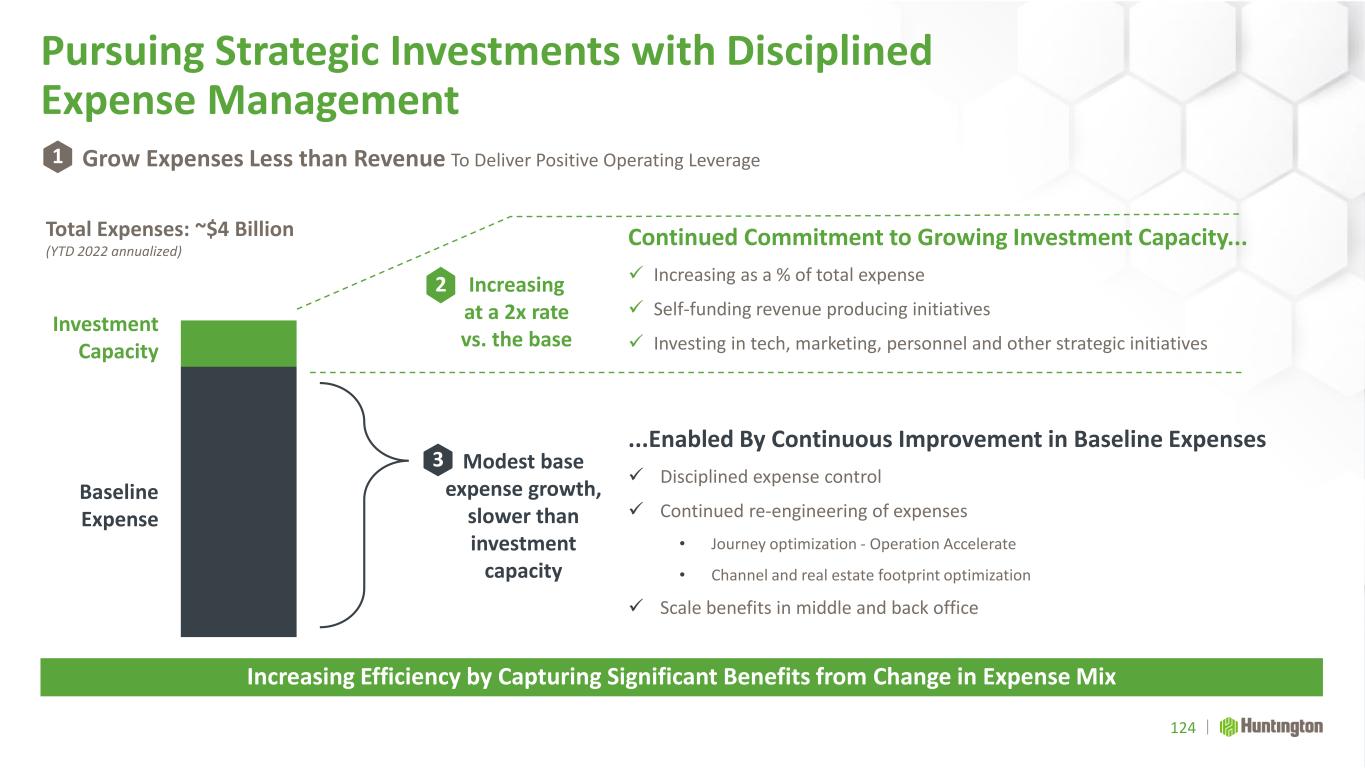
Pursuing Strategic Investments with Disciplined Expense Management Increasing Efficiency by Capturing Significant Benefits from Change in Expense Mix 124 Continued Commitment to Growing Investment Capacity... ✓ Increasing as a % of total expense ✓ Self-funding revenue producing initiatives ✓ Investing in tech, marketing, personnel and other strategic initiatives Baseline Expense Investment Capacity Increasing at a 2x rate vs. the base Modest base expense growth, slower than investment capacity Grow Expenses Less than Revenue To Deliver Positive Operating Leverage Total Expenses: ~$4 Billion (YTD 2022 annualized) ...Enabled By Continuous Improvement in Baseline Expenses ✓ Disciplined expense control ✓ Continued re-engineering of expenses • Journey optimization - Operation Accelerate • Channel and real estate footprint optimization ✓ Scale benefits in middle and back office 2 3 1
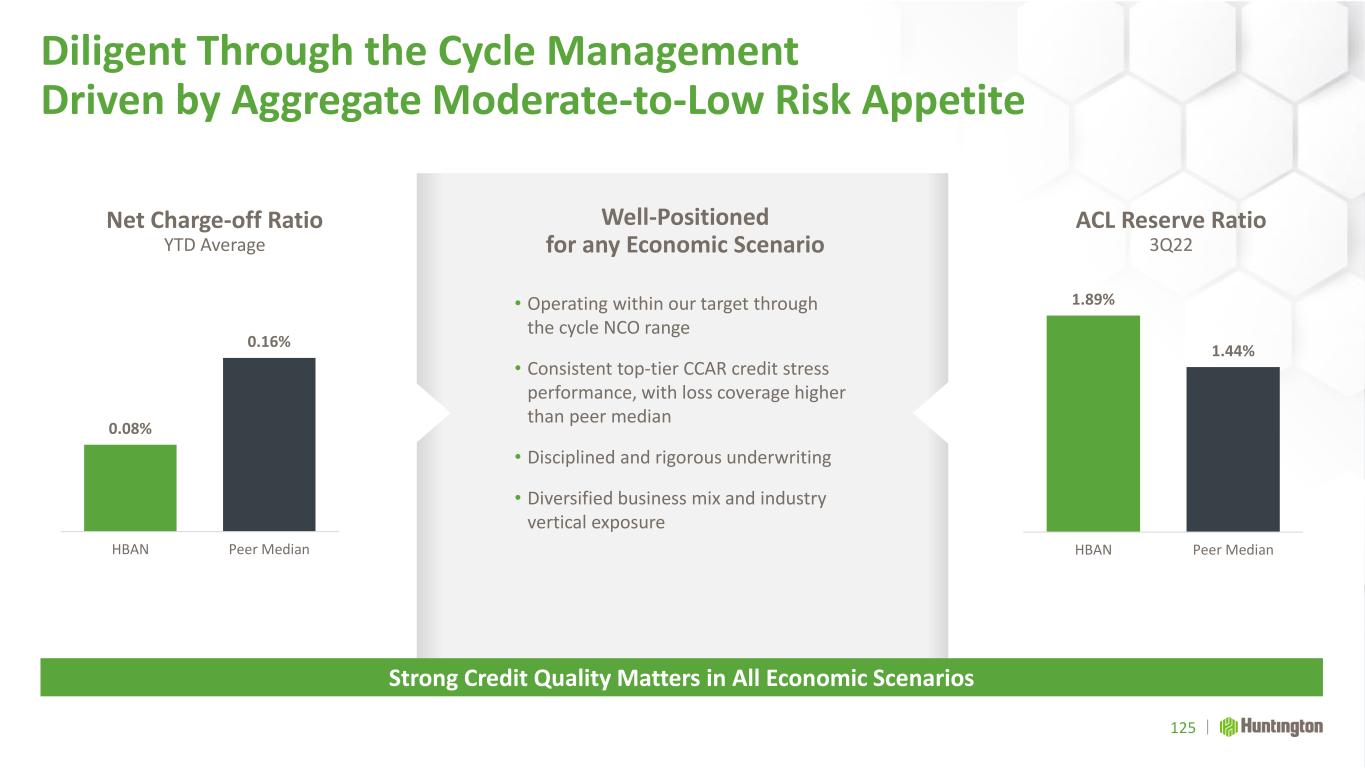
Diligent Through the Cycle Management Driven by Aggregate Moderate-to-Low Risk Appetite Strong Credit Quality Matters in All Economic Scenarios 0.08% 0.16% HBAN Peer Median Net Charge-off Ratio YTD Average 125 ACL Reserve Ratio 3Q22 1.89% 1.44% HBAN Peer Median • Operating within our target through the cycle NCO range • Consistent top-tier CCAR credit stress performance, with loss coverage higher than peer median • Disciplined and rigorous underwriting • Diversified business mix and industry vertical exposure Well-Positioned for any Economic Scenario
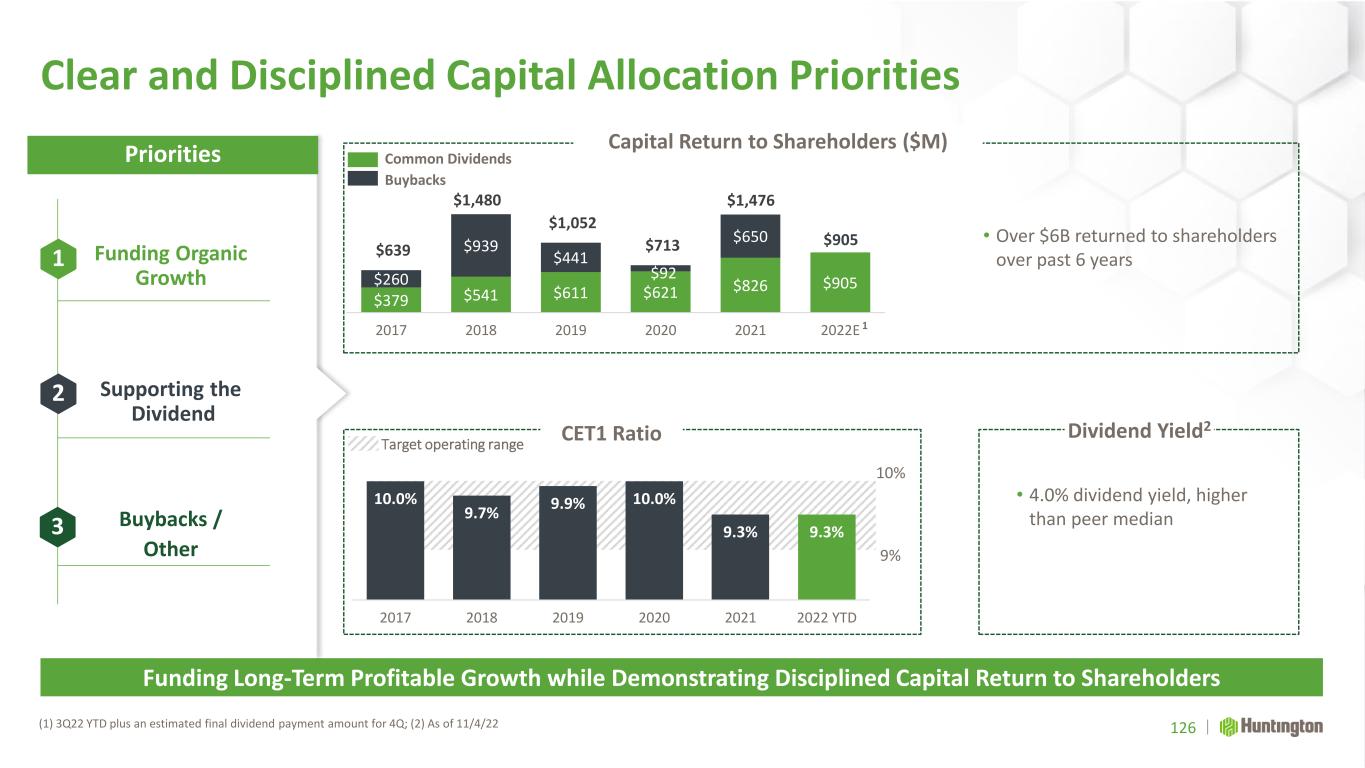
10.0% 9.7% 9.9% 10.0% 9.3% 9.3% 2017 2018 2019 2020 2021 2022 YTD Clear and Disciplined Capital Allocation Priorities (1) 3Q22 YTD plus an estimated final dividend payment amount for 4Q; (2) As of 11/4/22 Funding Long-Term Profitable Growth while Demonstrating Disciplined Capital Return to Shareholders Capital Return to Shareholders ($M) 126 Priorities Funding Organic Growth Supporting the Dividend Buybacks / Other $379 $541 $611 $621 $826 $905 $260 $939 $441 $92 $650 $639 $1,480 $1,052 $713 $1,476 $905 2017 2018 2019 2020 2021 2022E Common Dividends Buybacks • Over $6B returned to shareholders over past 6 years Dividend Yield2 Target operating range 1 2 3 CET1 Ratio 9% 10% 1 • 4.0% dividend yield, higher than peer median
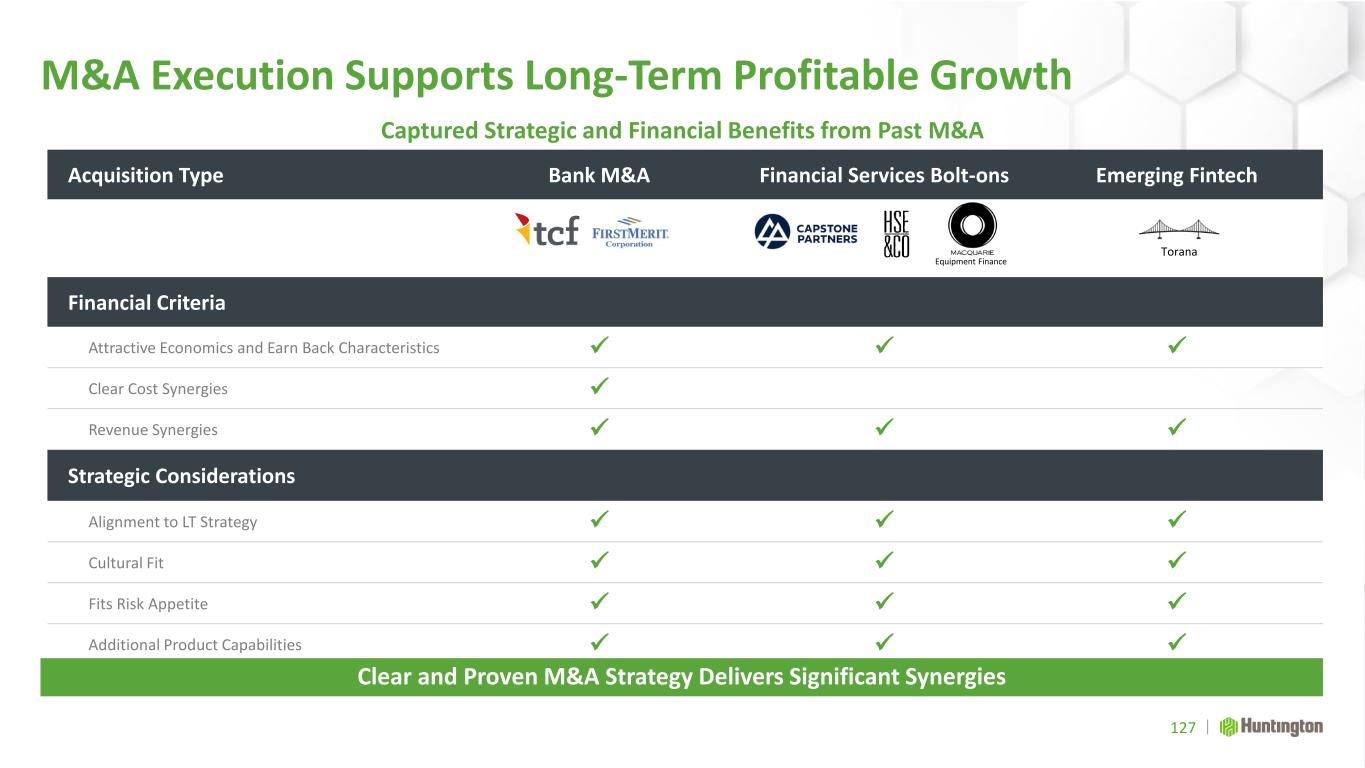
M&A Execution Supports Long-Term Profitable Growth Clear and Proven M&A Strategy Delivers Significant Synergies Acquisition Type Bank M&A Financial Services Bolt-ons Emerging Fintech Financial Criteria Attractive Economics and Earn Back Characteristics ✓ ✓ ✓ Clear Cost Synergies ✓ Revenue Synergies ✓ ✓ ✓ Strategic Considerations Alignment to LT Strategy ✓ ✓ ✓ Cultural Fit ✓ ✓ ✓ Fits Risk Appetite ✓ ✓ ✓ Additional Product Capabilities ✓ ✓ ✓ Captured Strategic and Financial Benefits from Past M&A 127 Equipment Finance Torana
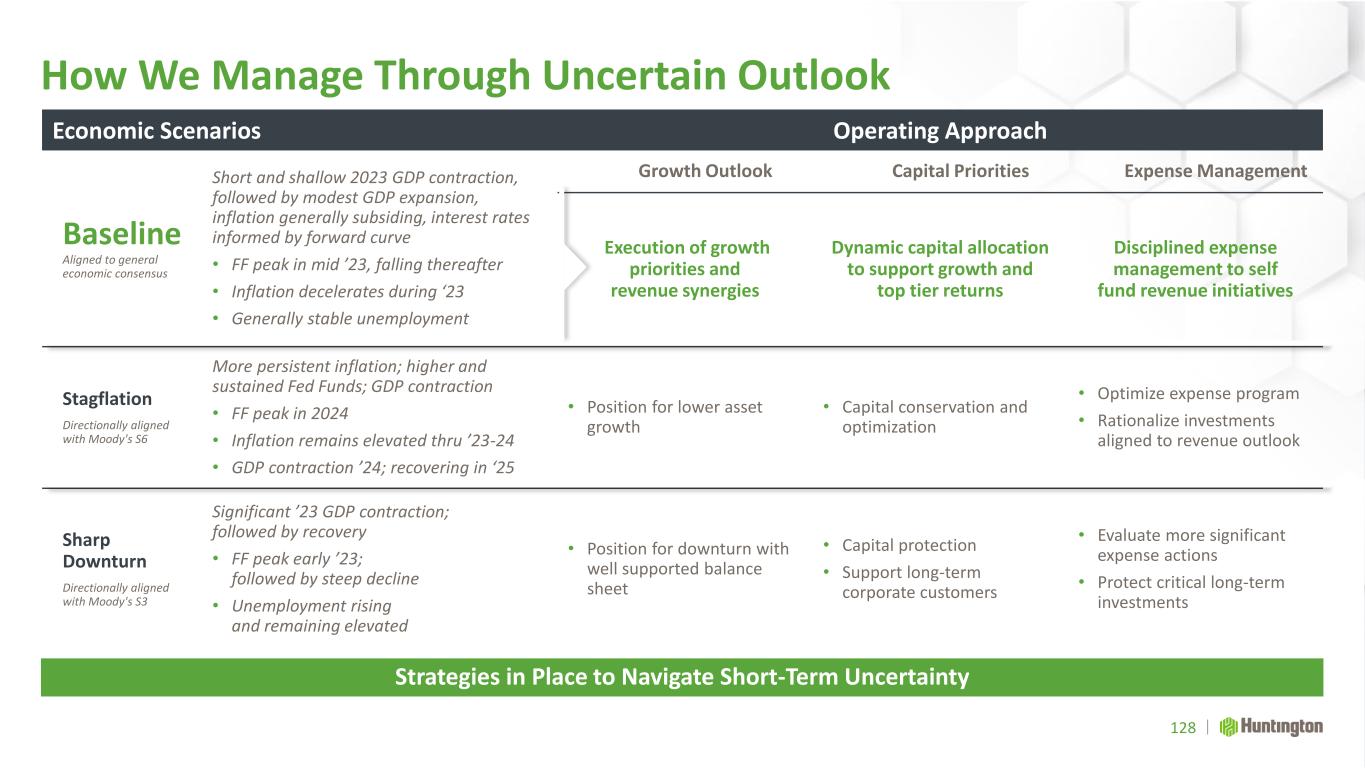
Economic Scenarios Operating Approach Baseline Aligned to general economic consensus Short and shallow 2023 GDP contraction, followed by modest GDP expansion, inflation generally subsiding, interest rates informed by forward curve • FF peak in mid ’23, falling thereafter • Inflation decelerates during ‘23 • Generally stable unemployment Growth Outlook Capital Priorities Expense Management Execution of growth priorities and revenue synergies Dynamic capital allocation to support growth and top tier returns Disciplined expense management to self fund revenue initiatives Stagflation Directionally aligned with Moody's S6 More persistent inflation; higher and sustained Fed Funds; GDP contraction • FF peak in 2024 • Inflation remains elevated thru ’23-24 • GDP contraction ’24; recovering in ‘25 • Position for lower asset growth • Capital conservation and optimization • Optimize expense program • Rationalize investments aligned to revenue outlook Sharp Downturn Directionally aligned with Moody's S3 Significant ’23 GDP contraction; followed by recovery • FF peak early ’23; followed by steep decline • Unemployment rising and remaining elevated • Position for downturn with well supported balance sheet • Capital protection • Support long-term corporate customers • Evaluate more significant expense actions • Protect critical long-term investments How We Manage Through Uncertain Outlook Strategies in Place to Navigate Short-Term Uncertainty 128
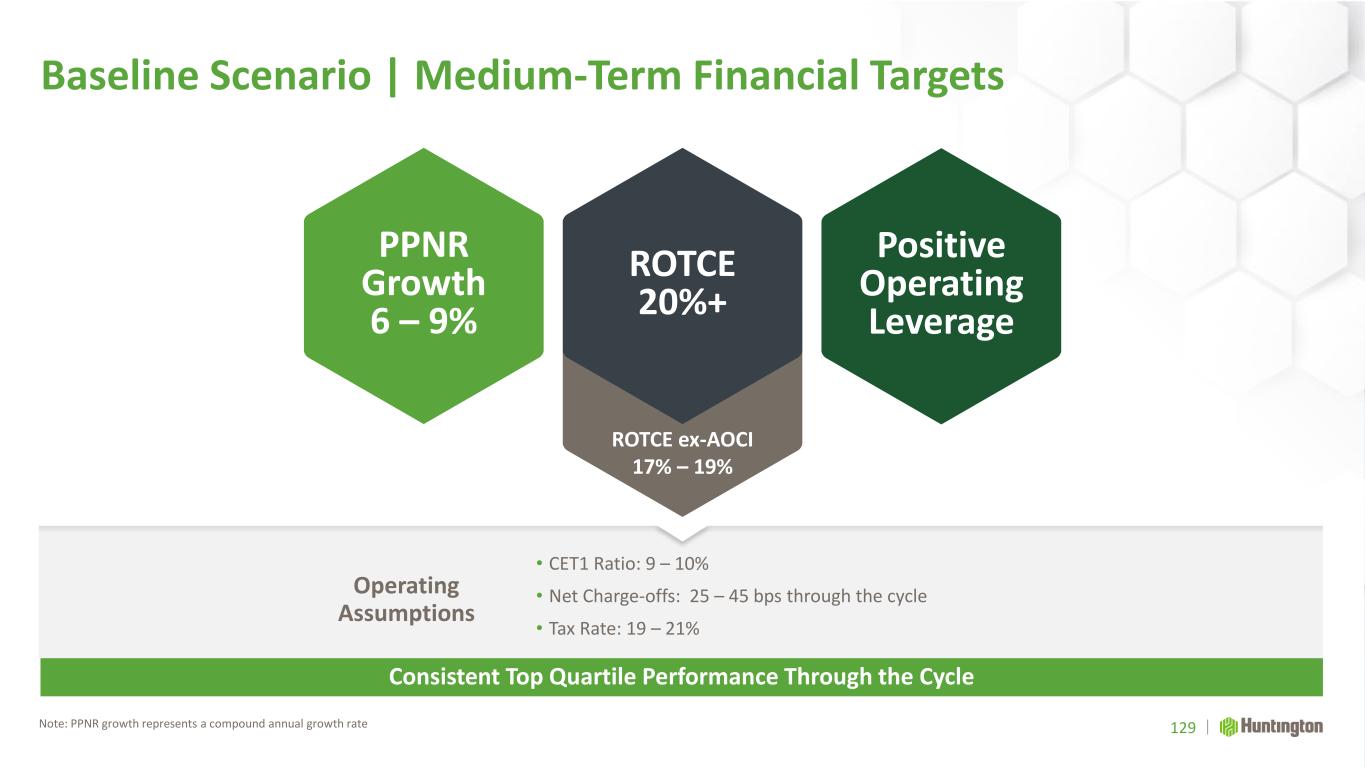
129 Consistent Top Quartile Performance Through the Cycle Operating Assumptions • CET1 Ratio: 9 – 10% • Net Charge-offs: 25 – 45 bps through the cycle • Tax Rate: 19 – 21% ROTCE ex-AOCI 17% – 19% PPNR Growth 6 – 9% Positive Operating Leverage ROTCE 20%+ Baseline Scenario | Medium-Term Financial Targets Note: PPNR growth represents a compound annual growth rate
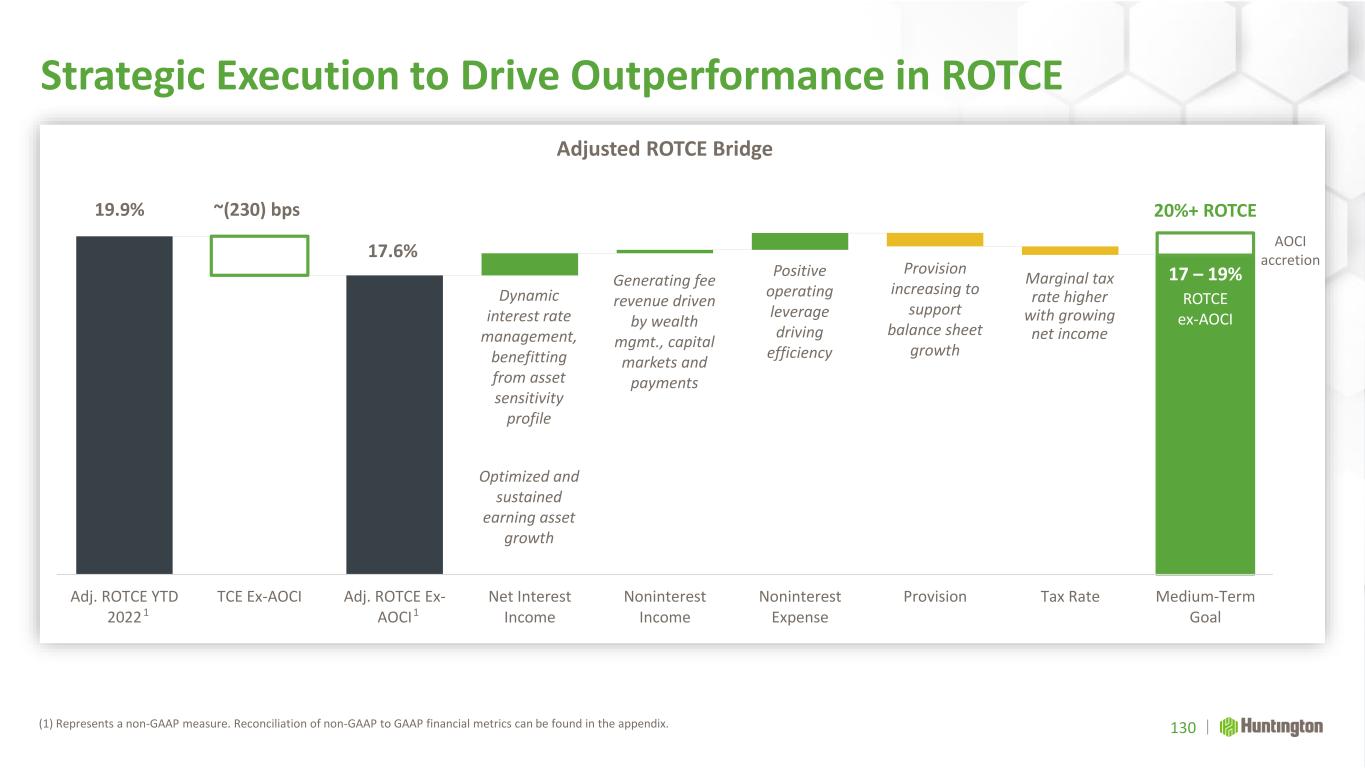
Strategic Execution to Drive Outperformance in ROTCE 130 Adj. ROTCE YTD 2022 TCE Ex-AOCI Adj. ROTCE Ex- AOCI Net Interest Income Noninterest Income Noninterest Expense Provision Tax Rate Medium-Term Goal Adjusted ROTCE Bridge Generating fee revenue driven by wealth mgmt., capital markets and payments Dynamic interest rate management, benefitting from asset sensitivity profile Optimized and sustained earning asset growth Positive operating leverage driving efficiency Provision increasing to support balance sheet growth Marginal tax rate higher with growing net income 20%+ ROTCE AOCI accretion 17 – 19% ROTCE ex-AOCI 17.6% 19.9% ~(230) bps (1) Represents a non-GAAP measure. Reconciliation of non-GAAP to GAAP financial metrics can be found in the appendix. 1 1
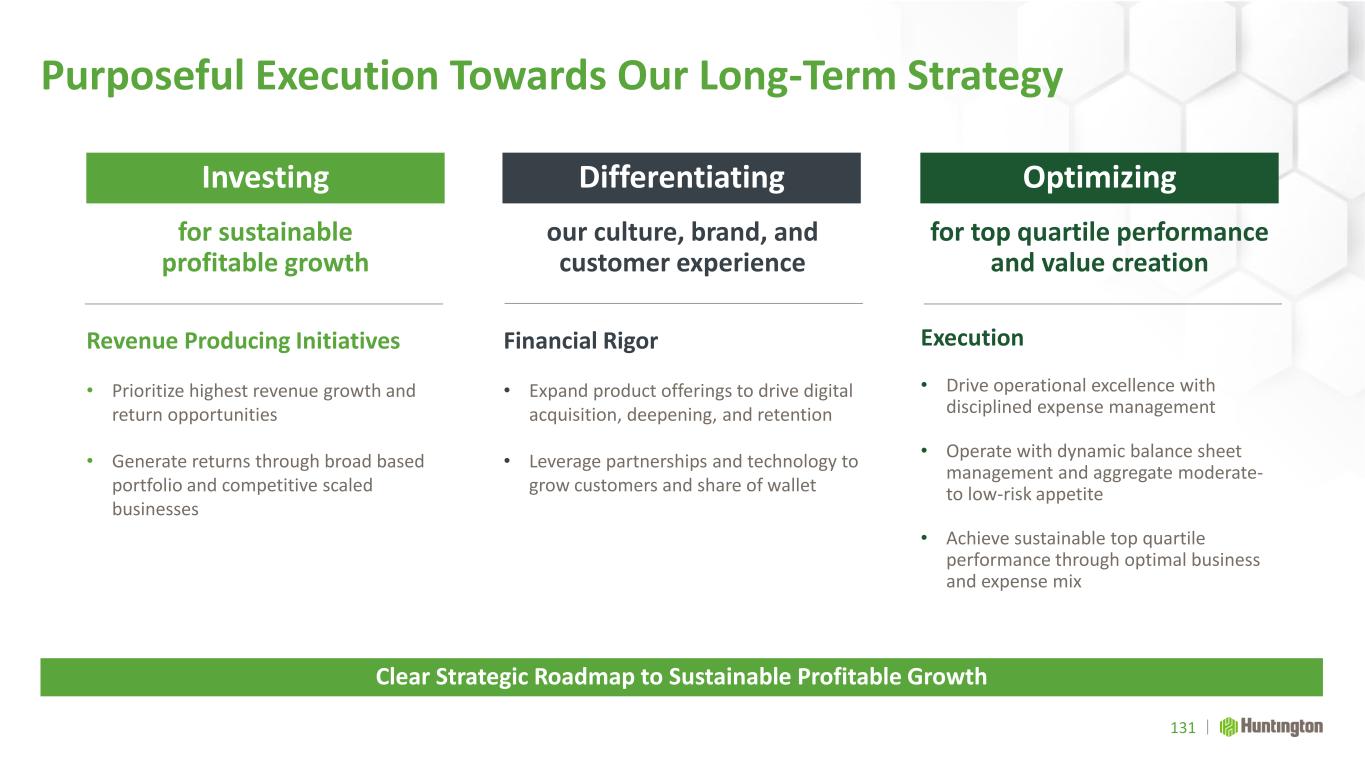
Purposeful Execution Towards Our Long-Term Strategy Execution • Drive operational excellence with disciplined expense management • Operate with dynamic balance sheet management and aggregate moderate- to low-risk appetite • Achieve sustainable top quartile performance through optimal business and expense mix 131 Clear Strategic Roadmap to Sustainable Profitable Growth Financial Rigor • Expand product offerings to drive digital acquisition, deepening, and retention • Leverage partnerships and technology to grow customers and share of wallet Revenue Producing Initiatives • Prioritize highest revenue growth and return opportunities • Generate returns through broad based portfolio and competitive scaled businesses Investing Optimizing Differentiating for sustainable profitable growth for top quartile performance and value creation our culture, brand, and customer experience
Closing Remarks Steve Steinour Chairman, President, and CEO
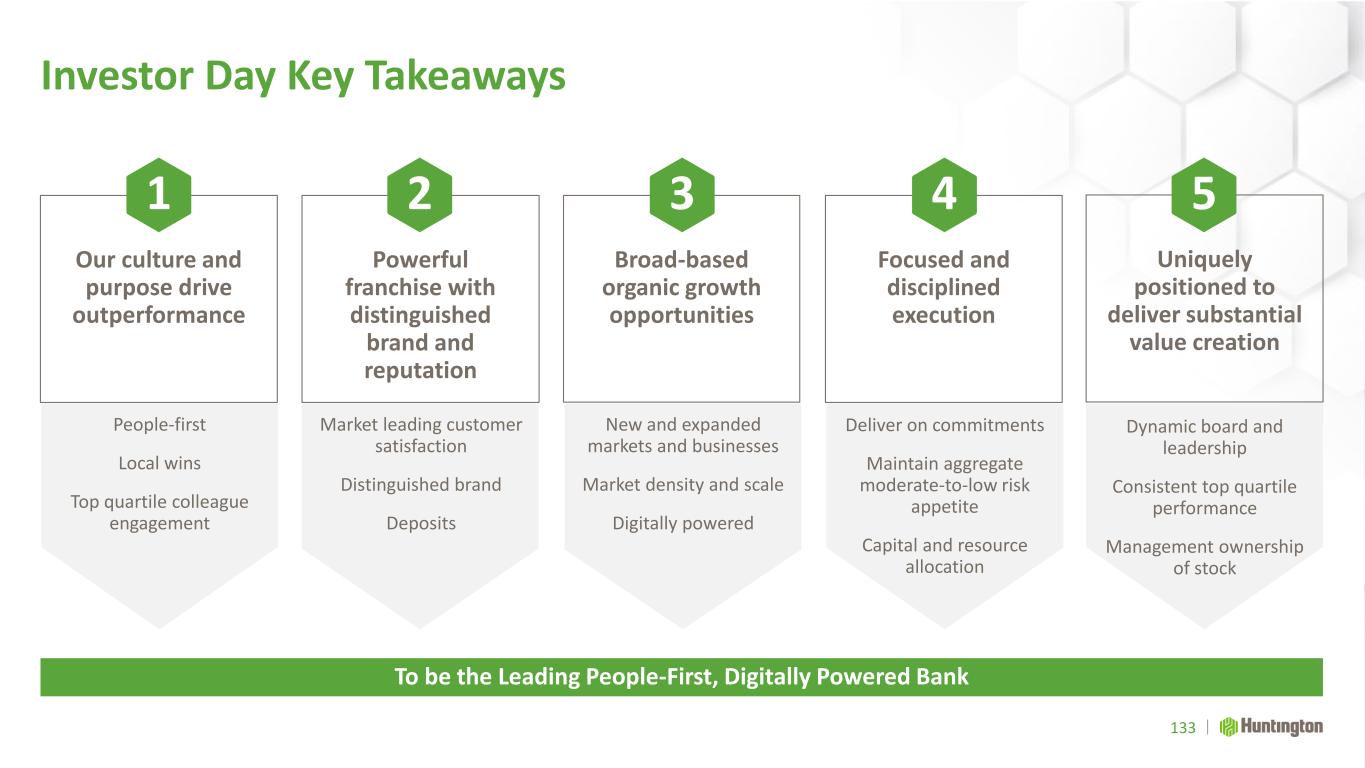
Investor Day Key Takeaways 133 To be the Leading People-First, Digitally Powered Bank Deliver on commitments Maintain aggregate moderate-to-low risk appetite Capital and resource allocation New and expanded markets and businesses Market density and scale Digitally powered Market leading customer satisfaction Distinguished brand Deposits People-first Local wins Top quartile colleague engagement Dynamic board and leadership Consistent top quartile performance Management ownership of stock Focused and disciplined execution Broad-based organic growth opportunities Powerful franchise with distinguished brand and reputation Our culture and purpose drive outperformance Uniquely positioned to deliver substantial value creation 1 2 3 4 5

Q&A

Appendix
Basis of Presentation Use of Non-GAAP Financial Measures This document contains GAAP financial measures and non-GAAP financial measures where management believes it to be helpful in understanding Huntington’s results of operations or financial position. Where non-GAAP financial measures are used, the comparable GAAP financial measure, as well as the reconciliation to the comparable GAAP financial measure, can be found in this document, conference call slides, or the Form 8-K related to this document, all of which can be found in the Investor Relations section of Huntington’s website, http://www.huntington.com. Annualized Data Certain returns, yields, performance ratios, or quarterly growth rates are presented on an “annualized” basis. This is done for analytical and decision-making purposes to better discern underlying performance trends when compared to full-year or year-over- year amounts. For example, loan and deposit growth rates, as well as net charge-off percentages, are most often expressed in terms of an annual rate like 8%. As such, a 2% growth rate for a quarter would represent an annualized 8% growth rate. Fully-Taxable Equivalent Interest Income and Net Interest Margin Income from tax-exempt earning assets is increased by an amount equivalent to the taxes that would have been paid if this income had been taxable at statutory rates. This adjustment puts all earning assets, most notably tax-exempt municipal securities and certain lease assets, on a common basis that facilitates comparison of results to results of competitors. Earnings per Share Equivalent Data Notable income or expense items may be expressed on a per common share basis. This is done for analytical and decision-making purposes to better discern underlying trends in total corporate earnings per share performance excluding the impact of such items. Investors may also find this information helpful in their evaluation of our financial performance against published earnings per share mean estimate amounts, which typically exclude the impact of Notable Items. Earnings per share equivalents are usually calculated by applying an effective tax rate to a pre-tax amount to derive an after-tax amount, which is divided by the average shares outstanding during the respective reporting period. Occasionally, when the item involves special tax treatment, the after-tax amount is disclosed separately, with this then being the amount used to calculate the earnings per share equivalent. 136
Basis of Presentation Rounding Please note that columns of data in this document may not add due to rounding. Notable Items From time to time, revenue, expenses, or taxes are impacted by items judged by management to be outside of ordinary banking activities and/or by items that, while they may be associated with ordinary banking activities, are so unusually large that their outsized impact is believed by management at that time to be infrequent or short term in nature. We refer to such items as “Notable Items.” Management believes it is useful to consider certain financial metrics with and without Notable Items, in order to enable a better understanding of company results, increase comparability of period-to-period results, and to evaluate and forecast those results. 137
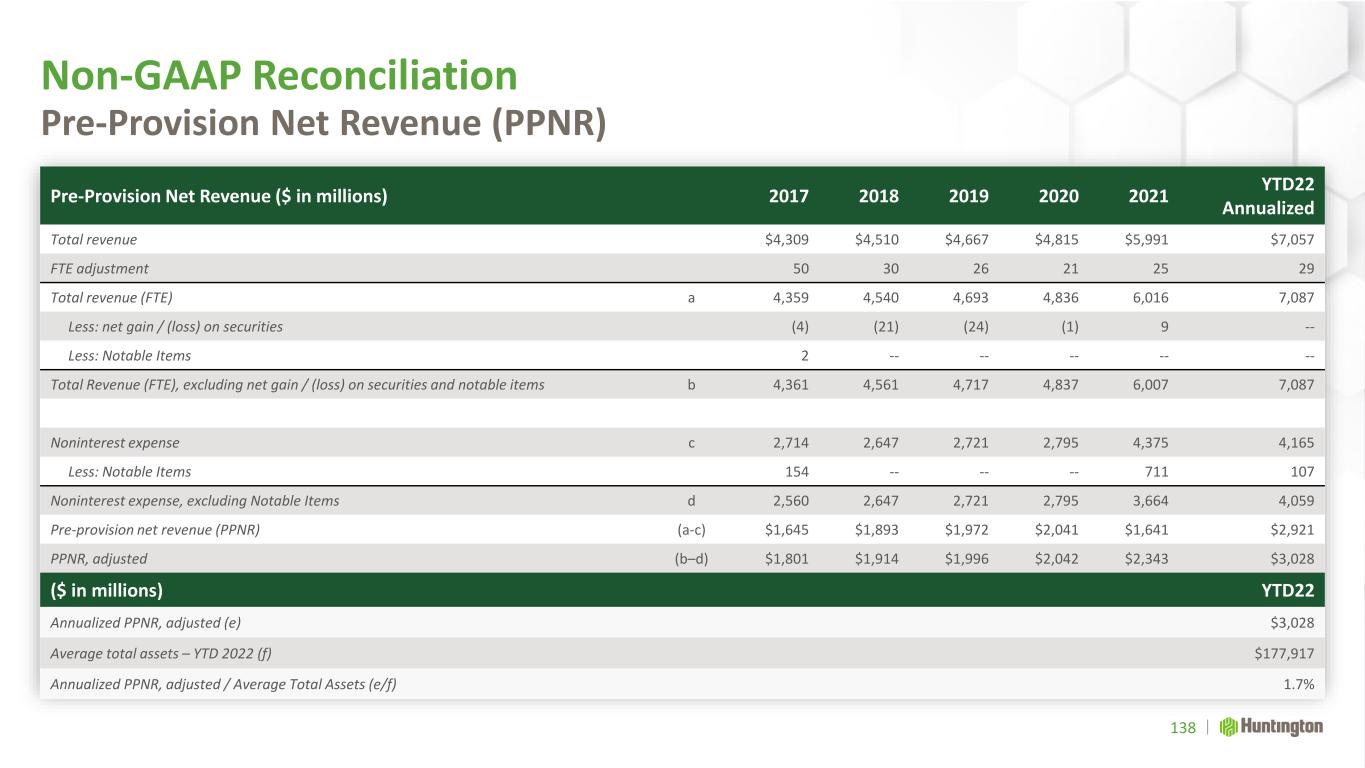
Non-GAAP Reconciliation 138 Pre-Provision Net Revenue (PPNR) Pre-Provision Net Revenue ($ in millions) 2017 2018 2019 2020 2021 YTD22 Annualized Total revenue $4,309 $4,510 $4,667 $4,815 $5,991 $7,057 FTE adjustment 50 30 26 21 25 29 Total revenue (FTE) a 4,359 4,540 4,693 4,836 6,016 7,087 Less: net gain / (loss) on securities (4) (21) (24) (1) 9 -- Less: Notable Items 2 -- -- -- -- -- Total Revenue (FTE), excluding net gain / (loss) on securities and notable items b 4,361 4,561 4,717 4,837 6,007 7,087 Noninterest expense c 2,714 2,647 2,721 2,795 4,375 4,165 Less: Notable Items 154 -- -- -- 711 107 Noninterest expense, excluding Notable Items d 2,560 2,647 2,721 2,795 3,664 4,059 Pre-provision net revenue (PPNR) (a-c) $1,645 $1,893 $1,972 $2,041 $1,641 $2,921 PPNR, adjusted (b–d) $1,801 $1,914 $1,996 $2,042 $2,343 $3,028 ($ in millions) YTD22 Annualized PPNR, adjusted (e) $3,028 Average total assets – YTD 2022 (f) $177,917 Annualized PPNR, adjusted / Average Total Assets (e/f) 1.7%
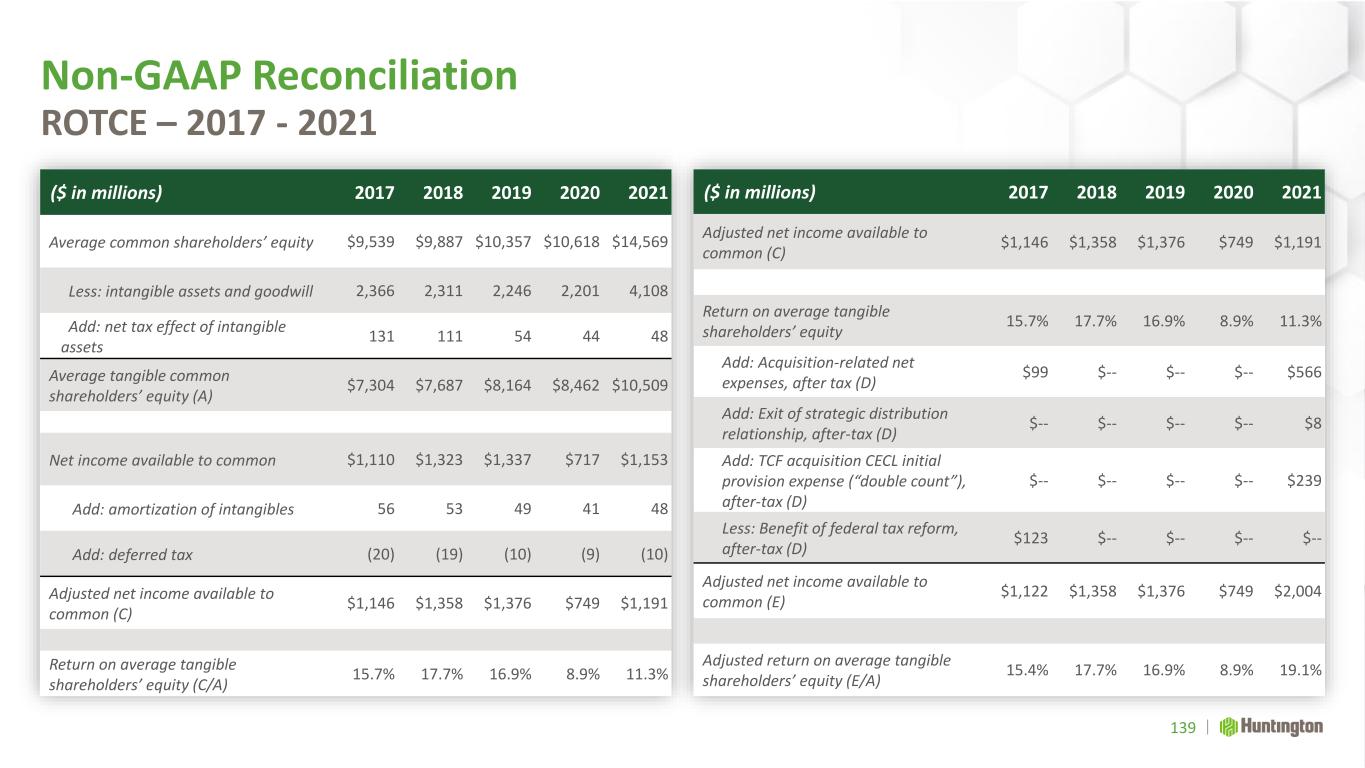
Non-GAAP Reconciliation 139 ROTCE – 2017 - 2021 ($ in millions) 2017 2018 2019 2020 2021 Average common shareholders’ equity $9,539 $9,887 $10,357 $10,618 $14,569 Less: intangible assets and goodwill 2,366 2,311 2,246 2,201 4,108 Add: net tax effect of intangible assets 131 111 54 44 48 Average tangible common shareholders’ equity (A) $7,304 $7,687 $8,164 $8,462 $10,509 Net income available to common $1,110 $1,323 $1,337 $717 $1,153 Add: amortization of intangibles 56 53 49 41 48 Add: deferred tax (20) (19) (10) (9) (10) Adjusted net income available to common (C) $1,146 $1,358 $1,376 $749 $1,191 Return on average tangible shareholders’ equity (C/A) 15.7% 17.7% 16.9% 8.9% 11.3% ($ in millions) 2017 2018 2019 2020 2021 Adjusted net income available to common (C) $1,146 $1,358 $1,376 $749 $1,191 Return on average tangible shareholders’ equity 15.7% 17.7% 16.9% 8.9% 11.3% Add: Acquisition-related net expenses, after tax (D) $99 $-- $-- $-- $566 Add: Exit of strategic distribution relationship, after-tax (D) $-- $-- $-- $-- $8 Add: TCF acquisition CECL initial provision expense (“double count”), after-tax (D) $-- $-- $-- $-- $239 Less: Benefit of federal tax reform, after-tax (D) $123 $-- $-- $-- $-- Adjusted net income available to common (E) $1,122 $1,358 $1,376 $749 $2,004 Adjusted return on average tangible shareholders’ equity (E/A) 15.4% 17.7% 16.9% 8.9% 19.1%
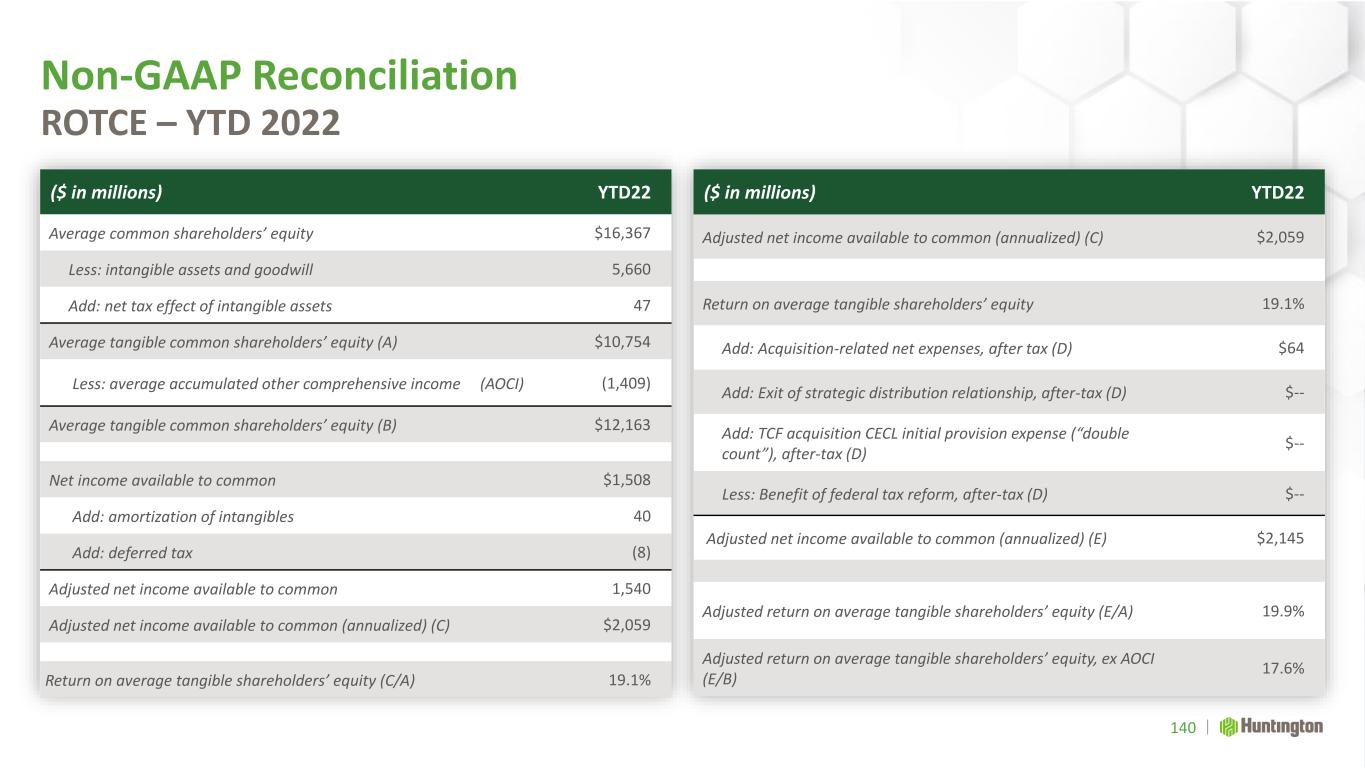
Non-GAAP Reconciliation 140 ROTCE – YTD 2022 ($ in millions) YTD22 Adjusted net income available to common (annualized) (C) $2,059 Return on average tangible shareholders’ equity 19.1% Add: Acquisition-related net expenses, after tax (D) $64 Add: Exit of strategic distribution relationship, after-tax (D) $-- Add: TCF acquisition CECL initial provision expense (“double count”), after-tax (D) $-- Less: Benefit of federal tax reform, after-tax (D) $-- Adjusted net income available to common (annualized) (E) $2,145 Adjusted return on average tangible shareholders’ equity (E/A) 19.9% Adjusted return on average tangible shareholders’ equity, ex AOCI (E/B) 17.6% ($ in millions) YTD22 Average common shareholders’ equity $16,367 Less: intangible assets and goodwill 5,660 Add: net tax effect of intangible assets 47 Average tangible common shareholders’ equity (A) $10,754 Less: average accumulated other comprehensive income (AOCI) (1,409) Average tangible common shareholders’ equity (B) $12,163 Net income available to common $1,508 Add: amortization of intangibles 40 Add: deferred tax (8) Adjusted net income available to common 1,540 Adjusted net income available to common (annualized) (C) $2,059 Return on average tangible shareholders’ equity (C/A) 19.1%
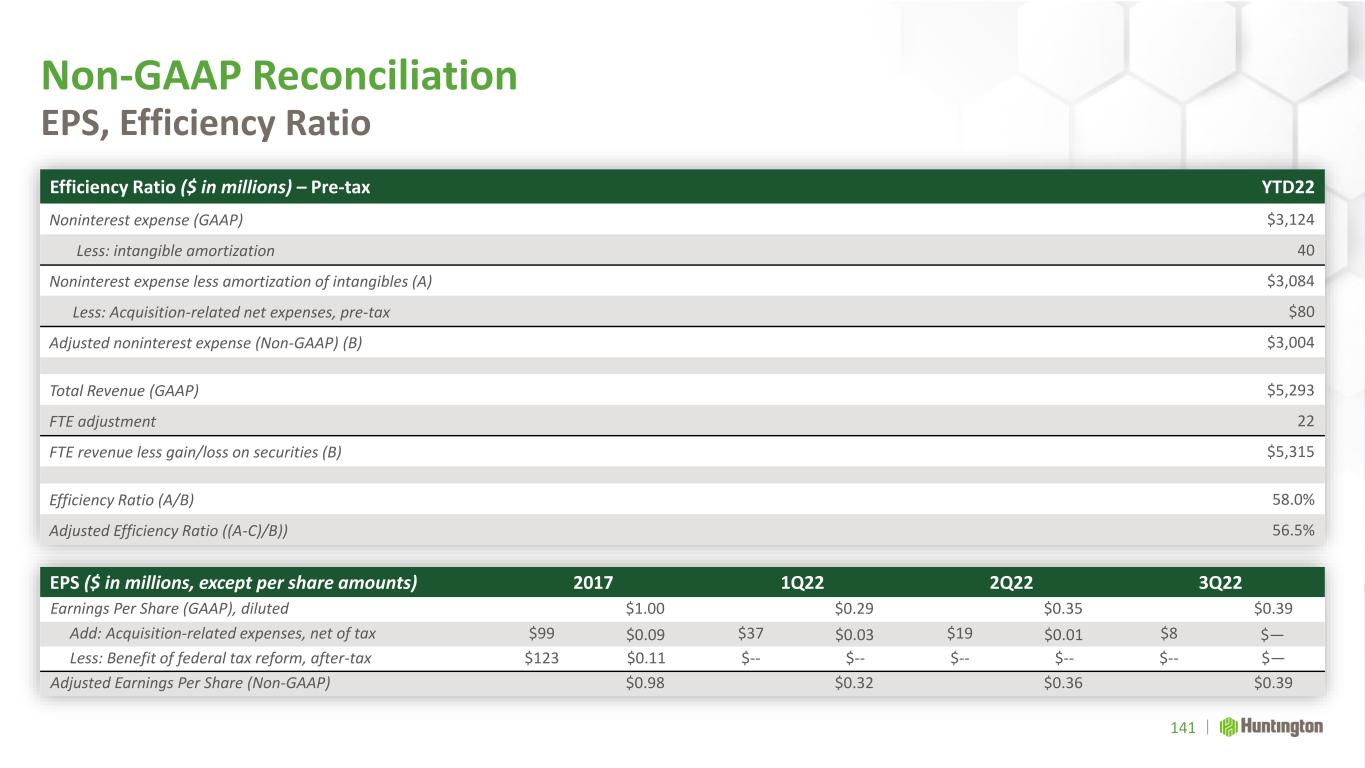
Non-GAAP Reconciliation 141 EPS, Efficiency Ratio EPS ($ in millions, except per share amounts) 2017 1Q22 2Q22 3Q22 Earnings Per Share (GAAP), diluted $1.00 $0.29 $0.35 $0.39 Add: Acquisition-related expenses, net of tax $99 $0.09 $37 $0.03 $19 $0.01 $8 $— Less: Benefit of federal tax reform, after-tax $123 $0.11 $-- $-- $-- $-- $-- $— Adjusted Earnings Per Share (Non-GAAP) $0.98 $0.32 $0.36 $0.39 Efficiency Ratio ($ in millions) – Pre-tax YTD22 Noninterest expense (GAAP) $3,124 Less: intangible amortization 40 Noninterest expense less amortization of intangibles (A) $3,084 Less: Acquisition-related net expenses, pre-tax $80 Adjusted noninterest expense (Non-GAAP) (B) $3,004 Total Revenue (GAAP) $5,293 FTE adjustment 22 FTE revenue less gain/loss on securities (B) $5,315 Efficiency Ratio (A/B) 58.0% Adjusted Efficiency Ratio ((A-C)/B)) 56.5%
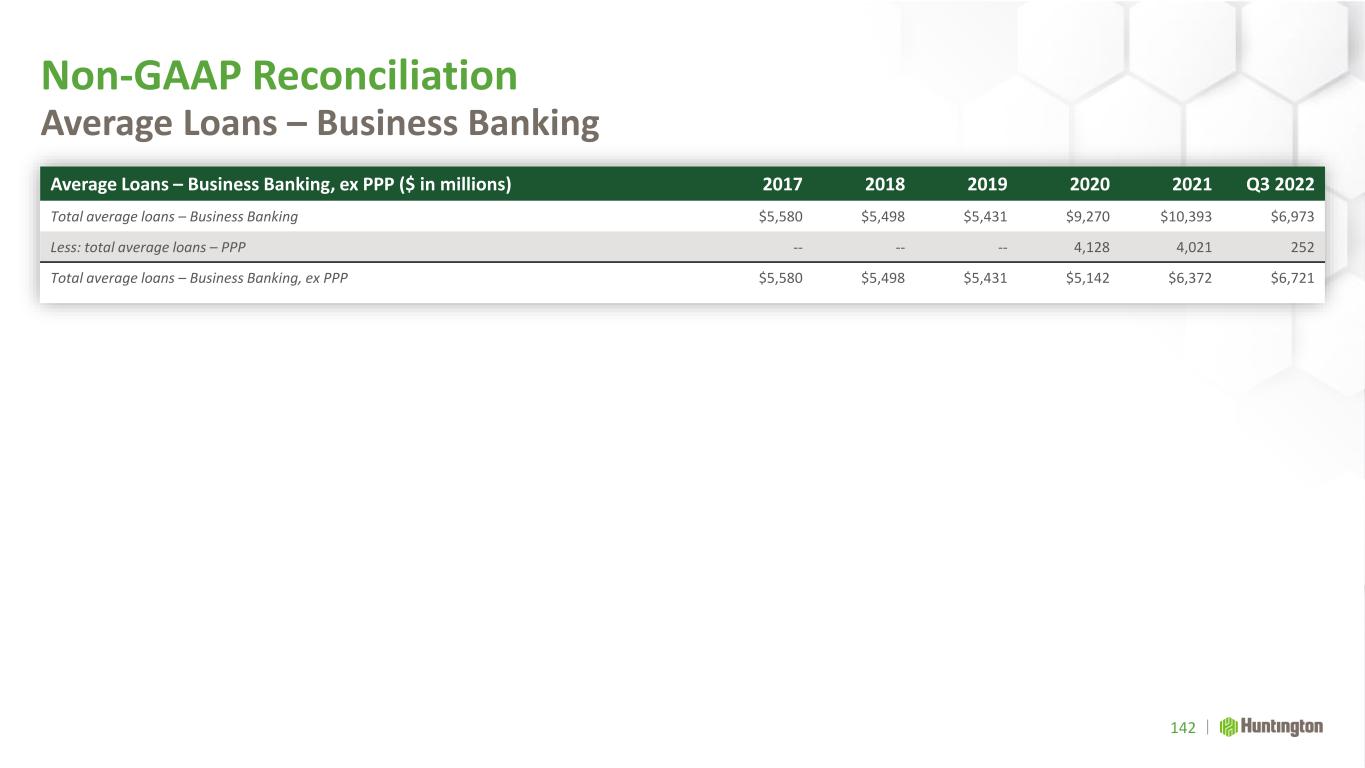
Non-GAAP Reconciliation 142 Average Loans – Business Banking Average Loans – Business Banking, ex PPP ($ in millions) 2017 2018 2019 2020 2021 Q3 2022 Total average loans – Business Banking $5,580 $5,498 $5,431 $9,270 $10,393 $6,973 Less: total average loans – PPP -- -- -- 4,128 4,021 252 Total average loans – Business Banking, ex PPP $5,580 $5,498 $5,431 $5,142 $6,372 $6,721