10-K: Annual report pursuant to Section 13 and 15(d)
Published on February 17, 2016
UNITED STATES
SECURITIES AND EXCHANGE COMMISSION
WASHINGTON, D.C. 20549
_______________________________________________
FORM 10-K
_______________________________________________
(Mark One)
x |
Annual Report Pursuant to Section 13 or 15(d) of the Securities Exchange Act of 1934 |
For the fiscal year ended December 31, 2015
or
¨ |
Transition Report Pursuant to Section 13 or 15(d) of the Securities Exchange Act of 1934 |
Commission File Number 1-34073
_______________________________________________
Huntington Bancshares Incorporated
(Exact name of registrant as specified in its charter)
_______________________________________________
Maryland |
31-0724920 |
|
|
(State or other jurisdiction of
incorporation or organization)
|
(I.R.S. Employer
Identification No.)
|
|
41 S. High Street, Columbus, Ohio |
43287 |
|
(Address of principal executive offices) |
(Zip Code) |
|
Registrant’s telephone number, including area code (614) 480-8300
Securities registered pursuant to Section 12(b) of the Act:
Title of class |
Name of exchange on which registered |
|
8.50% Series A non-voting, perpetual convertible preferred stock |
NASDAQ |
|
Common Stock—Par Value $0.01 per Share |
NASDAQ |
|
Securities registered pursuant to Section 12(g) of the Act:
Title of class
Floating Rate Series B Non-Cumulative Perpetual Preferred Stock
Depositary Shares (each representing a 1/40th interest in a share of Floating Rate Series B Non-Cumulative Perpetual Preferred Stock)
Indicate by check mark if the registrant is a well-known seasoned issuer, as defined in Rule 405 of the Securities Exchange Act. x Yes ¨ No
Indicate by check mark if the registrant is not required to file reports pursuant to Section 13 or 15(d) of the Act. ¨ Yes x No
Indicate by check mark whether the registrant (1) has filed all reports required to be filed by Section 13 or 15(d) of the Securities Exchange Act of 1934 during the preceding 12 months (or for such shorter period that the registrant was required to file such reports), and (2) has been subject to such filing requirements for the past 90 days. x Yes ¨ No
Indicate by check mark whether the registrant has submitted electronically and posted on its corporate Web site, if any, every Interactive Data File required to be submitted and posted pursuant to Rule 405 of Regulation S-T (§232.405 of this chapter) during the preceding 12 months (or for such shorter period that the registrant was required to submit and post such files). x Yes ¨ No
Indicate by check mark if disclosure of delinquent filers pursuant to Item 405 of Regulation S-K is not contained herein, and will not be contained, to the best of registrant’s knowledge, in definitive proxy or information statements incorporated by reference in Part III of this Form 10-K or any amendment to this Form 10-K. x
Indicate by check mark whether the registrant is a large accelerated filer, an accelerated filer, a non-accelerated filer, or a smaller reporting company. See definition of “large accelerated filer”, “accelerated filer”, and “smaller reporting company” in Rule 12b-2 of the Exchange Act. (Check one):
Large accelerated filer |
x |
Accelerated filer |
¨ |
Non-accelerated filer |
¨ (Do not check if a smaller reporting company)
|
Smaller reporting company |
¨ |
Indicate by check mark whether the registrant is a shell company (as defined in Rule 12b-2 of the Act) ¨ Yes x No
The aggregate market value of voting and non-voting common equity held by non-affiliates of the registrant as of June 30, 2015, determined by using a per share closing price of $11.31, as quoted by NASDAQ on that date, was $8,871,190,906. As of January 31, 2016, there were 795,025,143 shares of common stock with a par value of $0.01 outstanding.
Documents Incorporated By Reference
Part III of this Form 10-K incorporates by reference certain information from the registrant’s definitive Proxy Statement for the 2016 Annual Shareholders’ Meeting.
HUNTINGTON BANCSHARES INCORPORATED
INDEX
Part I. |
||
Part II. |
||
Part III. |
||
Part IV. |
||
Signatures |
||
Glossary of Acronyms and Terms
The following listing provides a comprehensive reference of common acronyms and terms used throughout the document:
ABL |
Asset Based Lending |
ABS |
Asset-Backed Securities |
ACL |
Allowance for Credit Losses |
AFCRE |
Automobile Finance and Commercial Real Estate |
AFS |
Available-for-Sale |
ALCO |
Asset-Liability Management Committee |
ALLL |
Allowance for Loan and Lease Losses |
ARM |
Adjustable Rate Mortgage |
ASC |
Accounting Standards Codification |
ASU |
Accounting Standards Update |
ATM |
Automated Teller Machine |
AULC |
Allowance for Unfunded Loan Commitments |
Basel III |
Refers to the final rule issued by the FRB and OCC and published in the Federal Register on October 11, 2013 |
BHC |
Bank Holding Companies |
C&I |
Commercial and Industrial |
Camco Financial |
Camco Financial Corp. |
CCAR |
Comprehensive Capital Analysis and Review |
CDO |
Collateralized Debt Obligations |
CDs |
Certificate of Deposit |
CET1 |
Common equity tier 1 on a transitional Basel III basis |
CFPB |
Bureau of Consumer Financial Protection |
CFTC |
Commodity Futures Trading Commission |
CMO |
Collateralized Mortgage Obligations |
CRE |
Commercial Real Estate |
Dodd-Frank Act |
Dodd-Frank Wall Street Reform and Consumer Protection Act |
DTA/DTL |
Deferred Tax Asset/Deferred Tax Liability |
E&P |
Exploration and Production |
EFT |
Electronic Fund Transfer |
EPS |
Earnings Per Share |
EVE |
Economic Value of Equity |
Fannie Mae |
(see FNMA) |
FASB |
Financial Accounting Standards Board |
FDIC |
Federal Deposit Insurance Corporation |
FDICIA |
Federal Deposit Insurance Corporation Improvement Act of 1991 |
FHA |
Federal Housing Administration |
FHLB |
Federal Home Loan Bank |
FHLMC |
Federal Home Loan Mortgage Corporation |
FICO |
Fair Isaac Corporation |
FNMA |
Federal National Mortgage Association |
FRB |
Federal Reserve Bank |
Freddie Mac |
(see FHLMC) |
FTE |
Fully-Taxable Equivalent |
FTP |
Funds Transfer Pricing |
GAAP |
Generally Accepted Accounting Principles in the United States of America |
GNMA |
Government National Mortgage Association, or Ginnie Mae |
HAA |
Huntington Asset Advisors, Inc. |
HAMP |
Home Affordable Modification Program |
4
HARP |
Home Affordable Refinance Program |
HASI |
Huntington Asset Services, Inc. |
HIP |
Huntington Investment and Tax Savings Plan |
HQLA |
High-Quality Liquid Assets |
HTM |
Held-to-Maturity |
IRS |
Internal Revenue Service |
LCR |
Liquidity Coverage Ratio |
LIBOR |
London Interbank Offered Rate |
LGD |
Loss-Given-Default |
LIHTC |
Low Income Housing Tax Credit |
LTV |
Loan to Value |
NAICS |
North American Industry Classification System |
Macquarie |
Macquarie Equipment Finance, Inc. (U.S. Operations) |
MBS |
Mortgage-Backed Securities |
MD&A |
Management’s Discussion and Analysis of Financial Condition and Results of Operations |
MSA |
Metropolitan Statistical Area |
MSR |
Mortgage Servicing Rights |
NALs |
Nonaccrual Loans |
NCO |
Net Charge-off |
NII |
Noninterest Income |
NIM |
Net Interest Margin |
NPAs |
Nonperforming Assets |
N.R. |
Not relevant. Denominator of calculation is a gain in the current period compared with a loss in the prior period, or vice-versa |
OCC |
Office of the Comptroller of the Currency |
OCI |
Other Comprehensive Income (Loss) |
OCR |
Optimal Customer Relationship |
OLEM |
Other Loans Especially Mentioned |
OREO |
Other Real Estate Owned |
OTTI |
Other-Than-Temporary Impairment |
PD |
Probability-Of-Default |
Plan |
Huntington Bancshares Retirement Plan |
Problem Loans |
Includes nonaccrual loans and leases (Table 11), accruing loans and leases past due 90 days or more (Table 12), troubled debt restructured loans (Table 13), and criticized commercial loans (credit quality indicators section of Footnote 3). |
RBHPCG |
Regional Banking and The Huntington Private Client Group |
REIT |
Real Estate Investment Trust |
ROC |
Risk Oversight Committee |
RWA |
Risk-Weighted Assets |
SAD |
Special Assets Division |
SBA |
Small Business Administration |
SEC |
Securities and Exchange Commission |
SERP |
Supplemental Executive Retirement Plan |
SRIP |
Supplemental Retirement Income Plan |
SSFA |
Simplified Supervisory Formula Approach |
TCE |
Tangible Common Equity |
TDR |
Troubled Debt Restructured loan |
U.S. Treasury |
U.S. Department of the Treasury |
UCS |
Uniform Classification System |
UDAP |
Unfair or Deceptive Acts or Practices |
Unified |
Unified Financial Securities, Inc. |
5
UPB |
Unpaid Principal Balance |
USDA |
U.S. Department of Agriculture |
VA |
U.S. Department of Veteran Affairs |
VIE |
Variable Interest Entity |
XBRL |
eXtensible Business Reporting Language |
6
Huntington Bancshares Incorporated
PART I
When we refer to “we”, “our”, and “us” in this report, we mean Huntington Bancshares Incorporated and our consolidated subsidiaries, unless the context indicates that we refer only to the parent company, Huntington Bancshares Incorporated. When we refer to the “Bank” in this report, we mean our only bank subsidiary, The Huntington National Bank, and its subsidiaries.
Item 1: Business
We are a multi-state diversified regional bank holding company organized under Maryland law in 1966 and headquartered in Columbus, Ohio. We have 12,243 average full-time equivalent employees. Through the Bank, we have 150 years of serving the financial needs of our customers. We provide full-service commercial, small business, consumer, and mortgage banking services, as well as automobile financing, equipment leasing, investment management, trust services, brokerage services, insurance programs, and other financial products and services. The Bank, organized in 1866, is our only bank subsidiary. At December 31, 2015, the Bank had 15 private client group offices and 762 branches as follows:
• 406 branches in Ohio |
• 45 branches in Indiana |
|||
• 222 branches in Michigan |
• 31 branches in West Virginia |
|||
• 48 branches in Pennsylvania |
• 10 branches in Kentucky |
|||
Select financial services and other activities are also conducted in various other states. International banking services are available through the headquarters office in Columbus, Ohio, and a limited purpose office located in the Cayman Islands. Our foreign banking activities, in total or with any individual country, are not significant.
Our business segments are based on our internally-aligned segment leadership structure, which is how we monitor results and assess performance. For each of our five business segments, we expect the combination of our business model and exceptional service to provide a competitive advantage that supports revenue and earnings growth. Our business model emphasizes the delivery of a complete set of banking products and services offered by larger banks, but distinguished by local delivery and customer service.
A key strategic emphasis has been for our business segments to operate in cooperation to provide products and services to our customers and to build stronger and more profitable relationships using our OCR sales and service process. The objectives of OCR are to:
1.Provide a consultative sales approach to provide solutions that are specific to each customer.
2.Leverage each business segment in terms of its products and expertise to benefit customers.
3.Target prospects who may want to have multiple products and services as part of their relationship with us.
Following is a description of our five business segments and a Treasury / Other function:
• |
Retail and Business Banking – The Retail and Business Banking segment provides a wide array of financial products and services to consumer and small business customers including but not limited to checking accounts, savings accounts, money market accounts, certificates of deposit, consumer loans, and small business loans. Other financial services available to consumer and small business customers include investments, insurance, interest rate risk protection, foreign exchange, and treasury management. Huntington serves customers primarily through our network of branches in Ohio, Michigan, Pennsylvania, Indiana, West Virginia, and Kentucky. In addition to our extensive branch network, customers can access Huntington through online banking, mobile banking, telephone banking, and ATMs.
|
Huntington has established a "Fair Play" banking philosophy; providing differentiated products and services, built on a strong foundation of customer advocacy. Our brand resonates with consumers and is earning us more new customers and deeper relationships with our current customers.
Business Banking is a dynamic part of our business and we are committed to being the bank of choice for small businesses in our markets. Business Banking is defined as serving companies with revenues up to $20 million and consists of approximately 165,000 businesses. Huntington continues to develop products and services that are designed specifically to meet the needs of small business and look for ways to help companies find solutions to their financing needs.
7
• |
Commercial Banking: Through a relationship banking model, this segment provides a wide array of products and services to the middle market, large corporate, and government public sector customers located primarily within our geographic footprint. The segment is divided into seven business units: middle market, large corporate, specialty banking, asset finance, capital markets, treasury management, and insurance.
|
Middle Market Banking primarily focuses on providing banking solutions to companies with annual revenues of $20 million to $500 million. Through a relationship management approach, various products, capabilities and solutions are seamlessly delivered in a client centric way.
Corporate Banking works with larger, often more complex companies with revenues greater than $500 million. These entities, many of which are publicly traded, require a different and customized approach to their banking needs.
Specialty Banking offers tailored products and services to select industries that have a foothold in the Midwest. Each banking team is comprised of industry experts with a dynamic understanding of the market and industry. Many of these industries are experiencing tremendous change, which creates opportunities for Huntington to leverage our expertise and help clients navigate, adapt, and succeed.
Asset Finance business is a combination of our Equipment Finance, Public Capital, Asset Based Lending, Technology and Healthcare Equipment Leasing, and Lender Finance divisions that focus on providing financing solutions against these respective asset classes.
Capital Markets has two distinct product capabilities: corporate risk management services and institutional sales, trading, and underwriting. The Capital Markets Group offers a full suite of risk management tools including commodities, foreign exchange, and interest rate hedging services. The Institutional Sales, Trading & Underwriting team provides access to capital and investment solutions for both municipal and corporate institutions.
Treasury Management teams help businesses manage their working capital programs and reduce expenses. Our liquidity solutions help customers save and invest wisely, while our payables and receivables capabilities help them manage purchases and the receipt of payments for goods and services. All of this is provided while helping customers take a sophisticated approach to managing their overhead, inventory, equipment, and labor.
Insurance brokerage business specializes in commercial property and casualty, employee benefits, personal lines, life and disability and specialty lines of insurance. The group also provides brokerage and agency services for residential and commercial title insurance and excess and surplus product lines of insurance. As an agent and broker, this business does not assume underwriting risks but alternatively provides our customers with quality, noninvestment insurance contracts.
• |
Automobile Finance and Commercial Real Estate: This segment provides lending and other banking products and services to customers outside of our traditional retail and commercial banking segments. Our products and services include providing financing for the purchase of vehicles by customers at franchised automotive dealerships, financing the acquisition of new and used vehicle inventory of franchised automotive dealerships, and financing for land, buildings, and other commercial real estate owned or constructed by real estate developers, automobile dealerships, or other customers with real estate project financing needs. Products and services are delivered through highly specialized relationship-focused bankers and product partners. Huntington creates well-defined relationship plans which identify needs where solutions are developed and customer commitments are obtained.
|
The Automotive Finance team services automobile dealerships, its owners, and consumers buying automobiles through these franchised dealerships. Huntington has provided new and used automobile financing and dealer services throughout the Midwest since the early 1950s. This consistency in the market and our focus on working with strong dealerships has allowed us to expand into selected markets outside of the Midwest and to actively deepen relationships while building a strong reputation.
The Commercial Real Estate team serves real estate developers, REITs, and other customers with lending needs that are secured by commercial properties. Most of these customers are located within our footprint.
Within Commercial Real Estate, Huntington Community Development focuses on improving the quality of life for our communities and the residents of low-to moderate-income neighborhoods by developing and delivering innovative products and services to support affordable housing and neighborhood stabilization.
• |
Regional Banking and The Huntington Private Client Group: Regional Banking and The Huntington Private Client Group is well positioned competitively as we have closely aligned with our eleven regional banking markets. A fundamental point of differentiation is our commitment to be actively engaged within our local markets - building
|
8
connections with community and business leaders and offering a uniquely personal experience delivered by colleagues working within those markets.
The Huntington Private Client Group is organized into units consisting of The Huntington Private Bank, The Huntington Trust, and The Huntington Investment Company. Our private banking, trust, and investment functions focus their efforts in our Midwest footprint and Florida.
The Huntington Private Bank provides high net-worth customers with deposit, lending (including specialized lending options), and banking services.
The Huntington Trust also serves high net-worth customers and delivers wealth management and legacy planning through investment and portfolio management, fiduciary administration, trust services, and trust operations. This group also provides retirement plan services and corporate trust to businesses and municipalities.
The Huntington Investment Company, a dually registered broker-dealer and registered investment adviser, employs representatives who work with our Retail and Private Bank to provide investment solutions for our customers. This team offers a wide range of products and services, including brokerage, annuities, advisory, and other investment products.
Huntington sold HAA, HASI, and Unified in the 2015 fourth quarter.
• |
Home Lending: Home Lending originates and services consumer loans and mortgages for customers who are generally located in our primary banking markets. Consumer and mortgage lending products are primarily distributed through the Retail and Business Banking segment, as well as through commissioned loan originators. Home Lending earns interest on loans held in the warehouse and portfolio, earns fee income from the origination and servicing of mortgage loans, and recognizes gains or losses from the sale of mortgage loans. Home Lending supports the origination and servicing of mortgage loans across all segments.
|
The Treasury / Other function includes technology and operations, other unallocated assets, liabilities, revenue, and expense.
The financial results for each of these business segments are included in Note 24 of Notes to Consolidated Financial Statements and are discussed in the Business Segment Discussion of our MD&A.
Pending Acquisition of FirstMerit Corporation
On January 26, 2016, Huntington announced the signing of a definitive merger agreement under which Ohio-based FirstMerit Corporation, the parent company of FirstMerit Bank, will merge into Huntington in a stock and cash transaction expected to be valued at approximately $3.4 billion based on the closing stock price on the day preceding the announcement. FirstMerit Corporation is a diversified financial services company headquartered in Akron, Ohio, which reported assets of approximately $25.5 billion based on their December 31, 2015 unaudited balance sheet, and 366 banking offices and 400 ATM locations in Ohio, Michigan, Wisconsin, Illinois, and Pennsylvania. First Merit Corporation provides a complete range of banking and other financial services to consumers and businesses through its core operations. Principal affiliates include: FirstMerit Bank, N.A. and First Merit Mortgage Corporation.
Under the terms of the agreement, shareholders of FirstMerit Corporation will receive 1.72 shares of Huntington common stock and $5.00 in cash for each share of FirstMerit Corporation common stock. The transaction is expected to be completed in the 2016 third quarter, subject to the satisfaction of customary closing conditions, including regulatory approvals and the approval of the shareholders of Huntington and FirstMerit Corporation.
Competition
We compete with other banks and financial services companies such as savings and loans, credit unions, and finance and trust companies, as well as mortgage banking companies, automobile and equipment financing companies (including captive automobile finance companies), insurance companies, mutual funds, investment advisors, and brokerage firms, both within and outside of our primary market areas. Internet companies are also providing nontraditional, but increasingly strong, competition for our borrowers, depositors, and other customers.
We compete for loans primarily on the basis of a combination of value and service by building customer relationships as a result of addressing our customers’ entire suite of banking needs, demonstrating expertise, and providing convenience to our customers. We also consider the competitive pricing pressures in each of our markets.
We compete for deposits similarly on a basis of a combination of value and service and by providing convenience through a banking network of branches and ATMs within our markets and our website at www.huntington.com. We have also instituted
9
customer friendly practices, such as our 24-Hour Grace® account feature, which gives customers an additional business day to cover overdrafts to their consumer account without being charged overdraft fees.
The table below shows our competitive ranking and market share based on deposits of FDIC-insured institutions as of June 30, 2015, in the top 10 metropolitan statistical areas (MSA) in which we compete:
MSA |
Rank |
Deposits (in
millions)
|
Market Share |
||||||
Columbus, OH |
1 |
$ |
17,450 |
30 |
% |
||||
Detroit, MI |
7 |
5,163 |
4 |
||||||
Cleveland, OH |
5 |
4,836 |
8 |
||||||
Indianapolis, IN |
4 |
3,062 |
7 |
||||||
Pittsburgh, PA |
8 |
2,782 |
2 |
||||||
Cincinnati, OH |
4 |
2,577 |
3 |
||||||
Toledo, OH |
1 |
2,354 |
24 |
||||||
Grand Rapids, MI |
2 |
2,237 |
11 |
||||||
Youngstown, OH |
1 |
2,019 |
22 |
||||||
Canton, OH |
1 |
1,708 |
26 |
||||||
Source: FDIC.gov, based on June 30, 2015 survey. |
|||||||||
Many of our nonfinancial institution competitors have fewer regulatory constraints, broader geographic service areas, greater capital, and, in some cases, lower cost structures. In addition, competition for quality customers has intensified as a result of changes in regulation, advances in technology and product delivery systems, consolidation among financial service providers, bank failures, and the conversion of certain former investment banks to bank holding companies.
Financial Technology, or FinTech, startups are emerging in key areas of banking. In response, we are monitoring activity in marketplace lending along with businesses engaged in money transfer, investment advice, and money management tools. Our strategy involves assessing the marketplace, determining our near term plan, while developing a longer term approach to effectively service our existing customers and attract new customers. This includes evaluating which products we develop in-house, as well as evaluating partnership options where applicable.
Regulatory Matters
We are subject to regulation by the SEC, the Federal Reserve, the OCC, the CFPB, and other federal and state regulators.
Because we are a public company, we are subject to regulation by the SEC. The SEC has established five categories of issuers for the purpose of filing periodic and annual reports. Under these regulations, we are considered to be a large accelerated filer and, as such, must comply with SEC accelerated reporting requirements.
The banking industry is highly regulated. We and the Bank are subject to extensive federal and state laws and regulations that govern many aspects of our operations and limit the businesses in which we may engage. These laws and regulations may change from time to time and are primarily intended for the protection of consumers, depositors, the Deposit Insurance Fund, the stability of the financial system in the United States, and the health of the national economy, and are not designed primarily to benefit or protect our shareholders or creditors.
The following discussion is not intended to be a complete list of the activities regulated by the banking laws and regulations applicable to us or our Bank or the impact of such laws and regulations on us or the Bank. Changes in applicable laws or regulations, and in their interpretation and application by the bank regulatory agencies, cannot be predicted and may have a material effect on our business and results.
We are registered as a bank holding company with the Federal Reserve and qualify for and have elected to become a financial holding company under the Gramm-Leach-Bliley Act of 1999 ("GLBA"). We are subject to examination, regulation, and supervision by the Federal Reserve pursuant to the Bank Holding Company Act. We are required to file reports and other information regarding our business operations and the business operations of our subsidiaries with the Federal Reserve.
The Federal Reserve maintains a bank holding company rating system that emphasizes risk management, introduces a framework for analyzing and rating financial factors, and provides a framework for assessing and rating the potential impact of
10
non-depository entities of a holding company on its subsidiary depository institution(s). The ratings assigned to us, like those assigned to other financial institutions, are confidential and may not be disclosed, except to the extent required by law.
Under the Dodd-Frank Act, because we are a bank holding company with consolidated assets greater than $50 billion, we are subject to certain enhanced prudential standards. As a result, we expect to be subject to more stringent standards and requirements than those applicable to smaller institutions, including with respect to capital requirements, leverage limits, and stress testing. The Federal Reserve has issued supervisory guidance which sets forth an updated framework for the consolidated supervision of large financial institutions, including bank holding companies with consolidated assets of $50 billion or more. The objectives of the framework are to enhance the resilience of a firm, lower the probability of its failure, and reduce the impact on the financial system in the event of an institution’s failure. With regard to resiliency, each firm is expected to ensure that the consolidated organization and its core business lines can survive under a broad range of internal or external stresses. This requires financial resilience by maintaining sufficient capital and liquidity, and operational resilience by maintaining effective corporate governance, risk management, and recovery planning. With respect to lowering the probability of failure, each firm is expected to ensure the sustainability of its critical operations and banking offices under a broad range of internal or external stresses. This requires, among other things, that we have robust, forward-looking capital-planning processes that account for our unique risks.
The Bank, which is chartered by the OCC, is a national bank and our only bank subsidiary. It is subject to comprehensive examination, regulation and supervision primarily by the OCC and, with respect to Federal consumer protection laws, by the CFPB, which was established by the Dodd-Frank Act. In addition, as a member of the Federal Reserve System, the Bank is subject to certain rules and regulations of the Federal Reserve. As a FDIC member, the Bank is subject to deposit insurance assessments payable to the Deposit Insurance Fund and various FDIC requirements. The National Bank Act and the OCC regulations primarily govern the Bank’s permissible activities, capital requirements, branching, dividend limitations, investments, loans, and other matters. Our nonbank subsidiaries are also subject to examination and supervision by the Federal Reserve or, in the case of nonbank subsidiaries of the Bank, by the OCC. All subsidiaries are subject to examination and supervision by the CFPB to the extent they offer any consumer financial products or services. Our subsidiaries may be subject to examination by other federal and state regulators, including, in the case of certain securities and investment management activities, regulation by the SEC and the Financial Industry Regulatory Authority.
In September 2014, the OCC published final guidelines to strengthen the governance and risk management practices of certain large financial institutions, including national banks with $50 billion or more in average total consolidated assets, such as the Bank. The guidelines became effective November 10, 2014, and require covered banks to establish and adhere to a written governance framework in order to manage and control their risk-taking activities. In addition, the guidelines provide standards for the institutions’ boards of directors to oversee the risk governance framework. Given its size and the phased implementation schedule, the Bank is subject to these heightened standards effective May 2016. As discussed in Item 1A: Risk Factors, the Bank currently has a written governance framework and associated controls.
Legislative and regulatory reforms continue to have significant impacts throughout the financial services industry.
The Dodd-Frank Act, enacted in 2010, is complex and broad in scope and several of its provisions are still being implemented. The Dodd-Frank Act established the CFPB, which has extensive regulatory and enforcement powers over consumer financial products and services, and the Financial Stability Oversight Council, which has oversight authority for monitoring and regulating systemic risk. In addition, the Dodd-Frank Act altered the authority and duties of the federal banking and securities regulatory agencies, implemented certain corporate governance requirements for all public companies including financial institutions with regard to executive compensation, proxy access by shareholders, and certain whistleblower provisions, and restricted certain proprietary trading, and hedge fund and private equity activities of banks and their affiliates. The Dodd-Frank Act also required the issuance of numerous implementing regulations, many of which have not yet been issued. The regulations will continue to take effect over several more years, continuing to make it difficult to anticipate the overall impact to us, our customers, or the financial industry in general.
On October 3, 2015, the CFPB’s final rules on integrated mortgage disclosures under the Truth in Lending Act and the Real Estate Settlement Procedures Act became effective. On January 1, 2016, most requirements of the OCC’s Final Rule in Loans in Areas Having Special Flood Hazards (the Flood Final Rule) became effective, including the requirement that flood insurance premiums and fees for most mortgage loans be escrowed subject to certain exceptions. The Flood Final Rule also incorporated other existing flood insurance requirements and exceptions (e.g. the exemption from flood insurance requirements for non-residential detached structures - a discretionary item) with those portions of the Flood Final Rule becoming effective on October 1, 2015. We continue to monitor, evaluate, and implement these new regulations.
Throughout 2015, the CFPB continued its focus on fair lending practices of indirect automobile lenders. This focus led to some lenders to enter into consent orders with the CFPB and Department of Justice. Indirect automobile lenders have also received continued pressure from the CFPB to limit or eliminate discretionary pricing by dealers. Finally, the CFPB has implemented its
11
larger participant rule for indirect automobile lending which brings larger non-bank indirect automobile lenders under CFPB supervision.
Banking regulatory agencies have increasingly used their authority under Section 5 of the Federal Trade Commission Act to take supervisory or enforcement action with respect to unfair or deceptive acts or practices (UDAP) by banks under standards developed many years ago by the Federal Trade Commission in order to address practices that may not necessarily fall within the scope of a specific banking or consumer finance law. The Dodd-Frank Act also gave to the CFPB similar authority to take action in connection with unfair, deceptive, or abusive acts or practices (UDAAP) by entities subject to CFPB supervisory or enforcement authority. Banks face considerable uncertainty as to the regulatory interpretation of “abusive” practices.
Financial services companies face increased regulation and exposure under the new Military Lending Act (MLA) final rules issued by the Department of Defense that become effective for new loans entered into on and after October 3, 2016. The new rules dramatically expand the scope of coverage of the MLA and compliance with the new rules will affect operations of more financial services companies than under the previous rules.
On July 10, 2015, the Federal Communication Commission, interpreting the Telephone Consumer Protection Act, issued an Omnibus Declaratory Ruling and Order that, among other things, restricted the use of automated telephone dialing machines. The ruling effectively increases the cost of collecting debts as well as increases the litigation risk associated with the use of auto-dialers.
Large bank holding companies and national banks are required to submit annual capital plans to the Federal Reserve and OCC, respectively, and conduct stress tests.
The Federal Reserve’s Regulation Y requires large bank holding companies to submit capital plans to the Federal Reserve on an annual basis and requires such bank holding companies to obtain approval from the Federal Reserve under certain circumstances before making a capital distribution. This rule applies to us and all other bank holding companies with $50 billion or more of total consolidated assets.
A large bank holding company’s capital plan must include an assessment of the expected uses and sources of capital over at least the next nine quarters, a description of all planned capital actions over the planning horizon, a detailed description of the entity’s process for assessing capital adequacy, the entity’s capital policy, and a discussion of any expected changes to the bank holding company’s business plan that are likely to have a material impact on the firm’s capital adequacy or liquidity. The planning horizon for the most recently completed capital planning and stress testing cycle encompasses the 2014 fourth quarter through the 2016 fourth quarter as was submitted in our capital plan in January 2015. Rules to implement the Basel III capital reforms in the United States were finalized in July 2013 and are being phased-in by us beginning with 1Q 2015 results under the standardized approach. Capital adequacy at large banking organizations, including us, is assessed against a minimum 4.5% CET1 ratio and a 4% tier 1 leverage ratio as determined by the Federal Reserve.
Capital plans for 2016 are required to be submitted to the Federal Reserve by April 5, 2016, and the Federal Reserve will either object to the capital plan and/or planned capital actions, or provide a notice of non-objection, no later than June 30, 2016. We intend to submit our capital plan to the Federal Reserve on or before April 5, 2016. There can be no assurance that the Federal Reserve will respond favorably to our capital plan, capital actions or stress test and the Federal Reserve, OCC, or other regulatory capital requirements may limit or otherwise restrict how we utilize our capital, including common stock dividends and stock repurchases.
In addition to the CCAR submission, section 165 of the Dodd-Frank Act requires that national banks, like The Huntington National Bank, conduct annual stress tests for submission beginning in January 2015. The results of the stress tests will provide the OCC with forward-looking information that will be used in bank supervision and will assist the agency in assessing a company’s risk profile and capital adequacy. We submitted our stress test results to the OCC in January 2015. We intend to submit our 2016 capital plan to the OCC on or before April 5, 2016.
The regulatory capital rules indicate that common stockholders’ equity should be the dominant element within tier 1 capital and that banking organizations should avoid overreliance on non-common equity elements. Under the Dodd-Frank Act, the ratio of common equity tier 1 to risk-weighted assets became significant as a measurement of the predominance of common equity in tier 1 capital and an indication of the quality of capital in accordance with their requirements.
Conforming Covered Activities to implement the Volcker Rule.
On December 10, 2013, the Federal Reserve, the OCC, the FDIC, the CFTC and the SEC issued final rules to implement the Volcker Rule contained in section 619 of the Dodd-Frank Act, and established July 21, 2015, as the end of the conformance period. Section 619 generally prohibits an insured depository institution, any company that controls an insured depository institution (such
12
as a bank holding company), and any of their subsidiaries and affiliates (collectively, "banking entities") from engaging in short-term proprietary trading and from acquiring or retaining ownership interests in, sponsoring, or having certain relationships with a hedge fund or private equity fund ("covered funds"). These prohibitions are subject to a number of statutory exemptions, restrictions, and definitions. On December 18, 2014, the Federal Reserve announced it acted under Section 619 to give banking entities until July 21, 2016, to conform investments in and relationships with covered funds and foreign funds that were in place prior to December 31, 2013 (“legacy covered funds”). The Federal Reserve also announced its intention to act this year to grant banking entities an additional one-year extension of the conformance period until July 21, 2017, to conform ownership interests in and relationships with legacy covered funds. The Bank continues its “good faith” efforts to conform with proprietary trading prohibitions and associated compliance requirements. The Company does not expect Volcker compliance to have a material impact on its business model.
The Volcker Rule's prohibitions impact the ability of U.S. banking entities to provide investment management products and services that are competitive with nonbanking firms generally and with non-U.S. banking organizations in overseas markets. The rule also effectively prohibits short-term trading strategies by any U.S. banking entity if those strategies involve instruments other than those specifically permitted for trading.
The final Volcker Rule regulations do provide certain exemptions allowing banking entities to continue underwriting, market-making, and hedging activities and trading certain government obligations, as well as various exemptions and exclusions from the definition of “covered funds”. The level of required compliance activity depends on the size of the banking entity and the extent of its trading. CEOs of larger banking entities, including Huntington, have to attest annually in writing that their organization has in place processes to establish, maintain, enforce, review, test, and modify compliance with the Volcker Rule regulations. Banking entities with significant permitted trading operations will have to report certain quantitative information, beginning between June 30, 2014 and December 31, 2016, depending on the size of the banking entity’s trading assets and liabilities.
On January 14, 2014, the five federal agencies approved an interim final rule to permit banking entities to retain interests in certain collateralized debt obligations backed primarily by trust preferred securities from the investment prohibitions of the Volcker Rule. Under the interim final rule, the agencies permit the retention of an interest in or sponsorship of covered funds by banking entities if certain qualifications are met. In addition, the agencies released a non-exclusive list of issuers that meet the requirements of the interim final rule. At December 31, 2015, we had investments in eight different pools of trust preferred securities. Seven of our pools are included in the list of non-exclusive issuers. We have analyzed the other pool that was not included on the list and believe that we will continue to be able to own this investment under the final Volcker Rule regulations.
There are restrictions on our ability to pay dividends.
Dividends from the Bank to the parent company are the primary source of funds for payment of dividends to our shareholders. However, there are statutory limits on the amount of dividends that the Bank can pay to the holding company. Regulatory approval is required prior to the declaration of any dividends in an amount greater than its undivided profits or if the total of all dividends declared in a calendar year would exceed the total of its net income for the year combined with its retained net income for the two preceding years, less any required transfers to surplus or common stock. The Bank is currently able to pay dividends to the holding company subject to these limitations.
If, in the opinion of the applicable regulatory authority, a bank under its jurisdiction is engaged in, or is about to engage in, an unsafe or unsound practice, such authority may require, after notice and hearing, that such bank cease and desist from such practice. Depending on the financial condition of the Bank, the applicable regulatory authority might deem us to be engaged in an unsafe or unsound practice if the Bank were to pay dividends to the holding company.
The Federal Reserve and the OCC have issued policy statements that provide that insured banks and bank holding companies should generally only pay dividends out of current operating earnings. Additionally, the Federal Reserve may prohibit or limit bank holding companies from making capital distributions, including payment of preferred and common dividends, as part of the annual capital plan approval process.
We are subject to the current capital requirements mandated by the Federal Reserve and Basel III capital and liquidity frameworks.
The Federal Reserve sets risk-based capital ratio and leverage ratio guidelines for bank holding companies. Under the guidelines and related policies, bank holding companies must maintain capital sufficient to meet both a risk-based asset ratio test and a leverage ratio test on a consolidated basis. The risk-based ratio is determined by allocating assets and specified off-balance sheet commitments into risk-weighted categories, with higher weighting assigned to categories perceived as representing greater risk. The risk-based ratio represents total capital divided by total risk-weighted assets. The leverage ratio is core capital divided by total assets adjusted as specified in the guidelines. The Bank is subject to substantially similar capital requirements.
13
In 2013, the Federal Reserve and the OCC adopted final capital rules implementing Basel III requirements for U.S. Banking organizations. The final rules establish an integrated regulatory capital framework and implement in the United States the Basel III regulatory capital reforms from the Basel Committee on Banking Supervision and certain changes required by the Dodd-Frank Act. Under the final rule, minimum requirements will increase for both the quantity and quality of capital held by banking organizations. Consistent with the international Basel framework, the final rule includes a new minimum ratio of common equity tier 1 capital to risk-weighted assets and a capital conservation buffer of 2.5% of risk-weighted assets that will apply to all supervised financial institutions. The rule also raises the minimum ratio of tier 1 capital to risk-weighted assets and includes a minimum leverage ratio of 4%. These new minimum capital ratios were effective for us on January 1, 2015, and will be fully phased-in on January 1, 2019.
The following are the Basel III regulatory capital levels that we must satisfy to avoid limitations on capital distributions and discretionary bonus payments during the applicable transition period, from January 1, 2015, until January 1, 2019:
Basel III Regulatory Capital Levels |
||||||||||||||
|
January 1,
2015
|
January 1,
2016
|
January 1,
2017
|
January 1,
2018
|
January 1,
2019
|
||||||||||
Common equity tier 1 risk-based capital ratio |
4.5 |
% |
5.125 |
% |
5.75 |
% |
6.375 |
% |
7.0 |
% |
||||
Tier 1 risk-based capital ratio |
6.0 |
% |
6.625 |
% |
7.25 |
% |
7.875 |
% |
8.5 |
% |
||||
Total risk-based capital ratio |
8.0 |
% |
8.625 |
% |
9.25 |
% |
9.875 |
% |
10.5 |
% |
||||
The final rule emphasizes CET1 capital, the most loss-absorbing form of capital, and implements strict eligibility criteria for regulatory capital instruments. The final rule also improves the methodology for calculating risk-weighted assets to enhance risk sensitivity. Banks and regulators use risk weighting to assign different levels of risk to different classes of assets.
Based on the final Basel III rule, banking organizations with more than $15 billion in total consolidated assets are required to phase-out of additional tier 1 capital any non-qualifying capital instruments (such as trust preferred securities and cumulative preferred shares) issued before September 12, 2010. We began the additional tier 1 capital phase-out of our trust preferred securities in 2015, but will be able to include these instruments in tier 2 capital as a non-advanced approaches institution.
Under Basel III, CET1 predominantly includes common stockholders’ equity, less certain deductions for goodwill and other intangible assets net of related taxes, over-funded net pension fund assets, and DTAs that arise from tax loss and credit carryforwards. We elected to exclude accumulated other comprehensive income from CET1 as permitted in the final rule. Tier 1 capital is predominantly comprised of CET1 as well as perpetual preferred stock and qualifying minority interests. Total capital predominantly includes tier 1 capital as well as certain long-term debt and allowance for credit losses qualifying for tier 2 capital. The calculations of CET1, tier 1 capital, and tier 2 capital include phase-out periods for certain instruments from January 2015 through December 2017. The primary items subject to the phase-out from capital for us are other intangible assets, DTAs that arise from tax loss and credit carryforwards, and trust preferred securities.
Risk-weighted assets under the Basel III Standardized Approach are generally based on supervisory risk weightings that vary only by counterparty type and asset class. The revisions to supervisory risk weightings for Basel III enhance risk sensitivity and include alternatives to the use of credit ratings when calculating the risk weight for certain assets. Specifically, Basel III includes a more risk-sensitive treatment for past due and nonaccrual loans, certain commercial loans, MSRs, and certain unfunded commitments. Basel III also prescribes a new formulaic approach for calculating the risk weight of securitization exposures that is also more risk sensitive.
Failure to meet applicable capital guidelines could subject the financial institution to a variety of enforcement remedies available to the federal regulatory authorities. These include limitations on the ability to pay dividends, the issuance by the regulatory authority of a directive to increase capital, and the termination of deposit insurance by the FDIC. In addition, the financial institution could be subject to the measures described below under Prompt Corrective Action as applicable to under-capitalized institutions.
The risk-based capital standards of the Federal Reserve, the OCC, and the FDIC specify that evaluations by the banking agencies of a bank’s capital adequacy will include an assessment of the exposure to declines in the economic value of a bank’s capital due to changes in interest rates. These banking agencies issued a joint policy statement on interest rate risk describing prudent methods for monitoring such risk that rely principally on internal measures of exposure and active oversight of risk management activities by senior management.
14
FDICIA requires federal banking regulatory authorities to take Prompt Corrective Action with respect to depository institutions that do not meet minimum capital requirements. For these purposes, FDICIA establishes five capital tiers: well-capitalized, adequately-capitalized, under-capitalized, significantly under-capitalized, and critically under-capitalized.
Throughout 2015, our regulatory capital ratios and those of the Bank were in excess of the levels established for well-capitalized institutions. An institution is deemed to be well-capitalized if it meets or exceeds the well-capitalized minimums listed below, and is not subject to a regulatory order, agreement, or directive to meet and maintain a specific capital level for any capital measure.
At December 31, 2015 |
|||||||||||
(dollar amounts in billions) |
Well-capitalized minimums |
Actual |
Excess
Capital (1)
|
||||||||
Ratios: |
|||||||||||
Tier 1 leverage ratio |
Consolidated |
N/A |
8.79 |
% |
N/A |
||||||
Bank |
5.00 |
% |
8.21 |
$ |
2.2 |
||||||
Common equity tier 1 risk-based capital ratio |
Consolidated |
N/A |
9.79 |
N/A |
|||||||
Bank |
6.50 |
9.46 |
1.7 |
||||||||
Tier 1 risk-based capital ratio |
Consolidated |
6.00 |
10.53 |
2.0 |
|||||||
Bank |
8.00 |
9.83 |
0.1 |
||||||||
Total risk-based capital ratio |
Consolidated |
10.00 |
12.64 |
1.5 |
|||||||
Bank |
10.00 |
11.74 |
1.0 |
||||||||
(1) |
Amount greater than the well-capitalized minimum percentage. |
FDICIA generally prohibits a depository institution from making any capital distribution, including payment of a cash dividend or paying any management fee to its holding company, if the depository institution would become under-capitalized after such payment. Under-capitalized institutions are also subject to growth limitations and are required by the appropriate federal banking agency to submit a capital restoration plan. If any depository institution subsidiary of a holding company is required to submit a capital restoration plan, the holding company would be required to provide a limited guarantee regarding compliance with the plan as a condition of approval of such plan.
Depending upon the severity of the under capitalization, the under-capitalized institutions may be subject to a number of requirements and restrictions, including orders to sell sufficient voting stock to become adequately-capitalized, requirements to reduce total assets, cessation of receipt of deposits from correspondent banks, and restrictions on making any payment of principal or interest on their subordinated debt. Critically under-capitalized institutions are subject to appointment of a receiver or conservator within 90 days of becoming so classified.
Under FDICIA, a well-capitalized bank may accept brokered deposits without prior regulatory approval. A depository institution that is not well-capitalized is generally prohibited from accepting brokered deposits and offering interest rates on deposits higher than the prevailing rate in its market. Since the Bank is well-capitalized, the FDICIA brokered deposit rule did not adversely affect its ability to accept brokered deposits. The Bank had $2.9 billion of such brokered deposits at December 31, 2015.
On September 3, 2014, the U.S. banking regulators approved a final rule to implement the U.S. version of the Basel Committee's minimum liquidity coverage ratio (LCR) requirement for banking organizations with total consolidated assets of $250 billion or more, and a less stringent modified LCR requirement to depository institution holding companies below the threshold but with total consolidated assets of $50 billion or more. The LCR requires covered banking organizations to maintain an amount of unencumbered HQLA equal to projected stressed cash outflows over a 30 calendar-day stress scenario. We are covered by the modified LCR requirement and therefore subject to the initial phase-in of the rule beginning in January 2016, with the requirement fully phased-in January 2017. We will also be required to calculate the LCR monthly. The modified LCR is a minimum requirement, and the Federal Reserve can impose additional liquidity requirements as a supervisory matter.
We are required to submit annual resolution plans
As a bank holding company with greater than $50 billion of assets, we are required annually to submit to the Federal Reserve and the FDIC a resolution plan for the rapid and orderly resolution of the Company in the event of material financial distress or failure. If both the Federal Reserve and the FDIC determine that our plan is not credible and the deficiencies are not cured in a timely manner, the Federal Reserve and the FDIC may jointly impose on us more stringent capital, leverage or liquidity requirements or restrictions on our growth, activities or operations.
15
The FDIC separately has adopted a final rule requiring an insured depository institution with $50 billion or more in total assets, such as the Bank, to submit periodically to the FDIC a resolution plan for the resolution of such institution in the event of its failure. The FDIC rule requires each covered institution to provide a resolution plan that should enable the FDIC as receiver to resolve the institution in an orderly manner that enables prompt access of insured deposits; maximizes the return from the failed institution’s assets; and minimizes losses realized by creditors and the Deposit Insurance Fund.
We filed our resolution plans pursuant to each rule in December 2015.
As a bank holding company, we must act as a source of financial and managerial strength to the Bank.
Under the Dodd-Frank Act, a bank holding company must act as a source of financial and managerial strength to each of its subsidiary banks and must commit resources to support each such subsidiary bank. The Federal Reserve may require a bank holding company to make capital injections into a troubled subsidiary bank. It may charge the bank holding company with engaging in unsafe and unsound practices if the bank holding company fails to commit resources to such a subsidiary bank or if it undertakes actions that the Federal Reserve believes might jeopardize the bank holding company’s ability to commit resources to such subsidiary bank.
Any loans by a holding company to a subsidiary bank are subordinate in right of payment to deposits and to certain other indebtedness of such subsidiary bank. In the event of a bank holding company’s bankruptcy, an appointed bankruptcy trustee will assume any commitment by the holding company to a federal bank regulatory agency to maintain the capital of a subsidiary bank. Moreover, the bankruptcy law provides that claims based on any such commitment will be entitled to a priority of payment over the claims of the institution’s general unsecured creditors, including the holders of its note obligations.
Federal law permits the OCC to order the pro-rata assessment of shareholders of a national bank whose capital stock has become impaired, by losses or otherwise, to relieve a deficiency in such national bank’s capital stock. This statute also provides for the enforcement of any such pro-rata assessment of shareholders of such national bank to cover such impairment of capital stock by sale, to the extent necessary, of the capital stock owned by any assessed shareholder failing to pay the assessment. As the sole shareholder of the Bank, we are subject to such provisions.
Moreover, the claims of a receiver of an insured depository institution for administrative expenses and the claims of holders of deposit liabilities of such an institution are accorded priority over the claims of general unsecured creditors of such an institution, including the holders of the institution’s note obligations, in the event of liquidation or other resolution of such institution. Claims of a receiver for administrative expenses and claims of holders of deposit liabilities of the Bank, including the FDIC as the insurer of such holders, would receive priority over the holders of notes and other senior debt of the Bank in the event of liquidation or other resolution and over our interests as sole shareholder of the Bank.
Transactions between the Bank and its affiliates are restricted.
Federal banking law and regulation imposes qualitative standards and quantitative limitations upon certain transactions by a bank with its affiliates, including the bank’s bank holding company and certain companies the bank holding company may be deemed to control for these purposes. Transactions covered by these provisions must be on arm’s-length terms, and cannot exceed certain amounts which are determined with reference to the bank’s regulatory capital. Moreover, if the transaction is a loan or other extension of credit, it must be secured by collateral in an amount and quality expressly prescribed by statute, and if the affiliate is unable to pledge sufficient collateral, the bank holding company may be required to provide it.
Provisions added by the Dodd-Frank Act expanded the scope of (i) the definition of affiliate to include any investment fund having any bank or BHC-affiliated company as an investment advisor, (ii) credit exposures subject to the prohibition on the acceptance of low-quality assets or securities issued by an affiliate as collateral, the quantitative limits, and the collateralization requirements to now include credit exposures arising out of derivative, repurchase agreement, and securities lending/borrowing transactions, and (iii) transactions subject to quantitative limits to now also include credit collateralized by affiliate-issued debt obligations that are not securities. In addition, these provisions require that a credit extension to an affiliate remain secured in accordance with the collateral requirements at all times that it is outstanding, rather than the previous requirement of only at the inception or upon material modification of the transaction. They also raise significantly the procedural and substantive hurdles required to obtain a regulatory exemption from the affiliate transaction requirements. While these provisions became effective on July 21, 2012, the Federal Reserve has not yet issued a proposed rule to implement them.
As a financial holding company, we are subject to additional laws and regulations.
As a financial holding company we are permitted to engage in, and affiliate with financial companies engaging in, a broader range of activities than would otherwise be permitted for a bank holding company. In order to maintain our status as a financial holding company, we and the Bank must each remain “well-capitalized” and “well-managed.” In addition, the Bank must receive
16
a Community Reinvestment Act ("CRA") rating of at least “Satisfactory” at its most recent examination for us to engage in the full range of activities permissible for financial holding companies. Pursuant to CRA, the OCC examines the Bank to assess the Bank’s record in meeting the credit needs of the communities served by the Bank and assigns a rating based on that assessment. The CRA assessment and rating is reviewed by the Federal Reserve in evaluating a variety of applications including to merge or consolidate with or acquire the assets or assume the liabilities of other institutions, or to open or relocate a branch office.
Financial holding company powers relate to financial activities that are specified in the Bank Holding Company Act or determined by the Federal Reserve, in coordination with the Secretary of the Treasury, to be financial in nature, incidental to an activity that is financial in nature, or complementary to a financial activity, provided that the complementary activity does not pose a safety and soundness risk. In addition, we are required by the Bank Holding Company Act to obtain Federal Reserve approval prior to acquiring, directly or indirectly, ownership or control of voting shares of any bank, if, after such acquisition, we would own or control more than 5% of its voting stock. Furthermore, the Dodd-Frank Act added a new provision to the Bank Holding Company Act, which requires bank holding companies with total consolidated assets equal to or greater than $50 billion to obtain prior approval from the Federal Reserve to acquire a nondepository company having total consolidated assets of $10 billion or more.
We also must comply with anti-money laundering and customer privacy regulations, as well as corporate governance, accounting, and reporting requirements.
The USA Patriot Act of 2001 and its related regulations require insured depository institutions, broker-dealers, and certain other financial institutions to have policies, procedures, and controls to detect, prevent, and report money laundering and terrorist financing. Federal banking regulators are required, when reviewing bank holding company acquisition and bank merger applications, to take into account the effectiveness of the anti-money laundering activities of the applicants. The Financial Crimes Enforcement Network has proposed a rule for those same entities, and, if adopted, the proposal will prescribe customer due diligence requirements, including a new regulatory mandate to identify the beneficial owners of legal entities which are customers.
Pursuant to Title V of the Gramm-Leach-Bliley Act, we, like all other financial institutions, are required to:
• |
provide notice to our customers regarding privacy policies and practices, |
• |
inform our customers regarding the conditions under which their nonpublic personal information may be disclosed to nonaffiliated third parties, and |
• |
give our customers an option to prevent certain disclosure of such information to nonaffiliated third parties. |
The Sarbanes-Oxley Act of 2002 imposed new or revised corporate governance, accounting, and reporting requirements on us. In addition to a requirement that chief executive officers and chief financial officers certify financial statements in writing, the statute imposed requirements affecting, among other matters, the composition and activities of audit committees, disclosures relating to corporate insiders and insider transactions, code of ethics, and the effectiveness of internal controls over financial reporting.
The Federal Reserve, jointly with the OCC and FDIC, has issued guidance to ensure that incentive compensation arrangements at financial institutions take into account risk and are consistent with safe and sound practices. In addition, the federal financial regulators issued a proposed rule in April 2011 pursuant to the Dodd-Frank Act to adopt standards for determining whether an incentive-based compensation arrangement may encourage inappropriate risk-taking that are consistent with the key principles established for incentive compensation in the guidance. The proposed rule would apply to financial institutions with $1 billion or more in assets, with heightened standards for financial institutions with $50 billion or more in assets. The guidance from the regulators on compensation is still evolving.
Available Information
This information may be read and copied at the Public Reference Room of the SEC at 100 F Street, N.E., Washington, D.C. 20549. You can obtain information on the operation of the Public Reference Room by calling the SEC at 1-800-SEC-0330. The SEC also maintains an Internet web site that contains reports, proxy statements, and other information about issuers, like us, who file electronically with the SEC. The address of the site is http://www.sec.gov. The reports and other information filed by us with the SEC are also available free of charge at our Internet web site. The address of the site is http://www.huntington.com. Except as specifically incorporated by reference into this Annual Report on Form 10-K, information on those web sites is not part of this report. You also should be able to inspect reports, proxy statements, and other information about us at the offices of the NASDAQ National Market at 33 Whitehall Street, New York, New York.
17
Item 1A: Risk Factors
Risk Governance
We use a multi-faceted approach to risk governance. It begins with the board of directors defining our risk appetite as aggregate moderate-to-low. This does not preclude engagement in select higher risk activities. Rather, the definition is intended to represent an aggregate view of where we want our overall risk to be managed.
Three board committees primarily oversee implementation of this desired risk appetite and monitoring of our risk profile:
• |
The Audit Committee oversees the integrity of the consolidated financial statements, including policies, procedures, and practices regarding the preparation of financial statements, the financial reporting process, disclosures, and internal control over financial reporting. The Audit Committee also provides assistance to the board in overseeing the internal audit division and the independent registered public accounting firm’s qualifications and independence; compliance with our Financial Code of Ethics for the chief executive officer and senior financial officers; and compliance with corporate securities trading policies. |
• |
The Risk Oversight Committee assists the board of directors in overseeing management of material risks, the approval and monitoring of the Company’s capital position and plan supporting our overall aggregate moderate-to-low risk profile, the risk governance structure, compliance with applicable laws and regulations, and determining adherence to the board’s stated risk appetite. The committee has oversight responsibility with respect to the full range of inherent risks: market, credit, liquidity, legal, compliance/regulatory, operational, strategic, and reputational. This committee also oversees our capital management and planning process, ensures that the amount and quality of capital are adequate in relation to expected and unexpected risks, and that our capital levels exceed “well-capitalized” requirements. |
• |
The Technology Committee assists the board of directors in fulfilling its oversight responsibilities with respect to all technology, cyber security, and third-party risk management strategies and plans. The committee is charged with evaluating Huntington’s capability to properly perform all technology functions necessary for its business plan, including projected growth, technology capacity, planning, operational execution, product development, and management capacity. The committee provides oversight of the technology segment investments and plans to drive efficiency as well as to meet defined standards for risk, security, and redundancy. The Committee oversees the allocation of technology costs and ensures that they are understood by the board of directors. The Technology Committee monitors and evaluates innovation and technology trends that may affect the Company’s strategic plans, including monitoring of overall industry trends. The Technology Committee reviews and provides oversight of the company’s continuity and disaster recovery planning and preparedness. |
The Audit and Risk Oversight Committees routinely hold executive sessions with our key officers engaged in accounting and risk management. On a periodic basis, the two committees meet in joint session to cover matters relevant to both, such as the construct and appropriateness of the ACL, which is reviewed quarterly. All directors have access to information provided to each committee and all scheduled meetings are open to all directors.
Further, through its Compensation Committee, the board of directors seeks to ensure its system of rewards is risk-sensitive and aligns the interests of management, creditors, and shareholders. We utilize a variety of compensation-related tools to induce appropriate behavior, including common stock ownership thresholds for the chief executive officer and certain members of senior management, a requirement to hold until retirement or exit from the Company, a portion of net shares received upon exercise of stock options or release of restricted stock awards (50% for executive officers and 25% for other award recipients), equity deferrals, recoupment provisions, and the right to terminate compensation plans at any time.
Management has implemented an Enterprise Risk Management and Risk Appetite Framework. Critically important is our self-assessment process, in which each business segment produces an analysis of its risks and the strength of its risk controls. The segment analyses are combined with assessments by our risk management organization of major risk sectors (e.g., credit, market, liquidity, operational, legal, compliance, reputational, and strategic) to produce an overall enterprise risk assessment. Outcomes of the process include a determination of the quality of the overall control process, the direction of risk, and our position compared to the defined risk appetite.
Management also utilizes a wide series of metrics (key risk indicators) to monitor risk positions throughout the Company. In general, a range for each metric is established, which allows the Company, in aggregate, to operate within an aggregate moderate-to-low risk profile. Deviations from the range will indicate if the risk being measured exceeds desired tolerance, which may then necessitate corrective action.
We also have four executive level committees to manage risk: ALCO, Credit Policy and Strategy, Risk Management, and Capital Management. Each committee focuses on specific categories of risk and is supported by a series of subcommittees that are tactical in nature. We believe this structure helps ensure appropriate escalation of issues and overall communication of strategies.
18
Huntington utilizes three lines of defense with regard to risk management: (1) business segments, (2) corporate risk management, and (3) internal audit and credit review. To induce greater ownership of risk within its business segments, segment risk officers have been embedded to identify and monitor risk, elevate and remediate issues, establish controls, perform self-testing, and oversee the self-assessment process. Corporate Risk Management establishes policies, sets operating limits, reviews new or modified products/processes, ensures consistency and quality assurance within the segments, and produces the enterprise risk assessment. The Chief Risk Officer has significant input into the design and outcome of incentive compensation plans as they apply to risk. Internal Audit and Credit Review provide additional assurance that risk-related functions are operating as intended.
Risk Overview
We, like other financial companies, are subject to a number of risks that may adversely affect our financial condition or results of operations, many of which are outside of our direct control, though efforts are made to manage those risks while optimizing returns. Among the risks assumed are:
•Credit risk, which is the risk of loss due to loan and lease customers or other counterparties not being able to meet their financial obligations under agreed upon terms;
•Market risk, which occurs when fluctuations in interest rates impact earnings and capital. Financial impacts are realized through changes in the interest rates of balance sheet assets and liabilities (net interest margin) or directly through valuation changes of capitalized MSR and/or trading assets (noninterest income);
•Liquidity risk, which is the risk to current or anticipated earnings or capital arising from an inability to meet obligations when they come due. Liquidity risk includes the inability to access funding sources or manage fluctuations in funding levels. Liquidity risk also results from the failure to recognize or address changes in market conditions that affect the Bank’s ability to liquidate assets quickly and with minimal loss in value;
•Operational and legal risk, which is the risk of loss arising from inadequate or failed internal processes or systems, human errors or misconduct, or adverse external events. Operational losses result from internal fraud; external fraud, inadequate or inappropriate employment practices and workplace safety, failure to meet professional obligations involving customers, products, and business practices, damage to physical assets, business disruption and systems failures, and failures in execution, delivery, and process management. Legal risk includes, but is not limited to, exposure to orders, fines, penalties, or punitive damages resulting from litigation, as well as regulatory actions; and
•Compliance risk, which exposes us to money penalties, enforcement actions or other sanctions as a result of nonconformance with laws, rules, and regulations that apply to the financial services industry.
We also expend considerable effort to contain risk which emanates from execution of our business processes and strategies and work relentlessly to protect the Company’s reputation. Strategic risk and reputational risk do not easily lend themselves to traditional methods of measurement. Rather, we closely monitor them through processes such as new product / initiative reviews, frequent financial performance reviews, colleague and client surveys, monitoring market intelligence, periodic discussions between management and our board, and other such efforts.
In addition to the other information included or incorporated by reference into this report, readers should carefully consider that the following important factors, among others, could negatively impact our business, future results of operations, and future cash flows materially.
Credit Risks:
1. Our ACL level may prove to be inappropriate or be negatively affected by credit risk exposures which could materially adversely affect our net income and capital.
Our business depends on the creditworthiness of our customers. Our ACL of $670 million at December 31, 2015, represented Management’s estimate of probable losses inherent in our loan and lease portfolio as well as our unfunded loan commitments and letters of credit. We periodically review our ACL for appropriateness. In doing so, we consider economic conditions and trends, collateral values, and credit quality indicators, such as past charge-off experience, levels of past due loans, and NPAs. There is no certainty that our ACL will be appropriate over time to cover losses in the portfolio because of unanticipated adverse changes in the economy, market conditions, or events adversely affecting specific customers, industries, or markets. If the credit quality of our customer base materially decreases, if the risk profile of a market, industry, or group of customers changes materially, or if the ACL is not appropriate, our net income and capital could be materially adversely affected, which could have a material adverse effect on our financial condition and results of operations.
In addition, regulatory review of risk ratings and loan and lease losses may impact the level of the ACL and could have a material adverse effect on our financial condition and results of operations.
19
2. Weakness in economic conditions could materially adversely affect our business.
Our performance could be negatively affected to the extent there is deterioration in business and economic conditions which have direct or indirect material adverse impacts on us, our customers, and our counterparties. These conditions could result in one or more of the following:
• |
A decrease in the demand for loans and other products and services offered by us; |
• |
A decrease in customer savings generally and in the demand for savings and investment products offered by us; and |
• |
An increase in the number of customers and counterparties who become delinquent, file for protection under bankruptcy laws, or default on their loans or other obligations to us. |
An increase in the number of delinquencies, bankruptcies, or defaults could result in a higher level of NPAs, NCOs, provision for credit losses, and valuation adjustments on loans held for sale. The markets we serve are dependent on industrial and manufacturing businesses and, thus, are particularly vulnerable to adverse changes in economic conditions affecting these sectors.
Market Risks:
1. Changes in interest rates could reduce our net interest income, reduce transactional income, and negatively impact the value of our loans, securities, and other assets. This could have a material adverse impact on our cash flows, financial condition, results of operations, and capital.
Our results of operations depend substantially on net interest income, which is the difference between interest earned on interest earning assets (such as investments and loans) and interest paid on interest bearing liabilities (such as deposits and borrowings). Interest rates are highly sensitive to many factors, including governmental monetary policies and domestic and international economic and political conditions. Conditions such as inflation, deflation, recession, unemployment, money supply, and other factors beyond our control may also affect interest rates. If our interest earning assets mature or reprice faster than interest bearing liabilities in a declining interest rate environment, net interest income could be materially adversely impacted. Likewise, if interest bearing liabilities mature or reprice more quickly than interest earning assets in a rising interest rate environment, net interest income could be adversely impacted. The continuation of the current low interest rate environment or a deflationary environment with negative interest rates could affect consumer and business behavior in ways that are adverse to us and could also constrict our net interest income margin which may restrict our ability to increase net interest income.
Changes in interest rates can affect the value of loans, securities, assets under management, and other assets, including mortgage and nonmortgage servicing rights. An increase in interest rates that adversely affects the ability of borrowers to pay the principal or interest on loans and leases may lead to an increase in NPAs and a reduction of income recognized, which could have a material adverse effect on our results of operations and cash flows. When we place a loan on nonaccrual status, we reverse any accrued but unpaid interest receivable, which decreases interest income. However, we continue to incur interest expense as a cost of funding NALs without any corresponding interest income. In addition, transactional income, including trust income, brokerage income, and gain on sales of loans can vary significantly from period-to-period based on a number of factors, including the interest rate environment. A decline in interest rates along with a flattening yield curve limits our ability to reprice deposits given the current historically low level of interest rates and could result in declining net interest margins if longer duration assets reprice faster than deposits.
Rising interest rates reduce the value of our fixed-rate securities and cash flow hedging derivatives portfolio. Any unrealized loss from these portfolios impacts OCI, shareholders’ equity, and the Tangible Common Equity ratio. Any realized loss from these portfolios impacts regulatory capital ratios. In a rising interest rate environment, pension and other post-retirement obligations somewhat mitigate negative OCI impacts from securities and financial instruments. For more information, refer to “Market Risk” of the MD&A.
Certain investment securities, notably mortgage-backed securities, are very sensitive to rising and falling rates. Generally, when rates rise, prepayments of principal and interest will decrease and the duration of mortgage-backed securities will increase. Conversely, when rates fall, prepayments of principal and interest will increase and the duration of mortgage-backed securities will decrease. In either case, interest rates have a significant impact on the value of mortgage-backed securities.
The value of our MSR asset is also a function of changes in interest rates and prepayment expectations. Declining interest rates primarily in the longer end of the yield curve reduces the value of the MSR asset.
In addition to volatility associated with interest rates, the Company also has exposure to equity markets related to the investments within the benefit plans and other income from client based transactions.
20
2. Industry competition may have an adverse effect on our success.
Our profitability depends on our ability to compete successfully. We operate in a highly competitive environment, and we expect competition to intensify due in part to the sustained low interest rate and ongoing low-growth economic environment. Certain of our competitors are larger and have more resources than we do, enabling them to be more aggressive than us in competing for loans and deposits. In our market areas, we face competition from other banks and financial service companies that offer similar services. Some of our non-bank competitors are not subject to the same extensive regulations we are and, therefore, may have greater flexibility in competing for business. Our ability to compete successfully depends on a number of factors, including customer convenience, quality of service by investing in new products and services, personal contacts, pricing, and range of products. If we are unable to successfully compete for new customers and retain our current customers, our business, financial condition, or results of operations may be adversely affected. In particular, if we experience an outflow of deposits as a result of our customers seeking investments with higher yields or greater financial stability, or a desire to do business with our competitors, we may be forced to rely more heavily on borrowings and other sources of funding to operate our business and meet withdrawal demands, thereby adversely affecting our net interest margin. For more information, refer to “Competition” section of Item 1: Business.
Liquidity Risks:
1. Changes in either Huntington’s financial condition or in the general banking industry could result in a loss of depositor confidence.
Liquidity is the ability to meet cash flow needs on a timely basis at a reasonable cost. The Bank uses its liquidity to extend credit and to repay liabilities as they become due or as demanded by customers. The board of directors establishes liquidity policies and limits and management establishes operating guidelines for liquidity.
Our primary source of liquidity is our large supply of deposits from consumer and commercial customers. The continued availability of this supply depends on customer willingness to maintain deposit balances with banks in general and us in particular. The availability of deposits can also be impacted by regulatory changes (e.g. changes in FDIC insurance, the Liquidity Coverage Ratio, etc.), and other events which can impact the perceived safety or economic benefits of bank deposits. While we make significant efforts to consider and plan for hypothetical disruptions in our deposit funding, market related, geopolitical, or other events could impact the liquidity derived from deposits.
2. If we lose access to capital markets, we may not be able to meet the cash flow requirements of our depositors, creditors, and borrowers, or have the operating cash needed to fund corporate expansion and other corporate activities.
Wholesale funding sources include securitization, federal funds purchased, securities sold under repurchase agreements, non-core deposits, and long-term debt. The Bank is also a member of the Federal Home Loan Bank of Cincinnati, which provides members access to funding through advances collateralized with mortgage-related assets. We maintain a portfolio of highly-rated, marketable securities that is available as a source of liquidity.
Capital markets disruptions can directly impact the liquidity of the Bank and Corporation. The inability to access capital markets funding sources as needed could adversely impact our financial condition, results of operations, cash flows, and level of regulatory-qualifying capital. We may, from time-to-time, consider using our existing liquidity position to opportunistically retire outstanding securities in privately negotiated or open market transactions.
Operational and Legal Risks:
1. We face security risks, including denial of service attacks, hacking, social engineering attacks targeting our colleagues and customers, malware intrusion or data corruption attempts, and identity theft that could result in the disclosure of confidential information, adversely affect our business or reputation, and create significant legal and financial exposure.
Our computer systems and network infrastructure are subject to security risks and could be susceptible to cyber-attacks, such as denial of service attacks, hacking, terrorist activities or identity theft. Financial services institutions and companies engaged in data processing have reported breaches in the security of their websites or other systems, some of which have involved sophisticated and targeted attacks intended to obtain unauthorized access to confidential information, destroy data, disable or degrade service, or sabotage systems, often through the introduction of computer viruses or malware, cyber-attacks and other means. Denial of service attacks have been launched against a number of large financial services institutions, including us. None of these events against us resulted in a breach of our client data or account information; however, the performance of our website, www.huntington.com, was adversely affected, and in some instances customers were prevented from accessing our website. We expect to be subject to similar attacks in the future. While events to date primarily resulted in inconvenience, future cyber-attacks could be more disruptive and damaging. Hacking and identity theft risks, in particular, could cause serious reputational harm. Cyber threats are rapidly evolving and we may not be able to anticipate or prevent all such attacks and could be held liable for any security breach or loss.
21
Despite efforts to ensure the integrity of our systems, we may not be able to anticipate all security breaches of these types, nor may we be able to implement guaranteed preventive measures against such security breaches. Persistent attackers may succeed in penetrating defenses given enough resources, time and motive. The techniques used by cyber criminals change frequently, may not be recognized until launched and can originate from a wide variety of sources, including outside groups such as external service providers, organized crime affiliates, terrorist organizations or hostile foreign governments. These risks may increase in the future as we continue to increase our mobile-payment and other internet-based product offerings and expand our internal usage of web-based products and applications.
Even the most advanced internal control environment may be vulnerable to compromise. Targeted social engineering attacks and "spear phishing" attacks are becoming more sophisticated and are extremely difficult to prevent. The successful social engineer will attempt to fraudulently induce colleagues, customers or other users of our systems to disclose sensitive information in order to gain access to its data or that of its clients.
A successful penetration or circumvention of system security could cause us serious negative consequences, including significant disruption of operations, misappropriation of confidential information, or damage to our computers or systems or those of our customers and counterparties. A successful security breach could result in violations of applicable privacy and other laws, financial loss to us or to our customers, loss of confidence in our security measures, significant litigation exposure, and harm to our reputation, all of which could have a material adverse effect on the Company.
2. The resolution of significant pending litigation, if unfavorable, could have a material adverse effect on our results of operations for a particular period.
We face legal risks in our businesses, and the volume of claims and amount of damages and penalties claimed in litigation and regulatory proceedings against financial institutions remain high. Substantial legal liability against us could have material adverse financial effects or cause significant reputational harm to us, which in turn could seriously harm our business prospects. It is possible that the ultimate resolution of these matters, if unfavorable, may be material to the results of operations for a particular reporting period.
Note 20 of the Notes to Consolidated Financial Statements updates the status of certain material litigation including litigation related to the bankruptcy of Cyberco Holdings, Inc.
3. We face significant operational risks which could lead to financial loss, expensive litigation, and loss of confidence by our customers, regulators, and capital markets.
We are exposed to many types of operational risks, including the risk of fraud or theft by colleagues or outsiders, unauthorized transactions by colleagues or outsiders, operational errors by colleagues, business disruption, and system failures. Huntington executes against a significant number of controls, a large percent of which are manual and dependent on adequate execution by colleagues and third-party service providers. There is inherent risk that unknown single points of failure through the execution chain could give rise to material loss through inadvertent errors or malicious attack. These operational risks could lead to financial loss, expensive litigation, and loss of confidence by our customers, regulators, and the capital markets.
Moreover, negative public opinion can result from our actual or alleged conduct in any number of activities, including clients, products and business practices; corporate governance; acquisitions; and from actions taken by government regulators and community organizations in response to those activities. Negative public opinion can adversely affect our ability to attract and retain customers and can also expose us to litigation and regulatory action.
Relative to acquisitions, we incur risks and challenges associated with the integration of acquired businesses and institutions in a timely and efficient manner, and we cannot guarantee that we will be successful in retaining existing customer relationships or achieving anticipated operating efficiencies expected from such acquisitions (including our pending acquisition of FirstMerit Corporation). Acquisitions may be subject to, and our pending acquisition of FirstMerit Corporation is subject to, the receipt of approvals from certain governmental authorities, including the Federal Reserve, the OCC, and the United States Department of Justice, as well as the approval of our shareholders and the shareholders of companies that we seek to acquire. These approvals for acquisitions may not be received, may take longer than expected, or may impose conditions that are not presently anticipated or that could have an adverse effect on the combined company following the acquisitions. Subject to requisite regulatory approvals, future business acquisitions may result in the issuance and payment of additional shares of stock, which would dilute current shareholders’ ownership interests. Additionally, acquisitions may also involve the payment of a premium over book and market values. Therefore, dilution of our tangible book value and net income per common share could occur in connection with any future transaction.
22
4. Failure to maintain effective internal controls over financial reporting in the future could impair our ability to accurately and timely report our financial results or prevent fraud, resulting in loss of investor confidence and adversely affecting our business and our stock price.
Effective internal controls over financial reporting are necessary to provide reliable financial reports and prevent fraud. As a financial holding company, we are subject to regulation that focuses on effective internal controls and procedures. Such controls and procedures are modified, supplemented, and changed from time-to-time as necessitated by our growth and in reaction to external events and developments. Any failure to maintain, in the future, an effective internal control environment could impact our ability to report our financial results on an accurate and timely basis, which could result in regulatory actions, loss of investor confidence, and an adverse impact on our business and our stock price.
5. We rely on quantitative models to measure risks and to estimate certain financial values.
Quantitative models may be used to help manage certain aspects of our business and to assist with certain business decisions, including estimating probable loan losses, measuring the fair value of financial instruments when reliable market prices are unavailable, estimating the effects of changing interest rates and other market measures on our financial condition and results of operations, managing risk, and for capital planning purposes (including during the CCAR capital planning and capital adequacy process). Our measurement methodologies rely on many assumptions, historical analyses, and correlations. These assumptions may not capture or fully incorporate conditions leading to losses, particularly in times of market distress, and the historical correlations on which we rely may no longer be relevant. Additionally, as businesses and markets evolve, our measurements may not accurately reflect this evolution. Even if the underlying assumptions and historical correlations used in our models are adequate, our models may be deficient due to errors in computer code, bad data, misuse of data, or the use of a model for a purpose outside the scope of the model’s design.
All models have certain limitations. Reliance on models presents the risk that our business decisions based on information incorporated from models will be adversely affected due to incorrect, missing, or misleading information. In addition, our models may not capture or fully express the risks we face, may suggest that we have sufficient capitalization when we do not, or may lead us to misjudge the business and economic environment in which we will operate. If our models fail to produce reliable results on an ongoing basis, we may not make appropriate risk management, capital planning, or other business or financial decisions. Strategies that we employ to manage and govern the risks associated with our use of models may not be effective or fully reliable. Also, information that we provide to the public or regulators based on poorly designed models could be inaccurate or misleading.
Banking regulators continue to focus on the models used by banks and bank holding companies in their businesses. Some of our decisions that the regulators evaluate, including distributions to our shareholders, could be affected adversely due to their perception that the quality of the models used to generate the relevant information is insufficient.
6. We rely on third parties to provide key components of our business infrastructure.
We rely on third-party service providers to leverage subject matter expertise and industry best practice, provide enhanced products and services, and reduce costs. Although there are benefits in entering into third-party relationships with vendors and others, there are risks associated with such activities. When entering a third-party relationship, the risks associated with that activity are not passed to the third-party but remain our responsibility. The Technology Committee of the board of directors provides oversight related to the overall risk management process associated with third-party relationships. Management is accountable for the review and evaluation of all new and existing third-party relationships. Management is responsible for ensuring that adequate controls are in place to protect us and our customers from the risks associated with vendor relationships.
Increased risk could occur based on poor planning, oversight, and control and inferior performance or service on the part of the third-party, and may result in legal costs or loss of business. While we have implemented a vendor management program to actively manage the risks associated with the use of third-party service providers, any problems caused by third-party service providers could adversely affect our ability to deliver products and services to our customers and to conduct our business. Replacing a third-party service provider could also take a long period of time and result in increased expenses.
7. Changes in accounting policies, standards, and interpretations could materially affect how we report our financial condition and results of operations.
The FASB, regulatory agencies, and other bodies that establish accounting standards periodically change the financial accounting and reporting standards governing the preparation of our financial statements. Additionally, those bodies that establish and interpret the accounting standards (such as the FASB, SEC, and banking regulators) may change prior interpretations or positions on how these standards should be applied. These changes can be difficult to predict and can materially affect how we record and report our financial condition and results of operations. The FASB is currently close to issuing several new accounting standards that will have significant impacts on the banking industry. Most notably, new guidance on the calculation of credit reserves using expected losses (Current Expected Credit Losses) versus incurred losses is close to being finalized and, upon implementation, could
23
significantly impact our required credit reserves. Other impacts to capital levels, profit and loss, and various financial metrics will also result.
Compliance Risks:
1. Bank regulations regarding capital and liquidity, including the annual CCAR assessment process and the Basel III capital and liquidity standards, could require higher levels of capital and liquidity. Among other things, these regulations could impact our ability to pay common stock dividends, repurchase common stock, attract cost-effective sources of deposits, or require the retention of higher amounts of low yielding securities.
The Federal Reserve administers the annual CCAR, an assessment of the capital adequacy of bank holding companies with consolidated assets of $50 billion or more and of the practices used by covered banks to assess capital needs. Under CCAR, the Federal Reserve makes a qualitative assessment of capital adequacy on a forward-looking basis and reviews the strength of a bank holding company’s capital adequacy process. The Federal Reserve also makes a quantitative assessment of capital based on supervisory-run stress tests that assess the ability to maintain capital levels above each minimum regulatory capital ratio and above a CET1 ratio of 4.5%, after making all capital actions included in a bank holding company’s capital plan, under baseline and stressful conditions throughout a nine-quarter planning horizon. Capital plans for 2016 are required to be submitted by April 5, 2016, and the Federal Reserve will either object to the capital plan and/or planned capital actions, or provide a notice of non-objection, no later than June 30, 2016. We intend to submit our capital plan to the Federal Reserve on or before April 5, 2016. The Bank also must submit a capital plan to the OCC on or before April 5, 2016. There can be no assurance that the Federal Reserve will respond favorably to our capital plan, capital actions or stress test and the Federal Reserve, OCC, or other regulatory capital requirements may limit or otherwise restrict how we utilize our capital, including common stock dividends and stock repurchases.
In 2013, the Federal Reserve and the OCC adopted final rules to implement the Basel III capital rules for U.S. Banking organizations. The final rules establish an integrated regulatory capital framework and will implement in the United States the Basel III regulatory capital reforms from the Basel Committee on Banking Supervision and certain changes required by the Dodd-Frank Act. Under the final rule, minimum requirements will increase for both the quantity and quality of capital held by banking organizations. As a Standardized Approach institution, the Basel III minimum capital requirements became effective for us on January 1, 2015, and will be fully phased-in on January 1, 2019.
On September 3, 2014, the U.S. banking regulators approved a final rule to implement a minimum liquidity coverage ratio (LCR) requirement for banking organizations with total consolidated assets of $250 billion or more, and a less stringent modified LCR requirement to depository institution holding companies below the threshold but with total consolidated assets of $50 billion or more. The LCR requires covered banking organizations to maintain HQLA equal to projected stressed cash outflows over a 30 calendar-day stress scenario. We are covered by the modified LCR requirement and therefore subject to the phase-in of the rule beginning January 2016 at 90% and January 2017 at 100%. We will also be required to calculate the LCR monthly. The LCR assigns less severe outflow assumptions to certain types of customer deposits, which should increase the demand, and perhaps the cost, among banks for these deposits. Additionally, the HQLA requirements will increase the demand for direct US government and US government- guaranteed debt that, while high quality, generally carry lower yields than other securities that banks hold in their investment portfolios.
2. If our regulators deem it appropriate, they can take regulatory actions that could result in a material adverse impact on our financial results, ability to compete for new business, or preclude mergers or acquisitions. In addition, regulatory actions could constrain our ability to fund our liquidity needs or pay dividends. Any of these actions could increase the cost of our services.
We are subject to the supervision and regulation of various state and federal regulators, including the OCC, Federal Reserve, FDIC, SEC, CFPB, Financial Industry Regulatory Authority, and various state regulatory agencies. As such, we are subject to a wide variety of laws and regulations, many of which are discussed in the Regulatory Matters section. As part of their supervisory process, which includes periodic examinations and continuous monitoring, the regulators have the authority to impose restrictions or conditions on our activities and the manner in which we manage the organization. Such actions could negatively impact us in a variety of ways, including charging monetary fines, impacting our ability to pay dividends, precluding mergers or acquisitions, limiting our ability to offer certain products or services, or imposing additional capital requirements.
With the addition of the CFPB, our consumer products and services are subject to increasing regulatory oversight and scrutiny with respect to compliance under consumer laws and regulations. We may face a greater number or wider scope of investigations, enforcement actions, and litigation in the future related to consumer practices, thereby increasing costs associated with responding to or defending such actions. In addition, increased regulatory inquiries and investigations, as well as any additional legislative or regulatory developments affecting our consumer businesses, and any required changes to our business operations resulting from these developments, could result in significant loss of revenue, require remuneration to our customers, trigger fines or penalties, limit the products or services we offer, require us to increase our prices and, therefore, reduce demand for our products, impose additional compliance costs on us, cause harm to our reputation, or otherwise adversely affect our consumer businesses.
24
3. Legislative and regulatory actions taken now or in the future that impact the financial industry may materially adversely affect us by increasing our costs, adding complexity in doing business, impeding the efficiency of our internal business processes, negatively impacting the recoverability of certain of our recorded assets, requiring us to increase our regulatory capital, limiting our ability to pursue business opportunities, and otherwise resulting in a material adverse impact on our financial condition, results of operation, liquidity, or stock price.
The Dodd-Frank Act represents a comprehensive overhaul of the financial services industry within the United States, establishes the CFPB, and requires the bureau and other federal agencies to implement many new and significant rules and regulations. It is not possible to predict the full extent to which the Dodd-Frank Act, or the resulting rules and regulations in their entirety, will impact our business. Compliance with these new laws and regulations have and will continue to result in additional costs, which could be significant, and may have a material and adverse effect on our results of operations. In addition, if we do not appropriately comply with current or future legislation and regulations that apply to our consumer operations, we may be subject to fines, penalties or judgments, or material regulatory restrictions on our businesses, which could adversely affect operations and, in turn, financial results.
4. We may become subject to more stringent regulatory requirements and activity restrictions if the Federal Reserve and FDIC determine that our resolution plan is not credible.
The Dodd-Frank Act and implementing regulations jointly issued by Federal Reserve and the FDIC require bank holding companies with more than $50 billion in assets to annually submit a resolution plan to the Federal Reserve and the FDIC that, in the event of material financial distress or failure, establish the rapid, orderly resolution of the Company under the U.S. Bankruptcy Code. If the Federal Reserve and the FDIC jointly determine that our 2015 resolution plan is not “credible,” we could become subjected to more stringent capital, leverage or liquidity requirements or restrictions, or restrictions on our growth, activities or operations, and could eventually be required to divest certain assets or operations in ways that could negatively impact its operations and strategy.
5. Our business, financial condition, and results of operations could be adversely affected if we lose our financial holding company status.
In order for us to maintain our status as a financial holding company, we and the Bank must remain “well capitalized,” and “well managed.” If we or our Bank cease to meet the requirements necessary for us to continue to qualify as a financial holding company, the Federal Reserve may impose upon us corrective capital and managerial requirements, and may place limitations on our ability to conduct all of the business activities that we conduct as a financial holding company. If the failure to meet these standards persists, we could be required to divest our Bank, or cease all activities other than those activities that may be conducted by bank holding companies that are not financial holding companies. In addition, our ability to commence or engage in certain activities as a financial holding company will be restricted if the Bank fails to maintain at least a “Satisfactory” rating on its most recent Community Reinvestment Act examination.
Item 1B: Unresolved Staff Comments
None.
Item 2: Properties
Our headquarters, as well as the Bank’s, is located in the Huntington Center, a thirty seven story office building located in Columbus, Ohio. Of the building’s total office space available, we lease approximately 28%. The lease term expires in 2030, with six five-year renewal options for up to 30 years but with no purchase option. The Bank has an indirect minority equity interest of 18.4% in the building.
Our other major properties consist of the following:
Description |
Location |
Own |
Lease |
||
13 story office building, located adjacent to the Huntington Center |
Columbus, Ohio |
ü |
|||
12 story office building, located adjacent to the Huntington Center |
Columbus, Ohio |
ü |
|||
3 story office building - the Crosswoods building |
Columbus, Ohio |
ü |
|||
A portion of 200 Public Square Building |
Cleveland, Ohio |
ü |
|||
12 story office building |
Youngstown, Ohio |
ü |
|||
10 story office building |
Warren, Ohio |
ü |
|||
10 story office building |
Toledo, Ohio |
ü |
|||
A portion of the Grant Building |
Pittsburgh, Pennsylvania |
ü |
|||
18 story office building |
Charleston, West Virginia |
ü |
|||
3 story office building |
Holland, Michigan |
ü |
|||
2 building office complex |
Troy, Michigan |
ü |
|||
Data processing and operations center (Easton) |
Columbus, Ohio |
ü |
|||
Data processing and operations center (Northland) |
Columbus, Ohio |
ü |
|||
Data processing and operations center (Parma) |
Cleveland, Ohio |
ü |
|||
8 story office building |
Indianapolis, Indiana |
ü |
|||
Item 3: Legal Proceedings
Information required by this item is set forth in Note 20 of the Notes to Consolidated Financial Statements under the caption "Litigation" and is incorporated into this Item by reference.
25
Item 4: Mine Safety Disclosures
Not applicable.
PART II
Item 5: Market for Registrant’s Common Equity, Related Shareholder Matters and Issuer Purchases of Equity Securities
The common stock of Huntington Bancshares Incorporated is traded on the NASDAQ Stock Market under the symbol “HBAN”. The stock is listed as “HuntgBcshr” or “HuntBanc” in most newspapers. As of January 31, 2016, we had 26,750 shareholders of record.
Information regarding the high and low sale prices of our common stock and cash dividends declared on such shares, as required by this Item, is set forth in Tables 45 and 47 - Selected Quarterly Income Statement Data and is incorporated into this Item by reference. Information regarding restrictions on dividends, as required by this Item, is set forth in Item 1: Business - Regulatory Matters and in Note 21 of the Notes to Consolidated Financial Statements and incorporated into this Item by reference.
The following graph shows the changes, over the five-year period, in the value of $100 invested in (i) shares of Huntington’s Common Stock; (ii) the Standard & Poor’s 500 Stock Index (the “S&P 500 Index”) and (iii) Keefe, Bruyette & Woods Bank Index (the “KBW Bank Index”), for the period December 31, 2010, through December 31, 2015. The KBW Bank Index is a market capitalization-weighted bank stock index published by Keefe, Bruyette & Woods. The index is composed of the largest banking companies and includes all money center banks and regional banks, including Huntington. An investment of $100 on December 31, 2010, and the reinvestment of all dividends, are assumed. The plotted points represent the closing price on the last trading day of the fiscal year indicated.
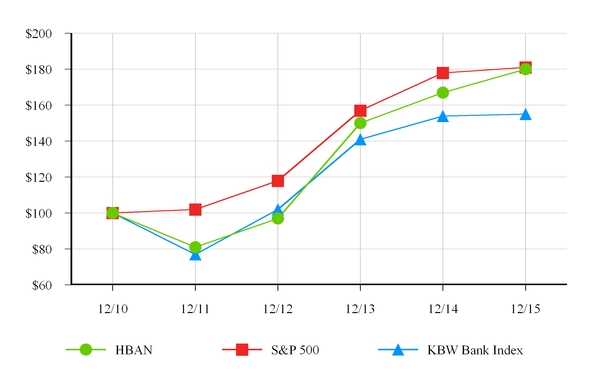
2010 |
2011 |
2012 |
2013 |
2014 |
2015 |
||||||
HBAN |
$100 |
$81 |
$97 |
$150 |
$167 |
$180 |
|||||
S&P 500 |
$100 |
$102 |
$118 |
$157 |
$178 |
$181 |
|||||
KBW Bank Index |
$100 |
$77 |
$102 |
$141 |
$154 |
$155 |
|||||
For information regarding securities authorized for issuance under Huntington's equity compensation plans, see Part III, Item 12.
The following table provides information regarding Huntington’s purchases of its Common Stock during the three-month period ended December 31, 2015:
26
Period |
Total Number
of Shares
Purchased (1)
|
Average
Price Paid
Per Share
|
Maximum Number of Shares (or
Approximate Dollar Value) that
May Yet Be Purchased Under
the Plans or Programs (2)
|
|||||||
October 1, 2015 to October 31, 2015 |
205,067 |
$ |
10.33 |
$ |
192,778,303 |
|||||
November 1, 2015 to November 30, 2015 |
1,710,500 |
11.69 |
172,782,558 |
|||||||
December 1, 2015 to December 31, 2015 |
574,000 |
11.74 |
166,043,798 |
|||||||
Total |
2,489,567 |
$ |
11.59 |
$ |
166,043,798 |
|||||
(1) |
The reported shares were repurchased pursuant to Huntington’s publicly announced stock repurchase authorization. |
(2) |
The number shown represents, as of the end of each period, the maximum number of shares (approximate dollar value) of Common Stock that may yet be purchased under publicly announced stock repurchase authorizations. |
On March 11, 2015, Huntington announced that the Federal Reserve did not object to the proposed capital actions included in Huntington’s capital plan submitted to the Federal Reserve in January 2015. These actions included a potential repurchase of up to $366 million of common stock from the second quarter of 2015 through the second quarter of 2016. Purchases of common stock may include open market purchases, privately negotiated transactions, and accelerated repurchase programs. Huntington’s board of directors authorized a share repurchase program consistent with Huntington’s capital plan. This program replaced the previously authorized share repurchase program authorized by Huntington’s board of directors in 2014.
On January 26, 2016, Huntington announced the signing of a definitive merger agreement under which Ohio-based FirstMerit Corporation, the parent company of FirstMerit Bank, will merge into Huntington in a stock and cash transaction. The transaction is expected to be completed in the 2016 third quarter, subject to the satisfaction of customary closing conditions, including regulatory approvals and the approval of the shareholders of Huntington and FirstMerit Corporation. As a result, Huntington no longer has the intent to repurchase shares under the current authorization.
27
Item 6: Selected Financial Data | |||||||||||||||||||
Table 1 - Selected Financial Data (1) | |||||||||||||||||||
(dollar amounts in thousands, except per share amounts) | |||||||||||||||||||
Year Ended December 31, |
|||||||||||||||||||
2015 |
2014 |
2013 |
2012 |
2011 |
|||||||||||||||
Interest income |
$ |
2,114,521 |
$ |
1,976,462 |
$ |
1,860,637 |
$ |
1,930,263 |
$ |
1,970,226 |
|||||||||
Interest expense |
163,784 |
139,321 |
156,029 |
219,739 |
341,056 |
||||||||||||||
Net interest income |
1,950,737 |
1,837,141 |
1,704,608 |
1,710,524 |
1,629,170 |
||||||||||||||
Provision for credit losses |
99,954 |
80,989 |
90,045 |
147,388 |
174,059 |
||||||||||||||
Net interest income after provision for credit losses |
1,850,783 |
1,756,152 |
1,614,563 |
1,563,136 |
1,455,111 |
||||||||||||||
Noninterest income |
1,038,730 |
979,179 |
1,012,196 |
1,106,321 |
992,317 |
||||||||||||||
Noninterest expense |
1,975,908 |
1,882,346 |
1,758,003 |
1,835,876 |
1,728,500 |
||||||||||||||
Income before income taxes |
913,605 |
852,985 |
868,756 |
833,581 |
718,928 |
||||||||||||||
Provision for income taxes |
220,648 |
220,593 |
227,474 |
202,291 |
172,555 |
||||||||||||||
Net income |
692,957 |
632,392 |
641,282 |
631,290 |
546,373 |
||||||||||||||
Dividends on preferred shares |
31,873 |
31,854 |
31,869 |
31,989 |
30,813 |
||||||||||||||
Net income applicable to common shares |
$ |
661,084 |
$ |
600,538 |
$ |
609,413 |
$ |
599,301 |
$ |
515,560 |
|||||||||
Net income per common share—basic |
$ |
0.82 |
$ |
0.73 |
$ |
0.73 |
$ |
0.70 |
$ |
0.60 |
|||||||||
Net income per common share—diluted |
0.81 |
0.72 |
0.72 |
0.69 |
0.59 |
||||||||||||||
Cash dividends declared per common share |
0.25 |
0.21 |
0.19 |
0.16 |
0.10 |
||||||||||||||
Balance sheet highlights |
|||||||||||||||||||
Total assets (period end) |
$ |
71,044,551 |
$ |
66,298,010 |
$ |
59,467,174 |
$ |
56,141,474 |
$ |
54,448,673 |
|||||||||
Total long-term debt (period end) |
7,067,614 |
4,335,962 |
2,458,272 |
1,364,834 |
2,747,857 |
||||||||||||||
Total shareholders’ equity (period end) |
6,594,606 |
6,328,170 |
6,090,153 |
5,778,500 |
5,416,121 |
||||||||||||||
Average total assets |
68,580,526 |
62,498,880 |
56,299,313 |
55,673,599 |
53,750,054 |
||||||||||||||
Average total long-term debt |
5,605,960 |
3,494,987 |
1,670,502 |
1,986,612 |
3,182,899 |
||||||||||||||
Average total shareholders’ equity |
6,536,018 |
6,269,884 |
5,914,914 |
5,671,455 |
5,237,541 |
||||||||||||||
Key ratios and statistics |
|||||||||||||||||||
Margin analysis—as a % of average earnings assets |
|||||||||||||||||||
Interest income(2) |
3.41 |
% |
3.47 |
% |
3.66 |
% |
3.85 |
% |
4.09 |
% |
|||||||||
Interest expense |
0.26 |
0.24 |
0.30 |
0.44 |
0.71 |
||||||||||||||
Net interest margin(2) |
3.15 |
% |
3.23 |
% |
3.36 |
% |
3.41 |
% |
3.38 |
% |
|||||||||
Return on average total assets |
1.01 |
% |
1.01 |
% |
1.14 |
% |
1.13 |
% |
1.02 |
% |
|||||||||
Return on average common shareholders’ equity |
10.7 |
10.2 |
11.0 |
11.3 |
10.6 |
||||||||||||||
Return on average tangible common shareholders’ equity(3), (7) |
12.4 |
11.8 |
12.7 |
13.3 |
12.8 |
||||||||||||||
Efficiency ratio(4) |
64.5 |
65.1 |
62.6 |
63.2 |
63.5 |
||||||||||||||
Dividend payout ratio |
30.5 |
28.8 |
26.0 |
22.9 |
16.7 |
||||||||||||||
Average shareholders’ equity to average assets |
9.53 |
10.03 |
10.51 |
10.19 |
9.74 |
||||||||||||||
Effective tax rate |
24.2 |
25.9 |
26.2 |
24.3 |
24.0 |
||||||||||||||
Non-regulatory capital |
|||||||||||||||||||
Tangible common equity to tangible assets (period end) (5), (7) |
7.81 |
8.17 |
8.82 |
8.74 |
8.30 |
||||||||||||||
Tangible equity to tangible assets (period end)(6), (7) |
8.36 |
8.76 |
9.47 |
9.44 |
9.01 |
||||||||||||||
Tier 1 common risk-based capital ratio (period end)(7), (8) |
N.A. |
10.23 |
10.90 |
10.48 |
10.00 |
||||||||||||||
Tier 1 leverage ratio (period end)(9), (10) |
N.A. |
9.74 |
10.67 |
10.36 |
10.28 |
||||||||||||||
Tier 1 risk-based capital ratio (period end)(9), (10) |
N.A. |
11.50 |
12.28 |
12.02 |
12.11 |
||||||||||||||
Total risk-based capital ratio (period end)(9), (10) |
N.A. |
13.56 |
14.57 |
14.50 |
14.77 |
||||||||||||||
Capital under current regulatory standards (Basel III) |
|||||||||||||||||||
Common equity tier 1 risk-based capital ratio |
9.79 |
N.A. |
N.A. |
N.A. |
N.A. |
||||||||||||||
Tier 1 leverage ratio (period end) |
8.79 |
N.A. |
N.A. |
N.A. |
N.A. |
||||||||||||||
Tier 1 risk-based capital ratio (period end) |
10.53 |
N.A. |
N.A. |
N.A. |
N.A. |
||||||||||||||
Total risk-based capital ratio (period end) |
12.64 |
N.A. |
N.A. |
N.A. |
N.A. |
||||||||||||||
Other data |
|||||||||||||||||||
Full-time equivalent employees (average) |
12,243 |
11,873 |
11,964 |
11,494 |
11,398 |
||||||||||||||
Domestic banking offices (period end) |
777 |
729 |
711 |
705 |
668 |
||||||||||||||
28
(1) |
Comparisons for presented periods are impacted by a number of factors. Refer to the Significant Items for additional discussion regarding these key factors. |
(2) |
On an FTE basis assuming a 35% tax rate. |
(3) |
Net income applicable to common shares excluding expense for amortization of intangibles for the period divided by average tangible shareholders’ equity. Average tangible shareholders’ equity equals average total shareholders’ equity less average intangible assets and goodwill. Expense for amortization of intangibles and average intangible assets are net of deferred tax liability, and calculated assuming a 35% tax rate. |
(4) |
Noninterest expense less amortization of intangibles divided by the sum of FTE net interest income and noninterest income excluding securities gains. |
(5) |
Tangible common equity (total common equity less goodwill and other intangible assets) divided by tangible assets (total assets less goodwill and other intangible assets). Other intangible assets are net of deferred tax and calculated assuming a 35% tax rate. |
(6) |
Tangible equity (total equity less goodwill and other intangible assets) divided by tangible assets (total assets less goodwill and other intangible assets). Other intangible assets are net of deferred tax and calculated assuming a 35% tax rate. |
(7) |
Tier 1 common equity, tangible equity, tangible common equity, and tangible assets are non-GAAP financial measures. Additionally, any ratios utilizing these financial measures are also non-GAAP. These financial measures have been included as they are considered to be critical metrics with which to analyze and evaluate financial condition and capital strength. Other companies may calculate these financial measures differently. |
(8) |
In accordance with applicable regulatory reporting guidance, we are not required to retrospectively update historical filings for newly adopted accounting principles. Therefore, tier 1 capital, tier 1 common equity, and risk-weighted assets have not been updated for the adoption of ASU 2014-01. |
(9) |
In accordance with applicable regulatory reporting guidance, we are not required to retrospectively update historical filings for newly adopted accounting principles. Therefore, regulatory capital data has not been updated for the adoption of ASU 2014-01. |
(10) |
Ratios are calculated on the Basel I basis. |
N.A. |
On January 1, 2015, we became subject to the Basel III capital requirements and the standardized approach for calculating risk-weighted assets in accordance with subpart D of the final capital rule. |
29
Item 7: Management’s Discussion and Analysis of Financial Condition and Results of Operations
INTRODUCTION
We are a multi-state diversified regional bank holding company organized under Maryland law in 1966 and headquartered in Columbus, Ohio. Through the Bank, we have 150 years of servicing the financial needs of our customers. Through our subsidiaries, we provide full-service commercial and consumer banking services, mortgage banking services, automobile financing, equipment leasing, investment management, trust services, brokerage services, insurance service programs, and other financial products and services. Our 777 branches and private client group offices are located in Ohio, Michigan, Pennsylvania, Indiana, West Virginia, and Kentucky. Selected financial services and other activities are also conducted in various other states. International banking services are available through the headquarters office in Columbus, Ohio and a limited purpose office located in the Cayman Islands. Our foreign banking activities, in total or with any individual country, are not significant.
This MD&A provides information we believe necessary for understanding our financial condition, changes in financial condition, results of operations, and cash flows. The MD&A should be read in conjunction with the Consolidated Financial Statements, Notes to Consolidated Financial Statements, and other information contained in this report. The forward-looking statements in this section and other parts of this report involve assumptions, risks, uncertainties, and other factors, including statements regarding our plans, objectives, goals, strategies, and financial performance. Our actual results could differ materially from the results anticipated in these forward-looking statements as result of factors set forth under the caption "Forward-Looking Statements" and those set forth in Item 1A.
Our discussion is divided into key segments:
• |
Executive Overview – Provides a summary of our current financial performance and business overview, including our thoughts on the impact of the economy, legislative and regulatory initiatives, and recent industry developments. This section also provides our outlook regarding our expectations for the next several quarters.
|
• |
Discussion of Results of Operations – Reviews financial performance from a consolidated Company perspective. It also includes a Significant Items section that summarizes key issues helpful for understanding performance trends. Key consolidated average balance sheet and income statement trends are also discussed in this section.
|
• |
Risk Management and Capital – Discusses credit, market, liquidity, operational, and compliance risks, including how these are managed, as well as performance trends. It also includes a discussion of liquidity policies, how we obtain funding, and related performance. In addition, there is a discussion of guarantees and/or commitments made for items such as standby letters of credit and commitments to sell loans, and a discussion that reviews the adequacy of capital, including regulatory capital requirements.
|
• |
Business Segment Discussion – Provides an overview of financial performance for each of our major business segments and provides additional discussion of trends underlying consolidated financial performance.
|
• |
Results for the Fourth Quarter – Provides a discussion of results for the 2015 fourth quarter compared with the 2014 fourth quarter.
|
• |
Additional Disclosures – Provides comments on important matters including forward-looking statements, critical accounting policies and use of significant estimates, and recent accounting pronouncements and developments.
|
A reading of each section is important to understand fully the nature of our financial performance and prospects.
EXECUTIVE OVERVIEW
2015 Financial Performance Review
In 2015, we reported net income of $693 million, or a 10% increase from the prior year. Earnings per common share for the year were $0.81, up 13% from the prior year. This resulted in a 1.01% return on average assets and a 12.4% return on average tangible common equity. In addition, we grew our base of consumer and business customers as we increased 2015 average earning assets by $5.3 billion, or 9%, over the prior year. Our strategic business investments and OCR sales approach continued to generate positive results in 2015. (Also, see Significant Items Influencing Financial Performance Comparisons within the Discussion of Results of Operations.)
Fully-taxable equivalent net interest income was $2.0 billion in 2015, an increase of $118 million, or 6%, compared with 2014. This reflected the impact of 9% earning asset growth, 7% interest-bearing liability growth, and an 8 basis point decrease in the NIM to 3.15%. The earning asset growth reflected a $3.2 billion, or 7%, increase in average loans and leases and a $1.8 billion, or 15%, increase in average securities. The increase in average loans and leases primarily reflected growth in C&I related to the acquisition of Huntington Technology Finance and automobile loans, as originations remained strong. The increase in average securities primarily reflected the additional investment in LCR Level 1 qualifying securities and the ongoing origination of direct purchase municipal instruments. The increase in interest-bearing liabilities primarily reflected growth in money market deposits related to continued
30
banker focus across all segments on obtaining our customers' full deposit relationship, an increase in total debt related to the issuance of bank-level senior debt during 2015, and an increase in brokered deposits and negotiated CDs, which were used to efficiently finance balance sheet growth while continuing to manage the overall cost of funds. This was partially offset by a decrease in average core certificates of deposit due to the strategic focus on changing the funding sources to low and no cost demand deposits and money market deposits. The NIM contraction reflected a 6 basis point decrease related to the mix and yield of earning assets and a 3 basis point increase in funding costs, partially offset by the 1 basis point increase in the benefit to the margin from the impact of noninterest-bearing funds.
Overall asset quality remains strong, with modest volatility based on the absolute low level of problem credits. The provision for credit losses was $100 million in 2015, an increase of $19 million, or 23%, compared with 2014. NALs increased $71 million, or 24%, from the prior year to $372 million, or 0.74% of total loans and leases. The increase was centered in the Commercial portfolio and was comprised of several large oil and gas exploration and production relationships. NPAs increased $61 million, or 18%, from the prior year to $399 million, or 0.79% of total loans and leases and net OREO. NCOs decreased $37 million, or 30%, from the prior year to $88 million. NCOs represented an annualized 0.18% of average loans and leases in the current year compared to 0.27% in 2014. We continue to be pleased with the net charge-off performance across the entire portfolio, as we remain below our targeted range. Overall consumer credit metrics, led by the Home Equity portfolio, continue to show an improving trend, while the commercial portfolios continue to experience some quarter-to-quarter volatility based on the absolute low level of problem loans. ACL as a percentage of total loans and leases decreased to 1.33% from 1.40% a year ago, while the ACL as a percentage of period-end total NALs decreased to 180% from 222%. Management believes the level of the ACL is appropriate given the current composition of the overall loan and lease portfolio.
Noninterest income was $1.0 billion in 2015, an increase of $60 million, or 6%, compared with 2014. This reflected an increase in cards and payment processing income, mortgage banking income, and gain on sale of loans. Cards and payment processing income increased due to higher card related income and underlying customer growth. The increase in mortgage banking income was primarily driven by a $33 million, or 58%, increase in origination and secondary marketing revenue. Gain on sale of loans increased due to an automobile loan securitization during 2015. These increases were partially offset by a decrease in securities gains and trust services. In 2014, we adjusted the mix of our securities portfolio to prepare for the LCR requirements, which resulted in securities gains. The decrease in trust services primarily related to our fiduciary trust businesses moving to a more open architecture platform and a decline in assets under management in proprietary mutual funds. During the 2015 fourth quarter, Huntington sold HAA, HASI, and Unified.
Noninterest expense was $2.0 billion in 2015, an increase of $94 million, or 5%, compared with 2014. This reflected an increase in personnel costs, other expense, and outside data processing and other services. Personnel costs increased primarily due to an increase in salaries related to annual merit increases, the addition of Huntington Technology Finance, and a 3% increase in the number of average full-time equivalent employees, largely related to the build-out of the in-store strategy. Other noninterest expense increased due to an increase in operating lease expense related to Huntington Technology Finance. Outside data processing and other services increased, primarily reflecting higher debit and credit card processing costs and increased other technology investment expense, as we continue to invest in technology supporting our products, services, and our Continuous Improvement initiatives. These increases were partially offset by a decrease in amortization of intangibles reflecting the full amortization of the core deposit intangible from the Sky Financial acquisition.
The tangible common equity to tangible assets ratio at December 31, 2015, was 7.81%, down 36 basis points from a year ago. On a Basel III basis, the regulatory CET1 risk-based capital ratio was 9.79% at December 31, 2015, and the regulatory tier 1 risk-based capital ratio was 10.53%. On a Basel I basis, the tier 1 common risk-based capital ratio was 10.23% at December 31, 2014, and the regulatory tier 1 risk-based capital ratio was 11.50%. All capital ratios were impacted by the repurchase of 23.0 million common shares over the last four quarters. During the 2015 fourth quarter, the Company repurchased 2.5 million common shares at an average price of $11.59 per share under the $366 million repurchase authorization included in the 2015 CCAR capital plan.
Business Overview
General
Our general business objectives are: (1) grow net interest income and fee income, (2) deliver positive operating leverage, (3) increase primary relationships across all business segments, (4) continue to strengthen risk management, and (5) maintain capital and liquidity positions consistent with our risk appetite.
We are pleased with our 2015 performance. We delivered full-year revenue growth, disciplined expense control, strong net income, and EPS growth for our shareholders. Our consistent execution of disciplined lending and investment within a risk-balanced environment continues to pay off. We also took proactive steps to better position the Company moving into 2016 by investing in key growth drivers, such as technology and our in-store strategy, while exiting some non-core businesses. Furthermore, the finalization of our in-store branch expansion is also visibly supporting our deposit and loan growth.
31
Economy
Our small and medium sized commercial customers continue to express confidence in their businesses, while consumers continue to benefit from recovering real estate markets, low energy prices, and early signs of wage inflation in certain markets. The auto industry is an important component of the economy in our footprint, and it appears poised for another good year in 2016. Other industries that contribute meaningfully to the regional economy, such as health care, medical devices and medical technology, and higher education, among others, also remain positive. Conversely, the low energy prices have negatively impacted certain sectors of the energy industry, including oil exploration and production firms.
The state leading economic indices, as reported by the Federal Reserve Bank of Philadelphia for our six state footprint, are all projected to be positive over the next six months, including West Virginia, which had been hard hit of late from the impact of declining coal prices.
Unemployment rates in our footprint states continue to trend positively and most remain in line with or better than the national average. There is also a positive trend for our ten largest deposit markets, which collectively account for more than 80% of our total deposit franchise. Almost all of these markets continue to trend favorably, and seven of the ten markets currently have unemployment rates below the national average.
Legislative and Regulatory
A comprehensive discussion of legislative and regulatory matters affecting us can be found in the Regulatory Matters section included in Item 1 of this Form 10-K.
2016 Expectations
We are well positioned starting the new year. We continue to budget for unchanged interest rates through 2016. We will continue to execute our core strategies to deepen and grow customer relationships while carefully managing expenses to stay on course for 2016 performance.
Excluding Significant Items and net MSR activity, we expect full-year revenue growth will be consistent with our long-term financial goal of 4-6%. While continuing to proactively invest in the franchise, we will manage the expense base to reflect the revenue environment.
Overall, asset quality metrics are expected to remain near current levels, although moderate quarterly volatility also is expected, given the quickly evolving macroeconomic conditions, commodities, and currency market volatility. Although we expect a gradual return to normalized credit costs, we anticipate NCOs will remain below our long-term normalized range of 35 to 55 basis points.
The effective tax rate for 2016 is expected to be in the range of 25% to 28%.
Pending Acquisition of FirstMerit Corporation
On January 26, 2016, Huntington announced the signing of a definitive merger agreement under which Ohio-based FirstMerit Corporation, the parent company of FirstMerit Bank, will merge into Huntington in a stock and cash transaction expected to be valued at approximately $3.4 billion based on the closing stock price on the day preceding the announcement. FirstMerit Corporation is a diversified financial services company headquartered in Akron, Ohio, which reported assets of approximately $25.5 billion based on their December 31, 2015 unaudited balance sheet, and 366 banking offices and 400 ATM locations in Ohio, Michigan, Wisconsin, Illinois, and Pennsylvania. First Merit Corporation provides a complete range of banking and other financial services to consumers and businesses through its core operations. Principal affiliates include: FirstMerit Bank, N.A. and First Merit Mortgage Corporation.
Under the terms of the agreement, shareholders of FirstMerit Corporation will receive 1.72 shares of Huntington common stock and $5.00 in cash for each share of FirstMerit Corporation common stock. The transaction is expected to be completed in the 2016 third quarter, subject to the satisfaction of customary closing conditions, including regulatory approvals and the approval of the shareholders of Huntington and FirstMerit Corporation.
32
Table 2 - Selected Annual Income Statements(1) | |||||||||||||||||||||||||
(dollar amounts in thousands, except per share amounts) | |||||||||||||||||||||||||
Year Ended December 31, |
|||||||||||||||||||||||||
Change from 2014 |
Change from 2013 |
||||||||||||||||||||||||
2015 |
Amount |
Percent |
2014 |
Amount |
Percent |
2013 |
|||||||||||||||||||
Interest income |
$ |
2,114,521 |
$ |
138,059 |
7 |
% |
$ |
1,976,462 |
$ |
115,825 |
6 |
% |
$ |
1,860,637 |
|||||||||||
Interest expense |
163,784 |
24,463 |
18 |
139,321 |
(16,708 |
) |
(11 |
) |
156,029 |
||||||||||||||||
Net interest income |
1,950,737 |
113,596 |
6 |
1,837,141 |
132,533 |
8 |
1,704,608 |
||||||||||||||||||
Provision for credit losses |
99,954 |
18,965 |
23 |
80,989 |
(9,056 |
) |
(10 |
) |
90,045 |
||||||||||||||||
Net interest income after provision for credit losses |
1,850,783 |
94,631 |
5 |
1,756,152 |
141,589 |
9 |
1,614,563 |
||||||||||||||||||
Service charges on deposit accounts |
280,349 |
6,608 |
2 |
273,741 |
1,939 |
1 |
271,802 |
||||||||||||||||||
Cards and payment processing income |
142,715 |
37,314 |
35 |
105,401 |
12,810 |
14 |
92,591 |
||||||||||||||||||
Mortgage banking income |
111,853 |
26,966 |
32 |
84,887 |
(41,968 |
) |
(33 |
) |
126,855 |
||||||||||||||||
Trust services |
105,833 |
(10,139 |
) |
(9 |
) |
115,972 |
(7,035 |
) |
(6 |
) |
123,007 |
||||||||||||||
Insurance income |
65,264 |
(209 |
) |
— |
65,473 |
(3,791 |
) |
(5 |
) |
69,264 |
|||||||||||||||
Brokerage income |
60,205 |
(8,072 |
) |
(12 |
) |
68,277 |
(1,347 |
) |
(2 |
) |
69,624 |
||||||||||||||
Capital markets fees |
53,616 |
9,885 |
23 |
43,731 |
(1,489 |
) |
(3 |
) |
45,220 |
||||||||||||||||
Bank owned life insurance income |
52,400 |
(4,648 |
) |
(8 |
) |
57,048 |
629 |
1 |
56,419 |
||||||||||||||||
Gain on sale of loans |
33,037 |
11,946 |
57 |
21,091 |
2,920 |
16 |
18,171 |
||||||||||||||||||
Securities gains (losses) |
744 |
(16,810 |
) |
(96 |
) |
17,554 |
17,136 |
4,100 |
418 |
||||||||||||||||
Other income |
132,714 |
6,710 |
5 |
126,004 |
(12,821 |
) |
(9 |
) |
138,825 |
||||||||||||||||
Total noninterest income |
1,038,730 |
59,551 |
6 |
979,179 |
(33,017 |
) |
(3 |
) |
1,012,196 |
||||||||||||||||
Personnel costs |
1,122,182 |
73,407 |
7 |
1,048,775 |
47,138 |
5 |
1,001,637 |
||||||||||||||||||
Outside data processing and other services |
231,353 |
18,767 |
9 |
212,586 |
13,039 |
7 |
199,547 |
||||||||||||||||||
Equipment |
124,957 |
5,294 |
4 |
119,663 |
12,870 |
12 |
106,793 |
||||||||||||||||||
Net occupancy |
121,881 |
(6,195 |
) |
(5 |
) |
128,076 |
2,732 |
2 |
125,344 |
||||||||||||||||
Marketing |
52,213 |
1,653 |
3 |
50,560 |
(625 |
) |
(1 |
) |
51,185 |
||||||||||||||||
Professional services |
50,291 |
(9,264 |
) |
(16 |
) |
59,555 |
18,968 |
47 |
40,587 |
||||||||||||||||
Deposit and other insurance expense |
44,609 |
(4,435 |
) |
(9 |
) |
49,044 |
(1,117 |
) |
(2 |
) |
50,161 |
||||||||||||||
Amortization of intangibles |
27,867 |
(11,410 |
) |
(29 |
) |
39,277 |
(2,087 |
) |
(5 |
) |
41,364 |
||||||||||||||
Other expense |
200,555 |
25,745 |
15 |
174,810 |
33,425 |
24 |
141,385 |
||||||||||||||||||
Total noninterest expense |
1,975,908 |
93,562 |
5 |
1,882,346 |
124,343 |
7 |
1,758,003 |
||||||||||||||||||
Income before income taxes |
913,605 |
60,620 |
7 |
852,985 |
(15,771 |
) |
(2 |
) |
868,756 |
||||||||||||||||
Provision for income taxes |
220,648 |
55 |
— |
220,593 |
(6,881 |
) |
(3 |
) |
227,474 |
||||||||||||||||
Net income |
692,957 |
60,565 |
10 |
632,392 |
(8,890 |
) |
(1 |
) |
641,282 |
||||||||||||||||
Dividends on preferred shares |
31,873 |
19 |
— |
31,854 |
(15 |
) |
— |
31,869 |
|||||||||||||||||
Net income applicable to common shares |
$ |
661,084 |
$ |
60,546 |
10 |
% |
$ |
600,538 |
$ |
(8,875 |
) |
(1 |
)% |
$ |
609,413 |
||||||||||
Average common shares—basic |
803,412 |
(16,505 |
) |
(2 |
)% |
819,917 |
(14,288 |
) |
(2 |
)% |
834,205 |
||||||||||||||
Average common shares—diluted |
817,129 |
(15,952 |
) |
(2 |
) |
833,081 |
(10,893 |
) |
(1 |
) |
843,974 |
||||||||||||||
Per common share: |
|||||||||||||||||||||||||
Net income—basic |
$ |
0.82 |
$ |
0.09 |
12 |
% |
$ |
0.73 |
$ |
— |
— |
% |
$ |
0.73 |
|||||||||||
Net income—diluted |
0.81 |
0.09 |
13 |
0.72 |
— |
— |
0.72 |
||||||||||||||||||
Cash dividends declared |
0.25 |
0.04 |
19 |
0.21 |
0.02 |
11 |
0.19 |
||||||||||||||||||
Revenue—FTE |
|||||||||||||||||||||||||
Net interest income |
$ |
1,950,737 |
$ |
113,596 |
6 |
% |
$ |
1,837,141 |
$ |
132,533 |
8 |
% |
$ |
1,704,608 |
|||||||||||
FTE adjustment |
32,115 |
4,565 |
17 |
27,550 |
210 |
1 |
27,340 |
||||||||||||||||||
Net interest income(2)
|
1,982,852 |
118,161 |
6 |
1,864,691 |
132,743 |
8 |
1,731,948 |
||||||||||||||||||
Noninterest income |
1,038,730 |
59,551 |
6 |
979,179 |
(33,017 |
) |
(3 |
) |
1,012,196 |
||||||||||||||||
Total revenue(2)
|
$ |
3,021,582 |
$ |
177,712 |
6 |
% |
$ |
2,843,870 |
$ |
99,726 |
4 |
% |
$ |
2,744,144 |
|||||||||||
(1) |
Comparisons for presented periods are impacted by a number of factors. Refer to “Significant Items”. |
(2) |
On a fully-taxable equivalent (FTE) basis assuming a 35% tax rate. |
33
DISCUSSION OF RESULTS OF OPERATIONS
This section provides a review of financial performance from a consolidated perspective. It also includes a “Significant Items” section (See Non-GAAP Financial Measures) that summarizes key issues important for a complete understanding of performance trends. Key consolidated balance sheet and income statement trends are discussed. All earnings per share data are reported on a diluted basis. For additional insight on financial performance, please read this section in conjunction with the “Business Segment Discussion.”
Significant Items
Earnings comparisons among the three years ended December 31, 2015, 2014, and 2013 were impacted by a number of Significant Items summarized below.
1. |
Litigation Reserve. $38 million and $21 million of net additions to litigation reserves were recorded as other noninterest expense in 2015 and 2014, respectively. This resulted in a negative impact of $0.03 and $0.02 per common share in 2015 and 2014, respectively.
|
2. |
Mergers and Acquisitions. Significant events relating to mergers and acquisitions, and the impacts of those events on our reported results, were as follows:
|
• |
During 2015, $9 million of noninterest expense was recorded related to the acquisition of Macquarie Equipment Finance, which was rebranded Huntington Technology Finance. Also during 2015, $4 million of noninterest expense and $3 million of noninterest income was recorded related to the sale of HAA, HASI, and Unified. This resulted in a negative impact of $0.01 per common share in 2015. |
• |
During 2014, $16 million of net noninterest expense was recorded related to the acquisition of 24 Bank of America branches and Camco Financial. This resulted in a net negative impact of $0.01 per common share in 2014. |
3. |
Franchise Repositioning Related Expense. Significant events relating to franchise repositioning, and the impacts of those events on our reported results, were as follows:
|
• |
During 2015, $8 million of franchise repositioning related expense was recorded. This resulted in a negative impact of $0.01 per common share in 2015. |
• |
During 2014, $28 million of franchise repositioning related expense was recorded. This resulted in a negative impact of $0.02 per common share in 2014. |
• |
During 2013, $23 million of franchise repositioning related expense was recorded. This resulted in a negative impact of $0.02 per common share in 2013. |
4. |
Pension Curtailment Gain. During 2013, a $34 million pension curtailment gain was recorded in personnel costs. This resulted in a positive impact of $0.03 per common share in 2013.
|
The following table reflects the earnings impact of the above-mentioned Significant Items for periods affected by this Results of Operations discussion:
Table 3 - Significant Items Influencing Earnings Performance Comparison | |||||||||||||||||||||||
(dollar amounts in thousands, except per share amounts) | |||||||||||||||||||||||
2015 |
2014 |
2013 |
|||||||||||||||||||||
After-tax |
EPS |
After-tax |
EPS |
After-tax |
EPS |
||||||||||||||||||
Net income—GAAP |
$ |
692,957 |
$ |
632,392 |
$ |
641,282 |
|||||||||||||||||
Earnings per share, after-tax |
$ |
0.81 |
$ |
0.72 |
$ |
0.72 |
|||||||||||||||||
Significant items—favorable (unfavorable) impact: |
Earnings (1) |
EPS (2)(3) |
Earnings (1) |
EPS (2)(3) |
Earnings (1) |
EPS (2)(3) |
|||||||||||||||||
Net additions to litigation reserve |
$ |
(38,186 |
) |
$ |
(0.03 |
) |
$ |
(20,909 |
) |
$ |
(0.02 |
) |
$ |
— |
$ |
— |
|||||||
Mergers and acquisitions, net |
(9,323 |
) |
(0.01 |
) |
(15,818 |
) |
(0.01 |
) |
— |
— |
|||||||||||||
Franchise repositioning related expense |
(7,588 |
) |
(0.01 |
) |
(27,976 |
) |
(0.02 |
) |
(23,461 |
) |
(0.02 |
) |
|||||||||||
Pension curtailment gain |
— |
— |
— |
— |
33,926 |
0.03 |
|||||||||||||||||
34
(1) |
Pretax unless otherwise noted. |
(2) |
Based upon the annual average outstanding diluted common shares. |
(3) |
After-tax. |
Net Interest Income / Average Balance Sheet
Our primary source of revenue is net interest income, which is the difference between interest income from earning assets (primarily loans, securities, and direct financing leases), and interest expense of funding sources (primarily interest-bearing deposits and borrowings). Earning asset balances and related funding sources, as well as changes in the levels of interest rates, impact net interest income. The difference between the average yield on earning assets and the average rate paid for interest-bearing liabilities is the net interest spread. Noninterest-bearing sources of funds, such as demand deposits and shareholders’ equity, also support earning assets. The impact of the noninterest-bearing sources of funds, often referred to as “free” funds, is captured in the net interest margin, which is calculated as net interest income divided by average earning assets. Both the net interest margin and net interest spread are presented on a fully-taxable equivalent basis, which means that tax-free interest income has been adjusted to a pretax equivalent income, assuming a 35% tax rate.
The following table shows changes in fully-taxable equivalent interest income, interest expense, and net interest income due to volume and rate variances for major categories of earning assets and interest-bearing liabilities:
Table 4 - Change in Net Interest Income Due to Changes in Average Volume and Interest Rates (1) | |||||||||||||||||||||||
(dollar amounts in millions)
| |||||||||||||||||||||||
2015 |
2014 |
||||||||||||||||||||||
|
Increase (Decrease) From
Previous Year Due To
|
Increase (Decrease) From
Previous Year Due To
|
||||||||||||||||||||||
Fully-taxable equivalent basis(2)
|
Volume |
Yield/
Rate
|
Total |
Volume |
Yield/
Rate
|
Total |
|||||||||||||||||
Loans and leases |
$ |
117.6 |
$ |
(35.1 |
) |
$ |
82.5 |
$ |
136.7 |
$ |
(94.5 |
) |
$ |
42.2 |
|||||||||
Investment securities |
45.8 |
3.2 |
49.0 |
69.7 |
10.2 |
79.9 |
|||||||||||||||||
Other earning assets |
10.4 |
0.7 |
11.1 |
(6.3 |
) |
0.2 |
(6.1 |
) |
|||||||||||||||
Total interest income from earning assets |
173.8 |
(31.2 |
) |
142.6 |
200.1 |
(84.1 |
) |
116.0 |
|||||||||||||||
Deposits |
5.6 |
(9.9 |
) |
(4.3 |
) |
5.2 |
(35.0 |
) |
(29.8 |
) |
|||||||||||||
Short-term borrowings |
(1.6 |
) |
0.3 |
(1.3 |
) |
1.5 |
— |
1.5 |
|||||||||||||||
Long-term debt |
30.1 |
— |
30.1 |
30.1 |
(18.5 |
) |
11.6 |
||||||||||||||||
Total interest expense of interest-bearing liabilities |
34.1 |
(9.6 |
) |
24.5 |
36.8 |
(53.5 |
) |
(16.7 |
) |
||||||||||||||
Net interest income |
$ |
139.7 |
$ |
(21.6 |
) |
$ |
118.1 |
$ |
163.3 |
$ |
(30.6 |
) |
$ |
132.7 |
|||||||||
(1) |
The change in interest rates due to both rate and volume has been allocated between the factors in proportion to the relationship of the absolute dollar amounts of the change in each. |
(2) |
Calculated assuming a 35% tax rate. |
Table 5 - Consolidated Average Balance Sheet and Net Interest Margin Analysis (3) | |||||||||||||||||||||||||
(dollar amounts in millions) |
|||||||||||||||||||||||||
Average Balances |
|||||||||||||||||||||||||
Change from 2014 |
Change from 2013 |
||||||||||||||||||||||||
Fully-taxable equivalent basis (1) |
2015 |
Amount |
Percent |
2014 |
Amount |
Percent |
2013 |
||||||||||||||||||
Assets |
|||||||||||||||||||||||||
Interest-bearing deposits in banks |
$ |
90 |
$ |
5 |
6 |
% |
$ |
85 |
$ |
15 |
21 |
% |
$ |
70 |
|||||||||||
Loans held for sale |
654 |
331 |
102 |
323 |
(198 |
) |
(38 |
) |
521 |
||||||||||||||||
Available-for-sale and other securities: |
|||||||||||||||||||||||||
Taxable |
7,999 |
1,214 |
18 |
6,785 |
402 |
6 |
6,383 |
||||||||||||||||||
Tax-exempt |
2,075 |
646 |
45 |
1,429 |
866 |
154 |
563 |
||||||||||||||||||
Total available-for-sale and other securities |
10,074 |
1,860 |
23 |
8,214 |
1,268 |
18 |
6,946 |
||||||||||||||||||
35
Trading account securities |
46 |
— |
— |
46 |
(34 |
) |
(43 |
) |
80 |
||||||||||||||||
Held-to-maturity securities—taxable |
3,513 |
(99 |
) |
(3 |
) |
3,612 |
1,457 |
68 |
2,155 |
||||||||||||||||
Total securities |
13,633 |
1,761 |
15 |
11,872 |
2,691 |
29 |
9,181 |
||||||||||||||||||
Loans and leases: (2) |
|||||||||||||||||||||||||
Commercial: |
|||||||||||||||||||||||||
Commercial and industrial |
19,734 |
1,392 |
8 |
18,342 |
1,168 |
7 |
17,174 |
||||||||||||||||||
Commercial real estate: |
|||||||||||||||||||||||||
Construction |
1,017 |
289 |
40 |
728 |
148 |
26 |
580 |
||||||||||||||||||
Commercial |
4,210 |
(61 |
) |
(1 |
) |
4,271 |
(178 |
) |
(4 |
) |
4,449 |
||||||||||||||
Commercial real estate |
5,227 |
228 |
5 |
4,999 |
(30 |
) |
(1 |
) |
5,029 |
||||||||||||||||
Total commercial |
24,961 |
1,620 |
7 |
23,341 |
1,138 |
5 |
22,203 |
||||||||||||||||||
Consumer: |
|||||||||||||||||||||||||
Automobile loans and leases |
8,760 |
1,090 |
14 |
7,670 |
1,991 |
35 |
5,679 |
||||||||||||||||||
Home equity |
8,494 |
99 |
1 |
8,395 |
85 |
1 |
8,310 |
||||||||||||||||||
Residential mortgage |
5,950 |
327 |
6 |
5,623 |
425 |
8 |
5,198 |
||||||||||||||||||
Other consumer |
481 |
85 |
21 |
396 |
(40 |
) |
(9 |
) |
436 |
||||||||||||||||
Total consumer |
23,685 |
1,601 |
7 |
22,084 |
2,461 |
13 |
19,623 |
||||||||||||||||||
Total loans and leases |
48,646 |
3,221 |
7 |
45,425 |
3,599 |
9 |
41,826 |
||||||||||||||||||
Allowance for loan and lease losses |
(606 |
) |
32 |
(5 |
) |
(638 |
) |
87 |
(12 |
) |
(725 |
) |
|||||||||||||
Net loans and leases |
48,040 |
3,253 |
7 |
44,787 |
3,686 |
9 |
41,101 |
||||||||||||||||||
Total earning assets |
63,023 |
5,318 |
9 |
57,705 |
6,107 |
12 |
51,598 |
||||||||||||||||||
Cash and due from banks |
1,223 |
325 |
36 |
898 |
(10 |
) |
(1 |
) |
908 |
||||||||||||||||
Intangible assets |
703 |
125 |
22 |
578 |
21 |
4 |
557 |
||||||||||||||||||
All other assets |
4,238 |
282 |
7 |
3,956 |
(5 |
) |
— |
3,961 |
|||||||||||||||||
Total assets |
$ |
68,581 |
$ |
6,082 |
10 |
% |
$ |
62,499 |
$ |
6,200 |
11 |
% |
$ |
56,299 |
|||||||||||
Liabilities and Shareholders’ Equity |
|||||||||||||||||||||||||
Deposits: |
|||||||||||||||||||||||||
Demand deposits—noninterest-bearing |
$ |
16,342 |
$ |
2,354 |
17 |
% |
$ |
13,988 |
$ |
1,117 |
9 |
% |
$ |
12,871 |
|||||||||||
Demand deposits—interest-bearing |
6,573 |
677 |
11 |
5,896 |
41 |
1 |
5,855 |
||||||||||||||||||
Total demand deposits |
22,915 |
3,031 |
15 |
19,884 |
1,158 |
6 |
18,726 |
||||||||||||||||||
Money market deposits |
19,383 |
1,466 |
8 |
17,917 |
2,242 |
14 |
15,675 |
||||||||||||||||||
Savings and other domestic deposits |
5,220 |
189 |
4 |
5,031 |
2 |
— |
5,029 |
||||||||||||||||||
Core certificates of deposit |
2,603 |
(712 |
) |
(21 |
) |
3,315 |
(1,234 |
) |
(27 |
) |
4,549 |
||||||||||||||
Total core deposits |
50,121 |
3,974 |
9 |
46,147 |
2,168 |
5 |
43,979 |
||||||||||||||||||
Other domestic time deposits of $250,000 or more |
256 |
14 |
6 |
242 |
(64 |
) |
(21 |
) |
306 |
||||||||||||||||
Brokered time deposits and negotiable CDs |
2,753 |
614 |
29 |
2,139 |
533 |
33 |
1,606 |
||||||||||||||||||
Deposits in foreign offices |
502 |
127 |
34 |
375 |
29 |
8 |
346 |
||||||||||||||||||
Total deposits |
53,632 |
4,729 |
10 |
48,903 |
2,666 |
6 |
46,237 |
||||||||||||||||||
Short-term borrowings |
1,346 |
(1,415 |
) |
(51 |
) |
2,761 |
1,358 |
97 |
1,403 |
||||||||||||||||
Long-term debt |
5,606 |
2,111 |
60 |
3,495 |
1,825 |
109 |
1,670 |
||||||||||||||||||
Total interest-bearing liabilities |
44,242 |
3,071 |
7 |
41,171 |
4,732 |
13 |
36,439 |
||||||||||||||||||
All other liabilities |
1,461 |
391 |
37 |
1,070 |
(4 |
) |
— |
1,074 |
|||||||||||||||||
Shareholders’ equity |
6,536 |
266 |
4 |
6,270 |
355 |
6 |
5,915 |
||||||||||||||||||
Total liabilities and shareholders’ equity |
$ |
68,581 |
$ |
6,082 |
10 |
% |
$ |
62,499 |
$ |
6,200 |
11 |
% |
$ |
56,299 |
|||||||||||
36
Table 5 - Consolidated Average Balance Sheet and Net Interest Margin Analysis (Continued) (3) | ||||||||||||||||||||
(dollar amounts in thousands) |
||||||||||||||||||||
Interest Income / Expense |
Average Rate (2) |
|||||||||||||||||||
Fully-taxable equivalent basis (1) |
2015 |
2014 |
2013 |
2015 |
2014 |
2013 |
||||||||||||||
Assets |
||||||||||||||||||||
Interest-bearing deposits in banks |
$ |
90 |
$ |
103 |
$ |
102 |
0.10 |
% |
0.12 |
% |
0.15 |
% |
||||||||
Loans held for sale |
23,812 |
12,728 |
18,905 |
3.64 |
3.94 |
3.63 |
||||||||||||||
Securities: |
||||||||||||||||||||
Available-for-sale and other securities: |
||||||||||||||||||||
Taxable |
202,104 |
171,080 |
148,557 |
2.53 |
2.52 |
2.33 |
||||||||||||||
Tax-exempt |
64,637 |
44,562 |
25,663 |
3.11 |
3.12 |
4.56 |
||||||||||||||
Total available-for-sale and other securities |
266,741 |
215,642 |
174,220 |
2.65 |
2.63 |
2.51 |
||||||||||||||
Trading account securities |
493 |
421 |
355 |
1.06 |
0.92 |
0.44 |
||||||||||||||
Held-to-maturity securities—taxable |
86,614 |
88,724 |
50,214 |
2.47 |
2.46 |
2.33 |
||||||||||||||
Total securities |
353,848 |
304,787 |
224,789 |
2.60 |
2.57 |
2.45 |
||||||||||||||
Loans and leases: (2) |
||||||||||||||||||||
Commercial: |
||||||||||||||||||||
Commercial and industrial |
700,139 |
643,484 |
643,731 |
3.55 |
3.51 |
3.75 |
||||||||||||||
Commercial real estate: |
||||||||||||||||||||
Construction |
36,956 |
31,414 |
23,440 |
3.63 |
4.31 |
4.04 |
||||||||||||||
Commercial |
146,526 |
163,192 |
182,622 |
3.48 |
3.82 |
4.11 |
||||||||||||||
Commercial real estate |
183,482 |
194,606 |
206,062 |
3.51 |
3.89 |
4.10 |
||||||||||||||
Total commercial |
883,621 |
838,090 |
849,793 |
3.54 |
3.59 |
3.83 |
||||||||||||||
Consumer: |
||||||||||||||||||||
Automobile loans and leases |
282,379 |
262,931 |
221,469 |
3.22 |
3.43 |
3.90 |
||||||||||||||
Home equity |
340,342 |
343,281 |
345,379 |
4.01 |
4.09 |
4.16 |
||||||||||||||
Residential mortgage |
220,678 |
213,268 |
199,601 |
3.71 |
3.79 |
3.84 |
||||||||||||||
Other consumer |
41,866 |
28,824 |
27,939 |
8.71 |
7.30 |
6.41 |
||||||||||||||
Total consumer |
885,265 |
848,304 |
794,388 |
3.74 |
3.84 |
4.05 |
||||||||||||||
Total loans and leases |
1,768,886 |
1,686,394 |
1,644,181 |
3.64 |
3.71 |
3.93 |
||||||||||||||
Total earning assets |
$ |
2,146,636 |
$ |
2,004,012 |
$ |
1,887,977 |
3.41 |
% |
3.47 |
% |
3.66 |
% |
||||||||
Liabilities and Shareholders’ Equity |
||||||||||||||||||||
Deposits: |
||||||||||||||||||||
Demand deposits—noninterest-bearing |
$ |
— |
$ |
— |
$ |
— |
— |
% |
— |
% |
— |
% |
||||||||
Demand deposits—interest-bearing |
4,278 |
2,272 |
2,525 |
0.07 |
0.04 |
0.04 |
||||||||||||||
Total demand deposits |
4,278 |
2,272 |
2,525 |
0.02 |
0.01 |
0.01 |
||||||||||||||
Money market deposits |
43,406 |
42,156 |
38,830 |
0.22 |
0.24 |
0.25 |
||||||||||||||
Savings and other domestic deposits |
7,340 |
8,779 |
13,292 |
0.14 |
0.17 |
0.26 |
||||||||||||||
Core certificates of deposit |
20,646 |
26,998 |
50,544 |
0.79 |
0.81 |
1.11 |
||||||||||||||
Total core deposits |
75,670 |
80,205 |
105,191 |
0.22 |
0.25 |
0.34 |
||||||||||||||
Other domestic time deposits of $250,000 or more |
1,078 |
1,036 |
1,442 |
0.42 |
0.43 |
0.47 |
||||||||||||||
Brokered time deposits and negotiable CDs |
4,767 |
4,728 |
9,100 |
0.17 |
0.22 |
0.57 |
||||||||||||||
Deposits in foreign offices |
659 |
483 |
508 |
0.13 |
0.13 |
0.15 |
||||||||||||||
Total deposits |
82,174 |
86,452 |
116,241 |
0.22 |
0.25 |
0.35 |
||||||||||||||
Short-term borrowings |
1,584 |
2,940 |
1,475 |
0.12 |
0.11 |
0.11 |
||||||||||||||
Long-term debt |
80,026 |
49,929 |
38,313 |
1.43 |
1.43 |
2.29 |
||||||||||||||
37
Total interest-bearing liabilities |
163,784 |
139,321 |
156,029 |
0.37 |
0.34 |
0.43 |
||||||||||||||
Net interest income |
$ |
1,982,852 |
$ |
1,864,691 |
$ |
1,731,948 |
||||||||||||||
Net interest rate spread |
3.04 |
3.13 |
3.23 |
|||||||||||||||||
Impact of noninterest-bearing funds on margin |
0.11 |
0.10 |
0.13 |
|||||||||||||||||
Net interest margin |
3.15 |
% |
3.23 |
% |
3.36 |
% |
||||||||||||||
(1) |
FTE yields are calculated assuming a 35% tax rate. |
(2) |
For purposes of this analysis, nonaccrual loans are reflected in the average balances of loans. |
(3) |
Yield/rates and amounts include the effects of hedge and risk management activities associated with the respective asset and liability categories. |
2015 vs. 2014
Fully-taxable equivalent net interest income for 2015 increased $118 million, or 6%, from 2014. This reflected the impact of 9% earning asset growth, partially offset by 7% interest-bearing liability growth and an 8 basis point decrease in the NIM to 3.15%.
Average earning assets increased $5.3 billion, or 9%, from the prior year, driven by:
• |
$1.8 billion, or 15%, increase in average securities, primarily reflecting additional investment in LCR Level 1 qualifying securities. The 2015 average balance also included $1.7 billion of direct purchase municipal instruments originated by our Commercial segment, up from $1.0 billion in the year-ago period. |
• |
$1.4 billion, or 8%, increase in average C&I loans and leases, primarily reflecting the $0.9 billion increase in asset finance, including the $0.8 billion of equipment finance leases acquired in the Huntington Technology Finance transaction at the end of the 2015 first quarter. |
• |
$1.1 billion, or 14%, increase in average Automobile loans, as originations remained strong. |
• |
$0.3 billion, or 6%, increase in average Residential mortgage loans. |
Average noninterest-bearing demand deposits increased $2.4 billion, or 17%, while average total interest-bearing liabilities increased $3.1 billion, or 7%, primarily reflecting:
• |
$1.5 billion, or 8%, increase in money market deposits, reflecting continued banker focus across all segments on obtaining our customers’ full deposit relationship. |
• |
$0.7 billion, or 11%, increase in average interest-bearing demand deposits. The increase reflected growth in both consumer and commercial accounts. |
• |
$0.7 billion, or 11%, increase in average total debt, reflecting a $2.1 billion, or 60%, increase in average long-term debt partially offset by a $1.4 billion, or 51%, reduction in average short-term borrowings. The increase in average long-term debt reflected the issuance of $3.1 billion of bank-level senior debt during 2015, including $0.9 billion during the 2015 fourth quarter, as well as $0.5 billion of debt assumed in the Huntington Technology Finance acquisition at the end of the 2015 first quarter. |
• |
$0.6 billion, or 29%, increase in brokered deposits and negotiated CDs, which were used to efficiently finance balance sheet growth while continuing to manage the overall cost of funds. |
Partially offset by:
• |
$0.7 billion, or 21%, decrease in average core certificates of deposit due to the strategic focus on changing the funding sources to low- and no-cost demand deposits and money market deposits. |
The primary items impacting the decrease in the NIM were:
• |
6 basis point negative impact from the mix and yield on earning assets, primarily reflecting lower rates on loans and the impact of an increase in total securities balances. |
• |
3 basis point negative impact from the mix and yield of total interest-bearing liabilities. |
Partially offset by:
• |
1 basis point increase in the benefit to the margin of noninterest-bearing funds. |
38
2014 vs. 2013
Fully-taxable equivalent net interest income for 2014 increased $133 million, or 8%, from 2013. This reflected the impact of 12% earning asset growth, partially offset by 13% interest-bearing liability growth and a 13 basis point decrease in the NIM to 3.23%.
Average earning assets increased $6.1 billion, or 12%, from the prior year, driven by:
• |
$2.7 billion, or 29%, increase in average securities, reflecting an increase of LCR Level 1 qualified securities and direct purchase municipal instruments. |
• |
$2.0 billion, or 35%, increase in average Automobile loans, as originations remained strong. |
• |
$1.2 billion, or 7%, increase in average C&I loans and leases, primarily reflecting growth in trade finance in support of our middle market and corporate customers. |
• |
$0.4 billion, or 8%, increase in average Residential mortgage loans as a result of the Camco Financial acquisition and a decrease in the rate of payoffs due to lower levels of refinancing. |
Average noninterest bearing deposits increased $1.1 billion, or 9%, while average interest-bearing liabilities increased $4.7 billion, or 13%, from 2013, primarily reflecting:
• |
$3.2 billion, or 104%, increase in short-term borrowings and long-term debt, which are a cost effective method of funding incremental securities growth. |
• |
$2.2 billion, or 14%, increase in money market deposits, reflecting the strategic focus on customer growth and increased share-of-wallet among both consumer and commercial customers. |
• |
$0.5 billion, or 33%, increase in brokered deposits and negotiated CDs, which were used to efficiently finance balance sheet growth while continuing to manage the overall cost of funds. |
Partially offset by:
• |
$1.2 billion, or 27%, decrease in average core certificates of deposit due to the strategic focus on changing the funding sources to no-cost demand deposits and lower-cost money market deposits. |
The primary items impacting the decrease in the NIM were:
• |
19 basis point negative impact from the mix and yield on earning assets, primarily reflecting lower rates on loans, and the impact of an increased total securities balance. |
• |
3 basis point decrease in the benefit to the margin of noninterest bearing funds, reflecting lower interest rates on total interest bearing liabilities from the prior year. |
Partially offset by:
• |
9 basis point positive impact from the mix and yield of total interest-bearing liabilities, reflecting the strategic focus on changing the funding sources from higher rate time deposits to no-cost demand deposits and low-cost money market deposits. |
Provision for Credit Losses
(This section should be read in conjunction with the Credit Risk section.)
The provision for credit losses is the expense necessary to maintain the ALLL and the AULC at levels appropriate to absorb our estimate of credit losses inherent in the loan and lease portfolio and the portfolio of unfunded loan commitments and letters-of-credit.
The provision for credit losses in 2015 was $100 million, up $19 million, or 23%, from 2014, reflecting a $37 million, or 30%, decrease in NCOs. The provision for credit losses in 2015 was $12 million more than total NCOs.
The provision for credit losses in 2014 was $81 million, down $9 million, or 10%, from 2013, reflecting a $64 million, or 34%, decrease in NCOs. The provision for credit losses in 2014 was $44 million less than total NCOs.
39
Noninterest Income
The following table reflects noninterest income for the past three years:
Table 6 - Noninterest Income | |||||||||||||||||||||||||
(dollar amounts in thousands) |
|||||||||||||||||||||||||
Year Ended December 31, |
|||||||||||||||||||||||||
Change from 2014 |
Change from 2013 |
||||||||||||||||||||||||
2015 |
Amount |
Percent |
2014 |
Amount |
Percent |
2013 |
|||||||||||||||||||
Service charges on deposit accounts |
$ |
280,349 |
$ |
6,608 |
2 |
% |
$ |
273,741 |
$ |
1,939 |
1 |
% |
$ |
271,802 |
|||||||||||
Cards and payment processing income |
142,715 |
37,314 |
35 |
105,401 |
12,810 |
14 |
92,591 |
||||||||||||||||||
Mortgage banking income |
111,853 |
26,966 |
32 |
84,887 |
(41,968 |
) |
(33 |
) |
126,855 |
||||||||||||||||
Trust services |
105,833 |
(10,139 |
) |
(9 |
) |
115,972 |
(7,035 |
) |
(6 |
) |
123,007 |
||||||||||||||
Insurance income |
65,264 |
(209 |
) |
— |
65,473 |
(3,791 |
) |
(5 |
) |
69,264 |
|||||||||||||||
Brokerage income |
60,205 |
(8,072 |
) |
(12 |
) |
68,277 |
(1,347 |
) |
(2 |
) |
69,624 |
||||||||||||||
Capital markets fees |
53,616 |
9,885 |
23 |
43,731 |
(1,489 |
) |
(3 |
) |
45,220 |
||||||||||||||||
Bank owned life insurance income |
52,400 |
(4,648 |
) |
(8 |
) |
57,048 |
629 |
1 |
56,419 |
||||||||||||||||
Gain on sale of loans |
33,037 |
11,946 |
57 |
21,091 |
2,920 |
16 |
18,171 |
||||||||||||||||||
Securities gains (losses) |
744 |
(16,810 |
) |
(96 |
) |
17,554 |
17,136 |
4,100 |
418 |
||||||||||||||||
Other income |
132,714 |
6,710 |
5 |
126,004 |
(12,821 |
) |
(9 |
) |
138,825 |
||||||||||||||||
Total noninterest income |
$ |
1,038,730 |
$ |
59,551 |
6 |
% |
$ |
979,179 |
$ |
(33,017 |
) |
(3 |
)% |
$ |
1,012,196 |
||||||||||
2015 vs. 2014
Noninterest income increased $60 million, or 6%, from the prior year, primarily reflecting:
• |
$37 million, or 35%, increase in cards and payment processing income due to higher card related income and underlying customer growth.
|
• |
$27 million, or 32%, increase in mortgage banking income primarily driven by a $33 million, or 58%, increase in origination and secondary marketing revenue.
|
• |
$12 million, or 57%, increase in gain on sale of loans primarily reflecting an increase of $7 million in SBA loan sales gains and the $5 million automobile loan securitization gain during the 2015 second quarter.
|
• |
$10 million, or 23%, increase in capital market fees primarily related to customer foreign exchange and commodities derivatives products.
|
Partially offset by:
• |
$17 million, or 96% decrease in securities gains as we adjusted the mix of our securities portfolio to prepare for the LCR requirements during the 2014 first quarter.
|
• |
$10 million, or 9%, decrease in trust services primarily related to our fiduciary trust businesses moving to a more open architecture platform and a decline in assets under management in proprietary mutual funds. During the 2015 fourth quarter, Huntington sold HAA, HASI, and Unified.
|
2014 vs. 2013
Noninterest income decreased $33 million, or 3%, from the prior year, primarily reflecting:
• |
$42 million, or 33%, decrease in mortgage banking income primarily driven by a $28 million, or 33%, reduction in origination and secondary marketing revenue as originations decreased and gain-on-sale margins compressed, and a $14 million negative impact from net MSR hedging activity. |
• |
$13 million, or 9%, decrease in other income primarily due to a decrease in LIHTC gains and lower fees associated with commercial loan activity. |
• |
$7 million, or 6%, decrease in trust services primarily due to a reduction in fees. |
Partially offset by:
40
• |
$17 million increase in securities gains as we adjusted the mix of our securities portfolio to prepare for the LCR requirements. |
• |
$13 million, or 14%, increase in cards and payment processing income due to higher card related income and underlying customer growth. |
Noninterest Expense |
|||||||||||||||||||||||||
(This section should be read in conjunction with Significant Items 1, 2, 3, and 4.) |
|||||||||||||||||||||||||
The following table reflects noninterest expense for the past three years: |
|||||||||||||||||||||||||
Table 7 - Noninterest Expense | |||||||||||||||||||||||||
(dollar amounts in thousands) |
|||||||||||||||||||||||||
Year Ended December 31, |
|||||||||||||||||||||||||
Change from 2014 |
Change from 2013 |
||||||||||||||||||||||||
2015 |
Amount |
Percent |
2014 |
Amount |
Percent |
2013 |
|||||||||||||||||||
Personnel costs |
$ |
1,122,182 |
$ |
73,407 |
7 |
% |
$ |
1,048,775 |
$ |
47,138 |
5 |
% |
$ |
1,001,637 |
|||||||||||
Outside data processing and other services |
231,353 |
18,767 |
9 |
212,586 |
13,039 |
7 |
199,547 |
||||||||||||||||||
Equipment |
124,957 |
5,294 |
4 |
119,663 |
12,870 |
12 |
106,793 |
||||||||||||||||||
Net occupancy |
121,881 |
(6,195 |
) |
(5 |
) |
128,076 |
2,732 |
2 |
125,344 |
||||||||||||||||
Marketing |
52,213 |
1,653 |
3 |
50,560 |
(625 |
) |
(1 |
) |
51,185 |
||||||||||||||||
Professional services |
50,291 |
(9,264 |
) |
(16 |
) |
59,555 |
18,968 |
47 |
40,587 |
||||||||||||||||
Deposit and other insurance expense |
44,609 |
(4,435 |
) |
(9 |
) |
49,044 |
(1,117 |
) |
(2 |
) |
50,161 |
||||||||||||||
Amortization of intangibles |
27,867 |
(11,410 |
) |
(29 |
) |
39,277 |
(2,087 |
) |
(5 |
) |
41,364 |
||||||||||||||
Other expense |
200,555 |
25,745 |
15 |
174,810 |
33,425 |
24 |
141,385 |
||||||||||||||||||
Total noninterest expense |
$ |
1,975,908 |
$ |
93,562 |
5 |
% |
$ |
1,882,346 |
$ |
124,343 |
7 |
% |
$ |
1,758,003 |
|||||||||||
Number of employees (average full-time equivalent) |
12,243 |
370 |
3 |
% |
11,873 |
(91 |
) |
(1 |
)% |
11,964 |
|||||||||||||||
Impacts of Significant Items: |
|||||||||||
Year Ended December 31, |
|||||||||||
(dollar amounts in thousands) |
2015 |
2014 |
2013 |
||||||||
Personnel costs |
$ |
5,457 |
$ |
19,850 |
$ |
(27,249 |
) |
||||
Outside data processing and other services |
4,365 |
5,507 |
1,350 |
||||||||
Equipment |
110 |
2,248 |
2,364 |
||||||||
Net occupancy |
4,587 |
11,153 |
12,117 |
||||||||
Marketing |
28 |
1,357 |
— |
||||||||
Professional services |
5,087 |
2,228 |
— |
||||||||
Other expense |
38,733 |
23,140 |
953 |
||||||||
Total noninterest expense adjustments |
$ |
58,367 |
$ |
65,483 |
$ |
(10,465 |
) |
||||
41
Adjusted Noninterest Expense (Non-GAAP): |
|||||||||||||||||||||||||
Year Ended December 31, |
Change from 2014 |
Change from 2013 |
|||||||||||||||||||||||
(dollar amounts in thousands) |
2015 |
2014 |
2013 |
Amount |
Percent |
Amount |
Percent |
||||||||||||||||||
Personnel costs |
$ |
1,116,725 |
$ |
1,028,925 |
$ |
1,028,886 |
$ |
87,800 |
9 |
% |
$ |
39 |
— |
% |
|||||||||||
Outside data processing and other services |
226,988 |
207,079 |
198,197 |
19,909 |
10 |
8,882 |
4 |
||||||||||||||||||
Equipment |
124,847 |
117,415 |
104,429 |
7,432 |
6 |
12,986 |
12 |
||||||||||||||||||
Net occupancy |
117,294 |
116,923 |
113,227 |
371 |
— |
3,696 |
3 |
||||||||||||||||||
Marketing |
52,185 |
49,203 |
51,185 |
2,982 |
6 |
(1,982 |
) |
(4 |
) |
||||||||||||||||
Professional services |
45,204 |
57,327 |
40,587 |
(12,123 |
) |
(21 |
) |
16,740 |
41 |
||||||||||||||||
Deposit and other insurance expense |
44,609 |
49,044 |
50,161 |
(4,435 |
) |
(9 |
) |
(1,117 |
) |
(2 |
) |
||||||||||||||
Amortization of intangibles |
27,867 |
39,277 |
41,364 |
(11,410 |
) |
(29 |
) |
(2,087 |
) |
(5 |
) |
||||||||||||||
Other expense |
161,822 |
151,670 |
140,432 |
10,152 |
7 |
11,238 |
8 |
||||||||||||||||||
Total adjusted noninterest expense |
$ |
1,917,541 |
$ |
1,816,863 |
$ |
1,768,468 |
$ |
100,678 |
6 |
% |
$ |
48,395 |
3 |
% |
|||||||||||
2015 vs. 2014
Noninterest expense increased $94 million, or 5%, from 2014:
• |
$73 million, or 7%, increase in personnel costs. Excluding the impact of significant items, personnel costs increased $88 million, or 9%, reflecting a $79 million increase in salaries related to the 2015 second quarter implementation of annual merit increases, the addition of Huntington Technology Finance, and a 3% increase in the number of average full-time equivalent employees, largely related to the build-out of the in-store strategy.
|
• |
$26 million, or 15%, increase in other noninterest expense. Excluding the impact of significant items, other noninterest expense increased $10 million, or 7%, due to an increase in operating lease expense related to Huntington Technology Finance.
|
• |
$19 million, or 9%, increase in outside data processing and other services. Excluding the impact of significant items, outside data processing and other services increased $20 million, or 10%, primarily reflecting higher debit and credit card processing costs and increased other technology investment expense, as we continue to invest in technology supporting our products, services, and our Continuous Improvement initiatives.
|
Partially offset by:
• |
$11 million, or 29%, decrease in amortization of intangibles reflecting the full amortization of the core deposit intangible at the end of the 2015 second quarter from the Sky Financial acquisition.
|
• |
$9 million, or 16%, decrease in professional services. Excluding the impact of significant items, professional services decreased $12 million, or 21%, reflecting a decrease in outside consultant expenses related to strategic planning.
|
• |
$6 million, or 5%, decrease in net occupancy. Excluding the impact of significant items, net occupancy remained relatively unchanged.
|
2014 vs. 2013
Noninterest expense increased $124 million, or 7%, from 2013:
• |
$47 million, or 5%, increase in personnel costs. Excluding the impact of significant items, personnel costs were relatively unchanged. |
• |
$33 million, or 24%, increase in other noninterest expense. Excluding the impact of significant items, other noninterest expense increased $11 million, or 8%, due to an increase in state franchise taxes, protective advances, and litigation expense. |
• |
$19 million, or 47%, increase in professional services. Excluding the impact of significant items, professional services increased $16 million, or 41%, reflecting an increase in outside consultant expenses related to strategic planning and legal services. |
• |
$13 million, or 7%, increase in outside data processing and other services. Excluding the impact of significant items, outside data processing and other services increased $9 million, or 4%, primarily reflecting higher debit and credit card processing costs and increased other technology investment expense, as we continue to invest in technology supporting our products, services, and our Continuous Improvement initiatives. |
42
• |
$13 million, or 12%, increase in equipment. Excluding the impact of significant items, equipment increased $13 million, or 12%, primarily reflecting higher depreciation expense. |
Provision for Income Taxes
(This section should be read in conjunction with Note 16 of the Notes to Consolidated Financial Statements.)
2015 versus 2014
The provision for income taxes was $221 million for 2015 compared with a provision for income taxes of $221 million in 2014. Both years included the benefits from tax-exempt income, tax-advantaged investments, release of federal capital loss carryforward valuation allowance, general business credits, and investments in qualified affordable housing projects. In 2015, a $69 million reduction in the provision for federal income taxes was recorded for the portion of federal deferred tax assets related to capital loss carryforwards that are more likely than not to be realized compared to a $27 million reduction in 2014. In 2015, there was essentially no change recorded in the provision for state income taxes, for the portion of state deferred tax assets and state net operating loss carryforwards that are more likely than not to be realized, compared to a $7 million reduction, net of federal taxes, in 2014. At December 31, 2015, we had a net federal deferred tax asset of $7 million and a net state deferred tax asset of $43 million.
We file income tax returns with the IRS and various state, city, and foreign jurisdictions. Federal income tax audits have been completed for tax years through 2009. The IRS is currently examining our 2010 and 2011 consolidated federal income tax returns. Various state and other jurisdictions remain open to examination, including Ohio, Kentucky, Indiana, Michigan, Pennsylvania, West Virginia and Illinois.
2014 versus 2013
The provision for income taxes was $221 million for 2014 compared with a provision for income taxes of $227 million in 2013. Both years included the benefits from tax-exempt income, tax-advantaged investments, general business credits, and the change in accounting for investments in qualified affordable housing projects. In 2014, a $27 million reduction in the 2014 provision for federal income taxes was recorded for the portion of federal capital loss carryforward deferred tax assets that are more likely than not to be realized compared to a $93 million increase in 2013. In 2014, a $7 million reduction in the 2014 provision for state income taxes, net of federal taxes, was recorded for the portion of state deferred tax assets and state net operating loss carryforwards that are more likely than not to be realized, compared to a $6 million reduction in 2013.
RISK MANAGEMENT AND CAPITAL
A comprehensive discussion of risk management and capital matters affecting us can be found in the Risk Governance section included in Item 1A and the Regulatory Matters section of Item 1 of this Form 10-K.
Some of the more significant processes used to manage and control credit, market, liquidity, operational, and compliance risks are described in the following paragraphs.
Credit Risk
Credit risk is the risk of financial loss if a counterparty is not able to meet the agreed upon terms of the financial obligation. The majority of our credit risk is associated with lending activities, as the acceptance and management of credit risk is central to profitable lending. We also have credit risk associated with our AFS and HTM securities portfolios (see Note 4 and Note 5 of the Notes to Consolidated Financial Statements). We engage with other financial counterparties for a variety of purposes including investing, asset and liability management, mortgage banking, and trading activities. While there is credit risk associated with derivative activity, we believe this exposure is minimal.
We continue to focus on the identification, monitoring, and managing of our credit risk. In addition to the traditional credit risk mitigation strategies of credit policies and processes, market risk management activities, and portfolio diversification, we use quantitative measurement capabilities utilizing external data sources, enhanced use of modeling technology, and internal stress testing processes. Our portfolio management resources demonstrate our commitment to maintaining an aggregate moderate-to-low risk profile. In our efforts to continue to identify risk mitigation techniques, we have focused on product design features, origination policies, and solutions for delinquent or stressed borrowers.
The maximum level of credit exposure to individual credit borrowers is limited by policy guidelines based on the perceived risk of each borrower or related group of borrowers. All authority to grant commitments is delegated through the independent credit administration function and is closely monitored and regularly updated. Concentration risk is managed through limits on loan type, geography, industry, and loan quality factors. We focus predominantly on extending credit to retail and commercial customers with existing or expandable relationships within our primary banking markets, although we will consider lending opportunities outside our primary markets if we believe the associated risks are acceptable and aligned with strategic initiatives. Although we offer a broad set of products, we continue to develop new lending products and opportunities. Each of these new products and opportunities goes through a rigorous development and approval process prior to implementation to ensure our overall objective of maintaining an aggregate moderate-to-low risk portfolio profile.
The checks and balances in the credit process and the separation of the credit administration and risk management functions are designed to appropriately assess and sanction the level of credit risk being accepted, facilitate the early recognition of credit problems when they occur, and provide for effective problem asset management and resolution. For example, we do not extend additional credit to delinquent borrowers except in certain circumstances that substantially improve our overall repayment or collateral coverage position.
Our asset quality indicators reflected overall stabilization of our credit quality performance in 2015 compared to 2014.
Loan and Lease Credit Exposure Mix
At December 31, 2015, our loans and leases totaled $50.3 billion, representing a $2.7 billion, or 6%, increase compared to $47.7 billion at December 31, 2014. There was continued growth in the C&I portfolio, primarily as a result of an increase in equipment leases of $0.8 billion related to the acquisition of Huntington Technology Finance. In addition, the automobile portfolio increased by
43
$0.8 billion as a result of strong originations. The CRE portfolio had modest growth over the period as the continued runoff of the non-core portfolio was more than offset by new production within the requirements associated with our internal concentration limits.
Total commercial loans and leases were $25.8 billion at December 31, 2015, and represented 51% of our total loan and lease credit exposure. Our commercial loan portfolio is diversified along product type, customer size, and geography within our footprint, and is comprised of the following (see Commercial Credit discussion):
C&I – C&I loans and leases are made to commercial customers for use in normal business operations to finance working capital needs, equipment purchases, or other projects. The majority of these borrowers are customers doing business within our geographic regions. C&I loans and leases are generally underwritten individually and secured with the assets of the company and/or the personal guarantee of the business owners. The financing of owner occupied facilities is considered a C&I loan even though there is improved real estate as collateral. This treatment is a result of the credit decision process, which focuses on cash flow from operations of the business to repay the debt. The operation, sale, rental, or refinancing of the real estate is not considered the primary repayment source for these types of loans. As we have expanded our C&I portfolio, we have developed a series of “vertical specialties” to ensure that new products or lending types are embedded within a structured, centralized Commercial Lending area with designated, experienced credit officers. These specialties are comprised of either targeted industries (for example, Healthcare, Food & Agribusiness, Energy, etc.) and/or lending disciplines (Equipment Finance, ABL, etc.), all of which requires a high degree of expertise and oversight to effectively mitigate and monitor risk. As such, we have dedicated colleagues and teams focused on bringing value added expertise to these specialty clients.
CRE – CRE loans consist of loans to developers and REITs supporting income-producing or for-sale commercial real estate properties. We mitigate our risk on these loans by requiring collateral values that exceed the loan amount and underwriting the loan with projected cash flow in excess of the debt service requirement. These loans are made to finance properties such as apartment buildings, office and industrial buildings, and retail shopping centers, and are repaid through cash flows related to the operation, sale, or refinance of the property.
Construction CRE – Construction CRE loans are loans to developers, companies, or individuals used for the construction of a commercial or residential property for which repayment will be generated by the sale or permanent financing of the property. Our construction CRE portfolio primarily consists of retail, multi family, office, and warehouse project types. Generally, these loans are for construction projects that have been presold or preleased, or have secured permanent financing, as well as loans to real estate companies with significant equity invested in each project. These loans are underwritten and managed by a specialized real estate lending group that actively monitors the construction phase and manages the loan disbursements according to the predetermined construction schedule.
Total consumer loans and leases were $24.5 billion at December 31, 2015, and represented 49% of our total loan and lease credit exposure. The consumer portfolio is comprised primarily of automobile loans, home equity loans and lines-of-credit, and residential mortgages (see Consumer Credit discussion). The increase from December 31, 2014 primarily relates to growth in the automobile portfolio.
Automobile – Automobile loans are comprised primarily of loans made through automotive dealerships and include exposure in selected states outside of our primary banking markets. The exposure outside of our primary banking markets represents 22% of the total exposure, with no individual state representing more than 7%. Applications are underwritten using an automated underwriting system that applies consistent policies and processes across the portfolio.
Home equity – Home equity lending includes both home equity loans and lines-of-credit. This type of lending, which is secured by a first-lien or junior-lien on the borrower’s residence, allows customers to borrow against the equity in their home or refinance existing mortgage debt. Products include closed-end loans which are generally fixed-rate with principal and interest payments, and variable-rate, interest-only lines-of-credit which do not require payment of principal during the 10-year revolving period. The home equity line of credit may convert to a 20-year amortizing structure at the end of the revolving period. Applications are underwritten centrally in conjunction with an automated underwriting system. The home equity underwriting criteria is based on minimum credit scores, debt-to-income ratios, and LTV ratios, with current collateral valuations. The underwriting for the floating rate lines of credit also incorporates a stress analysis for a rising interest rate.
Residential mortgage – Residential mortgage loans represent loans to consumers for the purchase or refinance of a residence. These loans are generally financed over a 15-year to 30-year term, and in most cases, are extended to borrowers to finance their primary residence. Applications are underwritten centrally using consistent credit policies and processes. All residential mortgage loan decisions utilize a full appraisal for collateral valuation. Huntington has not originated or acquired residential mortgages that allow negative amortization or allow the borrower multiple payment options.
Other consumer – Other consumer loans primarily consists of consumer loans not secured by real estate, including personal unsecured loans, overdraft balances, and credit cards.
The table below provides the composition of our total loan and lease portfolio:
44
Table 8 - Loan and Lease Portfolio Composition | ||||||||||||||||||||||||||||||||||
(dollar amounts in millions) |
||||||||||||||||||||||||||||||||||
At December 31, |
||||||||||||||||||||||||||||||||||
2015 |
2014 |
2013 |
2012 |
2011 |
||||||||||||||||||||||||||||||
Commercial: (1) |
||||||||||||||||||||||||||||||||||
Commercial and industrial |
$ |
20,560 |
41 |
% |
$ |
19,033 |
40 |
% |
$ |
17,594 |
41 |
% |
$ |
16,971 |
42 |
% |
$ |
14,699 |
38 |
% |
||||||||||||||
Commercial real estate: |
||||||||||||||||||||||||||||||||||
Construction |
1,031 |
2 |
875 |
2 |
557 |
1 |
648 |
2 |
580 |
1 |
||||||||||||||||||||||||
Commercial |
4,237 |
8 |
4,322 |
9 |
4,293 |
10 |
4,751 |
12 |
5,246 |
13 |
||||||||||||||||||||||||
Total commercial real estate |
5,268 |
10 |
5,197 |
11 |
4,850 |
11 |
5,399 |
14 |
5,826 |
14 |
||||||||||||||||||||||||
Total commercial |
25,828 |
51 |
24,230 |
51 |
22,444 |
52 |
22,370 |
56 |
20,525 |
52 |
||||||||||||||||||||||||
Consumer: |
||||||||||||||||||||||||||||||||||
Automobile |
9,481 |
19 |
8,690 |
18 |
6,639 |
15 |
4,634 |
11 |
4,458 |
11 |
||||||||||||||||||||||||
Home equity |
8,471 |
17 |
8,491 |
18 |
8,336 |
19 |
8,335 |
20 |
8,215 |
21 |
||||||||||||||||||||||||
Residential mortgage |
5,998 |
12 |
5,831 |
12 |
5,321 |
12 |
4,970 |
12 |
5,228 |
13 |
||||||||||||||||||||||||
Other consumer |
563 |
1 |
414 |
1 |
380 |
2 |
419 |
1 |
498 |
3 |
||||||||||||||||||||||||
Total consumer |
24,513 |
49 |
23,426 |
49 |
20,676 |
48 |
18,358 |
44 |
18,399 |
48 |
||||||||||||||||||||||||
Total loans and leases |
$ |
50,341 |
100 |
% |
$ |
47,656 |
100 |
% |
$ |
43,120 |
100 |
% |
$ |
40,728 |
100 |
% |
$ |
38,924 |
100 |
% |
||||||||||||||
(1) |
As defined by regulatory guidance, there were no commercial loans outstanding that would be considered a concentration of lending to a particular industry or group of industries. |
Our loan portfolio is diversified by consumer and commercial credit. At the corporate level, we manage the credit exposure in part via a credit concentration policy. The policy designates specific loan types, collateral types, and loan structures to be formally tracked and assigned limits as a percentage of capital. C&I lending by NAICS categories, specific limits for CRE primary project types, loans secured by residential real estate, shared national credit exposure, and designated high risk loan definitions represent examples of specifically tracked components of our concentration management process. Currently there are no identified concentrations that exceed the established limit. Our concentration management policy is approved by the Risk Oversight Committee (ROC) and is one of the strategies used to ensure a high quality, well diversified portfolio that is consistent with our overall objective of maintaining an aggregate moderate-to-low risk profile. Changes to existing concentration limits require the approval of the ROC prior to implementation, incorporating specific information relating to the potential impact on the overall portfolio composition and performance metrics.
The table below provides our total loan and lease portfolio segregated by the type of collateral securing the loan or lease. The changes in the collateral composition from December 31, 2014 are consistent with the portfolio growth metrics, with increases noted in the machinery/equipment and vehicle categories. The increase in machinery/equipment reflects the addition of approximately $0.8 billion in equipment leases related to the acquisition of Huntington Technology Finance.
The increase in the unsecured exposure is centered in high quality commercial credit customers.
45
Table 9 - Loan and Lease Portfolio by Collateral Type | ||||||||||||||||||||||||||||||||||||
(dollar amounts in millions) |
||||||||||||||||||||||||||||||||||||
At December 31, |
||||||||||||||||||||||||||||||||||||
2015 |
2014 |
2013 |
2012 |
2011 |
||||||||||||||||||||||||||||||||
Secured loans: |
||||||||||||||||||||||||||||||||||||
Real estate—commercial |
$ |
8,296 |
16 |
% |
$ |
8,631 |
18 |
% |
$ |
8,622 |
20 |
% |
$ |
9,128 |
22 |
% |
$ |
9,557 |
25 |
% |
||||||||||||||||
Real estate—consumer |
14,469 |
29 |
14,322 |
30 |
13,657 |
32 |
13,305 |
33 |
13,444 |
35 |
||||||||||||||||||||||||||
Vehicles |
11,880 |
(1 |
) |
24 |
10,932 |
23 |
8,989 |
21 |
6,659 |
16 |
6,021 |
15 |
||||||||||||||||||||||||
Receivables/Inventory |
5,961 |
12 |
5,968 |
13 |
5,534 |
13 |
5,178 |
13 |
4,450 |
11 |
||||||||||||||||||||||||||
Machinery/Equipment |
5,171 |
(2 |
) |
10 |
3,863 |
8 |
2,738 |
6 |
2,749 |
7 |
1,994 |
5 |
||||||||||||||||||||||||
Securities/Deposits |
974 |
2 |
964 |
2 |
786 |
2 |
826 |
2 |
800 |
2 |
||||||||||||||||||||||||||
Other |
987 |
2 |
919 |
2 |
1,016 |
2 |
1,090 |
3 |
1,018 |
3 |
||||||||||||||||||||||||||
Total secured loans and leases |
47,738 |
95 |
45,599 |
96 |
41,342 |
96 |
38,935 |
96 |
37,284 |
96 |
||||||||||||||||||||||||||
Unsecured loans and leases |
2,603 |
5 |
2,057 |
4 |
1,778 |
4 |
1,793 |
4 |
1,640 |
4 |
||||||||||||||||||||||||||
Total loans and leases |
$ |
50,341 |
100 |
% |
$ |
47,656 |
100 |
% |
$ |
43,120 |
100 |
% |
$ |
40,728 |
100 |
% |
$ |
38,924 |
100 |
% |
||||||||||||||||
(1) |
2015 includes a decrease of approximately $0.8 billion in automobile loans resulting from an automobile securitization transaction. |
(2) |
Reflects the addition of approximately $0.8 billion in equipment leases related to the acquisition of Huntington Technology Finance. |
Commercial Credit
The primary factors considered in commercial credit approvals are the financial strength of the borrower, assessment of the borrower’s management capabilities, cash flows from operations, industry sector trends, type and sufficiency of collateral, type of exposure, transaction structure, and the general economic outlook. While these are the primary factors considered, there are a number of other factors that may be considered in the decision process. We utilize a centralized preview and senior loan approval committee, led by our chief credit officer. The risk rating (see next paragraph) and complexity of the credit determines the threshold for approval of the senior loan committee with a minimum credit exposure of $10.0 million. For loans not requiring senior loan committee approval, with the exception of small business loans, credit officers who understand each local region and are experienced in the industries and loan structures of the requested credit exposure are involved in all loan decisions and have the primary credit authority. For small business loans, we utilize a centralized loan approval process for standard products and structures. In this centralized decision environment, certain individuals who understand each local region may make credit-extension decisions to preserve our commitment to the communities in which we operate. In addition to disciplined and consistent judgmental factors, a sophisticated credit scoring process is used as a primary evaluation tool in the determination of approving a loan within the centralized loan approval process.
In commercial lending, on-going credit management is dependent on the type and nature of the loan. We monitor all significant exposures on an on-going basis. All commercial credit extensions are assigned internal risk ratings reflecting the borrower’s PD and LGD. This two-dimensional rating methodology provides granularity in the portfolio management process. The PD is rated and applied at the borrower level. The LGD is rated and applied based on the specific type of credit extension and the quality and lien position associated with the underlying collateral. The internal risk ratings are assessed at origination and updated at each periodic monitoring event. There is also extensive macro portfolio management analysis on an on-going basis. We continually review and adjust our risk-rating criteria based on actual experience, which provides us with the current risk level in the portfolio and is the basis for determining an appropriate allowance for credit losses (ACL) amount for the commercial portfolio. A centralized portfolio management team monitors and reports on the performance of the entire commercial portfolio, including small business loans, to provide consistent oversight.
In addition to the initial credit analysis conducted during the approval process, our Credit Review group performs testing to provide an independent review and assessment of the quality and risk of new loan originations. This group is part of our Risk Management area and conducts portfolio reviews on a risk-based cycle to evaluate individual loans, validate risk ratings, and test the consistency of credit processes.
Our standardized loan grading system considers many components that directly correlate to loan quality and likelihood of repayment, one of which is guarantor support. On an annual basis, or more frequently if warranted, we consider, among other things, the guarantor’s reputation and creditworthiness, along with various key financial metrics such as liquidity and net worth, assuming
46
such information is available. Our assessment of the guarantor’s credit strength, or lack thereof, is reflected in our risk ratings for such loans, which is directly tied to, and an integral component of, our ACL methodology. When a loan goes to impaired status, viable guarantor support is considered in the determination of a credit loss.
If our assessment of the guarantor’s credit strength yields an inherent capacity to perform, we will seek repayment from the guarantor as part of the collection process and have done so successfully.
Substantially all loans categorized as Classified (see Note 3 of Notes to Consolidated Financial Statements) are managed by our Special Assets Division. SAD is a specialized group of credit professionals that handle the day-to-day management of workouts, commercial recoveries, and problem loan sales. Its responsibilities include developing and implementing action plans, assessing risk ratings, and determining the appropriateness of the allowance, the accrual status, and the ultimate collectability of the Classified loan portfolio.
C&I PORTFOLIO
The C&I portfolio is comprised of loans to businesses where the source of repayment is associated with the on-going operations of the business. Generally, the loans are secured by the borrower’s assets, such as equipment, accounts receivable, and/or inventory. In many cases, the loans are secured by real estate, although the operation, sale, or refinancing of the real estate is not a primary source of repayment for the loan. For loans secured by real estate, appropriate appraisals are obtained at origination and updated on an as needed basis in compliance with regulatory requirements.
We manage the risks inherent in the C&I portfolio through origination policies, a defined loan concentration policy with established limits, on-going loan level reviews and portfolio level reviews, recourse requirements, and continuous portfolio risk management activities. Our origination policies for the C&I portfolio include loan product-type specific policies such as LTV and debt service coverage ratios, as applicable. Currently, a higher-risk segment of the C&I portfolio is loans to borrowers supporting oil and gas exploration and production and is further described below.
The C&I portfolio continues to have solid origination activity as evidenced by its growth over the past 12 months and we maintain a focus on high quality originations. Problem loans had trended downward over the last several years, reflecting a combination of proactive risk identification and effective workout strategies implemented by the SAD. However, over the past year, C&I problem loans began to increase, primarily as a result of the oil and gas exploration and production customers and the increase in overall portfolio size. We continue to maintain a proactive approach to identifying borrowers that may be facing financial difficulty in order to maximize the potential solutions. Subsequent to the origination of the loan, the Credit Review group provides an independent review and assessment of the quality of the underwriting and risk of new loan originations.
We have a dedicated energy lending group that focuses on upstream companies (exploration and production or E&P firms) as well as midstream (pipeline transportation) companies. This lending group is comprised of colleagues with many years of experience in this area of specialized lending, through several economic cycles. The exposure to the E&P companies is centered in broadly syndicated reserve-based loans and is 0.5% of our total loans. All of these loans are secured and in a first-lien position. The customer base consists of larger firms that generally have had access to the capital markets and/or are backed by private equity firms. This lending group has no exposure to oil field services companies. However, we have a few legacy oil field services customers for which the remaining aggregate credit exposure is negligible.
The significant reduction in oil and gas prices over the past year has had a negative impact on the energy industry, particularly exploration and production companies as well as the oil field services providers. The impact of low prices for an extended period of time has had some level of adverse impact on most, if not all, borrowers in this segment. Most of these borrowers have, therefore, had recent downward adjustments to their risk ratings, which has increased our loan loss reserve.
We have other energy related exposures, including gas stations, wholesale distributors, mining, and utilities. We continue to monitor these exposures closely. However, these exposures have different factors affecting their performance, and we have not seen the same level of volatility in performance or risk rating migration.
CRE PORTFOLIO
We manage the risks inherent in this portfolio specific to CRE lending, focusing on the quality of the developer and the specifics associated with each project. Generally, we: (1) limit our loans to 80% of the appraised value of the commercial real estate at origination, (2) require net operating cash flows to be 125% of required interest and principal payments, and (3) if the commercial real estate is non-owner occupied, require that at least 50% of the space of the project be preleased. We actively monitor both geographic and project-type concentrations and performance metrics of all CRE loan types, with a focus on loans identified as higher risk based on the risk rating methodology. Both macro-level and loan-level stress-test scenarios based on existing and forecast market conditions are part of the on-going portfolio management process for the CRE portfolio.
47
Dedicated real estate professionals originate and manage the portfolio. The portfolio is diversified by project type and loan size, and this diversification represents a significant portion of the credit risk management strategies employed for this portfolio. Subsequent to the origination of the loan, the Credit Review group provides an independent review and assessment of the quality of the underwriting and risk of new loan originations.
Appraisal values are obtained in conjunction with all originations and renewals, and on an as needed basis, in compliance with regulatory requirements and to ensure appropriate decisions regarding the on-going management of the portfolio reflect the changing market conditions. Appraisals are obtained from approved vendors and are reviewed by an internal appraisal review group comprised of certified appraisers to ensure the quality of the valuation used in the underwriting process. We continue to perform on-going portfolio level reviews within the CRE portfolio. These reviews generate action plans based on occupancy levels or sales volume associated with the projects being reviewed. This highly individualized process requires working closely with all of our borrowers, as well as an in-depth knowledge of CRE project lending and the market environment.
Consumer Credit
Consumer credit approvals are based on, among other factors, the financial strength and payment history of the borrower, type of exposure, and transaction structure. Consumer credit decisions are generally made in a centralized environment utilizing decision models. Importantly, certain individuals who understand each local region have the authority to make credit extension decisions to preserve our focus on the local communities in which we operate. Each credit extension is assigned a specific PD and LGD. The PD is generally based on the borrower’s most recent credit bureau score (FICO), which we update quarterly, providing an ongoing view of the borrowers PD. The LGD is related to the type of collateral associated with the credit extension, which typically does not change over the course of the loan term. This allows Huntington to maintain a current view of the customer for credit risk management and ACL purposes.
In consumer lending, credit risk is managed from a segment (i.e., loan type, collateral position, geography, etc.) and vintage performance analysis. All portfolio segments are continuously monitored for changes in delinquency trends and other asset quality indicators. We make extensive use of portfolio assessment models to continuously monitor the quality of the portfolio, which may result in changes to future origination strategies. The ongoing analysis and review process results in a determination of an appropriate ALLL amount for our consumer loan portfolio. The independent risk management group has a consumer process review component to ensure the effectiveness and efficiency of the consumer credit processes.
Collection action is initiated as needed through a centrally managed collection and recovery function. The collection group employs a series of collection methodologies designed to maintain a high level of effectiveness while maximizing efficiency. In addition to the consumer loan portfolio, the collection group is responsible for collection activity on all sold and securitized consumer loans and leases. Collection practices include a single contact point for the majority of the residential real estate secured portfolios.
AUTOMOBILE PORTFOLIO
Our strategy in the automobile portfolio continues to focus on high quality borrowers as measured by both FICO and internal custom scores, combined with appropriate LTVs, terms, and profitability. Our strategy and operational capabilities allow us to appropriately manage the origination quality across the entire portfolio, including our newer markets. Although increased origination volume and entering new markets can be associated with increased risk levels, we believe our disciplined strategy and operational processes significantly mitigate these risks.
We have continued to consistently execute our value proposition and take advantage of available market opportunities. Importantly, we have maintained our high credit quality standards while expanding the portfolio.
RESIDENTIAL REAL ESTATE SECURED PORTFOLIOS
The properties securing our residential mortgage and home equity portfolios are primarily located within our geographic footprint. Huntington continues to support our local markets with consistent underwriting across all residential secured products. The residential-secured portfolio originations continue to be of high quality, with the majority of the negative credit impact coming from loans originated in 2006 and earlier. Our portfolio management strategies associated with our Home Savers group allow us to focus on effectively helping our customers with appropriate solutions for their specific circumstances.
48
Table 10 - Selected Home Equity and Residential Mortgage Portfolio Data | |||||||||||||||||||||||
(dollar amounts in millions) |
|||||||||||||||||||||||
Home Equity |
Residential Mortgage |
||||||||||||||||||||||
Secured by first-lien |
Secured by junior-lien |
||||||||||||||||||||||
December 31, |
|||||||||||||||||||||||
2015 |
2014 |
2015 |
2014 |
2015 |
2014 |
||||||||||||||||||
Ending balance |
$ |
5,191 |
$ |
5,129 |
$ |
3,279 |
$ |
3,362 |
$ |
5,998 |
$ |
5,831 |
|||||||||||
Portfolio weighted-average LTV ratio (1) |
72 |
% |
71 |
% |
82 |
% |
81 |
% |
75 |
% |
74 |
% |
|||||||||||
Portfolio weighted-average FICO score (2) |
764 |
759 |
753 |
752 |
752 |
752 |
|||||||||||||||||
Home Equity |
Residential Mortgage (3) |
||||||||||||||||||||||
Secured by first-lien |
Secured by junior-lien |
||||||||||||||||||||||
Year Ended December 31, |
|||||||||||||||||||||||
2015 |
2014 |
2015 |
2014 |
2015 |
2014 |
||||||||||||||||||
Originations |
$ |
1,677 |
$ |
1,566 |
$ |
929 |
$ |
872 |
$ |
1,409 |
$ |
1,192 |
|||||||||||
Origination weighted-average LTV ratio (1) |
73 |
% |
74 |
% |
85 |
% |
83 |
% |
83 |
% |
83 |
% |
|||||||||||
Origination weighted-average FICO score (2) |
778 |
775 |
767 |
765 |
754 |
752 |
|||||||||||||||||
(1) |
The LTV ratios for home equity loans and home equity lines-of-credit are cumulative and reflect the balance of any senior loans. LTV ratios reflect collateral values at the time of loan origination. |
(2) |
Portfolio weighted average FICO scores reflect currently updated customer credit scores whereas origination weighted-average FICO scores reflect the customer credit scores at the time of loan origination. |
(3) |
Represents only owned-portfolio originations. |
Home Equity Portfolio
Our home equity portfolio (loans and lines-of-credit) consists of both first-lien and junior-lien mortgage loans with underwriting criteria based on minimum credit scores, debt-to-income ratios, and LTV ratios. We offer closed-end home equity loans which are generally fixed-rate with principal and interest payments, and variable-rate interest-only home equity lines-of-credit which do not require payment of principal during the 10-year revolving period of the line-of-credit. Applications are underwritten centrally in conjunction with an automated underwriting system.
Within the home equity portfolio, the standard product is a 10-year interest-only draw period with a 20-year fully amortizing term at the end of the draw period. After the 10-year draw period, the borrower must reapply, subject to full underwriting guidelines, to continue with the interest-only revolving structure and maintain draw capability or begin repaying the debt in a term structure.
Residential Mortgages Portfolio
Huntington underwrites all applications centrally, with a focus on higher quality borrowers. We do not originate residential mortgages that allow negative amortization or allow the borrower multiple payment options and have incorporated regulatory requirements and guidance into our underwriting process. Residential mortgages are originated based on a completed full appraisal during the credit underwriting process. We update values in compliance with applicable regulations to facilitate our portfolio management, as well as our workout and loss mitigation functions.
Several government programs continued to impact the residential mortgage portfolio, including various refinance programs such as HARP and HAMP, which positively affected the availability of credit for the industry. During the year ended December 31, 2015, we closed $189 million in HARP residential mortgages and $3 million in HAMP residential mortgages. The HARP and HAMP residential mortgage loans are part of our residential mortgage portfolio or serviced for others.
We are subject to repurchase risk associated with residential mortgage loans sold in the secondary market. An appropriate level of reserve for representations and warranties related to residential mortgage loans sold has been established to address this repurchase risk inherent in the portfolio.
Credit Quality
(This section should be read in conjunction with Note 3 of the Notes to Consolidated Financial Statements.)
We believe the most meaningful way to assess overall credit quality performance is through an analysis of credit quality performance ratios. This approach forms the basis of most of the discussion in the sections immediately following: NPAs and NALs,
49
TDRs, ACL, and NCOs. In addition, we utilize delinquency rates, risk distribution and migration patterns, and product segmentation in the analysis of our credit quality performance.
Credit quality performance in 2015 reflected continued overall positive results. Net charge-offs were substantially lower as a result of several large recoveries. NPAs increased 18% to $399 million, compared to December 31, 2014. NCOs decreased 30% compared to the prior year. The ACL to total loans ratio decreased by 7 basis points to 1.33%.
NPAs and NALs
NPAs consist of (1) NALs, which represent loans and leases no longer accruing interest, (2) OREO properties, and (3) other NPAs. Any loan in our portfolio may be placed on nonaccrual status prior to the policies described below when collection of principal or interest is in doubt. Also, when a borrower with discharged non-reaffirmed debt in a Chapter 7 bankruptcy is identified and the loan is determined to be collateral dependent, the loan is placed on nonaccrual status.
C&I and CRE loans (except for purchased credit impaired loans) are placed on nonaccrual status at 90-days past due, or earlier if repayment of principal and interest is in doubt. Of the $204 million of CRE and C&I-related NALs at December 31, 2015, $135 million, or 66%, represented loans that were less than 30-days past due, demonstrating our continued commitment to proactive credit risk management. With the exception of residential mortgage loans guaranteed by government organizations which continue to accrue interest, first lien loans secured by residential mortgage collateral are placed on nonaccrual status at 150-days past due. Junior-lien home equity loans are placed on nonaccrual status at the earlier of 120-days past due or when the related first-lien loan has been identified as nonaccrual. Automobile and other consumer loans are generally charged-off prior to the loan reaching 120-days past due.
When loans are placed on nonaccrual, accrued interest income is reversed with current year accruals charged to interest income and prior year amounts generally charged-off as a credit loss. When, in our judgment, the borrower’s ability to make required interest and principal payments has resumed and collectability is no longer in doubt, the loan or lease could be returned to accrual status.
The table reflects period-end NALs and NPAs detail for each of the last five years:
Table 11 - Nonaccrual Loans and Leases and Nonperforming Assets | |||||||||||||||||||
(dollar amounts in thousands) |
|||||||||||||||||||
At December 31, |
|||||||||||||||||||
2015 |
2014 |
2013 |
2012 |
2011 |
|||||||||||||||
Nonaccrual loans and leases: |
|||||||||||||||||||
Commercial and industrial |
$ |
175,195 |
$ |
71,974 |
$ |
56,615 |
$ |
90,705 |
$ |
201,846 |
|||||||||
Commercial real estate |
28,984 |
48,523 |
73,417 |
127,128 |
229,889 |
||||||||||||||
Automobile |
6,564 |
4,623 |
6,303 |
7,823 |
— |
||||||||||||||
Residential mortgages |
94,560 |
96,564 |
119,532 |
122,452 |
68,658 |
||||||||||||||
Home equity |
66,278 |
78,515 |
66,169 |
59,519 |
40,687 |
||||||||||||||
Other Consumer |
— |
45 |
20 |
6 |
— |
||||||||||||||
Total nonaccrual loans and leases |
371,581 |
300,244 |
322,056 |
407,633 |
541,080 |
||||||||||||||
Other real estate owned, net |
|||||||||||||||||||
Residential |
24,194 |
29,291 |
23,447 |
21,378 |
20,330 |
||||||||||||||
Commercial |
3,148 |
5,748 |
4,217 |
6,719 |
18,094 |
||||||||||||||
Total other real estate, net |
27,342 |
35,039 |
27,664 |
28,097 |
38,424 |
||||||||||||||
Other nonperforming assets(1)
|
— |
2,440 |
2,440 |
10,045 |
10,772 |
||||||||||||||
Total nonperforming assets |
$ |
398,923 |
$ |
337,723 |
$ |
352,160 |
$ |
445,775 |
$ |
590,276 |
|||||||||
Nonaccrual loans as a % of total loans and leases |
0.74 |
% |
0.63 |
% |
0.75 |
% |
1.00 |
% |
1.39 |
% |
|||||||||
Nonperforming assets ratio(2)
|
0.79 |
0.71 |
0.82 |
1.09 |
1.51 |
||||||||||||||
Allowance for loan and lease losses as % of: |
|||||||||||||||||||
Nonaccrual loans and leases |
161 |
% |
202 |
% |
201 |
% |
189 |
% |
178 |
% |
|||||||||
Nonperforming assets |
150 |
179 |
184 |
173 |
163 |
||||||||||||||
Allowance for credit losses as % of: |
|||||||||||||||||||
Nonaccrual loans and leases |
180 |
% |
222 |
% |
221 |
% |
199 |
% |
187 |
% |
|||||||||
50
Nonperforming assets |
168 |
197 |
202 |
182 |
172 |
||||||||||||||
(1) |
Other nonperforming assets includes certain impaired investment securities. |
(2) |
This ratio is calculated as nonperforming assets divided by the sum of loans and leases, impaired loans held for sale, net other real estate owned, and other nonperforming assets. |
The $61 million, or 18%, increase in NPAs compared with December 31, 2014, primarily reflected:
• |
$103 million, or 143%, increase in C&I NALs, primarily reflecting the addition of several large oil and gas exploration and production relationships in the 2015 fourth quarter. The remaining increase is not related to any specific industry or structure.
|
Partially offset by:
• |
$20 million, or 40%, decline in CRE NALs, reflecting improved delinquency trends and successful workout strategies implemented by our commercial loan workout group.
|
• |
$12 million, or 16%, decline in home equity NALs, reflecting improved delinquency trends and moving $8.9 million of nonaccrual home equity TDRs from loans to loans held for sale.
|
• |
$8 million, or 22%, decline in OREO, specifically associated with the sale of residential properties.
|
The following table reflects period-end accruing loans and leases 90 days or more past due for each of the last five years:
Table 12 - Accruing Past Due Loans and Leases | |||||||||||||||||||
(dollar amounts in thousands) |
|||||||||||||||||||
At December 31, |
|||||||||||||||||||
2015 |
2014 |
2013 |
2012 |
2011 |
|||||||||||||||
Accruing loans and leases past due 90 days or more | |||||||||||||||||||
Commercial and industrial (1) |
$ |
8,724 |
$ |
4,937 |
$ |
14,562 |
$ |
26,648 |
$ |
— |
|||||||||
Commercial real estate (2) |
9,549 |
18,793 |
39,142 |
56,660 |
— |
||||||||||||||
Automobile |
7,162 |
5,703 |
5,055 |
4,418 |
6,265 |
||||||||||||||
Residential mortgage (excluding loans guaranteed by the U.S. government) |
14,082 |
33,040 |
2,469 |
2,718 |
45,198 |
||||||||||||||
Home equity |
9,044 |
12,159 |
13,983 |
18,200 |
20,198 |
||||||||||||||
Other loans and leases |
1,394 |
837 |
998 |
1,672 |
1,988 |
||||||||||||||
Total, excl. loans guaranteed by the U.S. government |
49,955 |
75,469 |
76,209 |
110,316 |
73,649 |
||||||||||||||
Add: loans guaranteed by the U.S. government |
55,835 |
55,012 |
87,985 |
90,816 |
96,703 |
||||||||||||||
Total accruing loans and leases past due 90 days or more, including loans guaranteed by the U.S. government |
$ |
105,790 |
$ |
130,481 |
$ |
164,194 |
$ |
201,132 |
$ |
170,352 |
|||||||||
Ratios: |
|||||||||||||||||||
Excluding loans guaranteed by the U.S. government, as a percent of total loans and leases |
0.10 |
% |
0.16 |
% |
0.18 |
% |
0.27 |
% |
0.19 |
% |
|||||||||
Guaranteed by the U.S. government, as a percent of total loans and leases |
0.11 |
0.12 |
0.20 |
0.22 |
0.25 |
||||||||||||||
Including loans guaranteed by the U.S. government, as a percent of total loans and leases |
0.21 |
0.27 |
0.38 |
0.49 |
0.44 |
||||||||||||||
(1) |
Amounts include Huntington Technology Finance administrative lease delinquencies and accruing purchase impaired loans related to acquisitions. |
(2) |
Amounts include accruing purchase impaired loans related to acquisitions. |
TDR Loans
51
TDRs are modified loans where a concession was provided to a borrower experiencing financial difficulties. TDRs can be classified as either accruing or nonaccruing loans. Nonaccrual TDRs are included in NALs whereas accruing TDRs are excluded from NALs, as it is probable that all contractual principal and interest due under the restructured terms will be collected. TDRs primarily reflect our loss mitigation efforts to proactively work with borrowers in financial difficulty or to comply with regulatory regulations regarding the treatment of certain bankruptcy filing situations. Over the past five quarters, the accruing component of the total TDR balance has been between 86% and 83% indicating there is no identified credit loss and the borrowers continue to make their monthly payments. In fact, over 81% of the $464 million of accruing TDRs secured by residential real estate (Residential mortgage and Home Equity in Table 14) are current on their required payments. In addition over 60% of the accruing pool have had no delinquency at all in the past 12 months. There is very limited migration from the accruing to non-accruing components, and virtually all of the charge-offs as presented in Table 14 come from the non-accruing TDR balances.
The following table presents our accruing and nonaccruing TDRs at period-end for each of the past five years:
Table 13 - Accruing and Nonaccruing Troubled Debt Restructured Loans | |||||||||||||||||||
(dollar amounts in thousands) |
|||||||||||||||||||
At December 31, |
|||||||||||||||||||
2015 |
2014 |
2013 |
2012 |
2011 |
|||||||||||||||
Troubled debt restructured loans—accruing: |
|||||||||||||||||||
Commercial and industrial |
$ |
235,689 |
$ |
116,331 |
$ |
83,857 |
$ |
76,586 |
$ |
54,007 |
|||||||||
Commercial real estate |
115,074 |
177,156 |
204,668 |
208,901 |
249,968 |
||||||||||||||
Automobile |
24,893 |
26,060 |
30,781 |
35,784 |
36,573 |
||||||||||||||
Home equity |
199,393 |
(1) |
252,084 |
188,266 |
110,581 |
52,224 |
|||||||||||||
Residential mortgage |
264,666 |
265,084 |
305,059 |
290,011 |
309,678 |
||||||||||||||
Other consumer |
4,488 |
4,018 |
1,041 |
2,544 |
6,108 |
||||||||||||||
Total troubled debt restructured loans—accruing |
844,203 |
840,733 |
813,672 |
724,407 |
708,558 |
||||||||||||||
Troubled debt restructured loans—nonaccruing: |
|||||||||||||||||||
Commercial and industrial |
56,919 |
20,580 |
7,291 |
19,268 |
48,553 |
||||||||||||||
Commercial real estate |
16,617 |
24,964 |
23,981 |
32,548 |
21,968 |
||||||||||||||
Automobile |
6,412 |
4,552 |
6,303 |
7,823 |
— |
||||||||||||||
Home equity |
20,996 |
(2) |
27,224 |
20,715 |
6,951 |
369 |
|||||||||||||
Residential mortgage |
71,640 |
69,305 |
82,879 |
84,515 |
26,089 |
||||||||||||||
Other consumer |
151 |
70 |
— |
113 |
113 |
||||||||||||||
Total troubled debt restructured loans—nonaccruing |
172,735 |
146,695 |
141,169 |
151,218 |
97,092 |
||||||||||||||
Total troubled debt restructured loans |
$ |
1,016,938 |
$ |
987,428 |
$ |
954,841 |
$ |
875,625 |
$ |
805,650 |
|||||||||
(1) |
Excludes approximately $88 million in accruing home equity TDRs transferred from loans to loans held for sale at September 30, 2015. |
(2) |
Excludes approximately $9 million in nonaccruing home equity TDRs transferred from loans to loans held for sale at September 30, 2015. |
Our strategy is to structure TDRs in a manner that avoids new concessions subsequent to the initial TDR terms. However, there are times when subsequent modifications are required, such as when the modified loan matures. Often the loans are performing in accordance with the TDR terms, and a new note is originated with similar modified terms. These loans are subjected to the normal underwriting standards and processes for other similar credit extensions, both new and existing. If the loan is not performing in accordance with the existing TDR terms, typically an individualized approach to repayment is established. In accordance with ASC 310-20-35, the refinanced note is evaluated to determine if it is considered a new loan or a continuation of the prior loan. A new loan is considered for removal of the TDR designation. A continuation of the prior note requires the continuation of the TDR designation, and because the refinanced note constitutes a new or amended debt instrument, it is included in our TDR activity table (below) as a new TDR and a restructured TDR removal during the period.
The types of concessions granted are consistent with those granted on new TDRs and include interest rate reductions, amortization or maturity date changes beyond what the collateral supports, and principal forgiveness based on the borrower’s specific
52
needs at a point in time. Our policy does not limit the number of times a loan may be modified. A loan may be modified multiple times if it is considered to be in the best interest of both the borrower and Huntington.
Commercial loans are not automatically considered to be accruing TDRs upon the granting of a new concession. If the loan is in accruing status and no loss is expected based on the modified terms, the modified TDR remains in accruing status. For loans that are on nonaccrual status before the modification, collection of both principal and interest must not be in doubt, and the borrower must be able to exhibit sufficient cash flows for at least a six-month period of time to service the debt in order to return to accruing status. This six-month period could extend before or after the restructure date.
Any granted change in terms or conditions that are not readily available in the market for that borrower, requires the designation as a TDR. There are no provisions for the removal of the TDR designation based on payment activity for consumer loans. A loan may be returned to accrual status when all contractually due interest and principal has been paid and the borrower demonstrates the financial capacity to continue to pay as agreed, with the risk of loss diminished. During the 2015 third quarter, Huntington transferred $96.8 million of home equity TDRs from loans to loans held for sale in anticipation of a sale.
The following table reflects TDR activity for each of the past five years:
Table 14 - Troubled Debt Restructured Loan Activity | |||||||||||||||||||
(dollar amounts in thousands) |
|||||||||||||||||||
Year Ended December 31, |
|||||||||||||||||||
2015 |
2014 |
2013 |
2012 |
2011 |
|||||||||||||||
TDRs, beginning of period |
$ |
987,428 |
$ |
954,841 |
$ |
875,625 |
$ |
805,650 |
$ |
666,880 |
|||||||||
New TDRs |
894,700 |
(1) |
667,315 |
611,556 |
597,425 |
583,439 |
|||||||||||||
Payments |
(290,358 |
) (2) |
(252,285 |
) |
(191,367 |
) |
(191,035 |
) |
(138,467 |
) |
|||||||||
Charge-offs |
(43,491 |
) (3) |
(35,150 |
) |
(29,897 |
) |
(81,115 |
) |
(37,341 |
) |
|||||||||
Sales |
(17,062 |
) |
(23,424 |
) |
(11,164 |
) |
(13,787 |
) |
(54,715 |
) |
|||||||||
Transfer to held-for-sale |
(96,786 |
) |
— |
— |
— |
— |
|||||||||||||
Refinanced to non-TDR |
— |
— |
— |
— |
(40,091 |
) |
|||||||||||||
Transfer to OREO |
(10,112 |
) |
(12,668 |
) |
(8,242 |
) |
(21,709 |
) |
(5,016 |
) |
|||||||||
Restructured TDRs—accruing (4) |
(297,688 |
) |
(243,225 |
) |
(211,131 |
) |
(153,583 |
) |
(154,945 |
) |
|||||||||
Restructured TDRs—nonaccruing (4) |
(98,474 |
) |
(45,705 |
) |
(26,772 |
) |
(63,080 |
) |
(47,659 |
) |
|||||||||
Other |
(11,219 |
) |
(22,271 |
) |
(53,767 |
) |
(3,141 |
) |
33,565 |
||||||||||
TDRs, end of period |
$ |
1,016,938 |
$ |
987,428 |
$ |
954,841 |
$ |
875,625 |
$ |
805,650 |
|||||||||
(1) |
Amount includes $732 million accruing TDRs |
(2) |
Amount includes $225 million accruing TDRs |
(3) |
Amount includes $6 million accruing TDRs. |
(4) |
Represents existing TDRs that were underwritten with new terms providing a concession. A corresponding amount is included in the New TDRs amount above. |
ACL
Our total credit reserve is comprised of two different components, both of which in our judgment are appropriate to absorb credit losses inherent in our loan and lease portfolio: the ALLL and the AULC. Combined, these reserves comprise the total ACL. Our ACL methodology committee is responsible for developing the methodology, assumptions and estimates used in the calculation, as well as determining the appropriateness of the ACL. The ALLL represents the estimate of losses inherent in the loan portfolio at the reported date. Additions to the ALLL result from recording provision expense for loan losses or increased risk levels resulting from loan risk-rating downgrades, while reductions reflect charge-offs (net of recoveries), decreased risk levels resulting from loan risk-rating upgrades, or the sale of loans. The AULC is determined by applying the same quantitative reserve determination process to the unfunded portion of the loan exposures adjusted by an applicable funding expectation.
During the 2015 first quarter, we reviewed our existing commercial and consumer credit models and enhanced certain processes and methods of ACL estimation. During this review, we updated our analysis of the loss emergence periods used for consumer receivables collectively evaluated for impairment and, as a result, extended our loss emergence periods for products within these portfolios. As part of these enhancements to our credit reserve process, we also evaluated the methods used to separately estimate economic risks inherent in our portfolios and decided to no longer utilize these separate estimation techniques. Rather, we now incorporate economic risks in our loss estimates as a component of our reserve calculation. The enhancements made to our credit reserve processes during the 2015 first quarter allow for increased segmentation and analysis of the estimated incurred losses within our loan portfolios. The net ACL impact of these enhancements was immaterial.
53
During the 2015 third quarter, we reviewed our existing commercial and consumer credit models and completed a periodic reassessment of certain ACL assumptions. Specifically, we updated our analysis of the loss emergence periods used for commercial receivables collectively evaluated for impairment. Based on our observed portfolio experience, we extended our loss emergence periods for the C&I portfolio and CRE portfolios. We also updated loss factors in our consumer home equity and residential mortgage portfolios based on more recently observed portfolio experience. The net ACL impact of these enhancements was immaterial.
We regularly evaluate the appropriateness of the ACL by performing on-going evaluations of the loan and lease portfolio, including such factors as the differing economic risks associated with each loan category, the financial condition of specific borrowers, the level of delinquent loans, the value of any collateral and, where applicable, the existence of any guarantees or other documented support. We evaluate the impact of changes in interest rates and overall economic conditions on the ability of borrowers to meet their financial obligations when quantifying our exposure to credit losses and assessing the appropriateness of our ACL at each reporting date. In addition to general economic conditions and the other factors described above, additional factors considered include: the impact of increasing or decreasing residential real estate values, the diversification of CRE loans; the development of new or expanded Commercial business verticals such as healthcare, ABL, and energy. A provision for credit losses is recorded to adjust the ACL to the level we have determined to be appropriate to absorb credit losses inherent in our loan and lease portfolio as of the balance sheet date.
Our ACL evaluation process includes the on-going assessment of credit quality metrics, and a comparison of certain ACL benchmarks to current performance. While the total ACL balance has declined in recent years, all of the relevant benchmarks remain strong.
The following table reflects activity in the ALLL and AULC for each of the last five years:
54
Table 15 - Summary of Allowance for Credit Losses | |||||||||||||||||||
(dollar amounts in thousands) |
|||||||||||||||||||
Year Ended December 31, |
|||||||||||||||||||
2015 |
2014 |
2013 |
2012 |
2011 |
|||||||||||||||
Allowance for loan and lease losses, beginning of year |
$ |
605,196 |
$ |
647,870 |
$ |
769,075 |
$ |
964,828 |
$ |
1,249,008 |
|||||||||
Loan and lease charge-offs |
|||||||||||||||||||
Commercial: |
|||||||||||||||||||
Commercial and industrial |
(79,724 |
) |
(76,654 |
) |
(45,904 |
) |
(101,475 |
) |
(134,385 |
) |
|||||||||
Commercial real estate: |
|||||||||||||||||||
Construction |
(1,843 |
) |
(5,626 |
) |
(9,585 |
) |
(12,131 |
) |
(42,012 |
) |
|||||||||
Commercial |
(16,233 |
) |
(19,078 |
) |
(59,927 |
) |
(105,920 |
) |
(140,747 |
) |
|||||||||
Commercial real estate |
(18,076 |
) |
(24,704 |
) |
(69,512 |
) |
(118,051 |
) |
(182,759 |
) |
|||||||||
Total commercial |
(97,800 |
) |
(101,358 |
) |
(115,416 |
) |
(219,526 |
) |
(317,144 |
) |
|||||||||
Consumer: |
|||||||||||||||||||
Automobile |
(36,489 |
) |
(31,330 |
) |
(23,912 |
) |
(26,070 |
) |
(33,593 |
) |
|||||||||
Home equity |
(36,481 |
) |
(54,473 |
) |
(98,184 |
) |
(124,286 |
) |
(109,427 |
) |
|||||||||
Residential mortgage |
(15,696 |
) |
(25,946 |
) |
(34,236 |
) |
(52,228 |
) |
(65,069 |
) |
|||||||||
Other consumer |
(31,415 |
) |
(33,494 |
) |
(34,568 |
) |
(33,090 |
) |
(32,520 |
) |
|||||||||
Total consumer |
(120,081 |
) |
(145,243 |
) |
(190,900 |
) |
(235,674 |
) |
(240,609 |
) |
|||||||||
Total charge-offs |
(217,881 |
) |
(246,601 |
) |
(306,316 |
) |
(455,200 |
) |
(557,753 |
) |
|||||||||
Recoveries of loan and lease charge-offs |
|||||||||||||||||||
Commercial: |
|||||||||||||||||||
Commercial and industrial |
51,800 |
44,531 |
29,514 |
37,227 |
44,686 |
||||||||||||||
Commercial real estate: |
|||||||||||||||||||
Construction |
2,667 |
4,455 |
3,227 |
4,090 |
10,488 |
||||||||||||||
Commercial |
31,952 |
29,616 |
41,431 |
35,532 |
24,170 |
||||||||||||||
Total commercial real estate |
34,619 |
34,071 |
44,658 |
39,622 |
34,658 |
||||||||||||||
Total commercial |
86,419 |
78,602 |
74,172 |
76,849 |
79,344 |
||||||||||||||
Consumer: |
|||||||||||||||||||
Automobile |
16,198 |
13,762 |
13,375 |
16,628 |
18,526 |
||||||||||||||
Home equity |
16,631 |
17,526 |
15,921 |
7,907 |
7,630 |
||||||||||||||
Residential mortgage |
5,570 |
6,194 |
7,074 |
4,305 |
8,388 |
||||||||||||||
Other consumer |
5,270 |
5,890 |
7,108 |
7,049 |
6,776 |
||||||||||||||
Total consumer |
43,669 |
43,372 |
43,478 |
35,889 |
41,320 |
||||||||||||||
Total recoveries |
130,088 |
121,974 |
117,650 |
112,738 |
120,664 |
||||||||||||||
Net loan and lease charge-offs |
(87,793 |
) |
(124,627 |
) |
(188,666 |
) |
(342,462 |
) |
(437,089 |
) |
|||||||||
Provision for loan and lease losses |
88,679 |
83,082 |
67,797 |
155,193 |
167,730 |
||||||||||||||
Allowance for assets sold and securitized or transferred to loans held for sale |
(8,239 |
) |
(1,129 |
) |
(336 |
) |
(8,484 |
) |
(14,821 |
) |
|||||||||
Allowance for loan and lease losses, end of year |
597,843 |
605,196 |
647,870 |
769,075 |
964,828 |
||||||||||||||
Allowance for unfunded loan commitments, beginning of year |
60,806 |
62,899 |
40,651 |
48,456 |
42,127 |
||||||||||||||
(Reduction in) Provision for unfunded loan commitments and letters of credit losses |
11,275 |
(2,093 |
) |
22,248 |
(7,805 |
) |
6,329 |
||||||||||||
Allowance for unfunded loan commitments, end of year |
72,081 |
60,806 |
62,899 |
40,651 |
48,456 |
||||||||||||||
Allowance for credit losses, end of year |
$ |
669,924 |
$ |
666,002 |
$ |
710,769 |
$ |
809,726 |
$ |
1,013,284 |
|||||||||
The table below reflects the allocation of our ACL among our various loan categories during each of the past five years:
55
Table 16 - Allocation of Allowance for Credit Losses (1) | ||||||||||||||||||||||||||||||||||
(dollar amounts in thousands) |
||||||||||||||||||||||||||||||||||
At December 31, |
||||||||||||||||||||||||||||||||||
2015 |
2014 |
2013 |
2012 |
2011 |
||||||||||||||||||||||||||||||
Commercial: |
||||||||||||||||||||||||||||||||||
Commercial and industrial |
$ |
298,746 |
41 |
% |
$ |
286,995 |
40 |
% |
$ |
265,801 |
41 |
% |
$ |
241,051 |
42 |
% |
$ |
275,367 |
38 |
% |
||||||||||||||
Commercial real estate |
100,007 |
10 |
102,839 |
11 |
162,557 |
11 |
285,369 |
14 |
388,706 |
14 |
||||||||||||||||||||||||
Total commercial |
398,753 |
51 |
389,834 |
51 |
428,358 |
52 |
526,420 |
56 |
664,073 |
52 |
||||||||||||||||||||||||
Consumer: |
||||||||||||||||||||||||||||||||||
Automobile |
49,504 |
19 |
33,466 |
18 |
31,053 |
15 |
34,979 |
11 |
38,282 |
11 |
||||||||||||||||||||||||
Home equity |
83,671 |
17 |
96,413 |
18 |
111,131 |
19 |
118,764 |
20 |
143,873 |
21 |
||||||||||||||||||||||||
Residential mortgage |
41,646 |
12 |
47,211 |
12 |
39,577 |
12 |
61,658 |
12 |
87,194 |
13 |
||||||||||||||||||||||||
Other loans |
24,269 |
1 |
38,272 |
1 |
37,751 |
2 |
27,254 |
1 |
31,406 |
3 |
||||||||||||||||||||||||
Total consumer |
199,090 |
49 |
215,362 |
49 |
219,512 |
48 |
242,655 |
44 |
300,755 |
48 |
||||||||||||||||||||||||
Total allowance for loan and lease losses |
597,843 |
100 |
% |
605,196 |
100 |
% |
647,870 |
100 |
% |
769,075 |
100 |
% |
964,828 |
100 |
% |
|||||||||||||||||||
Allowance for unfunded loan commitments |
72,081 |
60,806 |
62,899 |
40,651 |
48,456 |
|||||||||||||||||||||||||||||
Total allowance for credit losses |
$ |
669,924 |
$ |
666,002 |
$ |
710,769 |
$ |
809,726 |
$ |
1,013,284 |
||||||||||||||||||||||||
Total allowance for loan and leases losses as % of: | ||||||||||||||||||||||||||||||||||
Total loans and leases |
1.19 |
% |
1.27 |
% |
1.50 |
% |
1.89 |
% |
2.48 |
% |
||||||||||||||||||||||||
Nonaccrual loans and leases |
161 |
202 |
201 |
189 |
178 |
|||||||||||||||||||||||||||||
Nonperforming assets |
150 |
179 |
184 |
173 |
163 |
|||||||||||||||||||||||||||||
Total allowance for credit losses as % of: | ||||||||||||||||||||||||||||||||||
Total loans and leases |
1.33 |
% |
1.40 |
% |
1.65 |
% |
1.99 |
% |
2.60 |
% |
||||||||||||||||||||||||
Nonaccrual loans and leases |
180 |
222 |
221 |
199 |
187 |
|||||||||||||||||||||||||||||
Nonperforming assets |
168 |
197 |
202 |
182 |
172 |
|||||||||||||||||||||||||||||
(1) |
Percentages represent the percentage of each loan and lease category to total loans and leases. |
The $4 million, or 1%, increase in the ACL compared with December 31, 2014, was driven by:
• |
$16 million, or 48%, increase in the ALLL of the automobile portfolio. The increase was driven by growth in loan balances, along with the extension of loss emergence periods embedded within the portfolio’s reserve factors. It was partially offset by the impact of no longer utilizing separate qualitative methods to estimate economic risks inherent in our portfolio.
|
• |
$12 million, or 4%, increase in the ALLL of the C&I portfolio. The increase in the allowance for credit losses within the commercial portfolio reflects the impact of select downgrades, including within the Oil & Gas portfolio. In addition, the extension of the loss emergence periods utilized in establishing the portfolio’s reserve factors contributed to the increase in reserve levels. Offsetting these increases was the decision to no longer utilize separate qualitative methods to estimate economic risks inherent in our portfolio, as well as improved performance on the Pass Graded portfolio over the past year.
|
• |
$11 million, or 19%, increase in the AULC driven by both Commercial and Consumer portfolio growth and by risk rating migration within the C&I portfolio which impacted the updated assessment of the unfunded commercial exposure.
|
Partially offset by:
• |
$14 million, or 37%, decline in the ALLL of the other consumer portfolio. The decline was primarily driven by our assessment of consumer overdraft reserve factors, and the impact of no longer utilizing separate qualitative methods to estimate economic risks inherent in our portfolios.
|
• |
$13 million, or 13%, decline in the ALLL of the home equity portfolio. Continued improvement in the residential real estate market led to improved expected loss factors in the portfolio, along with no longer utilizing separate qualitative methods to estimate economic risks inherent in the portfolio. These reductions were partially offset by the extension of loss emergence periods utilized in the reserve factors for the portfolio.
|
• |
$6 million, or 12%, decline in the ALLL of the residential mortgage portfolio. Continued improvement in both the residential real estate market and portfolio delinquency performance led to improved expected loss factors in the portfolio, along with no longer utilizing separate qualitative methods to estimate economic risks inherent in the portfolio lead to the reduction in reserve levels. These reductions were partially offset by the extension of loss emergence periods utilized in the reserve factors for the portfolio.
|
56
• |
$3 million, or 3%, decline in the ALLL of the CRE portfolio. The decline was driven by improving credit quality particularly reductions in CRE NALs as well as management’s decision to no longer utilize separate qualitative methods to estimate economic risks inherent in our portfolio and was partially offset by increases from the extension of loss emergence periods utilized in the reserve factors.
|
The ACL to total loans declined to 1.33% at December 31, 2015, compared to 1.40% at December 31, 2014. Management believes the decline in the ratio is appropriate given the risk profile of our loan portfolio. Further, the continued focus on early identification of loans with changes in credit metrics and proactive action plans for these loans, originating high quality new loans, and SAD resolutions is expected to contribute to maintaining our key credit quality metrics.
Given the combination of these noted positive and negative factors, we believe that our ACL is appropriate and its coverage level is reflective of the quality of our portfolio and the current operating environment.
NCOs
Any loan in any portfolio may be charged-off prior to the policies described below if a loss confirming event has occurred. Loss confirming events include, but are not limited to, bankruptcy (unsecured), continued delinquency, foreclosure, or receipt of an asset valuation indicating a collateral deficiency where that asset is the sole source of repayment. Additionally, discharged, collateral dependent non-reaffirmed debt in Chapter 7 bankruptcy filings will result in a charge-off to estimated collateral value, less anticipated selling costs at the time of discharge.
C&I and CRE loans are either charged-off or written down to net realizable value at 90-days past due with the exception of administrative small ticket lease delinquencies. Automobile loans and other consumer loans are generally charged-off at 120-days past due. First-lien and junior-lien home equity loans are charged-off to the estimated fair value of the collateral, less anticipated selling costs, at 150-days past due and 120-days past due, respectively. Residential mortgages are charged-off to the estimated fair value of the collateral, less anticipated selling costs, at 150-days past due.
The following table reflects NCO detail for each of the last five years:
57
Table 17 - Net Loan and Lease Charge-offs |
|||||||||||||||||||
(dollar amounts in thousands) |
|||||||||||||||||||
Year Ended December 31, |
|||||||||||||||||||
2015 |
2014 |
2013 |
2012 |
2011 |
|||||||||||||||
Net charge-offs by loan and lease type |
|||||||||||||||||||
Commercial: |
|||||||||||||||||||
Commercial and industrial |
$ |
27,924 |
$ |
32,123 |
$ |
16,390 |
$ |
64,248 |
$ |
89,699 |
|||||||||
Commercial real estate: |
|||||||||||||||||||
Construction |
(824 |
) |
1,171 |
6,358 |
8,041 |
31,524 |
|||||||||||||
Commercial |
(15,719 |
) |
(10,538 |
) |
18,496 |
70,388 |
116,577 |
||||||||||||
Total commercial real estate |
(16,543 |
) |
(9,367 |
) |
24,854 |
78,429 |
148,101 |
||||||||||||
Total commercial |
11,381 |
22,756 |
41,244 |
142,677 |
237,800 |
||||||||||||||
Consumer: |
|||||||||||||||||||
Automobile |
20,291 |
17,568 |
10,537 |
9,442 |
15,067 |
||||||||||||||
Home equity |
19,850 |
36,947 |
82,263 |
116,379 |
101,797 |
||||||||||||||
Residential mortgage |
10,126 |
19,752 |
27,162 |
47,923 |
56,681 |
||||||||||||||
Other consumer |
26,145 |
27,604 |
27,460 |
26,041 |
25,744 |
||||||||||||||
Total consumer |
76,412 |
101,871 |
147,422 |
199,785 |
199,289 |
||||||||||||||
Total net charge-offs |
$ |
87,793 |
$ |
124,627 |
$ |
188,666 |
$ |
342,462 |
$ |
437,089 |
|||||||||
Net charge-offs ratio: |
|||||||||||||||||||
Commercial: |
|||||||||||||||||||
Commercial and industrial |
0.14 |
% |
0.18 |
% |
0.10 |
% |
0.40 |
% |
0.66 |
% |
|||||||||
Commercial real estate: |
|||||||||||||||||||
Construction |
(0.08 |
) |
0.16 |
1.10 |
1.38 |
5.33 |
|||||||||||||
Commercial |
(0.37 |
) |
(0.25 |
) |
0.42 |
1.35 |
2.08 |
||||||||||||
Commercial real estate |
(0.32 |
) |
(0.19 |
) |
0.49 |
1.36 |
2.39 |
||||||||||||
Total commercial |
0.05 |
0.10 |
0.19 |
0.66 |
1.20 |
||||||||||||||
Consumer: |
|||||||||||||||||||
Automobile |
0.23 |
0.23 |
0.19 |
0.21 |
0.26 |
||||||||||||||
Home equity |
0.23 |
0.44 |
0.99 |
1.40 |
1.28 |
||||||||||||||
Residential mortgage |
0.17 |
0.35 |
0.52 |
0.92 |
1.20 |
||||||||||||||
Other consumer |
5.44 |
6.99 |
6.30 |
5.72 |
4.85 |
||||||||||||||
Total consumer |
0.32 |
0.46 |
0.75 |
1.08 |
1.05 |
||||||||||||||
Net charge-offs as a % of average loans |
0.18 |
% |
0.27 |
% |
0.45 |
% |
0.85 |
% |
1.12 |
% |
|||||||||
In assessing NCO trends, it is helpful to understand the process of how commercial loans are treated as they deteriorate over time. The ALLL established is consistent with the level of risk associated with the original underwriting. As a part of our normal portfolio management process for commercial loans, the loan is periodically reviewed and the ALLL is increased or decreased based on the updated risk rating. In certain cases, the standard ALLL is determined to not be appropriate, and a specific reserve is established based on the projected cash flow or collateral value of the specific loan. Charge-offs, if necessary, are generally recognized in a period after the specific ALLL was established. If the previously established ALLL exceeds that necessary to satisfactorily resolve the problem loan, a reduction in the overall level of the ALLL could be recognized. Consumer loans are treated in much the same manner as commercial loans, with increasing reserve factors applied based on the risk characteristics of the loan, although specific reserves are not identified for consumer loans. In summary, if loan quality deteriorates, the typical credit sequence would be periods of reserve building, followed by periods of higher NCOs as the previously established ALLL is utilized. Additionally, an increase in the ALLL either precedes or is in conjunction with increases in NALs. When a loan is classified as NAL, it is evaluated for specific ALLL or charge-off. As a result, an increase in NALs does not necessarily result in an increase in the ALLL or an expectation of higher future NCOs.
All residential mortgage loans greater than 150-days past due are charged-down to the estimated value of the collateral, less anticipated selling costs. The remaining balance is in delinquent status until a modification can be completed, or the loan goes through the foreclosure process. For the home equity portfolio, all of the defaults represent full charge-offs, as there is no remaining equity, creating a lower delinquency rate but a higher NCO impact.
2015 versus 2014
58
NCOs decreased $37 million, or 30%, in 2015, primarily as a result of continued credit quality improvement in the CRE, home equity and residential mortgage portfolios. Given the low level of C&I and CRE NCO’s, there will continue to be some volatility on a period-to-period comparison basis.
Market Risk
Market risk represents the risk of loss due to changes in market values of assets and liabilities. We incur market risk in the normal course of business through exposures to market interest rates, foreign exchange rates, equity prices, and credit spreads. We have identified two primary sources of market risk: interest rate risk and price risk.
Interest Rate Risk
OVERVIEW
Huntington actively manages interest rate risk, as changes in market interest rates can have a significant impact on reported earnings. The interest rate risk process is designed to compare income simulations under different market scenarios designed to alter the direction, magnitude, and speed of interest rate changes, as well as the slope of the yield curve. These scenarios are designed to illustrate the embedded optionality in the balance sheet from, among other things, faster or slower mortgage, and mortgage backed securities prepayments, and changes in funding mix.
INCOME SIMULATION AND ECONOMIC VALUE ANALYSIS
Interest rate risk measurement is calculated and reported to the ALCO monthly and ROC at least quarterly. The information reported includes period-end results and identifies any policy limits exceeded, along with an assessment of the policy limit breach and the action plan and timeline for resolution, mitigation, or assumption of the risk.
Huntington uses two approaches to model interest rate risk: Net Interest Income at Risk (NII at Risk) and Economic Value of Equity at Risk (EVE). Under NII at Risk, net interest income is modeled utilizing various assumptions for assets, liabilities, and derivative positions under various interest rate scenarios over a one-year time horizon. EVE measures the period end market value of assets minus the market value of liabilities and the change in this value as rates change. EVE is a period end measurement.
Table 18 - Net Interest Income at Risk | ||||||||
Net Interest Income at Risk (%) |
||||||||
Basis point change scenario |
-25 |
+100 |
+200 |
|||||
Board policy limits |
— |
% |
-2.0 |
% |
-4.0 |
% |
||
December 31, 2015 |
-0.3 |
% |
0.7 |
% |
0.3 |
% |
||
December 31, 2014 |
-0.2 |
% |
0.5 |
% |
0.2 |
% |
||
The NII at Risk results included in the table above reflect the analysis used monthly by management. It models gradual -25, +100 and +200 basis point parallel shifts in market interest rates, implied by the forward yield curve over the next one-year period. Due to the current low level of short-term interest rates, the analysis reflects a declining interest rate scenario of 25 basis points, the point at which many assets and liabilities reach zero percent.
Huntington is within board of director policy limits for the +100 and +200 basis point scenarios. There is no policy limit for the -25 basis point scenario. The NII at Risk reported at December 31, 2015, shows that Huntington’s earnings are not particularly sensitive to these types of changes in interest rates over the next year. In the recent period, while the amount of fixed rate assets, primarily auto loans and securities, increased, NII at Risk was not meaningfully impacted.
As of December 31, 2015, Huntington had $8.2 billion of notional value in receive fixed-generic asset conversion swaps used for asset and liability management purposes. In January 2016, $1.9 billion of notional value of these swaps were terminated. The remaining $6.4 billion of notional value will mature as follows: $3.0 billion in 2016, $3.3 billion in 2017, and $0.1 billion in 2018.
59
Table 19 - Economic Value of Equity at Risk | ||||||||
Economic Value of Equity at Risk (%) |
||||||||
Basis point change scenario |
-25 |
+100 |
+200 |
|||||
Board policy limits |
— |
% |
-5.0 |
% |
-12.0 |
% |
||
December 31, 2015 |
-0.4 |
% |
-0.5 |
% |
-2.1 |
% |
||
December 31, 2014 |
-0.6 |
% |
0.4 |
% |
-1.5 |
% |
||
The EVE results included in the table above reflect the analysis used monthly by management. It models immediate -25, +100 and +200 basis point parallel shifts in market interest rates. Due to the current low level of short-term interest rates, the analysis reflects a declining interest rate scenario of 25 basis points, the point at which many assets and liabilities reach zero percent.
Huntington is within board of director policy limits for the +100 and +200 basis point scenarios. There is no policy limit for the -25 basis point scenario. The EVE reported at December 31, 2015 shows that as interest rates increase (decrease) immediately, the economic value of equity position will decrease (increase). When interest rates rise, fixed rate assets generally lose economic value; the longer the duration, the greater the value lost. The opposite is true when interest rates fall. When interest rates rise, fixed rate liabilities generally increase economic value; the longer the duration, the greater the value gained. The opposite is true when interest rates fall. The EVE at risk reported as of December 31, 2015 for the +200 basis points scenario shows a more liability sensitive position compared with December 31, 2014. The primary factors contributing to this change were the growth of longer duration HQLA in preparation for LCR compliance and an increase in Automobile loans, offset somewhat by the growth of both Consumer and Commercial deposit balances.
MSRs
(This section should be read in conjunction with Note 6 of Notes to the Consolidated Financial Statements.)
At December 31, 2015, we had a total of $161 million of capitalized MSRs representing the right to service $16.2 billion in mortgage loans. Of this $161 million, $18 million was recorded using the fair value method and $143 million was recorded using the amortization method.
MSR fair values are sensitive to movements in interest rates as expected future net servicing income depends on the projected outstanding principal balances of the underlying loans, which can be reduced by prepayments. Prepayments usually increase when mortgage interest rates decline and decrease when mortgage interest rates rise. We have employed strategies to reduce the risk of MSR fair value changes or impairment. However, volatile changes in interest rates can diminish the effectiveness of these economic hedges. We report MSR fair value adjustments net of hedge-related trading activity in the mortgage banking income category of noninterest income. Changes in fair value between reporting dates are recorded as an increase or a decrease in mortgage banking income.
MSRs recorded using the amortization method generally relate to loans originated with historically low interest rates, resulting in a lower probability of prepayments and, ultimately, impairment. MSR assets are included in accrued income and other assets in the Consolidated Financial Statements.
Price Risk
Price risk represents the risk of loss arising from adverse movements in the prices of financial instruments that are carried at fair value and are subject to fair value accounting. We have price risk from trading securities, securities owned by our broker-dealer subsidiary, foreign exchange positions, equity investments, and investments in securities backed by mortgage loans. We have established loss limits on the trading portfolio, on the amount of foreign exchange exposure that can be maintained, and on the amount of marketable equity securities that can be held.
Liquidity Risk
Liquidity risk is the risk of loss due to the possibility that funds may not be available to satisfy current or future commitments resulting from external macro market issues, investor and customer perception of financial strength, and events unrelated to us, such as war, terrorism, or financial institution market specific issues. In addition, the mix and maturity structure of Huntington’s balance sheet, the amount of on-hand cash and unencumbered securities, and the availability of contingent sources of funding can have an impact on Huntington’s ability to satisfy current or future funding commitments. We manage liquidity risk at both the Bank and the parent company.
60
The overall objective of liquidity risk management is to ensure that we can obtain cost-effective funding to meet current and future obligations, and can maintain sufficient levels of on-hand liquidity, under both normal business-as-usual and unanticipated stressed circumstances. The ALCO was appointed by the ROC to oversee liquidity risk management and the establishment of liquidity risk policies and limits. Contingency funding plans are in place, which measure forecasted sources and uses of funds under various scenarios in order to prepare for unexpected liquidity shortages. Liquidity risk is reviewed monthly for the Bank and the parent company, as well as its subsidiaries. In addition, liquidity working groups meet regularly to identify and monitor liquidity positions, provide policy guidance, review funding strategies, and oversee the adherence to, and maintenance of, the contingency funding plans.
Available-for-sale and other securities portfolio
(This section should be read in conjunction with Note 4 of the Notes to Consolidated Financial Statements.)
Our investment securities portfolio is evaluated under established asset/liability management objectives. Changing market conditions could affect the profitability of the portfolio, as well as the level of interest rate risk exposure.
The composition and maturity of the portfolio is presented on the following two tables:
Table 20 - Available-for-sale and other securities Portfolio Summary at Fair Value |
|||||||||||
(dollar amounts in thousands) |
At December 31, |
||||||||||
2015 |
2014 |
2013 |
|||||||||
U.S. Treasury, Federal agency, and other agency securities |
$ |
4,643,073 |
$ |
5,679,696 |
$ |
3,937,713 |
|||||
Other |
4,132,368 |
3,704,974 |
3,371,040 |
||||||||
Total available-for-sale and other securities |
$ |
8,775,441 |
$ |
9,384,670 |
$ |
7,308,753 |
|||||
Duration in years (1) |
5.2 |
3.9 |
4.2 |
||||||||
(1) |
The average duration assumes a market driven prepayment rate on securities subject to prepayment. |
Table 21 - Available-for-sale and other securities Portfolio Composition and Maturity |
||||||||||
(dollar amounts in thousands) |
At December 31, 2015 |
|||||||||
Amortized |
||||||||||
Cost |
Fair Value |
Yield (1) |
||||||||
U.S. Treasury, Federal agency, and other agency securities: |
||||||||||
U.S. Treasury: |
||||||||||
1 year or less |
$ |
— |
$ |
— |
— |
% |
||||
After 1 year through 5 years |
5,457 |
5,472 |
1.20 |
|||||||
After 5 years through 10 years |
— |
— |
— |
|||||||
After 10 years |
— |
— |
— |
|||||||
Total U.S. Treasury |
5,457 |
5,472 |
1.20 |
|||||||
Federal agencies: mortgage-backed securities: |
||||||||||
1 year or less |
51,146 |
51,050 |
1.76 |
|||||||
After 1 year through 5 years |
111,655 |
113,393 |
2.49 |
|||||||
After 5 years through 10 years |
254,397 |
257,765 |
2.80 |
|||||||
After 10 years |
4,088,120 |
4,099,480 |
2.39 |
|||||||
Total Federal agencies: mortgage-backed securities |
4,505,318 |
4,521,688 |
2.41 |
|||||||
Other agencies: |
||||||||||
1 year or less |
801 |
805 |
1.70 |
|||||||
After 1 year through 5 years |
9,101 |
9,395 |
3.00 |
|||||||
After 5 years through 10 years |
105,174 |
105,713 |
2.44 |
|||||||
After 10 years |
— |
— |
— |
|||||||
Total other agencies |
115,076 |
115,913 |
2.48 |
|||||||
Total U.S. Treasury, Federal agency, and other agency securities |
4,625,851 |
4,643,073 |
2.41 |
|||||||
Municipal securities: |
||||||||||
1 year or less |
281,644 |
280,823 |
2.70 |
|||||||
61
After 1 year through 5 years |
587,664 |
587,345 |
2.81 |
|||||||
After 5 years through 10 years |
1,053,502 |
1,048,550 |
3.01 |
|||||||
After 10 years |
509,133 |
539,678 |
4.48 |
|||||||
Total municipal securities |
2,431,943 |
2,456,396 |
3.24 |
|||||||
Asset-backed securities: |
||||||||||
1 year or less |
— |
— |
— |
|||||||
After 1 year through 5 years |
110,115 |
109,300 |
2.37 |
|||||||
After 5 years through 10 years |
128,342 |
128,208 |
2.23 |
|||||||
After 10 years |
662,602 |
623,905 |
2.36 |
|||||||
Total asset-backed securities |
901,059 |
861,413 |
2.34 |
|||||||
Corporate debt: |
||||||||||
1 year or less |
300 |
302 |
3.38 |
|||||||
After 1 year through 5 years |
356,513 |
360,653 |
3.19 |
|||||||
After 5 years through 10 years |
107,394 |
105,522 |
3.06 |
|||||||
After 10 years |
— |
— |
— |
|||||||
Total corporate debt |
464,207 |
466,477 |
3.16 |
|||||||
Other: |
||||||||||
1 year or less |
— |
— |
— |
|||||||
After 1 year through 5 years |
3,950 |
3,898 |
2.60 |
|||||||
After 5 years through 10 years |
— |
— |
— |
|||||||
After 10 years |
— |
— |
— |
|||||||
Non-marketable equity securities (2) |
332,786 |
332,786 |
5.06 |
|||||||
Mutual funds |
10,604 |
10,604 |
N/A |
|||||||
Marketable equity securities (3) |
523 |
794 |
N/A |
|||||||
Total other |
347,863 |
348,082 |
4.87 |
|||||||
Total available-for-sale and other securities |
$ |
8,770,923 |
$ |
8,775,441 |
2.77 |
% |
||||
(1) |
Weighted average yields were calculated using amortized cost on a fully-taxable equivalent basis, assuming a 35% tax rate. |
(2) |
Consists of FHLB and FRB restricted stock holding carried at par. For 2016, the Federal Reserve reduced the dividend rate on FRB stock from 6% to the current 10-year Treasury rate for banks with more than $10 billion in assets. |
(3) |
Consists of certain mutual fund and equity security holdings. |
Investment securities portfolio
The expected weighted average maturities of our AFS and HTM portfolios are significantly shorter than their contractual maturities as reflected in Note 4 and Note 5 of the Notes to Consolidated Financial Statements. Particularly regarding the MBS and ABS, prepayments of principal and interest that historically occur in advance of scheduled maturities will shorten the expected life of these portfolios. The expected weighted average maturities, which take into account expected prepayments of principal and interest under existing interest rate conditions, are shown in the following table:
62
Table 22 - Expected Life of Investment Securities |
|||||||||||||||
(dollar amounts in thousands) |
At December 31, 2015 |
||||||||||||||
Available-for-Sale & Other Securities |
Held-to-Maturity Securities |
||||||||||||||
Amortized Cost |
Fair Value |
Amortized Cost |
Fair Value |
||||||||||||
1 year or less |
$ |
491,858 |
$ |
487,380 |
$ |
— |
$ |
— |
|||||||
After 1 year through 5 years |
3,484,392 |
3,506,676 |
1,332,311 |
1,325,633 |
|||||||||||
After 5 years through 10 years (1) |
3,881,010 |
3,850,350 |
4,669,051 |
4,652,433 |
|||||||||||
After 10 years |
569,748 |
586,851 |
158,228 |
157,392 |
|||||||||||
Other securities |
343,915 |
344,184 |
— |
— |
|||||||||||
Total |
$ |
8,770,923 |
$ |
8,775,441 |
$ |
6,159,590 |
$ |
6,135,458 |
|||||||
(1) The average duration of the securities with an average life of 5 years to 10 years is 5.43 years
Bank Liquidity and Sources of Funding
Our primary sources of funding for the Bank are retail and commercial core deposits. At December 31, 2015, these core deposits funded 73% of total assets (102% of total loans). Other sources of liquidity include non-core deposits, FHLB advances, wholesale debt instruments, and securitizations. Demand deposit overdrafts that have been reclassified as loan balances and were $16 million and $19 million at December 31, 2015 and December 31, 2014, respectively.
The following tables reflect contractual maturities of other domestic time deposits of $250,000 or more and brokered deposits and negotiable CDs as well as other domestic time deposits of $100,000 or more and brokered deposits and negotiable CDs at December 31, 2015.
Table 23 - Maturity Schedule of time deposits, brokered deposits, and negotiable CDs |
|||||||||||||||||||
(dollar amounts in millions) |
At December 31, 2015 |
||||||||||||||||||
|
3 Months
or Less
|
3 Months
to 6 Months
|
6 Months
to 12 Months
|
12 Months
or More
|
Total |
|||||||||||||||
Other domestic time deposits of $250,000 or more and brokered deposits and negotiable CDs |
$ |
3,002 |
$ |
65 |
$ |
58 |
$ |
320 |
$ |
3,445 |
|||||||||
Other domestic time deposits of $100,000 or more and brokered deposits and negotiable CDs |
$ |
3,107 |
$ |
174 |
$ |
185 |
$ |
470 |
$ |
3,936 |
|||||||||
The following table reflects deposit composition detail for each of the last five years:
63
Table 24 - Deposit Composition |
||||||||||||||||||||||||||||||||||
(dollar amounts in millions) |
At December 31, |
|||||||||||||||||||||||||||||||||
2015 |
2014 |
2013 |
2012 |
2011 |
||||||||||||||||||||||||||||||
By Type: |
||||||||||||||||||||||||||||||||||
Demand deposits—noninterest-bearing |
$ |
16,480 |
30 |
% |
$ |
15,393 |
30 |
% |
$ |
13,650 |
29 |
% |
$ |
12,600 |
27 |
% |
$ |
11,158 |
26 |
% |
||||||||||||||
Demand deposits—interest-bearing |
7,682 |
14 |
6,248 |
12 |
5,880 |
12 |
6,218 |
13 |
5,722 |
13 |
||||||||||||||||||||||||
Money market deposits |
19,792 |
36 |
18,986 |
37 |
17,213 |
36 |
14,691 |
32 |
13,117 |
30 |
||||||||||||||||||||||||
Savings and other domestic deposits |
5,246 |
9 |
5,048 |
10 |
4,871 |
10 |
5,002 |
11 |
4,698 |
11 |
||||||||||||||||||||||||
Core certificates of deposit |
2,382 |
4 |
2,936 |
5 |
3,723 |
8 |
5,516 |
12 |
6,513 |
15 |
||||||||||||||||||||||||
Total core deposits: |
51,582 |
93 |
48,611 |
94 |
45,337 |
95 |
44,027 |
95 |
41,208 |
95 |
||||||||||||||||||||||||
Other domestic deposits of $250,000 or more |
501 |
1 |
198 |
— |
274 |
1 |
354 |
1 |
390 |
1 |
||||||||||||||||||||||||
Brokered deposits and negotiable CDs |
2,944 |
5 |
2,522 |
5 |
1,580 |
3 |
1,594 |
3 |
1,321 |
3 |
||||||||||||||||||||||||
Deposits in foreign offices |
268 |
1 |
401 |
1 |
316 |
1 |
278 |
1 |
361 |
1 |
||||||||||||||||||||||||
Total deposits |
$ |
55,295 |
100 |
% |
$ |
51,732 |
100 |
% |
$ |
47,507 |
100 |
% |
$ |
46,253 |
100 |
% |
$ |
43,280 |
100 |
% |
||||||||||||||
Total core deposits: |
||||||||||||||||||||||||||||||||||
Commercial |
$ |
24,474 |
47 |
% |
$ |
22,725 |
47 |
% |
$ |
19,982 |
44 |
% |
$ |
18,358 |
42 |
% |
$ |
16,366 |
40 |
% |
||||||||||||||
Consumer |
27,108 |
53 |
25,886 |
53 |
25,355 |
56 |
25,669 |
58 |
24,842 |
60 |
||||||||||||||||||||||||
Total core deposits |
$ |
51,582 |
100 |
% |
$ |
48,611 |
100 |
% |
$ |
45,337 |
100 |
% |
$ |
44,027 |
100 |
% |
$ |
41,208 |
100 |
% |
||||||||||||||
The following table reflects short-term borrowings detail for each of the last three years:
Table 25 - Federal Funds Purchased and Repurchase Agreements |
|||||||||||
(dollar amounts in thousands) |
At December 31, |
||||||||||
2015 |
2014 |
2013 |
|||||||||
Weighted average interest rate at year-end |
|||||||||||
Federal Funds purchased and securities sold under agreements to repurchase |
0.13 |
% |
0.08 |
% |
0.06 |
% |
|||||
Federal Home Loan Bank advances |
— |
0.14 |
0.02 |
||||||||
Other short-term borrowings |
0.27 |
1.11 |
2.59 |
||||||||
Maximum amount outstanding at month-end during the year |
|||||||||||
Federal Funds purchased and securities sold under agreements to repurchase |
$ |
1,119,771 |
$ |
1,491,350 |
$ |
787,127 |
|||||
Federal Home Loan Bank advances |
1,850,000 |
2,375,000 |
1,800,000 |
||||||||
Other short-term borrowings |
42,793 |
56,124 |
19,497 |
||||||||
Average amount outstanding during the year |
|||||||||||
Federal Funds purchased and securities sold under agreements to repurchase |
$ |
783,952 |
$ |
987,156 |
$ |
692,481 |
|||||
Federal Home Loan Bank advances |
541,781 |
1,753,045 |
702,262 |
||||||||
Other short-term borrowings |
20,001 |
20,797 |
7,815 |
||||||||
Weighted average interest rate during the year |
|||||||||||
Federal Funds purchased and securities sold under agreements to repurchase |
0.06 |
% |
0.07 |
% |
0.08 |
% |
|||||
Federal Home Loan Bank advances |
0.16 |
0.06 |
0.04 |
||||||||
Other short-term borrowings |
1.17 |
1.63 |
1.79 |
||||||||
The Bank maintains borrowing capacity at the FHLB and the Federal Reserve Bank Discount Window. The Bank does not consider borrowing capacity from the Federal Reserve Bank Discount Window as a primary source of liquidity. Information regarding amounts pledged, for the ability to borrow if necessary, and the unused borrowing capacity at both the Federal Reserve Bank and the FHLB, is outlined in the following table:
64
Table 26 - Federal Reserve Bank and FHLB Borrowing Capacity |
|||||||
(dollar amounts in billions) |
At December 31, |
||||||
2015 |
2014 |
||||||
Loans and securities pledged: |
|||||||
Federal Reserve Bank |
$ |
8.3 |
$ |
9.7 |
|||
FHLB |
9.2 |
8.3 |
|||||
Total loans and securities pledged |
$ |
17.5 |
$ |
18.0 |
|||
Total unused borrowing capacity at Federal Reserve Bank and FHLB |
$ |
13.6 |
$ |
12.5 |
|||
(For further information related to debt issuances please see Note 10 of the Notes to Consolidated Financial Statements.)
At December 31, 2015, total wholesale funding was $10.9 billion, an increase from $10.0 billion at December 31, 2014. The increase from prior year-end primarily relates to an increase in long-term debt, partially offset by a decrease in FHLB advances and short-term borrowings.
Liquidity Coverage Ratio
At December 31, 2015, we believe the Bank had sufficient liquidity to be in compliance with the LCR requirements and to meet its cash flow obligations for the foreseeable future.
Table 27 - Maturity Schedule of Commercial Loans | ||||||||||||||||||
(dollar amounts in millions) |
At December 31, 2015 |
|||||||||||||||||
One Year or Less |
One to Five Years |
After Five Years |
Total |
Percent of total |
||||||||||||||
Commercial and industrial |
$ |
4,932 |
$ |
12,802 |
$ |
2,826 |
$ |
20,560 |
80 |
% |
||||||||
Commercial real estate—construction |
76 |
575 |
380 |
1,031 |
4 |
|||||||||||||
Commercial real estate—commercial |
3,148 |
927 |
162 |
4,237 |
16 |
|||||||||||||
Total |
$ |
8,156 |
$ |
14,304 |
$ |
3,368 |
$ |
25,828 |
100 |
% |
||||||||
Variable-interest rates |
$ |
6,925 |
$ |
9,783 |
$ |
2,166 |
$ |
18,874 |
73 |
% |
||||||||
Fixed-interest rates |
1,231 |
4,521 |
1,202 |
6,954 |
27 |
|||||||||||||
Total |
$ |
8,156 |
$ |
14,304 |
$ |
3,368 |
$ |
25,828 |
100 |
% |
||||||||
Percent of total |
32 |
% |
55 |
% |
13 |
% |
100 |
% |
||||||||||
At December 31, 2015, the carrying value of investment securities pledged to secure public and trust deposits, trading account liabilities, U.S. Treasury demand notes, and security repurchase agreements totaled $2.6 billion. There were no securities of a single issuer, which are not governmental that exceeded 10% of shareholders’ equity at December 31, 2015.
Parent Company Liquidity
The parent company’s funding requirements consist primarily of dividends to shareholders, debt service, income taxes, operating expenses, funding of nonbank subsidiaries, repurchases of our stock, and acquisitions. The parent company obtains funding to meet obligations from dividends and interest received from the Bank, interest and dividends received from direct subsidiaries, net taxes collected from subsidiaries included in the federal consolidated tax return, fees for services provided to subsidiaries, and the issuance of debt securities.
At December 31, 2015 and December 31, 2014, the parent company had $0.9 billion and $0.7 billion, respectively, in cash and cash equivalents.
On January 20, 2016, the board of directors declared a quarterly common stock cash dividend of $0.07 per common share. The dividend is payable on April 1, 2016, to shareholders of record on March 18, 2016. Based on the current quarterly dividend of $0.07 per common share, cash demands required for common stock dividends are estimated to be approximately $56 million per quarter. On January 20, 2016, the board of directors declared a quarterly Series A and Series B Preferred Stock dividend payable on April 15, 2016 to shareholders of record on April 1, 2016. Based on the current dividend, cash demands required for Series A Preferred Stock are estimated to be approximately $8 million per quarter. Cash demands required for Series B Preferred Stock are expected to be less than $1 million per quarter.
65
During the fourth quarter, the Bank paid dividends of $154 million to the holding company. The Bank declared a dividend to the holding company of $174 million in the first quarter of 2016. To help meet any additional liquidity needs, we have an open-ended, automatic shelf registration statement filed and effective with the SEC, which permits the parent company to issue an unspecified amount of debt or equity securities.
On January 26, 2016, Huntington announced the signing of a definitive merger agreement under which Ohio-based FirstMerit
Corporation, the parent company of FirstMerit Bank, will merge into Huntington in a stock and cash transaction valued at approximately $3.4 billion based on the closing stock price on the day preceding the announcement. The transaction is
expected to be completed in the 2016 third quarter, subject to the satisfaction of customary closing conditions, including regulatory
approvals and the approval of the shareholders of Huntington and FirstMerit Corporation. Considering this potential obligation, and expected quarterly dividend payments, we believe the parent company has sufficient liquidity to meet its cash flow obligations for the foreseeable future.
Off-Balance Sheet Arrangements
In the normal course of business, we enter into various off-balance sheet arrangements. These arrangements include commitments to extend credit, interest rate swaps, financial guarantees contained in standby letters-of-credit issued by the Bank, and commitments by the Bank to sell mortgage loans.
COMMITMENTS TO EXTEND CREDIT
Commitments to extend credit generally have fixed expiration dates, are variable-rate, and contain clauses that permit Huntington to terminate or otherwise renegotiate the contracts in the event of a significant deterioration in the customer’s credit quality. These arrangements normally require the payment of a fee by the customer, the pricing of which is based on prevailing market conditions, credit quality, probability of funding, and other relevant factors. Since many of these commitments are expected to expire without being drawn upon, the contract amounts are not necessarily indicative of future cash requirements. The interest rate risk arising from these financial instruments is insignificant as a result of their predominantly short-term, variable-rate nature. See Note 20 for more information.
INTEREST RATE SWAPS
Balance sheet hedging activity is arranged to receive hedge accounting treatment and is classified as either fair value or cash flow hedges. Fair value hedges are purchased to convert deposits and long-term debt from fixed-rate obligations to floating rate. Cash flow hedges are also used to convert floating rate loans made to customers into fixed rate loans. See Note 18 for more information.
STANDBY LETTERS-OF-CREDIT
Standby letters-of-credit are conditional commitments issued to guarantee the performance of a customer to a third-party. These guarantees are primarily issued to support public and private borrowing arrangements, including commercial paper, bond financing, and similar transactions. Most of these arrangements mature within two years and are expected to expire without being drawn upon. Standby letters-of-credit are included in the determination of the amount of risk-based capital that the parent company and the Bank are required to hold. Through our credit process, we monitor the credit risks of outstanding standby letters-of-credit. When it is probable that a standby letter-of-credit will be drawn and not repaid in full, a loss is recognized in the provision for credit losses. See Note 20 for more information.
COMMITMENTS TO SELL LOANS
Activity related to our mortgage origination activity supports the hedging of the mortgage pricing commitments to customers and the secondary sale to third parties. In addition, we have commitments to sell residential real estate loans. These contracts mature in less than one year. See Note 20 for more information.
We believe that off-balance sheet arrangements are properly considered in our liquidity risk management process.
66
Table 28 - Contractual Obligations (1) | |||||||||||||||||||
(dollar amounts in millions) |
At December 31, 2015 |
||||||||||||||||||
|
One Year
or Less
|
1 to 3
Years
|
3 to 5
Years
|
More than
5 Years
|
Total |
|||||||||||||||
Deposits without a stated maturity |
$ |
48,573 |
$ |
— |
$ |
— |
$ |
— |
$ |
48,573 |
|||||||||
Certificates of deposit and other time deposits |
5,565 |
933 |
161 |
63 |
6,722 |
||||||||||||||
Short-term borrowings |
615 |
— |
— |
— |
615 |
||||||||||||||
Long-term debt |
1,097 |
3,619 |
1,973 |
333 |
7,022 |
||||||||||||||
Operating lease obligations |
53 |
95 |
82 |
191 |
421 |
||||||||||||||
Purchase commitments |
80 |
73 |
17 |
6 |
176 |
||||||||||||||
(1) |
Amounts do not include associated interest payments. |
Operational Risk
Operational risk is the risk of loss due to human error; inadequate or failed internal systems and controls, including the use of financial or other quantitative methodologies that may not adequately predict future results; violations of, or noncompliance with, laws, rules, regulations, prescribed practices, or ethical standards; and external influences such as market conditions, fraudulent activities, disasters, and security risks. We continuously strive to strengthen our system of internal controls to ensure compliance with laws, rules, and regulations, and to improve the oversight of our operational risk. We actively and continuously monitor cyber-attacks such as attempts related to online deception and loss of sensitive customer data. We evaluate internal systems, processes and controls to mitigate loss from cyber-attacks and, to date, have not experienced any material losses.
Our objective for managing cyber security risk is to avoid or minimize the impacts of external threat events or other efforts to penetrate our systems. We work to achieve this objective by hardening networks and systems against attack, and by diligently managing visibility and monitoring controls within our data and communications environment to recognize events and respond before the attacker has the opportunity to plan and execute on its own goals. To this end we employ a set of defense in-depth strategies, which include efforts to make Huntington less attractive as a target and less vulnerable to threats, while investing in threat analytic capabilities for rapid detection and response. Potential concerns related to cyber security may be escalated to our board-level Technology Committee, as appropriate. As a complement to the overall cyber security risk management, we use a number of internal training methods, both formally through mandatory courses and informally through written communications and other updates. Internal policies and procedures have been implemented to encourage the reporting of potential phishing attacks or other security risks. We also use third-party services to test the effectiveness of our cyber security risk management framework, and any such third parties are required to comply with our policies regarding information security and confidentiality.
To mitigate operational risks, we have a senior management Operational Risk Committee and a senior management Legal, Regulatory, and Compliance Committee. The responsibilities of these committees, among other duties, include establishing and maintaining management information systems to monitor material risks and to identify potential concerns, risks, or trends that may have a significant impact and ensuring that recommendations are developed to address the identified issues. In addition, we have a senior management Model Risk Oversight Committee that is responsible for policies and procedures describing how model risk is evaluated and managed and the application of the governance process to implement these practices throughout the enterprise. These committees report any significant findings and recommendations to the Risk Management Committee. Potential concerns may be escalated to our ROC, as appropriate.
The goal of this framework is to implement effective operational risk techniques and strategies; minimize operational, fraud, and legal losses; minimize the impact of inadequately designed models and enhance our overall performance.
Compliance Risk
Financial institutions are subject to many laws, rules, and regulations at both the federal and state levels. In September 2014, for example, the Office of the Comptroller of the Currency issued its final rule formalizing its “heightened expectations” supervisory regime for the largest federally chartered depository institutions, including Huntington, to improve risk management and ensure boards can challenge decisions made by management. These broad-based laws, rules and regulations include, but are not limited to, expectations relating to anti-money laundering, lending limits, client privacy, fair lending, prohibitions against unfair, deceptive or abusive acts or practices, protections for military members as they enter active duty, and community reinvestment. Additionally, the volume and complexity of recent regulatory changes have increased our overall compliance risk. As such, we utilize various resources to help ensure expectations are met, including a team of compliance experts dedicated to ensuring our conformance with all applicable laws, rules, and regulations. Our colleagues receive training for several broad-based laws and regulations including, but not limited to, anti-money laundering and customer privacy. Additionally, colleagues engaged in lending activities receive training for laws and
67
regulations related to flood disaster protection, equal credit opportunity, fair lending, and/or other courses related to the extension of credit. We set a high standard of expectation for adherence to compliance management and seek to continuously enhance our performance.
Capital
(This section should be read in conjunction with the Regulatory Matters section included in Part 1, Item 1 and Note 21 of the Notes to Consolidated Financial Statements.)
Both regulatory capital and shareholders’ equity are managed at the Bank and on a consolidated basis. We have an active program for managing capital and maintain a comprehensive process for assessing the Company’s overall capital adequacy. We believe our current levels of both regulatory capital and shareholders’ equity are adequate.
Regulatory Capital
Beginning in the 2015 first quarter, we became subject to the Basel III capital requirements including the standardized approach for calculating risk-weighted assets in accordance with subpart D of the final capital rule. The following table presents risk-weighted assets and other financial data necessary to calculate certain financial ratios, including the common CET1 on a Basel III basis, which we use to measure capital adequacy.
Table 29 - Capital Under Current Regulatory Standards (transitional Basel III basis) |
|||||
(dollar amounts in millions except per share amounts) |
|||||
At December 31, |
|||||
2015 |
|||||
Common equity tier 1 risk-based capital ratio: |
|||||
Total shareholders’ equity |
$ |
6,595 |
|||
Regulatory capital adjustments: |
|||||
Shareholders’ preferred equity |
(386 |
) |
|||
Accumulated other comprehensive loss (income) offset |
226 |
||||
Goodwill and other intangibles, net of taxes |
(695 |
) |
|||
Deferred tax assets that arise from tax loss and credit carryforwards |
(19 |
) |
|||
Common equity tier 1 capital |
5,721 |
||||
Additional tier 1 capital |
|||||
Shareholders’ preferred equity |
386 |
||||
Qualifying capital instruments subject to phase-out |
76 |
||||
Other |
(29 |
) |
|||
Tier 1 capital |
6,154 |
||||
LTD and other tier 2 qualifying instruments |
563 |
||||
Qualifying allowance for loan and lease losses |
670 |
||||
Tier 2 capital |
1,233 |
||||
Total risk-based capital |
$ |
7,387 |
|||
Risk-weighted assets (RWA) |
$ |
58,420 |
|||
Common equity tier 1 risk-based capital ratio |
9.79 |
% |
|||
Other regulatory capital data: |
|||||
Tier 1 leverage ratio |
8.79 |
||||
Tier 1 risk-based capital ratio |
10.53 |
||||
Total risk-based capital ratio |
12.64 |
||||
Tangible common equity / RWA ratio |
9.41 |
||||
68
Table 30 - Capital Adequacy—Non-Regulatory |
||||||||||||||||||||
(dollar amounts in millions) |
||||||||||||||||||||
At December 31, |
||||||||||||||||||||
2015 |
2014 |
2013 |
2012 |
2011 |
||||||||||||||||
Consolidated capital calculations: |
||||||||||||||||||||
Common shareholders’ equity |
$ |
6,209 |
$ |
5,942 |
$ |
5,704 |
$ |
5,393 |
$ |
5,030 |
||||||||||
Preferred shareholders’ equity |
386 |
386 |
386 |
386 |
386 |
|||||||||||||||
Total shareholders’ equity |
6,595 |
6,328 |
6,090 |
5,779 |
5,416 |
|||||||||||||||
Goodwill |
(677 |
) |
(523 |
) |
(444 |
) |
(444 |
) |
(444 |
) |
||||||||||
Other intangible assets |
(55 |
) |
(75 |
) |
(93 |
) |
(132 |
) |
(175 |
) |
||||||||||
Other intangible asset deferred tax liability (1) |
19 |
26 |
33 |
46 |
61 |
|||||||||||||||
Total tangible equity |
5,882 |
5,756 |
5,586 |
5,249 |
4,858 |
|||||||||||||||
Preferred shareholders’ equity |
(386 |
) |
(386 |
) |
(386 |
) |
(386 |
) |
(386 |
) |
||||||||||
Total tangible common equity |
$ |
5,496 |
$ |
5,370 |
$ |
5,200 |
$ |
4,863 |
$ |
4,472 |
||||||||||
Total assets |
$ |
71,045 |
$ |
66,298 |
$ |
59,467 |
$ |
56,141 |
$ |
54,449 |
||||||||||
Goodwill |
(677 |
) |
(523 |
) |
(444 |
) |
(444 |
) |
(444 |
) |
||||||||||
Other intangible assets |
(55 |
) |
(75 |
) |
(93 |
) |
(132 |
) |
(175 |
) |
||||||||||
Other intangible asset deferred tax liability (1) |
19 |
26 |
33 |
46 |
61 |
|||||||||||||||
Total tangible assets |
$ |
70,332 |
$ |
65,726 |
$ |
58,963 |
$ |
55,611 |
$ |
53,891 |
||||||||||
Tier 1 capital (2) |
N.A. |
$ |
6,266 |
$ |
6,100 |
$ |
5,741 |
$ |
5,557 |
|||||||||||
Preferred shareholders’ equity |
N.A. |
(386 |
) |
(386 |
) |
(386 |
) |
(386 |
) |
|||||||||||
Trust-preferred securities |
N.A. |
(304 |
) |
(299 |
) |
(299 |
) |
(532 |
) |
|||||||||||
REIT-preferred stock |
N.A. |
— |
— |
(50 |
) |
(50 |
) |
|||||||||||||
Tier 1 common equity (2) |
N.A. |
$ |
5,576 |
$ |
5,415 |
$ |
5,006 |
$ |
4,589 |
|||||||||||
Risk-weighted assets (RWA) (2) |
N.A. |
$ |
54,479 |
$ |
49,690 |
$ |
47,773 |
$ |
45,891 |
|||||||||||
Tier 1 common equity / RWA ratio (2) |
N.A. |
10.23 |
% |
10.90 |
% |
10.48 |
% |
10.00 |
% |
|||||||||||
Tangible equity / tangible asset ratio |
8.36 |
% |
8.76 |
9.47 |
9.44 |
9.01 |
||||||||||||||
Tangible common equity / tangible asset ratio |
7.81 |
8.17 |
8.82 |
8.74 |
8.30 |
|||||||||||||||
(1) |
Other intangible assets are net of deferred tax liability, and calculated assuming a 35% tax rate. |
(2) |
Ratios are calculated on a Basel I basis. |
N.A. |
On January 1, 2015, we became subject to the Basel III capital requirements including the standardized approach for calculating risk-weighted assets in accordance with subpart D of the final capital rule. |
The following table presents certain regulatory capital data at both the consolidated and Bank levels for the past five years:
69
Table 31 - Regulatory Capital Data (1) |
||||||||||||||||||||
(dollar amounts in millions) |
||||||||||||||||||||
At December 31, |
||||||||||||||||||||
Basel III |
Basel I |
|||||||||||||||||||
2015 |
2014 |
2013 |
2012 |
2011 |
||||||||||||||||
Total risk-weighted assets |
Consolidated |
$ |
58,420 |
$ |
54,479 |
$ |
49,690 |
$ |
47,773 |
$ |
45,891 |
|||||||||
Bank |
58,351 |
54,387 |
49,609 |
47,676 |
45,651 |
|||||||||||||||
Common equity tier 1 risk-based capital |
Consolidated |
5,721 |
N.A. |
N.A. |
N.A. |
N.A. |
||||||||||||||
Bank |
5,519 |
N.A. |
N.A. |
N.A. |
N.A. |
|||||||||||||||
Tier 1 risk-based capital |
Consolidated |
6,154 |
6,266 |
6,100 |
5,741 |
5,557 |
||||||||||||||
Bank |
5,735 |
6,136 |
5,682 |
5,003 |
4,245 |
|||||||||||||||
Tier 2 risk-based capital |
Consolidated |
1,233 |
1,122 |
1,139 |
1,187 |
1,221 |
||||||||||||||
Bank |
1,115 |
820 |
838 |
1,091 |
1,508 |
|||||||||||||||
Total risk-based capital |
Consolidated |
7,387 |
7,388 |
7,239 |
6,928 |
6,778 |
||||||||||||||
Bank |
6,851 |
6,956 |
6,520 |
6,094 |
5,753 |
|||||||||||||||
Tier 1 leverage ratio |
Consolidated |
8.79 |
% |
9.74 |
% |
10.67 |
% |
10.36 |
% |
10.28 |
% |
|||||||||
Bank |
8.21 |
9.56 |
9.97 |
9.05 |
7.89 |
|||||||||||||||
Common equity tier 1 risk-based capital ratio |
Consolidated |
9.79 |
N.A. |
N.A. |
N.A. |
N.A. |
||||||||||||||
Bank |
9.46 |
N.A. |
N.A. |
N.A. |
N.A. |
|||||||||||||||
Tier 1 risk-based capital ratio |
Consolidated |
10.53 |
11.50 |
12.28 |
12.02 |
12.11 |
||||||||||||||
Bank |
9.83 |
11.28 |
11.45 |
10.49 |
9.30 |
|||||||||||||||
Total risk-based capital ratio |
Consolidated |
12.64 |
13.56 |
14.57 |
14.50 |
14.77 |
||||||||||||||
Bank |
11.74 |
12.79 |
13.14 |
12.78 |
12.60 |
|||||||||||||||
(1) |
On January 1, 2015, we became subject to the Basel III capital requirements including the standardized approach for calculating risk-weighted assets in accordance with subpart D of the final capital rule. Amounts presented prior to January 1, 2015 are calculated using the Basel I capital requirements. |
At December 31, 2015, we maintained Basel III transitional capital ratios in excess of the well-capitalized standards established by the FRB. All capital ratios were impacted by the repurchase of 23 million common shares in 2015.
Shareholders’ Equity
We generate shareholders’ equity primarily through the retention of earnings, net of dividends and share repurchases. Other potential sources of shareholders’ equity include issuances of common and preferred stock. Our objective is to maintain capital at an amount commensurate with our risk profile and risk tolerance objectives, to meet both regulatory and market expectations, and to provide the flexibility needed for future growth and business opportunities. Shareholders’ equity totaled $6.6 billion at December 31, 2015, an increase of $0.3 billion when compared with December 31, 2014.
Dividends
We consider disciplined capital management as a key objective, with dividends representing one component. Our current capital ratios and expectations for continued earnings growth positions us to continue to actively explore additional capital management opportunities.
On January 20, 2016, our board of directors declared a quarterly cash dividend of $0.07 per common share, payable on April 1, 2016. Also, cash dividends of $0.07 per common share were declared on October 21, 2015. Cash dividends of $0.06 per share were declared on July 22, 2015, April 21, 2015 and January 22, 2015. Our 2015 capital plan to the FRB included the continuation of our current common dividend through the 2016 first quarter.
On January 20, 2016, our board of directors also declared a quarterly cash dividend on our 8.50% Series A Non-Cumulative Perpetual Convertible Preferred Stock of $21.25 per share. The dividend is payable on April 15, 2016. Cash dividends of $21.25 per share were also declared on October 21, 2015, July 22, 2015, April 21, 2015 and January 22, 2015.
70
On January 20, 2016, our board of directors also declared a quarterly cash dividend on our Floating Rate Series B Non-Cumulative Perpetual Preferred Stock of $8.31 per share. The dividend is payable on April 15, 2016. Also, cash dividends of $7.55 per share, $7.47 per share, $7.44 per share and $7.38 per share were declared on October 21, 2015, July 22, 2015, April 21, 2015 and January 22, 2015, respectively.
Share Repurchases
From time to time the board of directors authorizes the Company to repurchase shares of our common stock. Although we announce when the board of directors authorizes share repurchases, we typically do not give any public notice before we repurchase our shares. Future stock repurchases may be private or open-market repurchases, including block transactions, accelerated or delayed block transactions, forward transactions, and similar transactions. Various factors determine the amount and timing of our share repurchases, including our capital requirements, the number of shares we expect to issue for employee benefit plans and acquisitions, market conditions (including the trading price of our stock), and regulatory and legal considerations, including the FRB’s response to our annual capital plan.
On March 11, 2015, Huntington announced that the Federal Reserve did not object to the proposed capital actions included in Huntington’s capital plan submitted to the FRB in January 2015. These actions included a 17% increase in the quarterly dividend per common share to $0.07, starting in the fourth quarter of 2015, and the potential repurchase of up to $366 million of common stock over the five-quarter period through the second quarter of 2016. During 2015, we repurchased 23 million shares, with a weighted average price of $10.93. Purchases of common stock may include open market purchases, privately negotiated transactions, and accelerated repurchase programs. We have approximately $166 million remaining under the current authorization.
On January 26, 2016, Huntington announced the signing of a definitive merger agreement under which Ohio-based FirstMerit Corporation, the parent company of FirstMerit Bank, will merge into Huntington in a stock and cash transaction. The transaction is expected to be completed in the 2016 third quarter, subject to the satisfaction of customary closing conditions, including regulatory approvals and the approval of the shareholders of Huntington and FirstMerit Corporation. As a result of the announcement, Huntington no longer has the intent to repurchase shares under the current authorization.
BUSINESS SEGMENT DISCUSSION
Overview
Our business segments are based on our internally-aligned segment leadership structure, which is how we monitor results and assess performance. During the 2014 first quarter, we reorganized our business segments to drive our ongoing growth and leverage the knowledge of our highly experienced team. We now have five major business segments: Retail and Business Banking, Commercial Banking, Automobile Finance and Commercial Real Estate (AFCRE), Regional Banking and The Huntington Private Client Group (RBHPCG), and Home Lending. A Treasury / Other function includes technology and operations, other unallocated assets, liabilities, revenue, and expense.
Business segment results are determined based upon our management reporting system, which assigns balance sheet and income statement items to each of the business segments. The process is designed around our organizational and management structure and, accordingly, the results derived are not necessarily comparable with similar information published by other financial institutions.
Revenue Sharing
Revenue is recorded in the business segment responsible for the related product or service. Fee sharing is recorded to allocate portions of such revenue to other business segments involved in selling to, or providing service to customers. Results of operations for the business segments reflect these fee sharing allocations.
Expense Allocation
The management accounting process that develops the business segment reporting utilizes various estimates and allocation methodologies to measure the performance of the business segments. Expenses are allocated to business segments using a two-phase approach. The first phase consists of measuring and assigning unit costs (activity-based costs) to activities related to product origination and servicing. These activity-based costs are then extended, based on volumes, with the resulting amount allocated to business segments that own the related products. The second phase consists of the allocation of overhead costs to all five business segments from Treasury / Other. We utilize a full-allocation methodology, where all Treasury / Other expenses, except reported Significant Items, and a small amount of other residual unallocated expenses, are allocated to the five business segments.
Funds Transfer Pricing (FTP)
71
We use an active and centralized FTP methodology to attribute appropriate income to the business segments. The intent of the FTP methodology is to transfer interest rate risk from the business segments by providing matched duration funding of assets and liabilities. The result is to centralize the financial impact, management, and reporting of interest rate risk in the Treasury / Other function where it can be centrally monitored and managed. The Treasury / Other function charges (credits) an internal cost of funds for assets held in (or pays for funding provided by) each business segment. The FTP rate is based on prevailing market interest rates for comparable duration assets (or liabilities).
Net Income by Business Segment
The segregation of net income by business segment for the past three years is presented in the following table:
Table 32 - Net Income (Loss) by Business Segment | |||||||||||
(dollar amounts in thousands) |
Year ended December 31, |
||||||||||
2015 |
2014 |
2013 |
|||||||||
Retail and Business Banking |
$ |
258,664 |
$ |
172,199 |
$ |
128,973 |
|||||
Commercial Banking |
188,802 |
152,653 |
129,962 |
||||||||
AFCRE |
164,778 |
196,377 |
220,433 |
||||||||
RBHPCG |
9,310 |
22,010 |
39,502 |
||||||||
Home Lending |
(4,570 |
) |
(19,727 |
) |
2,670 |
||||||
Treasury / Other |
75,973 |
108,880 |
119,742 |
||||||||
Net income |
$ |
692,957 |
$ |
632,392 |
$ |
641,282 |
|||||
Treasury / Other
The Treasury / Other function includes revenue and expense related to assets, liabilities, and equity not directly assigned or allocated to one of the five business segments. Other assets include investment securities and bank owned life insurance. The financial impact associated with our FTP methodology, as described above, is also included.
Net interest income includes the impact of administering our investment securities portfolios and the net impact of derivatives used to hedge interest rate sensitivity. Noninterest income includes miscellaneous fee income not allocated to other business segments, such as bank owned life insurance income and any investment security and trading asset gains or losses. Noninterest expense includes certain corporate administrative, merger, and other miscellaneous expenses not allocated to other business segments. The provision for income taxes for the business segments is calculated at a statutory 35% tax rate, though our overall effective tax rate is lower. As a result, Treasury / Other reflects a credit for income taxes representing the difference between the lower actual effective tax rate and the statutory tax rate used to allocate income taxes to the business segments.
Optimal Customer Relationship (OCR)
Our OCR strategy is focused on building and deepening relationships with our customers through superior interactions, product penetration, and quality of service. We will deliver high-quality customer and prospect interactions through a fully integrated sales culture which will include all partners necessary to deliver a total Huntington solution. The quality of our relationships will lead to our ability to be the primary bank for our customers, yielding quality, annuitized revenue and profitable share of customers overall financial services revenue. We believe our relationship oriented approach will drive a competitive advantage through our local market delivery channels.
CONSUMER OCR PERFORMANCE
For consumer OCR performance there are three key performance metrics: (1) the number of checking account households, (2) product penetration by number of services, and (3) the revenue generated from the consumer households of all business segments.
The growth in consumer checking account number of households is a result of both new sales of checking accounts and improved retention of existing checking account households. The overall objective is to grow the number of households, along with an increase in product penetration.
We use the checking account as a measure since it typically represents the primary banking relationship product. We count additional services by type, not number of services. For example, a household that has one checking account and one mortgage, we count as having two services. A household with four checking accounts, we count as having one service. The household relationship
72
utilizing 6+ services is viewed to be more profitable and loyal. The overall objective, therefore, is to decrease the percentage of 1-5 services per consumer checking account household, while increasing the percentage of those with 6+ or more services.
The following table presents consumer checking account household OCR metrics:
Table 33 - Consumer Checking Household OCR Cross-sell Report | |||||||||||
Year ended December 31 |
|||||||||||
2015 |
2014 |
2013 |
|||||||||
Number of households (1) (3) (4) |
1,511,474 |
1,454,402 |
1,324,971 |
||||||||
Product Penetration by Number of Services (2) |
|||||||||||
1 Service |
2.6 |
% |
2.8 |
% |
3.0 |
% |
|||||
2-3 Services |
16.4 |
17.9 |
19.2 |
||||||||
4-5 Services |
29.1 |
29.9 |
30.2 |
||||||||
6+ Services |
51.9 |
49.4 |
47.6 |
||||||||
Total revenue (in millions)
|
$ |
1,123 |
$ |
1,017 |
$ |
948 |
|||||
(1) |
Checking account required. |
(2) |
The definitions and measurements used in our OCR process are periodically reviewed and updated prospectively. |
(3) |
On March 1, 2014, Huntington acquired 9,904 Camco Financial households. |
(4) |
On September 12, 2014, Huntington acquired 37,939 Bank of America households. |
Our emphasis on cross-sell, coupled with customers being attracted to the benefits offered through our “Fair Play” banking philosophy with programs such as 24-Hour Grace® on overdrafts and Asterisk-Free CheckingTM, are having a positive effect. The percent of consumer households with 6 or more product services at the end of 2015 was 51.9%, up from 49.4% at the end of last year. For 2015, consumer checking account households grew 4%. Total consumer checking account household revenue in 2015 was $1.1 billion, up $106 million, or 10%, from 2014.
COMMERCIAL OCR PERFORMANCE
For commercial OCR performance, there are three key performance metrics: (1) the number of checking account commercial relationships, (2) product penetration by number of services, and (3) the revenue generated. Commercial relationships include relationships from all business segments.
The growth in the number of commercial relationships is a result of both new sales of checking accounts and improved retention of existing commercial accounts. The overall objective is to grow the number of relationships, along with an increase in product service distribution.
The commercial relationship is defined as a business banking or commercial banking customer with a checking account relationship. We use this metric because we believe that the checking account anchors a business relationship and creates the opportunity to increase our cross-sell activity. Multiple sales of the same type of service are counted as one service, which is the same methodology described above for consumer.
The following table presents commercial relationship OCR metrics:
Table 34 - Commercial Relationship OCR Cross-sell Report | |||||||||||
Year ended December 31, |
|||||||||||
2015 |
2014 |
2013 |
|||||||||
Commercial Relationships (1) |
168,774 |
164,726 |
159,716 |
||||||||
Product Penetration by Number of Services (2) |
|||||||||||
1 Service |
13.7 |
% |
15.7 |
% |
21.1 |
% |
|||||
2-3 Services |
42.0 |
42.4 |
41.4 |
||||||||
4+ Services |
44.3 |
41.9 |
37.5 |
||||||||
Total revenue (in millions)
|
$ |
890 |
$ |
851 |
$ |
739 |
|||||
73
(1) |
Checking account required. |
(2) |
The definitions and measurements used in our OCR process are periodically reviewed and updated prospectively. |
By focusing on targeted relationships we are able to achieve higher product service penetration among our commercial relationships, and leverage these relationships to generate a deeper share of wallet. The percent of commercial relationships with 4 or more product services at the end of 2015 was 44.3%, up from 41.9% at the end of last year. Total commercial relationship revenue in 2015 was $890 million, up $39 million, or 5%, from 2014.
Retail and Business Banking |
||||||||||||||||||
Table 35 - Key Performance Indicators for Retail and Business Banking | ||||||||||||||||||
|
(dollar amounts in thousands unless otherwise noted)
|
||||||||||||||||||
Year ended December 31, |
Change from 2014 |
|||||||||||||||||
2015 |
2014 |
Amount |
Percent |
2013 |
||||||||||||||
Net interest income |
$ |
1,030,238 |
$ |
912,992 |
$ |
117,246 |
13 |
% |
$ |
902,526 |
||||||||
Provision for credit losses |
42,828 |
75,529 |
(32,701 |
) |
(43 |
) |
137,978 |
|||||||||||
Noninterest income |
440,261 |
409,746 |
30,515 |
7 |
398,065 |
|||||||||||||
Noninterest expense |
1,029,727 |
982,288 |
47,439 |
5 |
964,193 |
|||||||||||||
Provision for income taxes |
139,280 |
92,722 |
46,558 |
50 |
69,447 |
|||||||||||||
Net income |
$ |
258,664 |
$ |
172,199 |
$ |
86,465 |
50 |
% |
$ |
128,973 |
||||||||
Number of employees (average full-time equivalent) |
5,449 |
5,239 |
210 |
4 |
% |
5,212 |
||||||||||||
Total average assets (in millions)
|
$ |
15,645 |
$ |
14,861 |
$ |
784 |
5 |
$ |
14,371 |
|||||||||
Total average loans/leases (in millions)
|
13,637 |
13,034 |
603 |
5 |
12,638 |
|||||||||||||
Total average deposits (in millions)
|
30,138 |
29,023 |
1,115 |
4 |
28,309 |
|||||||||||||
Net interest margin |
3.49 |
% |
3.19 |
% |
0.30 |
% |
9 |
3.22 |
% |
|||||||||
NCOs |
$ |
62,721 |
$ |
90,628 |
$ |
(27,907 |
) |
(31 |
) |
$ |
131,377 |
|||||||
NCOs as a % of average loans and leases |
0.46 |
% |
0.70 |
% |
(0.24 |
)% |
(34 |
) |
1.04 |
% |
||||||||
2015 vs. 2014
Retail and Business Banking reported net income of $259 million in 2015. This was an increase of $86 million, or 50%, compared to the year-ago period. The increase in net income reflected a combination of factors described below.
The increase in net interest income from the year-ago period reflected:
• |
$1.1 billion, or 4%, increase in total average deposits and a 23 basis point increase in deposit spreads, as a result of an increase in the funds transfer price rates assigned to deposits.
|
• |
$0.6 billion or 5%, increase in total average loans combined with a 10 basis point increase in loan spreads, as a result of a reduction in the funds transfer price rates assigned to loans and improved effective rates.
|
The decrease in the provision for credit losses from the year-ago period reflected:
• |
$28 million, or 31%, decrease in NCOs, and updated assumptions made to the ACL estimation process.
|
The increase in total average loans and leases from the year-ago period reflected:
• |
$0.3 billion, or 7%, increase in commercial loans, primarily due to the impact of core portfolio growth. |
• |
$0.3 billion, or 4%, increase in consumer loans, primarily due to growth in home equity lines of credit, credit card, and residential mortgages, as well as the impact of the Camco acquisition in the 2014 first quarter. |
The increase in total average deposits from the year-ago period reflected:
• |
$0.6 billion in combined deposit growth due to household growth, the Camco acquisition in the 2014 first quarter and the Bank of America branch acquisition in the 2014 third quarter. |
• |
$0.3 billion deposit growth from our In-store branch network. |
The increase in noninterest income from the year-ago period reflected:
74
• |
$14 million, or 14%, increase in cards and payment processing income, primarily due to higher debit and credit card-related transaction volumes and an increase in the number of households. |
• |
$9 million, or 60%, increase in mortgage banking income, primarily driven by increased referrals to Home Lending due to an improved mortgage refinance market. |
• |
$7 million, or 41%, increase in gain on sale of loans, primarily due to increased SBA loan sale volumes. |
The increase in noninterest expense from the year-ago period reflected:
• |
$28 million, or 10%, increase in personnel costs, primarily due to the Bank of America branch acquisition in the 2014 third quarter and the Camco acquisition in the 2014 first quarter, along with the expansion of our In-store branch network. The increase also reflects additional cost from increased employee benefit expense and annual merit salary adjustments and incentives. |
• |
$19 million, or 4%, increase in other noninterest expense, primarily reflecting an increase in allocated overhead expense and additional expense related to the Bank of America branch and the Camco acquisitions. |
• |
$7 million, or 16%, increase in outside data processing and other services expense, mainly the result of transaction volumes associated with debit and credit card activity. |
• |
$4 million, or 8%, increase in marketing, primarily due to direct mail campaigns in 2015. |
Partially offset by:
• |
$11 million, or 41%, decrease in amortization of intangibles, reflecting the full amortization of the core deposit intangible from the Sky Financial acquisition. |
2014 vs. 2013
Retail and Business Banking reported net income of $172 million in 2014, compared with a net income of $129 million in 2013. The $43 million increase included a $62 million, or 45%, decrease in provision for credit losses, a $12 million, or 3%, increase noninterest income, and a $10 million, or 1%, increase in net interest income partially offset by a $23 million, or 34%, increase in provision for income taxes and a $18 million, or 2%, increase in noninterest expense.
Commercial Banking |
||||||||||||||||||
Table 36 - Key Performance Indicators for Commercial Banking | ||||||||||||||||||
(dollar amounts in thousands unless otherwise noted) |
||||||||||||||||||
Year ended December 31, |
Change from 2014 |
|||||||||||||||||
2015 |
2014 |
Amount |
Percent |
2013 |
||||||||||||||
Net interest income |
$ |
365,181 |
$ |
306,434 |
$ |
58,747 |
19 |
% |
$ |
281,461 |
||||||||
Provision for credit losses |
49,460 |
31,521 |
17,939 |
57 |
27,464 |
|||||||||||||
Noninterest income |
258,191 |
209,238 |
48,953 |
23 |
200,573 |
|||||||||||||
Noninterest expense |
283,448 |
249,300 |
34,148 |
14 |
254,629 |
|||||||||||||
Provision for income taxes |
101,662 |
82,198 |
19,464 |
24 |
69,979 |
|||||||||||||
Net income |
$ |
188,802 |
$ |
152,653 |
$ |
36,149 |
24 |
% |
$ |
129,962 |
||||||||
Number of employees (average full-time equivalent) |
1,136 |
1,026 |
110 |
11 |
% |
1,072 |
||||||||||||
Total average assets (in millions)
|
$ |
16,038 |
$ |
14,145 |
$ |
1,893 |
13 |
$ |
11,821 |
|||||||||
Total average loans/leases (in millions)
|
12,757 |
11,901 |
856 |
7 |
10,804 |
|||||||||||||
Total average deposits (in millions)
|
11,246 |
10,207 |
1,039 |
10 |
9,429 |
|||||||||||||
Net interest margin |
2.69 |
% |
2.53 |
% |
0.16 |
% |
6 |
2.72 |
% |
|||||||||
NCOs |
$ |
22,226 |
$ |
7,852 |
$ |
14,374 |
183 |
$ |
(196 |
) |
||||||||
NCOs as a % of average loans and leases |
0.17 |
0.07 |
0.10 |
% |
143 |
— |
% |
|||||||||||
2015 vs. 2014
Commercial Banking reported net income of $189 million in 2015. This was an increase of $36 million, or 24%, compared to the year-ago period. The increase in net income reflected a combination of factors described below.
The increase in net interest income from the year-ago period reflected:
75
• |
$0.9 billion, or 7%, increase in average loans/leases.
|
• |
$0.7 billion, or 77%, increase in average available-for-sale securities, primarily related to direct purchase municipal securities. |
• |
$1.0 billion, or 10%, increase in average total deposits.
|
• |
16 basis point increase in the net interest margin due to a 19 basis point increase in the mix and yield on earning assets, primarily related to the Huntington Technology Finance acquisition. |
The increase in the provision for credit losses from the year-ago period reflected:
• |
A $14 million, or 183%, increase in NCOs, as well as growth in the commercial loan portfolio, and updated assumptions made to the ACL estimation process.
|
The increase in total average assets from the year-ago period reflected:
• |
$1.0 billion, or 26%, increase in the Equipment Finance loan and bond financing portfolio, which primarily reflected our focus on developing vertical strategies in Huntington Public Capital, business aircraft, rail industry, lender finance, and syndications, as well as the 2015 first quarter acquisition of Huntington Technology Finance. |
• |
$0.3 billion, or 17%, increase in the Corporate Banking loan portfolio due to establishing relationships with targeted prospects within our footprint. |
• |
$0.2 billion, or 8%, increase in the specialty verticals loan and bond financing portfolio, driven primarily by $0.2 billion, or 32%, increase in the international loan portfolio consisting of discounted bankers acceptances and foreign insured receivables. |
The increase in total average deposits from the year-ago period reflected:
• |
$1.3 billion, or 13%, increase in core deposits, which primarily reflected a $0.8 billion, or 16%, increase in noninterest-bearing demand deposits. Middle market accounts, such as healthcare, contributed $0.6 billion of the overall balance growth, while large corporate accounts contributed $0.7 billion. |
The increase in noninterest income from the year-ago period reflected:
• |
$34 million, or 259%, increase in equipment and technology finance related fee income, primarily reflecting the 2015 first quarter acquisition of Huntington Technology Finance. |
• |
$6 million, or 11%, increase in service charges on deposit accounts and other treasury management related revenue, primarily due to growth in commercial card and merchant services revenue and cash management growth. |
• |
$5 million, or 15%, increase in commitment and other loan related fees, such as syndication fees. |
• |
$4 million, or 9%, increase in capital market fees. |
The increase in noninterest expense from the year-ago period reflected:
• |
$26 million, or 18%, increase in personnel expense, primarily reflecting the 2015 first quarter acquisition of Huntington Technology Finance. The increase also reflects additional cost from annual merit salary adjustments and incentives. |
• |
$15 million, or 945%, increase in operating lease expense from the 2015 first quarter acquisition of Huntington Technology Finance. |
Partially offset by:
• |
$8 million, or 20%, decrease in allocated overhead expense. |
2014 vs. 2013
Commercial Banking reported net income of $153 million in 2014, compared with net income of $130 million in 2013. The $23 million increase included a $25 million, or 9%, increase in net interest income, a $9 million, or 4%, increase in noninterest income, and a $5 million, or 2%, decrease in noninterest expense partially offset by $12 million, or 17%, increase in provision for income taxes and a $4 million, or 15%, increase in provision for credit losses.
76
Automobile Finance and Commercial Real Estate |
||||||||||||||||||
Table 37 - Key Performance Indicators for Automobile Finance and Commercial Real Estate | ||||||||||||||||||
(dollar amounts in thousands unless otherwise noted) |
||||||||||||||||||
Year ended December 31, |
Change from 2014 |
|||||||||||||||||
2015 |
2014 |
Amount |
Percent |
2013 |
||||||||||||||
Net interest income |
$ |
381,189 |
$ |
379,363 |
$ |
1,826 |
— |
% |
$ |
366,508 |
||||||||
Provision (reduction in allowance) for credit losses |
4,931 |
(52,843 |
) |
57,774 |
N.R. |
(82,269 |
) |
|||||||||||
Noninterest income |
29,257 |
26,628 |
2,629 |
10 |
46,819 |
|||||||||||||
Noninterest expense |
152,010 |
156,715 |
(4,705 |
) |
(3 |
) |
156,469 |
|||||||||||
Provision for income taxes |
88,727 |
105,742 |
(17,015 |
) |
(16 |
) |
118,694 |
|||||||||||
Net income |
$ |
164,778 |
$ |
196,377 |
$ |
(31,599 |
) |
(16 |
)% |
$ |
220,433 |
|||||||
Number of employees (average full-time equivalent) |
298 |
271 |
27 |
10 |
% |
285 |
||||||||||||
Total average assets (in millions)
|
$ |
16,894 |
$ |
14,591 |
$ |
2,303 |
16 |
$ |
12,981 |
|||||||||
Total average loans/leases (in millions)
|
15,812 |
14,224 |
1,588 |
11 |
12,391 |
|||||||||||||
Total average deposits (in millions)
|
1,496 |
1,204 |
292 |
24 |
1,039 |
|||||||||||||
Net interest margin |
2.34 |
% |
2.61 |
% |
(0.27 |
)% |
(10 |
) |
2.82 |
% |
||||||||
NCOs |
$ |
(8,028 |
) |
$ |
2,100 |
$ |
(10,128 |
) |
N.R. |
$ |
29,137 |
|||||||
NCOs as a % of average loans and leases |
(0.05 |
)% |
0.01 |
% |
(0.06 |
)% |
N.R. |
0.24 |
% |
|||||||||
N.R. - Not relevant.
2015 vs. 2014
AFCRE reported net income of $165 million in 2015. This was a decrease of $32 million, or 16%, compared to the year-ago period. The decrease in net income reflected a combination of factors described below.
The increase in net interest income from the year-ago period reflected:
• |
$1.1 billion, or 14%, increase in average automobile loans, primarily due to continued strong origination volume, which has exceeded $1.0 billion for each of the last 8 quarters. This increase was partially offset by the $0.8 billion automobile loan securitization and sale that was completed in the 2015 second quarter. |
Partially offset by:
• |
27 basis point decrease in the net interest margin, primarily due to a 25 basis point reduction in loan spreads. This decline continues to reflect the impact of competitive pricing pressures. Also, the prior year results included a $5 million recovery from the unexpected payoff of an acquired commercial real estate loan. |
The increase in the provision for credit losses from the year-ago period reflected:
• |
Growth in loan balances, as well as updated assumptions made to the ACL estimation process, partially offset by lower NCOs. |
The increase in noninterest income from the year-ago period reflected:
• |
$5 million increase in gain on sale of loans, primarily due to the $0.8 billion automobile loan securitization and sale completed in the 2015 second quarter. |
Partially offset by:
• |
$3 million, or 13%, decrease in other income, primarily due to amortization expense associated with community development related investments and lower auto loan servicing income, partially offset by fee income from sales of derivative products. |
The decrease in noninterest expense from the year-ago period reflected:
• |
$9 million, or 8%, decrease in other noninterest expense, primarily due to a decrease in allocated expenses. |
Partially offset by:
77
• |
$4 million, or 15%, increase in personnel costs, primarily due to a higher number of employees, resulting from higher production and business development activities, including community development. |
2014 vs. 2013
AFCRE reported net income of $196 million in 2014, compared with a net income of $220 million in 2013. The $24 million decrease included a $29 million, or 36%, decrease in the reduction in allowance for credit losses, $20 million, or 43%, decrease in noninterest income partially offset by a $13 million, or 4%, increase in net interest income and a $13 million, or 11%, decrease in provision for income taxes.
Regional Banking and The Huntington Private Client Group |
||||||||||||||||||
Table 38 - Key Performance Indicators for Regional Banking and The Huntington Private Client Group | ||||||||||||||||||
(dollar amounts in thousands unless otherwise noted) |
||||||||||||||||||
Year ended December 31, |
Change from 2014 |
|||||||||||||||||
2015 |
2014 |
Amount |
Percent |
2013 |
||||||||||||||
Net interest income |
$ |
115,608 |
$ |
101,839 |
$ |
13,769 |
14 |
% |
$ |
105,862 |
||||||||
Provision (reduction in allowance) for credit losses |
65 |
4,893 |
(4,828 |
) |
(99 |
) |
(5,376 |
) |
||||||||||
Noninterest income |
153,160 |
173,550 |
(20,390 |
) |
(12 |
) |
186,430 |
|||||||||||
Noninterest expense |
254,380 |
236,634 |
17,746 |
7 |
236,895 |
|||||||||||||
Provision for income taxes |
5,013 |
11,852 |
(6,839 |
) |
(58 |
) |
21,271 |
|||||||||||
Net income |
$ |
9,310 |
$ |
22,010 |
$ |
(12,700 |
) |
(58 |
)% |
$ |
39,502 |
|||||||
Number of employees (average full-time equivalent) |
977 |
1,022 |
(45 |
) |
(4 |
)% |
1,065 |
|||||||||||
Total average assets (in millions)
|
$ |
3,388 |
$ |
3,812 |
$ |
(424 |
) |
(11 |
) |
$ |
3,732 |
|||||||
Total average loans/leases (in millions)
|
2,948 |
2,894 |
54 |
2 |
2,832 |
|||||||||||||
Total average deposits (in millions)
|
7,272 |
6,029 |
1,243 |
21 |
5,765 |
|||||||||||||
Net interest margin |
1.61 |
% |
1.75 |
% |
(0.14 |
)% |
(8 |
) |
1.90 |
% |
||||||||
NCOs |
$ |
4,816 |
$ |
8,143 |
$ |
(3,327 |
) |
(41 |
) |
$ |
11,094 |
|||||||
NCOs as a % of average loans and leases |
0.16 |
% |
0.28 |
% |
(0.12 |
)% |
(43 |
) |
0.39 |
% |
||||||||
Total assets under management (in billions)—eop
|
$ |
11.8 |
$ |
14.8 |
$ |
(3.0 |
) |
(20 |
) |
$ |
16.7 |
|||||||
Total trust assets (in billions)—eop
|
81.6 |
81.5 |
0.1 |
— |
80.9 |
|||||||||||||
eop—End of Period.
2015 vs. 2014
RBHPCG reported net income of $9 million in 2015. This was a decrease of $13 million, or 58%, when compared to the year-ago period. The decrease in net income reflected a combination of factors described below.
The increase in net interest income from the year-ago period reflected:
• |
$1.2 billion, or 21%, increase in average total deposits, primarily due to growth in commercial money market deposits.
|
The decrease in the provision for credit losses reflected from the year-ago period reflected:
• |
$3 million, or 41%, decrease in NCOs and updated assumptions made to the ACL estimation process.
|
The decrease in noninterest income from the year-ago period reflected:
• |
$10 million, or 9%, decrease in trust services, primarily related to a decline in assets under management mainly from the decline in proprietary mutual funds following the 2014 second quarter transition of the fixed income and 2015 transition of the remaining Huntington Funds to a third-party and the movement of the fiduciary trust business to a more open architecture platform. |
• |
$6 million, or 14%, decrease in brokerage income, primarily reflecting a shift from upfront commission income to trailing commissions and an increase in the sale of new open architecture advisory products. |
• |
$3 million, or 30%, decrease in other noninterest income, primarily related to 2014 Huntington Community Development Corporation activity. |
78
The increase in noninterest expense from the year-ago period reflected:
• |
$27 million, or 45%, increase in other noninterest expense, primarily due to increased allocated product costs, losses, and proprietary mutual fund expense reimbursements. |
Partially offset by:
• |
$5 million, or 4%, decrease in personnel costs, primarily due to movement of certain trust personnel to corporate operations and reduced incentives related to the reduction in trust and brokerage income. |
• |
$2 million, or 9%, decrease in outside data processing and other services, primarily due to movement of trust system expenses to corporate operations. |
2014 vs. 2013
RBHPCG reported net income of $22 million in 2014, compared with a net income of $40 million in 2013. The $17 million decrease included a $13 million, or 7%, decrease in noninterest income, a $10 million increase in provision for credit losses, and a $4 million, or 4%, decrease in net interest income. This was partially offset by a $9 million, or 44% decrease in provision for income taxes.
Home Lending |
||||||||||||||||||
Table 39 - Key Performance Indicators for Home Lending | ||||||||||||||||||
(dollar amounts in thousands unless otherwise noted) |
||||||||||||||||||
Year ended December 31, |
Change from 2014 |
|||||||||||||||||
2015 |
2014 |
Amount |
Percent |
2013 |
||||||||||||||
Net interest income |
$ |
65,884 |
$ |
58,015 |
$ |
7,869 |
14 |
% |
$ |
51,839 |
||||||||
Provision for credit losses |
2,670 |
21,889 |
(19,219 |
) |
(88 |
) |
12,249 |
|||||||||||
Noninterest income |
87,021 |
69,899 |
17,122 |
24 |
106,006 |
|||||||||||||
Noninterest expense |
157,266 |
136,374 |
20,892 |
15 |
141,489 |
|||||||||||||
Provision for income taxes |
(2,461 |
) |
(10,622 |
) |
8,161 |
(77 |
) |
1,437 |
||||||||||
Net income (loss) |
$ |
(4,570 |
) |
$ |
(19,727 |
) |
$ |
15,157 |
(77 |
)% |
$ |
2,670 |
||||||
Number of employees (average full-time equivalent) |
982 |
971 |
11 |
1 |
% |
1,080 |
||||||||||||
Total average assets (in millions)
|
$ |
3,980 |
$ |
3,810 |
$ |
170 |
4 |
$ |
3,676 |
|||||||||
Total average loans/leases (in millions)
|
3,387 |
3,298 |
89 |
3 |
3,116 |
|||||||||||||
Total average deposits (in millions)
|
351 |
292 |
59 |
20 |
355 |
|||||||||||||
Net interest margin |
1.74 |
% |
1.61 |
% |
0.13 |
% |
8 |
1.50 |
% |
|||||||||
NCOs |
$ |
5,758 |
$ |
15,900 |
$ |
(10,142 |
) |
(64 |
) |
$ |
17,266 |
|||||||
NCOs as a % of average loans and leases |
0.17 |
% |
0.48 |
% |
(0.31 |
)% |
(65 |
) |
0.55 |
% |
||||||||
Mortgage banking origination volume (in millions) |
$ |
4,705 |
$ |
3,558 |
$ |
1,147 |
32 |
$ |
4,418 |
|||||||||
2015 vs. 2014
Home Lending reported a net loss of $5 million in 2015. This was an improvement of $15 million, when compared to the year-ago period. The reduction in the net loss reflected a combination of factors described below.
The increase in net interest income from the year-ago period reflected:
• |
13 basis point increase in the net interest margin, primarily due to an increase in loan spreads on consumer loans driven by lower funding costs. |
The decrease in provision for credit losses from the year-ago period reflected:
• |
$10 million, or 64%, decrease in NCOs and updated assumptions made to the ACL estimation process.
|
The increase in noninterest income from the year-ago period reflected:
• |
$16 million, or 24%, increase in mortgage banking income, primarily due to production revenue driven by higher origination volume, partially offset by the impact of the net MSR hedge results. |
The increase in noninterest expense from the year-ago period reflected:
79
• |
$13 million, or 64%, increase in other noninterest expense, primarily due to higher allocated expenses related to volumes. |
• |
$10 million, or 12%, increase in personnel costs, primarily due to commission expense related to higher origination volume. |
2014 vs. 2013
Home Lending reported a net loss of $20 million in 2014, compared to net income of $3 million in 2013. The $22 million decrease included a $36 million, or 34%, decrease in noninterest income and a $10 million, or 79%, increase in provision for credit losses partially offset by a $12 million increase in benefit from income taxes, $6 million, or 12%, increase in net interest income, and a $5 million, or 4%, decrease in noninterest expense.
RESULTS FOR THE FOURTH QUARTER
Earnings Discussion
In the 2015 fourth quarter, we reported net income of $178 million, an increase of $15 million, or 9%, from the 2014 fourth quarter. Earnings per common share for the 2015 fourth quarter were $0.21, an increase of $0.02 from the year-ago quarter.
Table 40 - Significant Items Influencing Earnings Performance Comparison | |||||||
(dollar amounts in millions, except per share amounts) |
|||||||
Impact(1)
|
|||||||
Three Months Ended: |
Amount |
EPS(2)
|
|||||
December 31, 2015—GAAP net income |
$ |
178 |
$ |
0.21 |
|||
Franchise repositioning related expense |
(8 |
) |
(0.01 |
) |
|||
Mergers and acquisitions, net gains(3) |
— |
— |
|||||
December 31, 2014—GAAP net income |
$ |
164 |
$ |
0.19 |
|||
Net additions to litigation reserve |
(12 |
) |
(0.01 |
) |
|||
Franchise repositioning related expense |
(9 |
) |
(0.01 |
) |
|||
(1) |
Favorable (unfavorable) impact on GAAP earnings; pretax unless otherwise noted. |
(2) |
After-tax. EPS is reflected on a fully diluted basis. |
(3) |
Noninterest expense and noninterest income was recorded related to the sale of HAA, HASI, and Unified, resulting in a net gain less than $1 million. |
Net Interest Income / Average Balance Sheet
FTE net interest income for the 2015 fourth quarter increased $25 million, or 5%, from the 2014 fourth quarter. This reflected the benefit from the $5.0 billion, or 8%, increase in average earning assets partially offset by a 9 basis point reduction in the FTE NIM to 3.09%. Average earning asset growth included a $2.7 billion, or 6%, increase in average loans and leases and a $2.1 billion, or 17%, increase in average securities. The NIM contraction reflected a 4 basis point decrease related to the mix and yield of earning assets and 9 basis point increase in funding costs, partially offset by the 4 basis point increase in the benefit from noninterest-bearing funds.
80
Table 41 - Average Earning Assets - 2015 Fourth Quarter vs. 2014 Fourth Quarter | ||||||||||||||
(dollar amounts in millions) |
||||||||||||||
Fourth Quarter |
Change |
|||||||||||||
2015 |
2014 |
Amount |
Percent |
|||||||||||
Loans/Leases |
||||||||||||||
Commercial and industrial |
$ |
20,186 |
$ |
18,880 |
$ |
1,306 |
7 |
% |
||||||
Commercial real estate |
5,266 |
5,084 |
182 |
4 |
||||||||||
Total commercial |
25,452 |
23,964 |
1,488 |
6 |
||||||||||
Automobile |
9,286 |
8,512 |
774 |
9 |
||||||||||
Home equity |
8,463 |
8,452 |
11 |
— |
||||||||||
Residential mortgage |
6,079 |
5,751 |
328 |
6 |
||||||||||
Other consumer |
547 |
413 |
134 |
32 |
||||||||||
Total consumer |
24,375 |
23,128 |
1,247 |
5 |
||||||||||
Total loans/leases |
49,827 |
47,092 |
2,735 |
6 |
||||||||||
Total securities |
14,543 |
12,459 |
2,084 |
17 |
||||||||||
Loans held-for-sale and other earning assets |
591 |
459 |
132 |
29 |
||||||||||
Total earning assets |
$ |
64,961 |
$ |
60,010 |
$ |
4,951 |
8 |
% |
||||||
Average earning assets for the 2015 fourth quarter increased $5.0 billion, or 8%, from the year-ago quarter, driven by:
• |
$2.1 billion, or 17%, increase in average securities, primarily reflecting the additional investment in LCR Level 1 qualifying securities. The 2015 fourth quarter average balance also included $2.0 billion of direct purchase municipal instruments originated by our Commercial segment, up from $1.2 billion in the year-ago quarter.
|
• |
$1.3 billion, or 7%, increase in average C&I loans and leases, primarily reflecting the $1.1 billion increase in asset finance, including the $0.8 billion of equipment finance leases acquired in the Huntington Technology Finance transaction in the 2015 first quarter.
|
• |
$0.8 billion, or 9%, increase in average Automobile loans. The 2015 fourth quarter represented the eighth consecutive quarter of greater than $1.0 billion in originations.
|
• |
$0.3 billion, or 6%, increase in average Residential mortgage loans.
|
Table 42 - Average Interest-Bearing Liabilities - 2015 Fourth Quarter vs. 2014 Fourth Quarter | ||||||||||||||
(dollar amounts in millions) |
||||||||||||||
Fourth Quarter |
Change |
|||||||||||||
2015 |
2014 |
Amount |
Percent |
|||||||||||
Deposits |
||||||||||||||
Demand deposits: noninterest-bearing |
$ |
17,174 |
$ |
15,179 |
$ |
1,995 |
13 |
% |
||||||
Demand deposits: interest-bearing |
6,923 |
5,948 |
975 |
16 |
||||||||||
Total demand deposits |
24,097 |
21,127 |
2,970 |
14 |
||||||||||
Money market deposits |
19,843 |
18,401 |
1,442 |
8 |
||||||||||
Savings and other domestic deposits |
5,215 |
5,052 |
163 |
3 |
||||||||||
Core certificates of deposit |
2,430 |
3,058 |
(628 |
) |
(21 |
) |
||||||||
Total core deposits |
51,585 |
47,638 |
3,947 |
8 |
||||||||||
Other domestic deposits of $250,000 or more |
426 |
201 |
225 |
112 |
||||||||||
Brokered deposits and negotiable CDs |
2,929 |
2,434 |
495 |
20 |
||||||||||
Deposits in foreign offices |
398 |
479 |
(81 |
) |
(17 |
) |
||||||||
Total deposits |
55,338 |
50,752 |
4,586 |
9 |
||||||||||
Short-term borrowings |
524 |
2,683 |
(2,159 |
) |
(80 |
) |
||||||||
Long-term debt |
6,813 |
3,956 |
2,857 |
72 |
||||||||||
Total interest-bearing liabilities |
$ |
45,501 |
$ |
42,212 |
$ |
3,289 |
8 |
% |
||||||
81
Average total deposits for the 2015 fourth quarter increased $4.6 billion, or 9%, from the year-ago quarter, including a $3.9 billion, or 8%, increase in average total core deposits. The growth in average total core deposits more than fully funded the year-over-year increase in average total loans and leases. Average total interest-bearing liabilities increased $3.3 billion, or 8%, from the year-ago quarter. Year-over-year changes in average total deposits and average total debt included:
• |
$3.0 billion, or 14%, increase in average total demand deposits, including a $2.0 billion, or 13%, increase in average noninterest-bearing demand deposits and a $1.0 billion, or 16%, increase in average interest-bearing demand deposits. The increase in average total demand deposits was comprised of a $2.1 billion, or 16%, increase in average commercial demand deposits and a $0.8 billion, or 11%, increase in average consumer demand deposits.
|
• |
$1.4 billion, or 8%, increase in average money market deposits, reflecting continued banker focus across all segments on obtaining our customers’ full deposit relationship.
|
• |
$0.7 billion, or 11%, increase in average total debt, reflecting a $2.9 billion, or 72%, increase in average long-term debt partially offset by a $2.2 billion, or 80%, reduction in average short-term borrowings. The increase in average long-term debt reflected the issuance of $3.1 billion of bank-level senior debt during 2015, including $0.9 billion during the 2015 fourth quarter, as well as $0.5 billion of debt assumed in the Huntington Technology Finance acquisition at the end of the 2015 first quarter. |
• |
$0.5 billion, or 20%, increase in average brokered deposits and negotiable CDs, which were used to efficiently finance balance sheet growth while continuing to manage the overall cost of funds.
|
Partially offset by:
• |
$0.6 billion, or 21%, decrease in average core certificates of deposit due to the strategic focus on changing the funding sources to low- and no-cost demand deposits and money market deposits.
|
Provision for Credit Losses
The provision for credit losses increased to $36 million in the 2015 fourth quarter compared to $2 million in the 2014 fourth quarter. The 2015 fourth quarter included approximately $10 million related to E&P firms. In addition, the year ago quarter included a higher than expected level of commercial recoveries and a decrease in CRE NALs.
Noninterest Income
Table 43 - Noninterest Income - 2015 Fourth Quarter vs. 2014 Fourth Quarter | ||||||||||||||
(dollar amounts in thousands) |
||||||||||||||
Fourth Quarter |
Change |
|||||||||||||
2015 |
2014 |
Amount |
Percent |
|||||||||||
Service charges on deposit accounts |
$ |
72,854 |
$ |
67,408 |
$ |
5,446 |
8 |
% |
||||||
Cards and payment processing income |
37,594 |
27,993 |
9,601 |
34 |
||||||||||
Mortgage banking income |
31,418 |
14,030 |
17,388 |
124 |
||||||||||
Trust services |
25,272 |
28,781 |
(3,509 |
) |
(12 |
) |
||||||||
Insurance income |
15,528 |
16,252 |
(724 |
) |
(4 |
) |
||||||||
Brokerage income |
14,462 |
16,050 |
(1,588 |
) |
(10 |
) |
||||||||
Capital markets fees |
13,778 |
13,791 |
(13 |
) |
— |
|||||||||
Bank owned life insurance income |
13,441 |
14,988 |
(1,547 |
) |
(10 |
) |
||||||||
Gain on sale of loans |
10,122 |
5,408 |
4,714 |
87 |
||||||||||
Securities gains (losses) |
474 |
(104 |
) |
578 |
N.R. |
|||||||||
Other income |
37,272 |
28,681 |
8,591 |
30 |
||||||||||
Total noninterest income |
$ |
272,215 |
$ |
233,278 |
$ |
38,937 |
17 |
% |
||||||
N.R. - Not relevant.
Noninterest income for the 2015 fourth quarter increased $39 million, or 17%, from the year-ago quarter. The year-over-year increase primarily reflected:
• |
$17 million, or 124%, increase in mortgage banking income, reflecting an $11 million increase in origination and secondary marketing revenues and a $5 million increase from net MSR hedging-related activities.
|
82
• |
$10 million, or 34%, increase in cards and payment processing income, due to higher card related income and underlying customer growth.
|
• |
$9 million, or 30%, increase in other income, including $6 million of operating lease income related to Huntington Technology Finance and the $3 million net gain on the sale of HAA, HASI, and Unified.
|
• |
$5 million, or 8%, increase in service charges on deposit accounts, reflecting the benefit of continued new customer acquisition including a 2% increase in commercial checking relationships and a 4% increase in consumer checking households.
|
• |
$5 million, or 87%, increase in gain on sale of loans.
|
Partially offset by:
• |
$4 million, or 12%, decrease in trust services, primarily related to our fiduciary trust businesses moving to a more open architecture platform and a decline in assets under management in proprietary mutual funds. During the 2015 fourth quarter, the Company closed the previously announced transactions to transition the Huntington Funds and to sell HAA, HASI, and Unified.
|
Noninterest Expense |
||||||||||||||
Table 44 - Noninterest Expense - 2015 Fourth Quarter vs. 2014 Fourth Quarter | ||||||||||||||
(dollar amounts in thousands) |
||||||||||||||
Fourth Quarter |
Change |
|||||||||||||
2015 |
2014 |
Amount |
Percent |
|||||||||||
Personnel costs |
$ |
288,861 |
$ |
263,289 |
$ |
25,572 |
10 |
% |
||||||
Outside data processing and other services |
63,775 |
53,685 |
10,090 |
19 |
||||||||||
Equipment |
31,711 |
31,981 |
(270 |
) |
(1 |
) |
||||||||
Net occupancy |
32,939 |
31,565 |
1,374 |
4 |
||||||||||
Marketing |
12,035 |
12,466 |
(431 |
) |
(3 |
) |
||||||||
Professional services |
13,010 |
15,665 |
(2,655 |
) |
(17 |
) |
||||||||
Deposit and other insurance expense |
11,105 |
13,099 |
(1,994 |
) |
(15 |
) |
||||||||
Amortization of intangibles |
3,788 |
10,653 |
(6,865 |
) |
(64 |
) |
||||||||
Other expense |
41,542 |
50,868 |
(9,326 |
) |
(18 |
) |
||||||||
Total noninterest expense |
$ |
498,766 |
$ |
483,271 |
$ |
15,495 |
3 |
% |
||||||
Number of employees (average full-time equivalent) |
12,418 |
11,875 |
543 |
5 |
% |
|||||||||
Impacts of Significant Items: |
Fourth Quarter |
||||||
(dollar amounts in thousands) |
2015 |
2014 |
|||||
Personnel costs |
$ |
2,332 |
$ |
2,165 |
|||
Outside data processing and other services |
1,990 |
306 |
|||||
Equipment |
110 |
2,003 |
|||||
Net occupancy |
4,587 |
4,150 |
|||||
Marketing |
— |
14 |
|||||
Professional services |
1,153 |
— |
|||||
Other expense |
318 |
11,644 |
|||||
Total noninterest expense adjustments |
$ |
10,490 |
$ |
20,282 |
|||
83
Adjusted Noninterest Expense (Non-GAAP): |
||||||||||||||
(dollar amounts in thousands) |
Fourth Quarter |
Change |
||||||||||||
2015 |
2014 |
Amount |
Percent |
|||||||||||
Personnel costs |
$ |
286,529 |
$ |
261,124 |
$ |
25,405 |
10 |
% |
||||||
Outside data processing and other services |
61,785 |
53,379 |
8,406 |
16 |
||||||||||
Equipment |
31,601 |
29,978 |
1,623 |
5 |
||||||||||
Net occupancy |
28,352 |
27,415 |
937 |
3 |
||||||||||
Marketing |
12,035 |
12,452 |
(417 |
) |
(3 |
) |
||||||||
Professional services |
11,857 |
15,665 |
(3,808 |
) |
(24 |
) |
||||||||
Deposit and other insurance expense |
11,105 |
13,099 |
(1,994 |
) |
(15 |
) |
||||||||
Amortization of intangibles |
3,788 |
10,653 |
(6,865 |
) |
(64 |
) |
||||||||
Other expense |
41,224 |
39,224 |
2,000 |
5 |
||||||||||
Total adjusted noninterest expense |
$ |
488,276 |
$ |
462,989 |
$ |
25,287 |
5 |
% |
||||||
Reported noninterest expense for the 2015 fourth quarter increased $15 million, or 3%, from the year-ago quarter. Changes in reported noninterest expense primarily reflect:
• |
$26 million, or 10%, increase in personnel costs, reflecting a $26 million increase in salaries related to annual merit increases, the addition of Huntington Technology Finance, and a 5% increase in the number of average full-time equivalent employees, largely related to the build-out of the in-store strategy.
|
• |
$10 million, or 19%, increase in outside data processing and other services expense, primarily related to ongoing technology investments.
|
Partially offset by:
• |
$9 million, or 18%, decrease in other expense, primarily reflecting the $12 million net increase to litigation reserves in the 2014 fourth quarter partially offset by $4 million of operating lease expense related to Huntington Technology Finance.
|
• |
$7 million, or 64%, decrease in amortization of intangibles reflecting the full amortization of the core deposit intangible from the Sky Financial acquisition at the end of the 2015 second quarter.
|
Provision for Income Taxes
The provision for income taxes in the 2015 fourth quarter was $56 million and $57 million in the 2014 fourth quarter. The effective tax rates for the 2015 fourth quarter and 2014 fourth quarter were 23.8% and 25.9%, respectively. At December 31, 2015, we had a net federal deferred tax asset of $7 million and a net state deferred tax asset of $43 million.
Credit Quality
NCOs
NCOs decreased $1 million, or 5%, to $22 million. NCOs represented an annualized 0.18% of average loans and leases in the current quarter compared to 0.20% in the year-ago quarter. The quarter's results were positively impacted by recovery activity in the C&I and CRE portfolios as a result of continued successful workout strategies. We continue to be pleased with the net charge-off performance across the entire portfolio, as we remain below our targeted range. Overall consumer credit metrics, led by the Home Equity portfolio continue to show an improving trend, while the commercial portfolios continue to experience some quarter-to-quarter volatility based on the absolute low level of problem loans.
NALs
Overall asset quality remains strong, with modest volatility based on the absolute low level of problem credits. NALs increased $71 million, or 24%, from the year-ago quarter to $372 million, or 0.74% of total loans and leases. The increase was primarily centered in the Commercial portfolio and was primarily comprised of several large energy-related relationships. NPAs increased $61 million, or 18%, from the year-ago quarter to $399 million, or 0.79% of total loans and leases and net OREO.
ACL
(This section should be read in conjunction with Note 3 of the Notes to Consolidated Financial Statements.)
84
The period-end ACL as a percentage of total loans and leases decreased to 1.33% from 1.40% a year ago, while the ACL as a percentage of period-end total NALs decreased to 180% from 222%. Management believes the level of the ACL is appropriate given the credit quality metrics and the current composition of the overall loan and lease portfolio.
85
Table 45 - Selected Quarterly Income Statement Data (1) | |||||||||||||||
(dollar amounts in thousands, except per share amounts) |
|||||||||||||||
Three months ended |
|||||||||||||||
December 31, |
September 30, |
June 30, |
March 31, |
||||||||||||
2015 |
2015 |
2015 |
2015 |
||||||||||||
Interest income |
$ |
544,153 |
$ |
538,477 |
$ |
529,795 |
$ |
502,096 |
|||||||
Interest expense |
47,242 |
43,022 |
39,109 |
34,411 |
|||||||||||
Net interest income |
496,911 |
495,455 |
490,686 |
467,685 |
|||||||||||
Provision for credit losses |
36,468 |
22,476 |
20,419 |
20,591 |
|||||||||||
Net interest income after provision for credit losses |
460,443 |
472,979 |
470,267 |
447,094 |
|||||||||||
Total noninterest income |
272,215 |
253,119 |
281,773 |
231,623 |
|||||||||||
Total noninterest expense |
498,766 |
526,508 |
491,777 |
458,857 |
|||||||||||
Income before income taxes |
233,892 |
199,590 |
260,263 |
219,860 |
|||||||||||
Provision for income taxes |
55,583 |
47,002 |
64,057 |
54,006 |
|||||||||||
Net income |
178,309 |
152,588 |
196,206 |
165,854 |
|||||||||||
Dividends on preferred shares |
7,972 |
7,968 |
7,968 |
7,965 |
|||||||||||
Net income applicable to common shares |
$ |
170,337 |
$ |
144,620 |
$ |
188,238 |
$ |
157,889 |
|||||||
Common shares outstanding |
|||||||||||||||
Average—basic |
796,095 |
800,883 |
806,891 |
809,778 |
|||||||||||
Average—diluted(2) |
810,143 |
814,326 |
820,238 |
823,809 |
|||||||||||
Ending |
794,929 |
796,659 |
803,066 |
808,528 |
|||||||||||
Book value per common share |
$ |
7.81 |
$ |
7.78 |
$ |
7.61 |
$ |
7.51 |
|||||||
Tangible book value per common share(3) |
6.91 |
6.88 |
6.71 |
6.62 |
|||||||||||
Per common share |
|||||||||||||||
Net income—basic |
$ |
0.21 |
$ |
0.18 |
$ |
0.23 |
$ |
0.19 |
|||||||
Net income—diluted |
0.21 |
0.18 |
0.23 |
0.19 |
|||||||||||
Cash dividends declared |
0.07 |
0.06 |
0.06 |
0.06 |
|||||||||||
Common stock price, per share |
|||||||||||||||
High(4) |
$ |
11.87 |
$ |
11.90 |
$ |
11.72 |
$ |
11.30 |
|||||||
Low(4) |
10.21 |
10.00 |
10.67 |
9.63 |
|||||||||||
Close |
11.06 |
10.60 |
11.31 |
11.05 |
|||||||||||
Average closing price |
11.18 |
11.16 |
11.19 |
10.56 |
|||||||||||
Return on average total assets |
1.00 |
% |
0.87 |
% |
1.16 |
% |
1.02 |
% |
|||||||
Return on average common shareholders’ equity |
10.8 |
9.3 |
12.3 |
10.6 |
|||||||||||
Return on average tangible common shareholders’ equity(5) |
12.4 |
10.7 |
14.4 |
12.2 |
|||||||||||
Efficiency ratio(6) |
63.7 |
69.1 |
61.7 |
63.5 |
|||||||||||
Effective tax rate |
23.8 |
23.5 |
24.6 |
24.6 |
|||||||||||
Margin analysis-as a % of average earning assets(7) |
|||||||||||||||
Interest income(7) |
3.37 |
% |
3.42 |
% |
3.45 |
% |
3.38 |
% |
|||||||
Interest expense |
0.28 |
0.26 |
0.25 |
0.23 |
|||||||||||
Net interest margin(7) |
3.09 |
% |
3.16 |
% |
3.20 |
% |
3.15 |
% |
|||||||
Revenue—FTE |
|||||||||||||||
Net interest income |
$ |
496,911 |
$ |
495,455 |
$ |
490,686 |
$ |
467,685 |
|||||||
FTE adjustment |
8,425 |
8,168 |
7,962 |
7,560 |
|||||||||||
Net interest income(7) |
505,336 |
503,623 |
498,648 |
475,245 |
|||||||||||
Noninterest income |
272,215 |
253,119 |
281,773 |
231,623 |
|||||||||||
Total revenue(7) |
$ |
777,551 |
$ |
756,742 |
$ |
780,421 |
$ |
706,868 |
|||||||
86
Table 46 - Selected Quarterly Income Statement, Capital, and Other Data (1) | |||||||||||||||
2015 |
|||||||||||||||
Capital adequacy |
December 31, |
September 30, |
June 30, |
March 31, |
|||||||||||
Total risk-weighted assets (in millions)(10) |
$ |
58,420 |
$ |
57,839 |
$ |
57,850 |
$ |
57,840 |
|||||||
Tier 1 leverage ratio (period end)(10) |
8.79 |
% |
8.85 |
% |
8.98 |
% |
9.04 |
% |
|||||||
Common equity tier 1 risk-based capital ratio(10) |
9.79 |
9.72 |
9.65 |
9.51 |
|||||||||||
Tier 1 risk-based capital ratio (period end)(10) |
10.53 |
10.49 |
10.41 |
10.22 |
|||||||||||
Total risk-based capital ratio (period end)(10) |
12.64 |
12.70 |
12.62 |
12.48 |
|||||||||||
Tangible common equity / tangible asset ratio(8) |
7.81 |
7.89 |
7.91 |
7.95 |
|||||||||||
Tangible equity / tangible asset ratio(9) |
8.36 |
8.44 |
8.48 |
8.53 |
|||||||||||
Tangible common equity / risk-weighted assets ratio(10) |
9.41 |
9.48 |
9.32 |
9.25 |
|||||||||||
87
Table 47 - Selected Quarterly Income Statement Data (1) | |||||||||||||||
(dollar amounts in thousands, except per share amounts) |
|||||||||||||||
Three months ended |
|||||||||||||||
December 31, |
September 30, |
June 30, |
March 31, |
||||||||||||
2014 |
2014 |
2014 |
2014 |
||||||||||||
Interest income |
$ |
507,625 |
$ |
501,060 |
$ |
495,322 |
$ |
472,455 |
|||||||
Interest expense |
34,373 |
34,725 |
35,274 |
34,949 |
|||||||||||
Net interest income |
473,252 |
466,335 |
460,048 |
437,506 |
|||||||||||
Provision for credit losses |
2,494 |
24,480 |
29,385 |
24,630 |
|||||||||||
Net interest income after provision for credit losses |
470,758 |
441,855 |
430,663 |
412,876 |
|||||||||||
Total noninterest income |
233,278 |
247,349 |
250,067 |
248,485 |
|||||||||||
Total noninterest expense |
483,271 |
480,318 |
458,636 |
460,121 |
|||||||||||
Income before income taxes |
220,765 |
208,886 |
222,094 |
201,240 |
|||||||||||
Provision for income taxes |
57,151 |
53,870 |
57,475 |
52,097 |
|||||||||||
Net income |
163,614 |
155,016 |
164,619 |
153,274 |
|||||||||||
Dividends on preferred shares |
7,963 |
7,964 |
7,963 |
7,964 |
|||||||||||
Net income applicable to common shares |
$ |
155,651 |
$ |
147,052 |
$ |
156,656 |
$ |
145,310 |
|||||||
Common shares outstanding |
|||||||||||||||
Average—basic |
811,967 |
816,497 |
821,546 |
829,659 |
|||||||||||
Average—diluted(2) |
825,338 |
829,623 |
834,687 |
842,677 |
|||||||||||
Ending |
811,455 |
814,454 |
817,002 |
827,772 |
|||||||||||
Book value per share |
$ |
7.32 |
$ |
7.24 |
$ |
7.17 |
$ |
6.99 |
|||||||
Tangible book value per share(3) |
6.62 |
6.53 |
6.48 |
6.31 |
|||||||||||
Per common share |
|||||||||||||||
Net income—basic |
$ |
0.19 |
$ |
0.18 |
$ |
0.19 |
$ |
0.17 |
|||||||
Net income —diluted |
0.19 |
0.18 |
0.19 |
0.17 |
|||||||||||
Cash dividends declared |
0.06 |
0.05 |
0.05 |
0.05 |
|||||||||||
Common stock price, per share |
|||||||||||||||
High(4) |
$ |
10.74 |
$ |
10.30 |
$ |
10.29 |
$ |
10.01 |
|||||||
Low(4) |
8.80 |
9.29 |
8.89 |
8.72 |
|||||||||||
Close |
10.52 |
9.73 |
9.54 |
9.97 |
|||||||||||
Average closing price |
9.97 |
9.79 |
9.41 |
9.50 |
|||||||||||
Return on average total assets |
1.00 |
% |
0.97 |
% |
1.07 |
% |
1.01 |
% |
|||||||
Return on average common shareholders’ equity |
10.3 |
9.9 |
10.8 |
9.9 |
|||||||||||
Return on average tangible common shareholders’ equity(5) |
11.9 |
11.4 |
12.4 |
11.4 |
|||||||||||
Efficiency ratio(6) |
66.2 |
65.3 |
62.7 |
66.4 |
|||||||||||
Effective tax rate |
25.9 |
25.8 |
25.9 |
25.9 |
|||||||||||
Margin analysis-as a % of average earning assets(7) |
|||||||||||||||
Interest income(7) |
3.41 |
% |
3.44 |
% |
3.53 |
% |
3.53 |
% |
|||||||
Interest expense |
0.23 |
0.24 |
0.25 |
0.26 |
|||||||||||
Net interest margin(7) |
3.18 |
% |
3.20 |
% |
3.28 |
% |
3.27 |
% |
|||||||
Revenue—FTE |
|||||||||||||||
Net interest income |
$ |
473,252 |
$ |
466,335 |
$ |
460,048 |
$ |
437,506 |
|||||||
FTE adjustment |
7,522 |
7,506 |
6,637 |
5,885 |
|||||||||||
Net interest income(7) |
480,774 |
473,841 |
466,685 |
443,391 |
|||||||||||
Noninterest income |
233,278 |
247,349 |
250,067 |
248,485 |
|||||||||||
Total revenue(7) |
$ |
714,052 |
$ |
721,190 |
$ |
716,752 |
$ |
691,876 |
|||||||
88
Table 48 - Selected Quarterly Income Statement, Capital, and Other Data (1) | |||||||||||||||
2014 |
|||||||||||||||
Capital adequacy |
December 31, |
September 30, |
June 30, |
March 31, |
|||||||||||
Total risk-weighted assets (in millions)(11)
|
$ |
54,479 |
$ |
53,239 |
$ |
53,035 |
$ |
51,120 |
|||||||
Tier 1 leverage ratio(11) |
9.74 |
% |
9.83 |
% |
10.01 |
% |
10.32 |
% |
|||||||
Tier 1 risk-based capital ratio(11) |
11.50 |
11.61 |
11.56 |
11.95 |
|||||||||||
Total risk-based capital ratio(11) |
13.56 |
13.72 |
13.67 |
14.13 |
|||||||||||
Tier 1 common risk-based capital ratio(11) |
10.23 |
10.31 |
10.26 |
10.60 |
|||||||||||
Tangible common equity / tangible asset ratio(8) |
8.17 |
8.35 |
8.38 |
8.63 |
|||||||||||
Tangible equity / tangible asset ratio(9) |
8.76 |
8.95 |
8.99 |
9.26 |
|||||||||||
Tangible common equity / risk-weighted assets ratio(11) |
9.86 |
9.99 |
9.99 |
10.22 |
|||||||||||
(1) |
Comparisons for presented periods are impacted by a number of factors. Refer to the Significant Items section for additional discussion regarding these items. |
(2) |
For all quarterly periods presented above, the impact of the convertible preferred stock issued in April of 2008 was excluded from the diluted share calculation because the result would have been higher than basic earnings per common share (anti-dilutive) for the periods. |
(3) |
Deferred tax liability related to other intangible assets is calculated assuming a 35% tax rate. |
(4) |
High and low stock prices are intra-day quotes obtained from Bloomberg. |
(5) |
Net income applicable to common shares excluding expense for amortization of intangibles for the period divided by average tangible common shareholders’ equity. Average tangible common shareholders’ equity equals average total common shareholders’ equity less average intangible assets and goodwill. Expense for amortization of intangibles and average intangible assets are net of deferred tax liability, and calculated assuming a 35% tax rate. |
(6) |
Noninterest expense less amortization of intangibles and goodwill impairment divided by the sum of FTE net interest income and noninterest income excluding securities gains (losses). |
(7) |
Presented on a FTE basis assuming a 35% tax rate. |
(8) |
Tangible common equity (total common equity less goodwill and other intangible assets) divided by tangible assets (total assets less goodwill and other intangible assets). Other intangible assets are net of deferred tax, and calculated assuming a 35% tax rate. |
(9) |
Tangible equity (total equity less goodwill and other intangible assets) divided by tangible assets (total assets less goodwill and other intangible assets). Other intangible assets are net of deferred tax, and calculated assuming a 35% tax rate. |
(10) |
On January 1, 2015, we became subject to the Basel III capital requirements and the standardized approach for calculating risk-weighted assets in accordance with subpart D of the final capital rule. |
(11) |
Ratios are calculated on the Basel I basis. |
ADDITIONAL DISCLOSURES
Forward-Looking Statements
This report, including MD&A, contains certain forward-looking statements, including certain plans, expectations, goals, projections, and statements, which are subject to numerous assumptions, risks, and uncertainties. Statements that do not describe historical or current facts, including statements about beliefs and expectations, are forward-looking statements. Forward-looking statements may be identified by words such as expect, anticipate, believe, intend, estimate, plan, target, goal, or similar expressions, or future or conditional verbs such as will, may, might, should, would, could, or similar variations. The forward-looking statements are intended to be subject to the safe harbor provided by Section 27A of the Securities Act of 1933, Section 21E of the Securities Exchange Act of 1934, and the Private Securities Litigation Reform Act of 1995.
While there is no assurance that any list of risks and uncertainties or risk factors is complete, below are certain factors which could cause actual results to differ materially from those contained or implied in the forward-looking statements: (1) worsening of credit quality performance due to a number of factors such as the underlying value of collateral that could prove less valuable than otherwise assumed and assumed cash flows may be worse than expected, (2) changes in general economic, political, or industry conditions, uncertainty in U.S. fiscal and monetary policy, including the interest rate policies of the Federal Reserve Board, volatility and disruptions in global capital and credit markets, (3) movements in interest rates, (4) competitive pressures on product pricing and services, (5) success, impact, and timing of our business strategies, including market acceptance of any new products or services
89
implementing our “Fair Play” banking philosophy, (6) changes in accounting policies and principles and the accuracy of our assumptions and estimates used to prepare our financial statements, (7) extended disruption of vital infrastructure, (8) the final outcome of significant litigation or adverse legal developments in the proceedings, and (9) the nature, extent, timing, and results of governmental actions, examinations, reviews, reforms, regulations, and interpretations, including those related to the Dodd-Frank Wall Street Reform and Consumer Protection Act and the Basel III regulatory capital reforms, as well as those involving the OCC, Federal Reserve, FDIC, and CFPB.
All forward-looking statements speak only as of the date they are made and are based on information available at that time. We assume no obligation to update forward-looking statements to reflect circumstances or events that occur after the date the forward-looking statements were made or to reflect the occurrence of unanticipated events except as required by federal securities laws. As forward-looking statements involve significant risks and uncertainties, caution should be exercised against placing undue reliance on such statements.
Non-GAAP Financial Measures
This document contains GAAP financial measures and non-GAAP financial measures where management believes it to be helpful in understanding Huntington’s results of operations or financial position. Where non-GAAP financial measures are used, the comparable GAAP financial measure, as well as the reconciliation to the comparable GAAP financial measure, can be found herein.
Significant Items
From time-to-time, revenue, expenses, or taxes are impacted by items judged by us to be outside of ordinary banking activities and/or by items that, while they may be associated with ordinary banking activities, are so unusually large that their outsized impact is believed by us at that time to be infrequent or short-term in nature. We refer to such items as Significant Items. Most often, these Significant Items result from factors originating outside the Company; e.g., regulatory actions / assessments, windfall gains, changes in accounting principles, one-time tax assessments / refunds, litigation actions, etc. In other cases, they may result from our decisions associated with significant corporate actions outside of the ordinary course of business; e.g., merger / restructuring charges, recapitalization actions, goodwill impairment, etc.
Even though certain revenue and expense items are naturally subject to more volatility than others due to changes in market and economic environment conditions, as a general rule volatility alone does not define a Significant Item. For example, changes in the provision for credit losses, gains / losses from investment activities, asset valuation writedowns, etc., reflect ordinary banking activities and are, therefore, typically excluded from consideration as a Significant Item.
We believe the disclosure of Significant Items provides a better understanding of our performance and trends to ascertain which of such items, if any, to include or exclude from an analysis of our performance; i.e., within the context of determining how that performance differed from expectations, as well as how, if at all, to adjust estimates of future performance accordingly. To this end, we adopted a practice of listing Significant Items in our external disclosure documents; e.g., earnings press releases, investor presentations, Forms 10-Q and 10-K.
Significant Items for any particular period are not intended to be a complete list of items that may materially impact current or future period performance.
Fully-Taxable Equivalent Basis
Interest income, yields, and ratios on a FTE basis are considered non-GAAP financial measures. Management believes net interest income on a FTE basis provides a more accurate picture of the interest margin for comparison purposes. The FTE basis also allows management to assess the comparability of revenue arising from both taxable and tax-exempt sources. The FTE basis assumes a federal statutory tax rate of 35 percent. We encourage readers to consider the consolidated financial statements and other financial information contained in this Form 10-K in their entirety, and not to rely on any single financial measure.
Non-Regulatory Capital Ratios
In addition to capital ratios defined by banking regulators, the Company considers various other measures when evaluating capital utilization and adequacy, including:
• |
Tangible common equity to tangible assets, |
• |
Tier 1 common equity to risk-weighted assets using Basel I definitions, and |
• |
Tangible common equity to risk-weighted assets using Basel I and Basel III definitions. |
90
These non-regulatory capital ratios are viewed by management as useful additional methods of reflecting the level of capital available to withstand unexpected market conditions. Additionally, presentation of these ratios allows readers to compare the Company’s capitalization to other financial services companies. These ratios differ from capital ratios defined by banking regulators principally in that the numerator excludes preferred securities, the nature and extent of which varies among different financial services companies. These ratios are not defined in Generally Accepted Accounting Principles (“GAAP”) or federal banking regulations. As a result, these non-regulatory capital ratios disclosed by the Company are considered non-GAAP financial measures.
Because there are no standardized definitions for these non-regulatory capital ratios, the Company’s calculation methods may differ from those used by other financial services companies. Also, there may be limits in the usefulness of these measures to investors. As a result, the Company encourages readers to consider the consolidated financial statements and other financial information contained in this Form 10-K in their entirety, and not to rely on any single financial measure.
Risk Factors
More information on risk is set forth under the heading Risk Factors included in Item 1A and incorporated by reference into this MD&A. Additional information regarding risk factors can also be found in the Risk Management and Capital discussion, as well as the Regulatory Matters section included in Item 1 and incorporated by reference into the MD&A.
Critical Accounting Policies and Use of Significant Estimates
Our Consolidated Financial Statements are prepared in accordance with GAAP. The preparation of financial statements in conformity with GAAP requires us to establish accounting policies and make estimates that affect amounts reported in our Consolidated Financial Statements. Note 1 of the Notes to Consolidated Financial Statements, which is incorporated by reference into this MD&A, describes the significant accounting policies we use in our Consolidated Financial Statements.
An accounting estimate requires assumptions and judgments about uncertain matters that could have a material effect on the Consolidated Financial Statements. Estimates are made under facts and circumstances at a point in time, and changes in those facts and circumstances could produce results substantially different from those estimates. The most significant accounting policies and estimates and their related application are discussed below.
Allowance for Credit Losses
Our ACL of $0.7 billion at December 31, 2015, represents our estimate of probable credit losses inherent in our loan and lease portfolio and our unfunded loan commitments and letters of credit. We regularly review our ACL for appropriateness by performing on-going evaluations of the loan and lease portfolio. In doing so, we consider factors such as the differing economic risk associated with each loan category, the financial condition of specific borrowers, the level of delinquent loans, the value of any collateral and, where applicable, the existence of any guarantees or other documented support. We also evaluate the impact of changes in interest rates and overall economic conditions on the ability of borrowers to meet their financial obligations when quantifying our exposure to credit losses and assessing the appropriateness of our ACL at each reporting date. There is no certainty that our ACL will be appropriate over time to cover losses in the portfolio because of unanticipated adverse changes in the economy, market conditions, or events adversely affecting specific customers, industries, or markets. If the credit quality of our customer base materially deteriorates, the risk profile of a market, industry, or group of customers changes materially, or if the ACL is not appropriate, our net income and capital could be materially adversely affected which, in turn, could have a material adverse effect on our financial condition and results of operations.
Valuation of Financial Instruments
Assets and liabilities carried at fair value inherently result in a higher degree of financial statement volatility. Assets measured at fair value include certain loans held for sale, loans held for investment, available-for-sale and trading securities, certain securitized automobile loans, MSRs, derivatives, and certain short-term borrowings. At December 31, 2015, approximately $9.1 billion of our assets and $0.1 billion of our liabilities were recorded at fair value on a recurring basis. In addition to the above mentioned on-going fair value measurements, fair value is also used for recording business combinations and measuring other non-recurring financial assets and liabilities.
At the end of each quarter, we assess the valuation hierarchy for each asset or liability measured at fair value. As necessary, assets or liabilities may be transferred within fair value hierarchy levels due to changes in availability of observable market inputs to measure fair value at the measurement date.
Where available, we use quoted market prices to determine fair value. If quoted market prices are not available, fair value is determined, using either internally developed or independent third-party valuation models, based on inputs that are either directly observable or derived from market data. These inputs include, but are not limited to, interest rate yield curves, option volatilities, or option adjusted spreads. Where neither quoted market prices nor observable market data are available, fair value is determined using valuation models that feature one or more significant unobservable inputs based on management’s expectation that market participants
91
would use in determining the fair value of the asset or liability. The determination of appropriate unobservable inputs requires exercise of significant judgment. A significant portion of our assets and liabilities that are reported at fair value are measured based on quoted market prices or observable market/ independent inputs.
The following is a description of the significant estimates used in the valuation of financial assets and liabilities for which quoted market prices and observable market parameters are not available.
Municipal and asset-backed securities
The municipal securities portion that is classified as Level 3 uses significant estimates to determine the fair value of these securities which results in greater subjectivity. The fair value is determined by utilizing third-party valuation services. The third-party service provider reviews credit worthiness, prevailing market rates, analysis of similar securities, and projected cash flows. The third-party service provider also incorporates industry and general economic conditions into their analysis. Huntington evaluates the analysis provided for reasonableness.
Our private label CMO and CDO preferred securities portfolios are measured at fair value using a valuation methodology involving use of significant unobservable inputs and are thus, classified as Level 3 in the fair value hierarchy. The private label CMO securities portfolio is subjected to a monthly review of the projected cash flows, while the cash flows of our CDO preferred securities portfolio is reviewed quarterly. These reviews are supported with analysis from independent third parties, and are used as a basis for impairment analysis.
Alt-A mortgage-backed and private-label CMO securities are collateralized by first-lien residential mortgage loans. The securities valuation methodology incorporates values obtained from a third-party pricing specialist using a discounted cash flow approach and a proprietary pricing model and includes assumptions management believes market participants would use to value the securities under current market conditions. The model uses inputs such as estimated prepayment speeds, losses, recoveries, default rates that are implied by the underlying performance of collateral in the structure or similar structures, house price depreciation / appreciation rates that are based upon macroeconomic forecasts and discount rates that are implied by market prices for similar securities with similar collateral structures.
CDO preferred securities are CDOs backed by a pool of debt securities issued by financial institutions. The collateral generally consists of trust-preferred securities and subordinated debt securities issued by banks, bank holding companies, and insurance companies. A full cash flow analysis is used to estimate fair values and assess impairment for each security within this portfolio. We engage a third-party pricing specialist with direct industry experience in pooled-trust-preferred securities valuations to provide assistance in estimating the fair value and expected cash flows for each security in this portfolio. The PD of each issuer and the market discount rate are the most significant inputs in determining fair value. Management evaluates the PD assumptions provided by the third-party pricing specialist by comparing the current PD to the assumptions used the previous quarter, actual defaults and deferrals in the current period, and trend data on certain financial ratios of the issuers. Huntington also evaluates the assumptions related to discount rates. Relying on cash flows is necessary because there was a lack of observable transactions in the market and many of the original sponsors or dealers for these securities are no longer able to provide a fair value that is compliant with ASC 820.
Derivatives used for hedging purposes
Derivatives designated as qualified hedges are tested for hedge effectiveness on a quarterly basis. Assessments are made at the inception of the hedge and on a recurring basis to determine whether the derivative used in the hedging transaction has been and is expected to continue to be highly effective in offsetting changes in fair values or cash flows of the hedged item. A statistical regression analysis is performed to measure the effectiveness.
If, based on the assessment, a derivative is not expected to be a highly effective hedge or it has ceased to be a highly effective hedge, hedge accounting is discontinued as of the quarter the hedge is not highly effective. As the statistical regression analysis requires the use of estimates regarding the amount and timing of future cash flows which are sensitive to significant changes in future periods based on changes in market rates; we consider this a critical accounting estimate.
Loans held for sale
Huntington has elected to apply the fair value option to certain residential mortgage loans that are classified as held for sale at origination. The fair value of such loans is estimated based on the inputs that include prices of mortgage backed securities adjusted for other variables such as, interest rates, expected credit defaults and market discount rates. The adjusted value reflects the price we expect to receive from the sale of such loans.
Certain consumer and commercial loans are classified as held for sale and are accounted for at the lower of amortized cost or fair value. The determination of fair value for these consumer loans is based on observable prices for similar products or discounted expected cash flows, which takes into consideration factors such as future interest rates, prepayment speeds, default and loss curves, and market discount rates.
92
Mortgage Servicing Rights
Retained rights to service mortgage loans are recognized as a separate and distinct asset at the time the loans are sold. Mortgage servicing rights (“MSRs”) are initially recorded at fair value at the time the related loans are sold and subsequently re-measured at each reporting date under either the fair value or amortization method. The election of the fair value or amortization method is made at the time each servicing asset is established. All newly created MSRs since 2009 are recorded using the amortization method. Any increase or decrease in fair value of MSRs accounted for under the fair value method, as well as any amortization and/or impairment of MSRs recorded under the amortization method, is reflected in earnings in the period that the changes occur. MSRs are subject to interest rate risk in that their fair value will fluctuate as a result of changes in the interest rate environment. Fair value is determined based upon the application of an income approach valuation model. We use an independent third-party valuation model, which incorporates assumptions in estimating future cash flows. These assumptions include prepayment speeds, payoffs, and changes in valuation inputs and assumptions. The reasonableness of these pricing models is validated on a minimum of a quarterly basis by at least one independent external service broker valuation. Because the fair values of MSRs are significantly impacted by the use of estimates, the use of different assumptions can result in different estimated fair values of those MSRs.
Contingent Liabilities
We are a party to various claims, litigation, and legal proceedings resulting from ordinary business activities relating to our current and/or former operations. We estimate and provide for potential losses that may arise out of litigation and regulatory proceedings to the extent that such losses are probable and can be reasonably estimated. Significant judgment is required in making these estimates and our final liabilities may ultimately be more or less than the current estimate. Our total estimated liability in respect of litigation and regulatory proceedings is determined on a case-by-case basis and represents an estimate of probable losses after considering, among other factors, the progress of each case or proceeding, our experience and the experience of others in similar cases or proceedings, and the opinions and views of legal counsel. Litigation exposure represents a key area of judgment and is subject to uncertainty and certain factors outside of our control.
Income Taxes
The calculation of our provision for income taxes is complex and requires the use of estimates and judgments. We have two accruals for income taxes: (1) our income tax payable represents the estimated net amount currently due to the federal, state, and local taxing jurisdictions, net of any reserve for potential audit issues and any tax refunds and the net receivable balance is reported as a component of accrued income and other assets in our consolidated balance sheet; (2) our deferred federal and state income tax and related valuation accounts, reported as a component of accrued income and other assets, represents the estimated impact of temporary differences between how we recognize our assets and liabilities under GAAP, and how such assets and liabilities are recognized under federal and state tax law.
In the ordinary course of business, we operate in various taxing jurisdictions and are subject to income and non-income taxes. The effective tax rate is based in part on our interpretation of the relevant current tax laws. We believe the aggregate liabilities related to taxes are appropriately reflected in the consolidated financial statements. We review the appropriate tax treatment of all transactions taking into consideration statutory, judicial, and regulatory guidance in the context of our tax positions. In addition, we rely on various tax opinions, recent tax audits, and historical experience.
From time-to-time, we engage in business transactions that may affect our tax liabilities. Where appropriate, we obtain opinions of outside experts and assess the relative merits and risks of the appropriate tax treatment of business transactions taking into account statutory, judicial, and regulatory guidance in the context of the tax position. However, changes to our estimates of accrued taxes can occur due to changes in tax rates, implementation of new business strategies, resolution of issues with taxing authorities regarding previously taken tax positions, and newly enacted statutory, judicial, and regulatory guidance. Such changes could affect the amount of our accrued taxes and could be material to our financial position and/or results of operations. (See Note 16 of the Notes to Consolidated Financial Statements.)
Deferred Tax Assets
At December 31, 2015, we had a net federal deferred tax asset of $7 million and a net state deferred tax asset of $43 million. A valuation allowance is provided when it is more-likely-than-not some portion of the deferred tax asset will not be realized. All available evidence, both positive and negative, was considered to determine whether, based on the weight of that evidence, impairment should be recognized. Our forecast process includes judgmental and quantitative elements that may be subject to significant change. If our forecast of taxable income within the carryforward periods available under applicable law is not sufficient to cover the amount of net deferred tax assets, such assets may be impaired. Based on our analysis of both positive and negative evidence and our ability to offset the net deferred tax assets against our forecasted future taxable income, there was no impairment of the net deferred tax assets at December 31, 2015, other than a valuation allowance relating to state net operating loss carryovers.
Recent Accounting Pronouncements and Developments
93
Note 2 to Consolidated Financial Statements discusses new accounting pronouncements adopted during 2015 and the expected impact of accounting pronouncements recently issued but not yet required to be adopted. To the extent the adoption of new accounting standards materially affect financial condition, results of operations, or liquidity, the impacts are discussed in the applicable section of this MD&A and the Notes to Consolidated Financial Statements.
Item 7A: Quantitative and Qualitative Disclosures About Market Risk
Information required by this item is set forth under the heading of “Market Risk” in Item 7 (MD&A), which is incorporated by reference into this item.
Item 8: Financial Statements and Supplementary Data
Information required by this item is set forth in the Reports of Independent Registered Public Accounting Firm, Consolidated Financial Statements and Notes, and Selected Quarterly Income Statements, which is incorporated by reference into this item.
94
REPORT OF MANAGEMENT'S EVALUATION OF DISCLOSURE CONTROLS AND PROCEDURES
The Management of Huntington Bancshares Incorporated (Huntington or the Company) is responsible for the financial information and representations contained in the Consolidated Financial Statements and other sections of this report. The Consolidated Financial Statements have been prepared in conformity with accounting principles generally accepted in the United States. In all material respects, they reflect the substance of transactions that should be included based on informed judgments, estimates, and currently available information. Management maintains a system of internal accounting controls, which includes the careful selection and training of qualified personnel, appropriate segregation of responsibilities, communication of written policies and procedures, and a broad program of internal audits. The costs of the controls are balanced against the expected benefits. During 2015, the audit committee of the board of directors met regularly with Management, Huntington’s internal auditors, and the independent registered public accounting firm, PricewaterhouseCoopers LLP, to review the scope of the audits and to discuss the evaluation of internal accounting controls and financial reporting matters. The independent registered public accounting firm and the internal auditors have free access to, and meet confidentially with, the audit committee to discuss appropriate matters. Also, Huntington maintains a disclosure review committee. This committee’s purpose is to design and maintain disclosure controls and procedures to ensure that material information relating to the financial and operating condition of Huntington is properly reported to its chief executive officer, chief financial officer, internal auditors, and the audit committee of the board of directors in connection with the preparation and filing of periodic reports and the certification of those reports by the chief executive officer and the chief financial officer.
REPORT OF MANAGEMENT’S ASSESSMENT OF INTERNAL CONTROL OVER FINANCIAL REPORTING
Management is responsible for establishing and maintaining adequate internal control over financial reporting as such term is defined in Rules 13a-15(f) and 15d-15(f) of the Securities Exchange Act of 1934, as amended. Huntington’s Management assessed the effectiveness of the Company’s internal control over financial reporting as of December 31, 2015. In making this assessment, Management used the criteria set forth by the Committee of Sponsoring Organizations of the Treadway Commission (COSO) in Internal Control—Integrated Framework (2013). Based on that assessment, Management concluded that, as of December 31, 2015, the Company’s internal control over financial reporting is effective based on those criteria. The Company’s internal control over financial reporting as of December 31, 2015 has been audited by PricewaterhouseCoopers LLP, an independent registered public accounting firm, as stated in their report appearing on the next page.

Stephen D. Steinour – Chairman, President, and Chief Executive Officer

Howell D. McCullough III – Senior Executive Vice President and Chief Financial Officer
February 17, 2016
95
Report of Independent Registered Public Accounting Firm
To the Board of Directors and Shareholders of
Huntington Bancshares Incorporated
In our opinion, the accompanying consolidated balance sheet as of December 31, 2015 and the related consolidated statements of income, comprehensive income, changes in shareholders’ equity and cash flows for the year then ended present fairly, in all material respects, the financial position of Huntington Bancshares Incorporated and its subsidiaries at December 31, 2015, and the results of their operations and their cash flows for the year ended December 31, 2015 in conformity with accounting principles generally accepted in the United States of America. Also in our opinion, the Company maintained, in all material respects, effective internal control over financial reporting as of December 31, 2015, based on criteria established in Internal Control - Integrated Framework (2013) issued by the Committee of Sponsoring Organizations of the Treadway Commission (COSO). The Company's management is responsible for these financial statements, for maintaining effective internal control over financial reporting and for its assessment of the effectiveness of internal control over financial reporting, included in the accompanying Report of Management’s Assessment of Internal Control over Financial Reporting. Our responsibility is to express opinions on these financial statements and on the Company's internal control over financial reporting based on our integrated audit. We conducted our audit in accordance with the standards of the Public Company Accounting Oversight Board (United States). Those standards require that we plan and perform the audit to obtain reasonable assurance about whether the financial statements are free of material misstatement and whether effective internal control over financial reporting was maintained in all material respects. Our audit of the financial statements included examining, on a test basis, evidence supporting the amounts and disclosures in the financial statements, assessing the accounting principles used and significant estimates made by management, and evaluating the overall financial statement presentation. Our audit of internal control over financial reporting included obtaining an understanding of internal control over financial reporting, assessing the risk that a material weakness exists, and testing and evaluating the design and operating effectiveness of internal control based on the assessed risk. Our audit also included performing such other procedures as we considered necessary in the circumstances. We believe that our audit provides a reasonable basis for our opinions.
A company’s internal control over financial reporting is a process designed to provide reasonable assurance regarding the reliability of financial reporting and the preparation of financial statements for external purposes in accordance with generally accepted accounting principles. A company’s internal control over financial reporting includes those policies and procedures that (i) pertain to the maintenance of records that, in reasonable detail, accurately and fairly reflect the transactions and dispositions of the assets of the company; (ii) provide reasonable assurance that transactions are recorded as necessary to permit preparation of financial statements in accordance with generally accepted accounting principles, and that receipts and expenditures of the company are being made only in accordance with authorizations of management and directors of the company; and (iii) provide reasonable assurance regarding prevention or timely detection of unauthorized acquisition, use, or disposition of the company’s assets that could have a material effect on the financial statements.
Because of its inherent limitations, internal control over financial reporting may not prevent or detect misstatements. Also, projections of any evaluation of effectiveness to future periods are subject to the risk that controls may become inadequate because of changes in conditions, or that the degree of compliance with the policies or procedures may deteriorate.

Columbus, Ohio
February 17, 2016
96
REPORT OF INDEPENDENT REGISTERED PUBLIC ACCOUNTING FIRM
To the Board of Directors and Shareholders of
Huntington Bancshares Incorporated
Columbus, Ohio
We have audited the accompanying consolidated balance sheet of Huntington Bancshares Incorporated and subsidiaries (the “Company”) as of December 31, 2014, and the related consolidated statements of income, comprehensive income, changes in shareholders’ equity, and cash flows for each of the two years in the period ended December 31, 2014. These financial statements are the responsibility of the Company’s management. Our responsibility is to express an opinion on these financial statements based on our audits.
We conducted our audits in accordance with the standards of the Public Company Accounting Oversight Board (United States). Those standards require that we plan and perform the audit to obtain reasonable assurance about whether the financial statements are free of material misstatement. An audit includes examining, on a test basis, evidence supporting the amounts and disclosures in the financial statements. An audit also includes assessing the accounting principles used and significant estimates made by management, as well as evaluating the overall financial statement presentation. We believe that our audits provide a reasonable basis for our opinion.
In our opinion, such consolidated financial statements present fairly, in all material respects, the financial position of Huntington Bancshares Incorporated and subsidiaries as of December 31, 2014, and the results of their operations and their cash flows for each of the two years in the period ended December 31, 2014, in conformity with accounting principles generally accepted in the United States of America.

Columbus, Ohio
February 13, 2015
97
Huntington Bancshares Incorporated
Consolidated Balance Sheets
December 31, |
|||||||
(dollar amounts in thousands, except number of shares) |
2015 |
2014 |
|||||
Assets |
|||||||
Cash and due from banks |
$ |
847,156 |
$ |
1,220,565 |
|||
Interest-bearing deposits in banks |
51,838 |
64,559 |
|||||
Trading account securities |
36,997 |
42,191 |
|||||
Loans held for sale |
474,621 |
416,327 |
|||||
(includes $337,577 and $354,888 respectively, measured at fair value)(1) |
|||||||
Available-for-sale and other securities |
8,775,441 |
9,384,670 |
|||||
Held-to-maturity securities |
6,159,590 |
3,379,905 |
|||||
Loans and leases (includes $34,637 and $50,617 respectively, measured at fair value)(1) |
|||||||
Commercial and industrial loans and leases |
20,559,834 |
19,033,146 |
|||||
Commercial real estate loans |
5,268,651 |
5,197,403 |
|||||
Automobile loans |
9,480,678 |
8,689,902 |
|||||
Home equity loans |
8,470,482 |
8,490,915 |
|||||
Residential mortgage loans |
5,998,400 |
5,830,609 |
|||||
Other consumer loans |
563,054 |
413,751 |
|||||
Loans and leases |
50,341,099 |
47,655,726 |
|||||
Allowance for loan and lease losses |
(597,843 |
) |
(605,196 |
) |
|||
Net loans and leases |
49,743,256 |
47,050,530 |
|||||
Bank owned life insurance |
1,757,668 |
1,718,436 |
|||||
Premises and equipment |
620,540 |
616,407 |
|||||
Goodwill |
676,869 |
522,541 |
|||||
Other intangible assets |
54,978 |
74,671 |
|||||
Accrued income and other assets |
1,845,597 |
1,807,208 |
|||||
Total assets |
$ |
71,044,551 |
$ |
66,298,010 |
|||
Liabilities and shareholders’ equity |
|||||||
Liabilities |
|||||||
Deposits in domestic offices |
|||||||
Demand deposits—noninterest-bearing |
$ |
16,479,984 |
$ |
15,393,226 |
|||
Interest-bearing |
38,547,587 |
35,937,873 |
|||||
Deposits in foreign offices |
267,408 |
401,052 |
|||||
Deposits |
55,294,979 |
51,732,151 |
|||||
Short-term borrowings |
615,279 |
2,397,101 |
|||||
Long-term debt |
7,067,614 |
4,335,962 |
|||||
Accrued expenses and other liabilities |
1,472,073 |
1,504,626 |
|||||
Total liabilities |
64,449,945 |
59,969,840 |
|||||
Commitments and contingencies (Note 20) |
|||||||
Shareholders’ equity |
|||||||
Preferred stock—authorized 6,617,808 shares; |
|||||||
Series A, 8.50% fixed rate, non-cumulative perpetual convertible preferred stock, par value of $0.01, and liquidation value per share of $1,000 |
362,506 |
362,507 |
|||||
Series B, floating rate, non-voting, non-cumulative perpetual preferred stock, par value of $0.01, and liquidation value per share of $1,000 |
23,785 |
23,785 |
|||||
Common stock |
7,970 |
8,131 |
|||||
Capital surplus |
7,038,502 |
7,221,745 |
|||||
Less treasury shares, at cost |
(17,932 |
) |
(13,382 |
) |
|||
Accumulated other comprehensive loss |
(226,158 |
) |
(222,292 |
) |
|||
Retained (deficit) earnings |
(594,067 |
) |
(1,052,324 |
) |
|||
Total shareholders’ equity |
6,594,606 |
6,328,170 |
|||||
Total liabilities and shareholders’ equity |
$ |
71,044,551 |
$ |
66,298,010 |
|||
Common shares authorized (par value of $0.01) |
1,500,000,000 |
1,500,000,000 |
|||||
Common shares issued |
796,969,694 |
813,136,321 |
|||||
Common shares outstanding |
794,928,886 |
811,454,676 |
|||||
Treasury shares outstanding |
2,040,808 |
1,681,645 |
|||||
Preferred shares issued |
1,967,071 |
1,967,071 |
|||||
Preferred shares outstanding |
398,006 |
398,007 |
|||||
(1) |
Amounts represent loans for which Huntington has elected the fair value option. See Note 17. |
See Notes to Consolidated Financial Statements
98
Huntington Bancshares Incorporated
Consolidated Statements of Income
Year Ended December 31, |
|||||||||||
(dollar amounts in thousands, except per share amounts) |
2015 |
2014 |
2013 |
||||||||
Interest and fee income: |
|||||||||||
Loans and leases |
$ |
1,759,525 |
$ |
1,674,563 |
$ |
1,629,939 |
|||||
Available-for-sale and other securities |
|||||||||||
Taxable |
202,104 |
171,080 |
148,557 |
||||||||
Tax-exempt |
42,014 |
28,965 |
12,678 |
||||||||
Held-to-maturity securities |
86,614 |
88,724 |
50,214 |
||||||||
Other |
24,264 |
13,130 |
19,249 |
||||||||
Total interest income |
2,114,521 |
1,976,462 |
1,860,637 |
||||||||
Interest expense |
|||||||||||
Deposits |
82,175 |
86,453 |
116,241 |
||||||||
Short-term borrowings |
1,584 |
2,940 |
700 |
||||||||
Federal Home Loan Bank advances |
586 |
1,011 |
1,077 |
||||||||
Subordinated notes and other long-term debt |
79,439 |
48,917 |
38,011 |
||||||||
Total interest expense |
163,784 |
139,321 |
156,029 |
||||||||
Net interest income |
1,950,737 |
1,837,141 |
1,704,608 |
||||||||
Provision for credit losses |
99,954 |
80,989 |
90,045 |
||||||||
Net interest income after provision for credit losses |
1,850,783 |
1,756,152 |
1,614,563 |
||||||||
Service charges on deposit accounts |
280,349 |
273,741 |
271,802 |
||||||||
Cards and payment processing income |
142,715 |
105,401 |
92,591 |
||||||||
Mortgage banking income |
111,853 |
84,887 |
126,855 |
||||||||
Trust services |
105,833 |
115,972 |
123,007 |
||||||||
Insurance income |
65,264 |
65,473 |
69,264 |
||||||||
Brokerage income |
60,205 |
68,277 |
69,624 |
||||||||
Capital markets fees |
53,616 |
43,731 |
45,220 |
||||||||
Bank owned life insurance income |
52,400 |
57,048 |
56,419 |
||||||||
Gain on sale of loans |
33,037 |
21,091 |
18,171 |
||||||||
Net gains on sales of securities |
3,184 |
17,554 |
2,220 |
||||||||
Impairment losses recognized in earnings on available-for-sale securities (a) |
(2,440 |
) |
— |
(1,802 |
) |
||||||
Other income |
132,714 |
126,004 |
138,825 |
||||||||
Total noninterest income |
1,038,730 |
979,179 |
1,012,196 |
||||||||
Personnel costs |
1,122,182 |
1,048,775 |
1,001,637 |
||||||||
Outside data processing and other services |
231,353 |
212,586 |
199,547 |
||||||||
Equipment |
124,957 |
119,663 |
106,793 |
||||||||
Net occupancy |
121,881 |
128,076 |
125,344 |
||||||||
Marketing |
52,213 |
50,560 |
51,185 |
||||||||
Professional services |
50,291 |
59,555 |
40,587 |
||||||||
Deposit and other insurance expense |
44,609 |
49,044 |
50,161 |
||||||||
Amortization of intangibles |
27,867 |
39,277 |
41,364 |
||||||||
Other expense |
200,555 |
174,810 |
141,385 |
||||||||
Total noninterest expense |
1,975,908 |
1,882,346 |
1,758,003 |
||||||||
Income before income taxes |
913,605 |
852,985 |
868,756 |
||||||||
Provision for income taxes |
220,648 |
220,593 |
227,474 |
||||||||
Net income |
692,957 |
632,392 |
641,282 |
||||||||
Dividends on preferred shares |
31,873 |
31,854 |
31,869 |
||||||||
Net income applicable to common shares |
$ |
661,084 |
$ |
600,538 |
$ |
609,413 |
|||||
99
Average common shares—basic |
803,412 |
819,917 |
834,205 |
||||||||
Average common shares—diluted |
817,129 |
833,081 |
843,974 |
||||||||
Per common share: |
|||||||||||
Net income—basic |
$ |
0.82 |
$ |
0.73 |
$ |
0.73 |
|||||
Net income—diluted |
0.81 |
0.72 |
0.72 |
||||||||
Cash dividends declared |
0.25 |
0.21 |
0.19 |
||||||||
(a) |
The following OTTI losses are included in securities losses for the periods presented: |
Total OTTI losses |
$ |
(3,144 |
) |
$ |
— |
$ |
(1,870 |
) |
|||
Noncredit-related portion of loss recognized in OCI |
704 |
— |
68 |
||||||||
Net impairment credit losses recognized in earnings |
$ |
(2,440 |
) |
$ |
— |
$ |
(1,802 |
) |
|||
See Notes to Consolidated Financial Statements
100
Huntington Bancshares Incorporated
Consolidated Statements of Comprehensive Income
Year Ended December 31, |
|||||||||||
(dollar amounts in thousands) |
2015 |
2014 |
2013 |
||||||||
Net income |
$ |
692,957 |
$ |
632,392 |
$ |
641,282 |
|||||
Other comprehensive income, net of tax: |
|||||||||||
Unrealized gains on available-for-sale and other securities: |
|||||||||||
Non-credit-related impairment recoveries (losses) on debt securities not expected to be sold |
12,673 |
8,780 |
153 |
||||||||
Unrealized net gains (losses) on available-for-sale and other securities arising during the period, net of reclassification for net realized gains and losses |
(19,757 |
) |
45,783 |
(77,593 |
) |
||||||
Total unrealized gains (losses) on available-for-sale securities |
(7,084 |
) |
54,563 |
(77,440 |
) |
||||||
Unrealized gains (losses) on cash flow hedging derivatives, net of reclassifications to income |
8,285 |
6,611 |
(65,928 |
) |
|||||||
Change in accumulated unrealized losses for pension and other post-retirement obligations |
(5,067 |
) |
(69,457 |
) |
80,176 |
||||||
Other comprehensive income (loss), net of tax |
(3,866 |
) |
(8,283 |
) |
(63,192 |
) |
|||||
Comprehensive income |
$ |
689,091 |
$ |
624,109 |
$ |
578,090 |
|||||
See Notes to Consolidated Financial Statements
101
Huntington Bancshares Incorporated
Consolidated Statements of Changes in Shareholders’ Equity
Accumulated |
|||||||||||||||||||||||||||||||||||||||||||
Preferred Stock |
Other |
Retained |
|||||||||||||||||||||||||||||||||||||||||
|
(all amounts in thousands,
except for per share amounts)
|
Series A |
Series B |
Common Stock |
Capital |
Treasury Stock |
Comprehensive |
Earnings |
||||||||||||||||||||||||||||||||||||
Shares |
Amount |
Shares |
Amount |
Shares |
Amount |
Surplus |
Shares |
Amount |
Loss |
(Deficit) |
Total |
||||||||||||||||||||||||||||||||
Year Ended December 31, 2015 |
|||||||||||||||||||||||||||||||||||||||||||
Balance, beginning of year |
363 |
$ |
362,507 |
35 |
$ |
23,785 |
813,136 |
$ |
8,131 |
$ |
7,221,745 |
(1,682 |
) |
$ |
(13,382 |
) |
$ |
(222,292 |
) |
$ |
(1,052,324 |
) |
$ |
6,328,170 |
|||||||||||||||||||
Net income |
692,957 |
692,957 |
|||||||||||||||||||||||||||||||||||||||||
Other comprehensive income (loss) |
(3,866 |
) |
(3,866 |
) |
|||||||||||||||||||||||||||||||||||||||
Repurchases of common stock |
(23,036 |
) |
(230 |
) |
(251,614 |
) |
(251,844 |
) |
|||||||||||||||||||||||||||||||||||
Cash dividends declared: |
|||||||||||||||||||||||||||||||||||||||||||
Common ($0.25 per share) |
(200,197 |
) |
(200,197 |
) |
|||||||||||||||||||||||||||||||||||||||
Preferred Series A ($85.00 per share) |
(30,813 |
) |
(30,813 |
) |
|||||||||||||||||||||||||||||||||||||||
Preferred Series B ($29.84 per share) |
(1,059 |
) |
(1,059 |
) |
|||||||||||||||||||||||||||||||||||||||
Preferred share conversion |
(1 |
) |
1 |
— |
|||||||||||||||||||||||||||||||||||||||
Recognition of the fair value of share-based compensation |
51,415 |
51,415 |
|||||||||||||||||||||||||||||||||||||||||
Other share-based compensation activity |
6,784 |
68 |
16,068 |
(2,644 |
) |
13,492 |
|||||||||||||||||||||||||||||||||||||
Other |
86 |
1 |
887 |
(359 |
) |
(4,550 |
) |
13 |
(3,649 |
) |
|||||||||||||||||||||||||||||||||
Balance, end of year |
363 |
$ |
362,506 |
35 |
$ |
23,785 |
796,970 |
$ |
7,970 |
$ |
7,038,502 |
(2,041 |
) |
$ |
(17,932 |
) |
$ |
(226,158 |
) |
$ |
(594,067 |
) |
$ |
6,594,606 |
|||||||||||||||||||
See Notes to Consolidated Financial Statements
102
Huntington Bancshares Incorporated
Consolidated Statements of Changes in Shareholders’ Equity
Accumulated |
|||||||||||||||||||||||||||||||||||||||||||
Preferred Stock |
Other |
Retained |
|||||||||||||||||||||||||||||||||||||||||
(all amounts in thousands, except for per share amounts)
|
Series A |
Series B |
Common Stock |
Capital |
Treasury Stock |
Comprehensive |
Earnings |
||||||||||||||||||||||||||||||||||||
Shares |
Amount |
Shares |
Amount |
Shares |
Amount |
Surplus |
Shares |
Amount |
Loss |
(Deficit) |
Total |
||||||||||||||||||||||||||||||||
Year Ended December 31, 2014 |
|||||||||||||||||||||||||||||||||||||||||||
Balance, beginning of year |
363 |
$ |
362,507 |
35 |
$ |
23,785 |
832,217 |
$ |
8,322 |
$ |
7,398,515 |
(1,331 |
) |
$ |
(9,643 |
) |
$ |
(214,009 |
) |
$ |
(1,479,324 |
) |
$ |
6,090,153 |
|||||||||||||||||||
Net income |
632,392 |
632,392 |
|||||||||||||||||||||||||||||||||||||||||
Other comprehensive income (loss) |
(8,283 |
) |
(8,283 |
) |
|||||||||||||||||||||||||||||||||||||||
Repurchase of common stock |
(35,709 |
) |
(357 |
) |
(334,072 |
) |
(334,429 |
) |
|||||||||||||||||||||||||||||||||||
Cash dividends declared: |
|||||||||||||||||||||||||||||||||||||||||||
Common ($0.21 per share) |
(171,692 |
) |
(171,692 |
) |
|||||||||||||||||||||||||||||||||||||||
Preferred Series A ($85.00 per share) |
(30,813 |
) |
(30,813 |
) |
|||||||||||||||||||||||||||||||||||||||
Preferred Series B ($29.33 per share) |
(1,041 |
) |
(1,041 |
) |
|||||||||||||||||||||||||||||||||||||||
Shares issued pursuant to acquisition |
8,694 |
87 |
91,577 |
91,664 |
|||||||||||||||||||||||||||||||||||||||
Shares sold to HIP |
276 |
3 |
2,594 |
2,597 |
|||||||||||||||||||||||||||||||||||||||
Recognition of the fair value of share-based compensation |
43,666 |
43,666 |
|||||||||||||||||||||||||||||||||||||||||
Other share-based compensation activity |
6,752 |
68 |
17,219 |
(1,774 |
) |
15,513 |
|||||||||||||||||||||||||||||||||||||
Other |
906 |
8 |
2,246 |
(351 |
) |
(3,739 |
) |
(72 |
) |
(1,557 |
) |
||||||||||||||||||||||||||||||||
Balance, end of year |
363 |
$ |
362,507 |
35 |
$ |
23,785 |
813,136 |
$ |
8,131 |
$ |
7,221,745 |
(1,682 |
) |
$ |
(13,382 |
) |
$ |
(222,292 |
) |
$ |
(1,052,324 |
) |
$ |
6,328,170 |
|||||||||||||||||||
See Notes to Consolidated Financial Statements
103
Huntington Bancshares Incorporated
Consolidated Statements of Changes in Shareholders’ Equity
Accumulated |
|||||||||||||||||||||||||||||||||||||||||||
Preferred Stock |
Other |
Retained |
|||||||||||||||||||||||||||||||||||||||||
|
(all amounts in thousands,
except for per share amounts)
|
Series A |
Series B |
Common Stock |
Capital |
Treasury Stock |
Comprehensive |
Earnings |
||||||||||||||||||||||||||||||||||||
Shares |
Amount |
Shares |
Amount |
Shares |
Amount |
Surplus |
Shares |
Amount |
Loss |
(Deficit) |
Total |
||||||||||||||||||||||||||||||||
Year Ended December 31, 2013 |
|||||||||||||||||||||||||||||||||||||||||||
Balance, beginning of year |
363 |
$ |
362,507 |
35 |
$ |
23,785 |
844,105 |
$ |
8,441 |
$ |
7,475,149 |
(1,292 |
) |
$ |
(10,921 |
) |
$ |
(150,817 |
) |
$ |
(1,929,644 |
) |
$ |
5,778,500 |
|||||||||||||||||||
Net income |
641,282 |
641,282 |
|||||||||||||||||||||||||||||||||||||||||
Other comprehensive income (loss) |
(63,192 |
) |
(63,192 |
) |
|||||||||||||||||||||||||||||||||||||||
Repurchase of common stock |
(16,708 |
) |
(167 |
) |
(124,828 |
) |
(124,995 |
) |
|||||||||||||||||||||||||||||||||||
Cash dividends declared: |
|||||||||||||||||||||||||||||||||||||||||||
Common ($0.19 per share) |
(158,194 |
) |
(158,194 |
) |
|||||||||||||||||||||||||||||||||||||||
Preferred Series A ($85.00 per share) |
(30,813 |
) |
(30,813 |
) |
|||||||||||||||||||||||||||||||||||||||
Preferred Series B ($33.14 per share) |
(1,055 |
) |
(1,055 |
) |
|||||||||||||||||||||||||||||||||||||||
Recognition of the fair value of share-based compensation |
37,007 |
37,007 |
|||||||||||||||||||||||||||||||||||||||||
Other share-based compensation activity |
4,820 |
48 |
12,812 |
(873 |
) |
11,987 |
|||||||||||||||||||||||||||||||||||||
Other |
(1,625 |
) |
(39 |
) |
1,278 |
(27 |
) |
(374 |
) |
||||||||||||||||||||||||||||||||||
Balance, end of year |
363 |
$ |
362,507 |
35 |
$ |
23,785 |
832,217 |
$ |
8,322 |
$ |
7,398,515 |
(1,331 |
) |
$ |
(9,643 |
) |
$ |
(214,009 |
) |
$ |
(1,479,324 |
) |
$ |
6,090,153 |
|||||||||||||||||||
See Notes to Consolidated Financial Statements
104
Huntington Bancshares Incorporated
Consolidated Statements of Cash Flows
Year Ended December 31, |
|||||||||||
(dollar amounts in thousands) |
2015 |
2014 |
2013 |
||||||||
Operating activities |
|||||||||||
Net income |
$ |
692,957 |
$ |
632,392 |
$ |
641,282 |
|||||
Adjustments to reconcile net income to net cash provided by (used for) operating activities: |
|||||||||||
Impairment of goodwill |
— |
3,000 |
— |
||||||||
Provision for credit losses |
99,954 |
80,989 |
90,045 |
||||||||
Depreciation and amortization |
341,281 |
332,832 |
281,545 |
||||||||
Share-based compensation expense |
51,415 |
43,666 |
37,007 |
||||||||
Net gains on sales of securities |
(3,184 |
) |
(17,554 |
) |
(2,220 |
) |
|||||
Impairment losses recognized in earnings on available-for-sale securities |
2,440 |
— |
1,802 |
||||||||
Net Change in: |
|||||||||||
Trading account securities |
5,194 |
(6,618 |
) |
55,632 |
|||||||
Loans held for sale |
53,765 |
(58,803 |
) |
127,368 |
|||||||
Accrued income and other assets |
(233,624 |
) |
(438,366 |
) |
10,500 |
||||||
Change in deferred income taxes |
68,776 |
35,174 |
106,022 |
||||||||
Accrued expense and other liabilities |
(34,846 |
) |
282,074 |
(335,738 |
) |
||||||
Other, net |
(10,766 |
) |
— |
— |
|||||||
Net cash provided by (used for) operating activities |
1,033,362 |
888,786 |
1,013,245 |
||||||||
Investing activities |
|||||||||||
Decrease (increase) in interest-bearing deposits in banks |
12,721 |
(7,516 |
) |
146,584 |
|||||||
Net cash (paid) received in acquisitions |
(457,836 |
) |
691,637 |
— |
|||||||
Proceeds from: |
|||||||||||
Maturities and calls of available-for-sale securities |
1,907,669 |
1,480,505 |
1,414,114 |
||||||||
Maturities of held-to-maturity securities |
594,905 |
452,785 |
278,136 |
||||||||
Sales of available-for-sale securities |
163,224 |
1,152,907 |
410,106 |
||||||||
Purchases of available-for-sale securities |
(4,506,764 |
) |
(4,553,857 |
) |
(1,416,795 |
) |
|||||
Purchases of held-to-maturity securities |
(379,351 |
) |
— |
(2,081,373 |
) |
||||||
Net proceeds from sales of loans |
1,304,309 |
353,811 |
459,006 |
||||||||
Net loan and lease activity, excluding sales |
(3,186,775 |
) |
(4,232,350 |
) |
(3,386,753 |
) |
|||||
Proceeds from sale of operating lease assets |
2,227 |
17,591 |
10,227 |
||||||||
Purchases of premises and equipment |
(93,097 |
) |
(58,862 |
) |
(102,208 |
) |
|||||
Proceeds from sales of other real estate |
36,038 |
38,479 |
40,448 |
||||||||
Purchases of loans and leases |
(333,726 |
) |
(345,039 |
) |
(16,170 |
) |
|||||
Purchases of customer lists |
— |
(946 |
) |
— |
|||||||
Other, net |
7,802 |
6,074 |
4,345 |
||||||||
Net cash provided by (used for) investing activities |
(4,928,654 |
) |
(5,004,781 |
) |
(4,240,333 |
) |
|||||
Financing activities |
|||||||||||
Increase (decrease) in deposits |
3,644,492 |
2,923,928 |
1,258,038 |
||||||||
Increase (decrease) in short-term borrowings |
(1,818,947 |
) |
118,698 |
854,558 |
|||||||
Sale of deposits |
(47,521 |
) |
— |
— |
|||||||
Proceeds from issuance of long-term debt |
3,232,227 |
2,000,000 |
1,250,000 |
||||||||
Maturity/redemption of long-term debt |
(1,036,717 |
) |
(198,922 |
) |
(102,086 |
) |
|||||
Dividends paid on preferred stock |
(31,872 |
) |
(31,854 |
) |
(31,869 |
) |
|||||
Dividends paid on common stock |
(192,518 |
) |
(166,935 |
) |
(150,608 |
) |
|||||
Repurchase of common stock |
(251,844 |
) |
(334,429 |
) |
(124,995 |
) |
|||||
Proceeds from stock options exercised |
19,000 |
17,710 |
12,601 |
||||||||
Net proceeds from issuance of common stock |
— |
2,597 |
— |
||||||||
Other, net |
5,583 |
4,635 |
(225 |
) |
|||||||
Net cash provided by (used for) financing activities |
3,521,883 |
4,335,428 |
2,965,414 |
||||||||
Increase (decrease) in cash and cash equivalents |
(373,409 |
) |
219,433 |
(261,674 |
) |
||||||
Cash and cash equivalents at beginning of period |
1,220,565 |
1,001,132 |
1,262,806 |
||||||||
Cash and cash equivalents at end of period |
$ |
847,156 |
$ |
1,220,565 |
$ |
1,001,132 |
|||||
Supplemental disclosures: |
|||||||||||
Interest paid |
$ |
150,403 |
$ |
131,488 |
$ |
155,832 |
|||||
Income taxes paid (refunded) |
153,590 |
139,918 |
109,432 |
||||||||
Non-cash activities: |
|||||||||||
Loans transferred to available-for-sale securities |
— |
— |
600,435 |
||||||||
Loans transferred to held-for-sale from portfolio |
1,727,440 |
96,643 |
53,360 |
||||||||
Loans transferred to portfolio from held-for-sale |
278,080 |
45,240 |
307,303 |
||||||||
Transfer of loans to OREO |
24,625 |
39,066 |
34,372 |
||||||||
Transfer of securities to held-to-maturity from available-for-sale |
3,000,180 |
— |
292,164 |
||||||||
105
Huntington Bancshares Incorporated
Notes to Consolidated Financial Statements
1. SIGNIFICANT ACCOUNTING POLICIES
Nature of Operations — Huntington Bancshares Incorporated (Huntington or the Company) is a multi-state diversified regional bank holding company organized under Maryland law in 1966 and headquartered in Columbus, Ohio. Through its subsidiaries, including its bank subsidiary, The Huntington National Bank (the Bank), Huntington is engaged in providing full-service commercial, small business, consumer banking services, mortgage banking services, automobile financing, equipment leasing, investment management, trust services, brokerage services, customized insurance programs, and other financial products and services. Huntington’s banking offices are located in Ohio, Michigan, Pennsylvania, Indiana, West Virginia, and Kentucky. Select financial services and other activities are also conducted in various other states. International banking services are available through the headquarters office in Columbus, Ohio and a limited purpose office located in the Cayman Islands.
Basis of Presentation — The Consolidated Financial Statements include the accounts of Huntington and its majority-owned subsidiaries and are presented in accordance with GAAP. All intercompany transactions and balances have been eliminated in consolidation. Companies in which Huntington holds more than a 50% voting equity interest, or a controlling financial interest, or are a VIE in which Huntington has the power to direct the activities of an entity that most significantly impact the entity’s economic performance and has an obligation to absorb losses or the right to receive benefits from the VIE which could potentially be significant to the VIE are consolidated. VIEs are legal entities with insubstantial equity, whose equity investors lack the ability to make decisions about the entity’s activities, or whose equity investors do not have the right to receive the residual returns of the entity if they occur. VIEs in which Huntington does not hold the power to direct the activities of the entity that most significantly impact the entity’s economic performance or does not have an obligation to absorb losses or the right to receive benefits from the VIE which could potentially be significant to the VIE are not consolidated. For consolidated entities where Huntington holds less than a 100% interest, Huntington recognizes non-controlling interest (included in shareholders’ equity) for the equity held by others and non-controlling profit or loss (included in noninterest expense) for the portion of the entity’s earnings attributable to other’s interests. Investments in companies that are not consolidated are accounted for using the equity method when Huntington has the ability to exert significant influence. Those investments in nonmarketable securities for which Huntington does not have the ability to exert significant influence are generally accounted for using the cost method. Investments in private investment partnerships that are accounted for under the equity method or the cost method are included in Accrued income and other assets and Huntington’s proportional interest in the equity investments’ earnings are included in other noninterest income. Investment interests accounted for under the cost and equity methods are periodically evaluated for impairment.
The preparation of financial statements in conformity with GAAP requires management to make estimates and assumptions that significantly affect amounts reported in the Consolidated Financial Statements. Huntington utilizes processes that involve the use of significant estimates and the judgments of management in determining the amount of its allowance for credit losses, income taxes deferred tax assets, and contingent liabilities, as well as fair value measurements of investment securities, derivatives, goodwill, pension assets and liabilities, short-term borrowings, mortgage servicing rights, and loans held for sale. As with any estimate, actual results could differ from those estimates.
For statement of cash flows purposes, cash and cash equivalents are defined as the sum of Cash and due from banks, which includes amounts on deposit with the Federal Reserve and Federal funds sold and securities purchased under resale agreements.
Certain prior period amounts have been reclassified to conform to the current year’s presentation.
Resale and Repurchase Agreements — Securities purchased under agreements to resell and securities sold under agreements to repurchase are treated as collateralized financing transactions and are recorded at the amounts at which the securities were acquired or sold plus accrued interest. The fair value of collateral either received from or provided to a third-party is continually monitored and additional collateral is obtained or requested to be returned to Huntington in accordance with the agreement.
Securities — Securities purchased with the intention of recognizing short-term profits or which are actively bought and sold are classified as trading account securities and reported at fair value. The unrealized gains or losses on trading account securities are recorded in other noninterest income, except for gains and losses on trading account securities used to hedge the fair value of MSRs, which are included in mortgage banking income. Debt securities purchased in which Huntington has the positive intent and ability to hold to their maturity are classified as held-to-maturity securities. Held-to-maturity securities are recorded at amortized cost. All other debt and equity securities are classified as available-for-sale and other securities. Unrealized gains or losses on available-for-sale and other securities are reported as a separate component of accumulated OCI in the Consolidated Statements of Changes in Shareholders’ Equity. Credit-related declines in the value of debt securities that are considered other-than-temporary are recorded in noninterest income.
Huntington evaluates its investment securities portfolio on a quarterly basis for indicators of OTTI. Huntington assesses whether OTTI has occurred when the fair value of a debt security is less than the amortized cost basis at the balance sheet date. Management
reviews the amount of unrealized loss, the length of time the security has been in an unrealized loss position, the credit rating history, market trends of similar security classes, time remaining to maturity, and the source of both interest and principal payments to identify securities which could potentially be impaired. OTTI is considered to have occurred (1) if Huntington intends to sell the security; (2) if it is more likely than not Huntington will be required to sell the security before recovery of its amortized cost basis; or (3) the present value of expected cash flows are not sufficient to recover all contractually required principal and interest payments. For securities that Huntington does not expect to sell, or it is not more likely than not to be required to sell, the OTTI is separated into credit and noncredit components. A discounted cash flow analysis, which includes evaluating the timing of the expected cash flows, is completed for all debt securities subject to credit impairment. The measurement of the credit loss component is equal to the difference between the debt security’s cost basis and the present value of its expected future cash flows discounted at the security’s effective yield. The credit-related OTTI, represented by the expected loss in principal, is recognized in noninterest income. The remaining difference between the security’s fair value and the present value of future expected cash flows is due to factors that are not credit-related and, therefore, are recognized in OCI. Huntington believes that it will fully collect the carrying value of securities on which noncredit-related OTTI has been recognized in OCI. Noncredit-related OTTI results from other factors, including increased liquidity spreads and extension of the security. For securities which Huntington does expect to sell, or if it is more likely than not Huntington will be required to sell the security before recovery of its amortized cost basis, all OTTI is recognized in earnings. Presentation of OTTI is made in the Consolidated Statements of Income on a gross basis with a reduction for the amount of OTTI recognized in OCI.
Securities transactions are recognized on the trade date (the date the order to buy or sell is executed). The carrying value plus any related accumulated OCI balance of sold securities is used to compute realized gains and losses. Interest and dividends on securities, including amortization of premiums and accretion of discounts using the effective interest method over the period to maturity, are included in interest income.
Nonmarketable equity securities include stock acquired for regulatory purposes, such as Federal Home Loan Bank stock and Federal Reserve Bank stock. These securities are accounted for at cost, evaluated for impairment, and included in available-for-sale and other securities.
Loans and Leases — Loans and direct financing leases for which Huntington has the intent and ability to hold for the foreseeable future, or until maturity or payoff, are classified in the Consolidated Balance Sheets as loans and leases. Except for loans for which the fair value option has been elected, loans and leases are carried at the principal amount outstanding, net of unamortized deferred loan origination fees and costs and net of unearned income. Direct financing leases are reported at the aggregate of lease payments receivable and estimated residual values, net of unearned and deferred income. Interest income is accrued as earned using the interest method based on unpaid principal balances. Huntington defers the fees it receives from the origination of loans and leases, as well as the direct costs of those activities. Huntington also acquires loans at a premium and at a discount to their contractual values. Huntington amortizes loan discounts, premiums, and net loan origination fees and costs on a level-yield basis over the estimated lives of the related loans, which would not include purchased credit impaired loans.
Troubled debt restructurings are loans for which the original contractual terms have been modified to provide a concession to a borrower experiencing financial difficulties. Loan modifications are considered TDRs when the concessions provided are not available to the borrower through either normal channels or other sources. However, not all loan modifications are TDRs. Modifications resulting in troubled debt restructurings may include changes to one or more terms of the loan, including but not limited to, a change in interest rate, an extension of the amortization period, a reduction in payment amount, and partial forgiveness or deferment of principal or accrued interest.
Residual values on leased equipment are evaluated quarterly for impairment. Impairment of the residual values of direct financing leases determined to be other than temporary is recognized by writing the leases down to fair value with a charge to other noninterest expense. Residual value losses arise if the expected fair value at the end of the lease term is less than the residual value recorded at the lease origination, net of estimated amounts reimbursable by the lessee. Future declines in the expected residual value of the leased equipment would result in expected losses of the leased equipment.
For leased equipment, the residual component of a direct financing lease represents the estimated fair value of the leased equipment at the end of the lease term. Huntington uses industry data, historical experience, and independent appraisals to establish these residual value estimates. Additional information regarding product life cycle, product upgrades, as well as insight into competing products are obtained through relationships with industry contacts and are factored into residual value estimates where applicable.
Loans Held for Sale — Loans in which Huntington does not have the intent and ability to hold for the foreseeable future are classified as loans held for sale. Loans held for sale (excluding loans originated or acquired with the intent to sell, which are carried at fair value) are carried at the lower of cost or fair value less cost to sell. The fair value option is generally elected for mortgage loans held for sale to facilitate hedging of the loans. The fair value of such loans is estimated based on the inputs that include prices of mortgage backed securities adjusted for other variables such as, interest rates, expected credit defaults and market discount rates. The adjusted value reflects the price we expect to receive from the sale of such loans.
Nonmortgage loans held for sale are measured on an aggregate asset basis.
106
Allowance for Credit Losses — Huntington maintains two reserves, both of which reflect management’s judgment regarding the appropriate level necessary to absorb credit losses inherent in our loan and lease portfolio: the ALLL and the AULC. Combined, these reserves comprise the total ACL. The determination of the ACL requires significant estimates, including the timing and amounts of expected future cash flows on impaired loans and leases, consideration of current economic conditions, and historical loss experience pertaining to pools of homogeneous loans and leases, all of which may be susceptible to change.
The appropriateness of the ACL is based on management’s current judgments about the credit quality of the loan portfolio. These judgments consider on-going evaluations of the loan and lease portfolio, including such factors as the differing economic risks associated with each loan category, the financial condition of specific borrowers, the level of delinquent loans, the value of any collateral and, where applicable, the existence of any guarantees or other documented support. Further, management evaluates the impact of changes in interest rates and overall economic conditions on the ability of borrowers to meet their financial obligations when quantifying our exposure to credit losses and assessing the appropriateness of our ACL at each reporting date. In addition to general economic conditions and the other factors described above, additional factors also considered include: the impact of increasing or decreasing residential real estate values; the diversification of CRE loans; the development of new or expanded Commercial business segments such as healthcare, ABL, leveraged lending, and energy, and the overall condition of the manufacturing industry. Also, the ACL assessment includes the on-going assessment of credit quality metrics, and a comparison of certain ACL benchmarks to current performance.
The ALLL consists of two components: (1) the transaction reserve, which includes a loan level allocation, specific reserves related to loans considered to be impaired, and loans involved in troubled debt restructurings, and (2) the general reserve. The transaction reserve component includes both (1) an estimate of loss based on pools of commercial and consumer loans and leases with similar characteristics and (2) an estimate of loss based on an impairment review of each impaired C&I and CRE loan where obligor balance is greater than $1.0 million. For the C&I and CRE portfolios, the estimate of loss based on pools of loans and leases with similar characteristics is made by applying a PD factor and a LGD factor to each individual loan based on a regularly updated loan grade, using a standardized loan grading system. The PD factor and an LGD factor are determined for each loan grade using statistical models based on historical performance data. The PD factor considers on-going reviews of the financial performance of the specific borrower, including cash flow, debt-service coverage ratio, earnings power, debt level, and equity position, in conjunction with an assessment of the borrower’s industry and future prospects. The LGD factor considers analysis of the type of collateral and the relative LTV ratio. These reserve factors are developed based on credit migration models that track historical movements of loans between loan ratings over time and a combination of long-term average loss experience of our own portfolio and external industry data.
In the case of more homogeneous portfolios, such as automobile loans, home equity loans, and residential mortgage loans, the determination of the transaction reserve also incorporates PD and LGD factors. The estimate of loss is based on pools of loans and leases with similar characteristics. The PD factor considers current credit scores unless the account is delinquent, in which case a higher PD factor is used. The credit score provides a basis for understanding the borrower’s past and current payment performance, and this information is used to estimate expected losses over the emergence period. The performance of first-lien loans ahead of our junior-lien loans is available to use as part of our updated score process. The LGD factor considers analysis of the type of collateral and the relative LTV ratio. Credit scores, models, analyses, and other factors used to determine both the PD and LGD factors are updated frequently to capture the recent behavioral characteristics of the subject portfolios, as well as any changes in loss mitigation or credit origination strategies, and adjustments to the reserve factors are made as required.
The general reserve consists of various risk-profile reserve components. The risk-profile component considers items unique to our structure, policies, processes, and portfolio composition, as well as qualitative measurements and assessments of the loan portfolios including, but not limited to, management quality, concentrations, portfolio composition, industry comparisons, and internal review functions.
The estimate for the AULC is determined using the same procedures and methodologies as used for the ALLL. The loss factors used in the AULC are the same as the loss factors used in the ALLL while also considering a historical utilization of unused commitments. The AULC is recorded in Accrued expenses and other liabilities in the Consolidated Balance Sheets.
Nonaccrual and Past Due Loans — Loans are considered past due when the contractual amounts due with respect to principal and interest are not received within 30 days of the contractual due date.
Any loan in any portfolio may be placed on nonaccrual status prior to the policies described below when collection of principal or interest is in doubt. When a borrower with debt is discharged in a Chapter 7 bankruptcy and not reaffirmed by the borrower, the loan is determined to be collateral dependent and placed on nonaccrual status, unless there is a co-borrower.
All classes within the C&I and CRE portfolios (except for purchased credit-impaired loans) are placed on nonaccrual status at 90-days past due. First-lien home equity loans are placed on nonaccrual status at 150-days past due. Junior-lien home equity loans are placed on nonaccrual status at the earlier of 120-days past due or when the related first-lien loan has been identified as nonaccrual. Automobile and other consumer loans are generally charged-off when the loan is 120-days past due. Residential mortgage loans are placed on nonaccrual status at 150-days past due, with the exception of residential mortgages guaranteed by government agencies
107
which continue to accrue interest at the rate guaranteed by the government agency. We are reimbursed from the government agency for reasonable expenses incurred in servicing loans.
For all classes within all loan portfolios, when a loan is placed on nonaccrual status, any accrued interest income is reversed with current year accruals charged to interest income, and prior year amounts charged-off as a credit loss.
For all classes within all loan portfolios, cash receipts received on NALs are applied against principal until the loan or lease has been collected in full, after which time any additional cash receipts are recognized as interest income. However, for secured non-reaffirmed debt in a Chapter 7 bankruptcy, payments are applied to principal and interest when the borrower has demonstrated a capacity to continue payment of the debt and collection of the debt is reasonably assured. For unsecured non-reaffirmed debt in a Chapter 7 bankruptcy where the carrying value has been fully charged-off, payments are recorded as loan recoveries.
Regarding all classes within the C&I and CRE portfolios, the determination of a borrower’s ability to make the required principal and interest payments is based on an examination of the borrower’s current financial statements, industry, management capabilities, and other qualitative measures. For all classes within the consumer loan portfolio, the determination of a borrower’s ability to make the required principal and interest payments is based on multiple factors, including number of days past due and, in some instances, an evaluation of the borrower’s financial condition. When, in management’s judgment, the borrower’s ability to make required principal and interest payments resumes and collectability is no longer in doubt, supported by sustained repayment history, the loan is returned to accrual status. For these loans that have been returned to accrual status, cash receipts are applied according to the contractual terms of the loan.
Charge-off of Uncollectible Loans — Any loan in any portfolio may be charged-off prior to the policies described below if a loss confirming event has occurred. Loss confirming events include, but are not limited to, bankruptcy (unsecured), continued delinquency, foreclosure, or receipt of an asset valuation indicating a collateral deficiency and that asset is the sole source of repayment. Additionally, discharged, collateral dependent non-reaffirmed debt in Chapter 7 bankruptcy filings will result in a charge-off to estimated collateral value, less anticipated selling costs.
C&I and CRE loans are either charged-off or written down to net realizable value at 90-days past due. Automobile loans and other consumer loans are charged-off at 120-days past due. First-lien and junior-lien home equity loans are charged-off to the estimated fair value of the collateral, less anticipated selling costs, at 150-days past due and 120-days past due, respectively. Residential mortgages are charged-off to the estimated fair value of the collateral at 150-days past due.
Impaired Loans — For all classes within the C&I and CRE portfolios, all loans with an obligor balance of $1.0 million or greater are evaluated on a quarterly basis for impairment. Except for TDRs, consumer loans within any class are generally not individually evaluated on a regular basis for impairment. All TDRs, regardless of the outstanding balance amount, are also considered to be impaired. Loans acquired with evidence of deterioration in credit quality since origination for which it is probable at acquisition that all contractually required payments will not be collected are also considered to be impaired.
Once a loan has been identified for an assessment of impairment, the loan is considered impaired when, based on current information and events, it is probable that all amounts due according to the contractual terms of the loan agreement will not be collected. This determination requires significant judgment and use of estimates, and the eventual outcome may differ significantly from those estimates.
When a loan in any class has been determined to be impaired, the amount of the impairment is measured using the present value of expected future cash flows discounted at the loan’s effective interest rate or, as a practical expedient, the observable market price of the loan, or the fair value of the collateral, less anticipated selling costs, if the loan is collateral dependent. When the present value of expected future cash flows is used, the effective interest rate is the original contractual interest rate of the loan adjusted for any cost, fee, premium, or discount. When the contractual interest rate is variable, the effective interest rate of the loan changes over time. A specific reserve is established as a component of the ALLL when a loan has been determined to be impaired. Subsequent to the initial measurement of impairment, if there is a significant change to the impaired loan’s expected future cash flows, or if actual cash flows are significantly different from the cash flows previously estimated, Huntington recalculates the impairment and appropriately adjusts the specific reserve. Similarly, if Huntington measures impairment based on the observable market price of an impaired loan or the fair value of the collateral of an impaired collateral dependent loan, Huntington will adjust the specific reserve.
When a loan within any class is impaired, the accrual of interest income is discontinued unless the receipt of principal and interest is no longer in doubt. Interest income on TDRs is accrued when all principal and interest is expected to be collected under the post-modification terms. Cash receipts received on nonaccruing impaired loans within any class are generally applied entirely against principal until the loan has been collected in full (including already charged-off portion), after which time any additional cash receipts are recognized as interest income. Cash receipts received on accruing impaired loans within any class are applied in the same manner as accruing loans that are not considered impaired.
108
Purchased Credit-Impaired Loans — Purchased loans with evidence of deterioration in credit quality since origination for which it is probable at acquisition that we will be unable to collect all contractually required payments are considered to be credit impaired. Purchased credit-impaired loans are initially recorded at fair value, which is estimated by discounting the cash flows expected to be collected at the acquisition date. Because the estimate of expected cash flows reflects an estimate of future credit losses expected to be incurred over the life of the loans, an allowance for credit losses is not recorded at the acquisition date. The excess of cash flows expected at acquisition over the estimated fair value, referred to as the accretable yield, is recognized in interest income over the remaining life of the loan, or pool of loans, on a level-yield basis. The difference between the contractually required payments at acquisition and the cash flows expected to be collected at acquisition is referred to as the nonaccretable difference. A subsequent decrease in the estimate of cash flows expected to be received on purchased credit-impaired loans generally results in the recognition of an allowance for credit losses. Subsequent increases in cash flows result in reversal of any nonaccretable difference (or allowance for loan and lease losses to the extent any has been recorded) with a positive impact on interest income subsequently recognized. The measurement of cash flows involves assumptions and judgments for interest rates, prepayments, default rates, loss severity, and collateral values. All of these factors are inherently subjective and significant changes in the cash flow estimates over the life of the loan can result.
Transfers of Financial Assets and Securitizations — Transfers of financial assets in which we have surrendered control over the transferred assets are accounted for as sales. In assessing whether control has been surrendered, we consider whether the transferee would be a consolidated affiliate, the existence and extent of any continuing involvement in the transferred financial assets, and the impact of all arrangements or agreements made contemporaneously with, or in contemplation of, the transfer, even if they were not entered into at the time of transfer. Control is generally considered to have been surrendered when (i) the transferred assets have been legally isolated from us or any of our consolidated affiliates, even in bankruptcy or other receivership, (ii) the transferee (or, if the transferee is an entity whose sole purpose is to engage in securitization or asset-backed financing that is constrained from pledging or exchanging the assets it receives, each third-party holder of its beneficial interests) has the right to pledge or exchange the assets (or beneficial interests) it received without any constraints that provide more than a trivial benefit to us, and (iii) neither we nor our consolidated affiliates and agents have (a) both the right and obligation under any agreement to repurchase or redeem the transferred assets before their maturity, (b) the unilateral ability to cause the holder to return specific financial assets that also provides us with a more-than-trivial benefit (other than through a cleanup call) or (c) an agreement that permits the transferee to require us to repurchase the transferred assets at a price so favorable that it is probable that it will require us to repurchase them.
If the sale criteria are met, the transferred financial assets are removed from our balance sheet and a gain or loss on sale is recognized. If the sale criteria are not met, the transfer is recorded as a secured borrowing in which the assets remain on our balance sheet and the proceeds from the transaction are recognized as a liability. For the majority of financial asset transfers, it is clear whether or not we have surrendered control. For other transfers, such as in connection with complex transactions or where we have continuing involvement, we generally obtain a legal opinion as to whether the transfer results in a true sale by law.
We have historically securitized certain automobile receivables. Gains and losses on the loans and leases sold and servicing rights associated with loan and lease sales are determined when the related loans or leases are sold to either a securitization trust or third-party. For loan or lease sales with servicing retained, a servicing asset is recorded at fair value for the right to service the loans sold.
Derivative Financial Instruments — A variety of derivative financial instruments, principally interest rate swaps, caps, floors, and collars, are used in asset and liability management activities to protect against the risk of adverse price or interest rate movements. These instruments provide flexibility in adjusting Huntington’s sensitivity to changes in interest rates without exposure to loss of principal and higher funding requirements.
Huntington also uses derivatives, principally loan sale commitments, in hedging its mortgage loan interest rate lock commitments and its mortgage loans held for sale. Mortgage loan sale commitments and the related interest rate lock commitments are carried at fair value on the Consolidated Balance Sheets with changes in fair value reflected in mortgage banking income. Huntington also uses certain derivative financial instruments to offset changes in value of its MSRs. These derivatives consist primarily of forward interest rate agreements and forward mortgage contracts. The derivative instruments used are not designated as qualifying hedges. Accordingly, such derivatives are recorded at fair value with changes in fair value reflected in mortgage banking income.
Derivative financial instruments are recorded in the Consolidated Balance Sheets as either an asset or a liability (in accrued income and other assets or accrued expenses and other liabilities, respectively) and measured at fair value. On the date a derivative contract is entered into, we designate it as either:
• |
a qualifying hedge of the fair value of a recognized asset or liability or of an unrecognized firm commitment (fair value hedge); |
• |
a qualifying hedge of the variability of cash flows to be received or paid related to a recognized asset liability or forecasted transaction (cash flow hedge); or |
• |
a trading instrument or a non-qualifying (economic) hedge. |
109
Changes in the fair value of a derivative that has been designated and qualifies as a fair value hedge, along with the changes in the fair value of the hedged asset or liability that is attributable to the hedged risk, are recorded in current period earnings. Changes in the fair value of a derivative that has been designated and qualifies as a cash flow hedge, to the extent effective as a hedge, are recorded in accumulated other comprehensive income, net of income taxes, and reclassified into earnings in the period during which the hedged item affects earnings. Ineffectiveness in the hedging relationship is reflected in current period earnings. Changes in the fair value of derivatives held for trading purposes or which do not qualify for hedge accounting are reported in current period earnings.
For those derivatives to which hedge accounting is applied, Huntington formally documents the hedging relationship and the risk management objective and strategy for undertaking the hedge. This documentation identifies the hedging instrument, the hedged item or transaction, the nature of the risk being hedged, and, unless the hedge meets all of the criteria to assume there is no ineffectiveness, the method that will be used to assess the effectiveness of the hedging instrument and how ineffectiveness will be measured. The methods utilized to assess retrospective hedge effectiveness, as well as the frequency of testing, vary based on the type of item being hedged and the designated hedge period. For specifically designated fair value hedges of certain fixed-rate debt, Huntington utilizes the short-cut method when certain criteria are met. For other fair value hedges of fixed-rate debt, including certificates of deposit, Huntington utilizes the regression method to evaluate hedge effectiveness on a quarterly basis. For fair value hedges of portfolio loans, the regression method is used to evaluate effectiveness on a daily basis. For cash flow hedges, the regression method is applied on a quarterly basis.
Hedge accounting is discontinued prospectively when:
• |
the derivative is no longer effective or expected to be effective in offsetting changes in the fair value or cash flows of a hedged item (including firm commitments or forecasted transactions); |
• |
the derivative expires or is sold, terminated, or exercised; |
• |
it is unlikely that a forecasted transaction will occur; |
• |
the hedged firm commitment no longer meets the definition of a firm commitment; or |
• |
the designation of the derivative as a hedging instrument is removed. |
When hedge accounting is discontinued because it is determined that the derivative no longer qualifies as an effective fair value or cash flow hedge, the derivative will continue to be carried on the balance sheet at fair value.
In the case of a discontinued fair value hedge of a recognized asset or liability, as long as the hedged item continues to exist on the balance sheet, the hedged item will no longer be adjusted for changes in fair value. The basis adjustment that had previously been recorded to the hedged item during the period from the hedge designation date to the hedge discontinuation date is recognized as an adjustment to the yield of the hedged item over the remaining life of the hedged item.
In the case of a discontinued cash flow hedge of a recognized asset or liability, as long as the hedged item continues to exist on the balance sheet, the effective portion of the changes in fair value of the hedging derivative will no longer be recorded to other comprehensive income. The balance applicable to the discontinued hedging relationship will be recognized in earnings over the remaining life of the hedged item as an adjustment to yield. If the discontinued hedged item was a forecasted transaction that is not expected to occur, any amounts recorded on the balance sheet related to the hedged item, including any amounts recorded in accumulated other comprehensive income, are immediately reclassified to current period earnings.
In the case of either a fair value hedge or a cash flow hedge, if the previously hedged item is sold or extinguished, the basis adjustment to the underlying asset or liability or any remaining unamortized other comprehensive income balance will be reclassified to current period earnings.
In all other situations in which hedge accounting is discontinued, the derivative will be carried at fair value on the consolidated balance sheets, with changes in its fair value recognized in current period earnings unless re-designated as a qualifying hedge.
Like other financial instruments, derivatives contain an element of credit risk, which is the possibility that Huntington will incur a loss because the counterparty fails to meet its contractual obligations. Notional values of interest rate swaps and other off-balance sheet financial instruments significantly exceed the credit risk associated with these instruments and represent contractual balances on which calculations of amounts to be exchanged are based. Credit exposure is limited to the sum of the aggregate fair value of positions that have become favorable to Huntington, including any accrued interest receivable due from counterparties. Potential credit losses are mitigated through careful evaluation of counterparty credit standing, selection of counterparties from a limited group of high quality institutions, collateral agreements, and other contract provisions. Huntington considers the value of collateral held and collateral provided in determining the net carrying value of derivatives.
Huntington offsets the fair value amounts recognized for derivative instruments and the fair value for the right to reclaim cash collateral or the obligation to return cash collateral arising from derivative instrument(s) recognized at fair value executed with the same counterparty under a master netting arrangement.
110
Repossessed Collateral — Repossessed collateral, also referred to as other real estate owned (OREO), is comprised principally of commercial and residential real estate properties obtained in partial or total satisfaction of loan obligations, and is carried at fair value. Collateral obtained in satisfaction of a loan is recorded at the estimated fair value less anticipated selling costs based upon the property’s appraised value at the date of foreclosure, with any difference between the fair value of the property and the carrying value of the loan recorded as a charge-off. If the fair value is higher than the carrying amount of the loan the excess is recognized first as a recovery and then as noninterest income. Subsequent declines in value are reported as adjustments to the carrying amount and are recorded in noninterest expense. Gains or losses resulting from the sale of collateral are recognized in noninterest expense at the date of sale.
Collateral — We pledge assets as collateral as required for various transactions including security repurchase agreements, public deposits, loan notes, derivative financial instruments, short-term borrowings and long-term borrowings. Assets that have been pledged as collateral, including those that can be sold or repledged by the secured party, continue to be reported on our Consolidated Balance Sheets.
We also accept collateral, primarily as part of various transactions including derivative and security resale agreements. Collateral accepted by us, including collateral that we can sell or repledge, is excluded from our Consolidated Balance Sheets.
The market value of collateral we have accepted or pledged is regularly monitored and additional collateral is obtained or provided as necessary to ensure appropriate collateral coverage in these transactions.
Premises and Equipment — Premises and equipment are stated at cost, less accumulated depreciation and amortization. Depreciation is computed principally by the straight-line method over the estimated useful lives of the related assets. Buildings and building improvements are depreciated over an average of 30 to 40 years and 10 to 30 years, respectively. Land improvements and furniture and fixtures are depreciated over an average of 5 to 20 years, while equipment is depreciated over a range of 3 to 10 years. Leasehold improvements are amortized over the lesser of the asset’s useful life or the lease term, including any renewal periods for which renewal is reasonably assured. Maintenance and repairs are charged to expense as incurred, while improvements that extend the useful life of an asset are capitalized and depreciated over the remaining useful life. Premises and equipment is evaluated for impairment whenever events or changes in circumstances indicate that the carrying amount of the asset may not be recoverable.
Mortgage Servicing Rights — Huntington recognizes the rights to service mortgage loans as separate assets, which are included in Accrued income and other assets in the Consolidated Balance Sheets when purchased, or when servicing is contractually separated from the underlying mortgage loans by sale or securitization of the loans with servicing rights retained.
For loan sales with servicing retained, a servicing asset is recorded on the day of the sale at fair value for the right to service the loans sold. To determine the fair value of a MSR, Huntington uses an option adjusted spread cash flow analysis incorporating market implied forward interest rates to estimate the future direction of mortgage and market interest rates. The forward rates utilized are derived from the current yield curve for U.S. dollar interest rate swaps and are consistent with pricing of capital markets instruments. The current and projected mortgage interest rate influences the prepayment rate and, therefore, the timing and magnitude of the cash flows associated with the MSR. Servicing revenues on mortgage loans are included in mortgage banking income.
At the time of initial capitalization, MSRs may be grouped into servicing classes based on the availability of market inputs used in determining fair value and the method used for managing the risks of the servicing assets. MSR assets are recorded using the fair value method or the amortization method. The election of the fair value or amortization method is made at the time each servicing class is established. All newly created MSRs since 2009 were recorded using the amortization method. Any change in the fair value of MSRs carried under the fair value method, as well as amortization and impairment of MSRs under the amortization method, during the period is recorded in mortgage banking income, which is reflected in the Consolidated Statements of Income. Huntington economically hedges the value of certain MSRs using derivative instruments and trading securities. Changes in fair value of these derivatives and trading securities are reported as a component of mortgage banking income.
Goodwill and Other Intangible Assets — Under the acquisition method of accounting, the net assets of entities acquired by
Huntington are recorded at their estimated fair value at the date of acquisition. The excess cost of the acquisition over the fair value of net assets acquired is recorded as goodwill. Other intangible assets are amortized either on an accelerated or straight-line basis over their estimated useful lives. Goodwill is evaluated for impairment on an annual basis at October 1st of each year or whenever events or changes in circumstances indicate that the carrying value may not be recoverable. Other intangible assets are reviewed for impairment whenever events or changes in circumstances indicate that the carrying amount of the asset may not be recoverable.
Pension and Other Postretirement Benefits — We recognize the funded status of the postretirement benefit plans on the Consolidated Balance Sheets. Net postretirement benefit cost charged to current earnings related to these plans is based on various actuarial assumptions regarding expected future experience.
Certain employees are participants in various defined contribution and other non-qualified supplemental retirement plans. Our contributions to these plans are charged to current earnings.
111
In addition, we maintain a 401(k) plan covering substantially all employees. Employer contributions to the plan, which are charged to current earnings, are based on employee contributions.
Share-Based Compensation — We use the fair value based method of accounting for awards of HBAN stock granted to employees under various stock option and restricted share plans. Stock compensation costs are recognized prospectively for all new awards granted under these plans. Compensation expense relating to share options is calculated using a methodology that is based on the underlying assumptions of the Black-Scholes option pricing model and is charged to expense over the requisite service period (e.g. vesting period). Compensation expense relating to restricted stock awards is based upon the fair value of the awards on the date of grant and is charged to earnings over the requisite service period (e.g., vesting period) of the award.
Stock Repurchases — Acquisitions of Huntington stock are recorded at cost. The re-issuance of shares is recorded at weighted-average cost.
Income Taxes — Income taxes are accounted for under the asset and liability method. Accordingly, deferred tax assets and liabilities are recognized for the future book and tax consequences attributable to temporary differences between the financial statement carrying amounts of existing assets and liabilities and their respective tax bases. Deferred tax assets and liabilities are determined using enacted tax rates expected to apply in the year in which those temporary differences are expected to be recovered or settled. The effect on deferred tax assets and liabilities of a change in tax rates is recognized in income at the time of enactment of such change in tax rates. Any interest or penalties due for payment of income taxes are included in the provision for income taxes. To the extent that we do not consider it more likely than not that a deferred tax asset will be recovered, a valuation allowance is recorded. All positive and negative evidence is reviewed when determining how much of a valuation allowance is recognized on a quarterly basis. In determining the requirements for a valuation allowance, sources of possible taxable income are evaluated including future reversals of existing taxable temporary differences, future taxable income exclusive of reversing temporary differences and carryforwards, taxable income in appropriate carryback years, and tax-planning strategies. Huntington applies a more likely than not recognition threshold for all tax uncertainties.
Bank Owned Life Insurance — Huntington’s bank owned life insurance policies are recorded at their cash surrender value. Huntington recognizes tax-exempt income from the periodic increases in the cash surrender value of these policies and from death benefits. A portion of the cash surrender value is supported by holdings in separate accounts. Book value protection for the separate accounts is provided by the insurance carriers and a highly rated major bank.
Fair Value Measurements — The Company records or discloses certain of its assets and liabilities at fair value. Fair value is defined as the exchange price that would be received for an asset or paid to transfer a liability (an exit price) in the principal or most advantageous market for the asset or liability in an orderly transaction between market participants on the measurement date. Fair value measurements are classified within one of three levels in a valuation hierarchy based upon the observability of inputs to the valuation of an asset or liability as of the measurement date. The three levels are defined as follows:
Level 1 – inputs to the valuation methodology are quoted prices (unadjusted) for identical assets or liabilities in active markets.
Level 2 – inputs to the valuation methodology include quoted prices for similar assets and liabilities in active markets, and inputs that are observable for the asset or liability, either directly or indirectly, for substantially the full term of the financial instrument.
Level 3 – inputs to the valuation methodology are unobservable and significant to the fair value measurement.
A financial instrument’s categorization within the valuation hierarchy is based upon the lowest level of input that is significant to the fair value measurement.
Segment Results — Accounting policies for the business segments are the same as those used in the preparation of the Consolidated Financial Statements with respect to activities specifically attributable to each business segment. However, the preparation of business segment results requires management to establish methodologies to allocate funding costs and benefits, expenses, and other financial elements to each business segment.
2. ACCOUNTING STANDARDS UPDATE
ASU 2014-04—Receivables (Topic 310): Reclassification of Residential Real Estate Collateralized Consumer Mortgage Loans upon Foreclosure. The ASU clarifies that an in substance repossession or foreclosure occurs upon either the creditor obtaining legal title to the residential real estate property or the borrower conveying all interest in the residential real estate property to the creditor to satisfy that loan through completion of a deed in lieu of foreclosure or through a similar legal agreement. The amendments were effective for annual periods, and interim reporting periods within those annual periods, beginning after December 15, 2014. The amendments did not have a material impact on Huntington’s Consolidated Financial Statements.
ASU 2014-09—Revenue from Contracts with Customers (Topic 606): The amendments in ASU 2014-09 supersede the revenue recognition requirements in Topic 605, Revenue Recognition, and most industry-specific guidance. The general principle of the amendments require an entity to recognize revenue upon the transfer of promised goods or services to customers in an amount that
112
reflects the consideration to which the entity expects to be entitled in exchange for those goods or services. The guidance sets forth a five step approach to be utilized for revenue recognition. The amendments were originally effective for annual reporting periods beginning after December 15, 2016, including interim periods within that reporting period. Subsequently, the FASB issued a one-year deferral for implementation, which results in new guidance being effective for annual and interim reporting periods beginning after December 15, 2017. The FASB, however, permitted adoption of the new guidance on the original effective date. Management is currently assessing the impact on Huntington’s Consolidated Financial Statements.
ASU 2014-11—Transfers and Servicing (Topic 860): Repurchase-to-Maturity Transactions, Repurchase Financings, and Disclosures. The amendments in the ASU require repurchase-to-maturity transactions to be recorded and accounted for as secured borrowings. Amendments to Topic 860 also require separate accounting for a transfer of a financial asset executed contemporaneously with a repurchase agreement with the same counterparty (i.e., a repurchase financing), which will result in secured borrowing accounting for the repurchase agreement, as well as additional required disclosures. The accounting amendments and disclosures are effective for interim and annual periods beginning after December 15, 2014. The disclosures for repurchase agreements, securities lending transactions, and repurchase-to-maturity transactions accounted for as secured borrowings are required to be presented for annual periods beginning after December 15, 2014, and for interim periods beginning after March 15, 2015. The amendments did not have a material impact on Huntington’s Consolidated Financial Statements.
ASU 2014-12—Compensation—Stock Compensation (Topic 718): Accounting for Share-Based Payments When the Terms of an Award Provide That a Performance Target Could Be Achieved after the Requisite Service Period. The amendments require that a performance target that affects vesting, and that could be achieved after the requisite service period, be treated as a performance condition. Specifically, if the performance target becomes probable of being achieved before the end of the requisite service period, the remaining unrecognized compensation cost should be recognized prospectively over the remaining requisite service period. The amendments are effective for annual periods and interim periods within those annual periods beginning after December 15, 2015. Management is currently assessing the impact on Huntington’s Consolidated Financial Statements.
ASU 2014-14—Receivables—Troubled Debt Restructurings by Creditors (Subtopic 310-40): Classification of Certain Government-Guaranteed Mortgage Loans upon Foreclosure. The amendments require a mortgage loan to be derecognized and a separate receivable to be recognized upon foreclosure if the loan has a government guarantee that is non-separable from the loan before foreclosure, the creditor has the ability and intent to convey the real estate property to the guarantor, and any amount of the claim that is determined on the basis of the fair value of the real estate is fixed. Additionally, the separate other receivable should be measured based on the amount of the loan balance (principal and interest) expected to be recovered from the guarantor upon foreclosure. The amendments were effective for annual periods and interim periods within those annual periods beginning after December 15, 2014. The amendments did not have a material impact on Huntington’s Consolidated Financial Statements.
ASU 2015-02—Consolidation (Topic 810) Amendments to the Consolidation Analysis. The amendment applies to entities in all industries and provides a new scope exception for registered money market funds and similar unregistered money market funds. It also makes targeted amendments to the current consolidation guidance and ends the deferral granted to investment companies from applying the variable interest entity accounting guidance. The amendments are effective for annual periods beginning after December 15, 2015. The amendments are not expected to have a material impact on Huntington’s Consolidated Financial Statements.
ASU 2015-03—Imputation of Interest (Topic 835): Simplifying the Presentation of Debt Issuance Costs. This ASU was issued to simplify presentation of debt issuance costs. The amendments in this ASU require debt issuance costs related to a recognized debt liability be presented in the balance sheet as a direct deduction from the carrying amount of that debt liability, consistent with debt discounts. Subsequently, the FASB issued ASU 2015-15 to amend the SEC paragraph related to debt issuance cost. The amendment applies to debt issuance costs related to a line-of-credit arrangement which may be presented as an asset. The cost related to the line-of credit should be subsequently amortized ratably over the term of the line-of-credit arrangement. The recognition and measurement guidance for debt issuance costs are not affected by the amendments in this ASU. The amendments are effective for financial statements issued for fiscal years beginning after December 15, 2015, and interim periods within those fiscal years. The amendment is not expected to have a material impact on Huntington’s Consolidated Financial Statements.
ASU 2015-10—Technical Corrections and Improvements. The technical corrections and improvements included in the ASU are issued in June 2015 with an objective to clarify the Accounting Standards Codification (“Codification”), correct unintended application of guidance, or make minor improvements to the Codification that are minor in nature. One of the corrections is related to disclosure of fair value for non-recurring items. The ASU requires disclosure of fair value for non-recurring items at the relevant measurement date where the fair value is not measured at the end of the reporting period. Also, for nonrecurring measurements estimated at a date during the reporting period other than the end of the reporting period, a reporting entity shall clearly indicate that the fair value information presented is not as of the period’s end as well as the date or period that the measurement was taken. The technical correction is effective upon issuance. The correction in the ASU does not have a significant impact on Huntington’s Consolidated Financial Statements.
ASU 2015-16 — Simplifying the Accounting for Measurement-Period Adjustments. The amendments in this Update require that an acquirer recognize adjustments to provisional amounts that are identified during the measurement period in the reporting period in
113
which the adjustment amounts are determined. The acquirer is required to record, in the same period’s financial statements, the effect on earnings of changes in depreciation, amortization, or other income effects, if any, as a result of the change to the provisional amounts, calculated as if the accounting had been completed at the acquisition date. The amendments require an entity to present separately on the face of the income statement or disclose in the notes the portion of the amount recorded in current-period earnings by line item that would have been recorded in previous reporting periods if the adjustment to the provisional amounts had been recognized as of the acquisition date. The Update is effective for fiscal years beginning after December 15, 2015, including interim periods within those fiscal years. The amendments in this Update should be applied prospectively to adjustments to provisional amounts that occur after the effective date of this Update with earlier application permitted. Management will continue to monitor the applicability of this amendment to Huntington’s Consolidated Financial Statements.
ASU 2016-01 — Recognition and Measurement of Financial Assets and Financial Liabilities. The amendments in this Update make targeted improvements to GAAP including, but not limited to, requiring an entity to measure its equity investments (i.e., investment that are not accounted for using equity method of accounting or are consolidated) with changes in the fair value recognized in the income statement, requiring an entity to present separately in OCI the portion of the total change in the fair value of a liability resulting from a change in the instrument-specific credit risk when the entity has elected to measure the liability at fair value in accordance with the fair value option for financial instruments (i.e., FVO liability), requiring public business entities to use the exit price notion when measuring the fair value of financial instruments for disclosure purposes, and eliminating some of the disclosures required by the existing GAAP while requiring entities to present and disclose some additional information. The new guidance is effective for the fiscal period beginning after December 15, 2017, including interim periods within those fiscal years. An entity may, however, choose to adopt the requirement to present separately the credit mark on FVO liability earlier at the beginning of any fiscal year if the financial statements for the fiscal year or interim periods have not been issued. An entity should apply the amendments by means of a cumulative-effect adjustment to the balance sheet as of the beginning of the fiscal year of adoption. The amendment is not expected to have a material impact on Huntington's Consolidated Financial Statements.
3. LOANS AND LEASES AND ALLOWANCE FOR CREDIT LOSSES
Except for loans which are accounted for at fair value, loans are carried at the principal amount outstanding, net of unamortized premiums and discounts and deferred loan fees and costs, which resulted in a net premium of $262 million and $230 million, at December 31, 2015 and 2014, respectively.
Loan and Lease Portfolio Composition
The table below summarizes the Company’s primary portfolios. For ACL purposes, these portfolios are further disaggregated into classes which are also summarized in the table below.
Portfolio |
Class |
Commercial and industrial |
Owner occupied |
Purchased credit-impaired |
|
Other commercial and industrial |
|
Commercial real estate |
Retail properties |
Multi family |
|
Office |
|
Industrial and warehouse |
|
Purchased credit-impaired |
|
Other commercial real estate |
|
Automobile |
NA (1) |
Home equity |
Secured by first-lien |
Secured by junior-lien |
|
Residential mortgage |
Residential mortgage |
Purchased credit-impaired |
|
Other consumer |
Other consumer |
Purchased credit-impaired |
|
(1) |
Not applicable. The automobile loan portfolio is not further segregated into classes. |
114
Direct Financing Leases
Huntington’s loan and lease portfolio includes lease financing receivables consisting of direct financing leases on equipment, which are included in C&I loans. Net investments in lease financing receivables by category at December 31, 2015 and 2014 were as follows:
At December 31, |
|||||||
(dollar amounts in thousands) |
2015 |
2014 |
|||||
Commercial and industrial: |
|||||||
Lease payments receivable |
$ |
1,551,885 |
$ |
1,051,744 |
|||
Estimated residual value of leased assets |
711,181 |
483,407 |
|||||
Gross investment in commercial lease financing receivables |
2,263,066 |
1,535,151 |
|||||
Net deferred origination costs |
7,068 |
2,557 |
|||||
Unearned income |
(208,669 |
) |
(131,027 |
) |
|||
Total net investment in commercial lease financing receivables |
$ |
2,061,465 |
$ |
1,406,681 |
|||
The future lease rental payments due from customers on direct financing leases at December 31, 2015, totaled $1.6 billion and therefore were as follows: $0.5 billion in 2016, $0.4 billion in 2017, $0.3 billion in 2018, $0.2 billion in 2019, $0.1 billion in 2020, and $0.1 billion thereafter.
Huntington Technology Finance acquisition
On March 31, 2015, Huntington completed its acquisition of Macquarie Equipment Finance, which was re-branded Huntington Technology Finance. Lease receivables with a fair value of $839 million, including a lease residual value of approximately $200 million, were acquired by Huntington. These leases were recorded at fair value. The fair values of the leases were estimated using discounted cash flow analyses using interest rates currently being offered for leases with similar terms (Level 3), and reflected an estimate of credit and other risk associated with the leases.
Camco Financial acquisition
On March 1, 2014, Huntington completed its acquisition of Camco Financial. Loans with a fair value of $559 million were acquired by Huntington.
Purchased Credit-Impaired Loans
The following table presents a rollforward of the accretable yield by acquisition for the year ended December 31, 2015 and 2014:
(dollar amounts in thousands) |
2015 |
2014 |
|||||
Fidelity Bank |
|||||||
Balance at January 1, |
$ |
19,388 |
$ |
27,995 |
|||
Accretion |
(11,032 |
) |
(13,485 |
) |
|||
Reclassification from nonaccretable difference |
7,856 |
4,878 |
|||||
Balance at December 31, |
$ |
16,212 |
$ |
19,388 |
|||
Camco Financial |
|||||||
Balance at January 1, |
$ |
824 |
$ |
— |
|||
Impact of acquisition on March 1, 2014 |
— |
143 |
|||||
Accretion |
(1,380 |
) |
(5,597 |
) |
|||
Reclassification from nonaccretable difference |
556 |
6,278 |
|||||
Balance at December 31, |
$ |
— |
$ |
824 |
|||
The allowance for loan losses recorded on the purchased credit-impaired loan portfolio at December 31, 2015 and 2014 was $3 million and $4 million, respectively. The following table reflects the ending and unpaid balances of all contractually required payments and carrying amounts of the acquired loans by acquisition at December 31, 2015 and 2014:
115
December 31, 2015 |
December 31, 2014 |
||||||||||||||
(dollar amounts in thousands) |
Ending Balance |
Unpaid Balance |
Ending Balance |
Unpaid Balance |
|||||||||||
Fidelity Bank |
|||||||||||||||
Commercial and industrial |
$ |
21,017 |
$ |
30,676 |
$ |
22,405 |
$ |
33,622 |
|||||||
Commercial real estate |
13,758 |
55,358 |
36,663 |
87,250 |
|||||||||||
Residential mortgage |
1,454 |
2,189 |
1,912 |
3,096 |
|||||||||||
Other consumer |
52 |
101 |
51 |
123 |
|||||||||||
Total |
$ |
36,281 |
$ |
88,324 |
$ |
61,031 |
$ |
124,091 |
|||||||
Camco Financial |
|||||||||||||||
Commercial and industrial |
$ |
— |
$ |
— |
$ |
823 |
$ |
1,685 |
|||||||
Commercial real estate |
— |
— |
1,708 |
3,826 |
|||||||||||
Residential mortgage |
— |
— |
— |
— |
|||||||||||
Other consumer |
— |
— |
— |
— |
|||||||||||
Total |
$ |
— |
$ |
— |
$ |
2,531 |
$ |
5,511 |
|||||||
Loan Purchases and Sales
The following table summarizes significant portfolio loan purchase and sale activity for the years ended December 31, 2015 and 2014. The table below excludes mortgage loans originated for sale.
|
Commercial
and Industrial
|
Commercial
Real Estate
|
Automobile |
(1) |
Home
Equity
|
Residential
Mortgage
|
Other
Consumer
|
Total |
||||||||||||||||||||
(dollar amounts in thousands) |
|||||||||||||||||||||||||||
Portfolio loans purchased during the: | |||||||||||||||||||||||||||
Year ended December 31, 2015 |
$ |
316,252 |
$ |
— |
$ |
— |
$ |
— |
$ |
20,463 |
$ |
— |
$ |
336,715 |
|||||||||||||
Year ended December 31, 2014 |
326,557 |
— |
— |
— |
18,482 |
— |
345,039 |
||||||||||||||||||||
Portfolio loans sold or transferred to loans held for sale during the: | |||||||||||||||||||||||||||
Year ended December 31, 2015 |
380,713 |
— |
764,540 |
96,786 |
— |
— |
1,242,039 |
||||||||||||||||||||
Year ended December 31, 2014 |
352,062 |
8,447 |
— |
— |
— |
7,592 |
368,101 |
||||||||||||||||||||
(1) Reflects the transfer of approximately $1.0 billion of automobile loans to loans held-for-sale at March 31, 2015, net of approximately $262 million of automobile loans transferred to loans and leases in the 2015 second quarter.
116
NALs and Past Due Loans
The following table presents NALs by loan class for the years ended December 31, 2015 and 2014:
December 31, |
|||||||
(dollar amounts in thousands) |
2015 |
2014 |
|||||
Commercial and industrial: |
|||||||
Owner occupied |
$ |
35,481 |
$ |
41,285 |
|||
Other commercial and industrial |
139,714 |
30,689 |
|||||
Total commercial and industrial |
175,195 |
71,974 |
|||||
Commercial real estate: |
|||||||
Retail properties |
7,217 |
21,385 |
|||||
Multi family |
5,819 |
9,743 |
|||||
Office |
10,495 |
7,707 |
|||||
Industrial and warehouse |
2,202 |
3,928 |
|||||
Other commercial real estate |
3,251 |
5,760 |
|||||
Total commercial real estate |
28,984 |
48,523 |
|||||
Automobile |
6,564 |
4,623 |
|||||
Home equity: |
|||||||
Secured by first-lien |
35,389 |
46,938 |
|||||
Secured by junior-lien |
30,889 |
31,622 |
|||||
Total home equity |
66,278 |
78,560 |
|||||
Residential mortgage |
94,560 |
96,564 |
|||||
Other consumer |
— |
— |
|||||
Total nonaccrual loans |
$ |
371,581 |
$ |
300,244 |
|||
The amount of interest that would have been recorded under the original terms for total NAL loans was $20 million, $21 million, and $23 million for 2015, 2014, and 2013, respectively. The total amount of interest recorded to interest income for these loans was $10 million, $8 million, and $5 million in 2015, 2014, and 2013, respectively.
The following table presents an aging analysis of loans and leases, including past due loans and leases, by loan class for the years ended December 31, 2015 and 2014 (1):
117
December 31, 2015 |
||||||||||||||||||||||||||||
Past Due |
Total Loans and Leases |
90 or more days past due and accruing |
||||||||||||||||||||||||||
(dollar amounts in thousands) |
30-59 Days |
60-89 Days |
90 or more days |
Total |
Current |
|||||||||||||||||||||||
Commercial and industrial: |
||||||||||||||||||||||||||||
Owner occupied |
$ |
11,947 |
$ |
3,613 |
$ |
13,793 |
$ |
29,353 |
$ |
3,983,447 |
$ |
4,012,800 |
$ |
— |
||||||||||||||
Purchased credit-impaired |
292 |
1,436 |
5,949 |
7,677 |
13,340 |
21,017 |
5,949 |
(3) |
||||||||||||||||||||
Other commercial and industrial |
32,476 |
8,531 |
27,236 |
68,243 |
16,457,774 |
16,526,017 |
2,775 |
(2) |
||||||||||||||||||||
Total commercial and industrial |
44,715 |
13,580 |
46,978 |
105,273 |
20,454,561 |
20,559,834 |
8,724 |
|||||||||||||||||||||
Commercial real estate: |
||||||||||||||||||||||||||||
Retail properties |
1,823 |
195 |
3,637 |
5,655 |
1,501,054 |
1,506,709 |
— |
|||||||||||||||||||||
Multi family |
961 |
1,137 |
2,691 |
4,789 |
1,073,429 |
1,078,218 |
— |
|||||||||||||||||||||
Office |
5,022 |
256 |
3,016 |
8,294 |
886,331 |
894,625 |
— |
|||||||||||||||||||||
Industrial and warehouse |
93 |
— |
373 |
466 |
503,701 |
504,167 |
— |
|||||||||||||||||||||
Purchased credit-impaired |
102 |
3,818 |
9,549 |
13,469 |
289 |
13,758 |
9,549 |
(3) |
||||||||||||||||||||
Other commercial real estate |
1,231 |
315 |
2,400 |
3,946 |
1,267,228 |
1,271,174 |
— |
|||||||||||||||||||||
Total commercial real estate |
9,232 |
5,721 |
21,666 |
36,619 |
5,232,032 |
5,268,651 |
9,549 |
|||||||||||||||||||||
Automobile |
69,553 |
14,965 |
7,346 |
91,864 |
9,388,814 |
9,480,678 |
7,162 |
|||||||||||||||||||||
Home equity: |
||||||||||||||||||||||||||||
Secured by first-lien |
18,349 |
7,576 |
26,304 |
52,229 |
5,139,256 |
5,191,485 |
4,499 |
|||||||||||||||||||||
Secured by junior-lien |
18,128 |
9,329 |
29,996 |
57,453 |
3,221,544 |
3,278,997 |
4,545 |
|||||||||||||||||||||
Total home equity |
36,477 |
16,905 |
56,300 |
109,682 |
8,360,800 |
8,470,482 |
9,044 |
|||||||||||||||||||||
Residential mortgage: |
||||||||||||||||||||||||||||
Residential mortgage |
102,670 |
34,298 |
119,354 |
256,322 |
5,740,624 |
5,996,946 |
69,917 |
(4) |
||||||||||||||||||||
Purchased credit-impaired |
103 |
— |
— |
103 |
1,351 |
1,454 |
— |
|||||||||||||||||||||
Total residential mortgage |
102,773 |
34,298 |
119,354 |
256,425 |
5,741,975 |
5,998,400 |
69,917 |
|||||||||||||||||||||
Other consumer: |
||||||||||||||||||||||||||||
Other consumer |
6,469 |
1,852 |
1,395 |
9,716 |
553,286 |
563,002 |
1,394 |
|||||||||||||||||||||
Purchased credit-impaired |
— |
— |
— |
— |
52 |
52 |
— |
|||||||||||||||||||||
Total other consumer |
6,469 |
1,852 |
1,395 |
9,716 |
553,338 |
563,054 |
1,394 |
|||||||||||||||||||||
Total loans and leases |
$ |
269,219 |
$ |
87,321 |
$ |
253,039 |
$ |
609,579 |
$ |
49,731,520 |
$ |
50,341,099 |
$ |
105,790 |
||||||||||||||
118
December 31, 2014 |
||||||||||||||||||||||||||||
Past Due |
Total Loans and Leases |
90 or more days past due and accruing |
||||||||||||||||||||||||||
(dollar amounts in thousands) |
30-59 Days |
60-89 Days |
90 or more days |
Total |
Current |
|||||||||||||||||||||||
Commercial and industrial: |
||||||||||||||||||||||||||||
Owner occupied |
$ |
5,232 |
$ |
2,981 |
$ |
18,222 |
$ |
26,435 |
$ |
4,228,440 |
$ |
4,254,875 |
$ |
— |
||||||||||||||
Purchased credit-impaired |
846 |
— |
4,937 |
5,783 |
17,445 |
23,228 |
4,937 |
(3) |
||||||||||||||||||||
Other commercial and industrial |
15,330 |
1,536 |
9,101 |
25,967 |
14,729,076 |
14,755,043 |
— |
|||||||||||||||||||||
Total commercial and industrial |
21,408 |
4,517 |
32,260 |
58,185 |
18,974,961 |
19,033,146 |
4,937 |
|||||||||||||||||||||
Commercial real estate: |
||||||||||||||||||||||||||||
Retail properties |
7,866 |
— |
4,021 |
11,887 |
1,345,859 |
1,357,746 |
— |
|||||||||||||||||||||
Multi family |
1,517 |
312 |
3,337 |
5,166 |
1,085,250 |
1,090,416 |
— |
|||||||||||||||||||||
Office |
464 |
1,167 |
4,415 |
6,046 |
974,257 |
980,303 |
— |
|||||||||||||||||||||
Industrial and warehouse |
688 |
— |
2,649 |
3,337 |
510,064 |
513,401 |
— |
|||||||||||||||||||||
Purchased credit-impaired |
89 |
289 |
18,793 |
19,171 |
19,200 |
38,371 |
18,793 |
(3) |
||||||||||||||||||||
Other commercial real estate |
847 |
1,281 |
3,966 |
6,094 |
1,211,072 |
1,217,166 |
— |
|||||||||||||||||||||
Total commercial real estate |
11,471 |
3,049 |
37,181 |
51,701 |
5,145,702 |
5,197,403 |
18,793 |
|||||||||||||||||||||
Automobile |
56,272 |
10,427 |
5,963 |
72,662 |
8,617,240 |
8,689,902 |
5,703 |
|||||||||||||||||||||
Home equity |
||||||||||||||||||||||||||||
Secured by first-lien |
15,036 |
8,085 |
33,014 |
56,135 |
5,072,669 |
5,128,804 |
4,471 |
|||||||||||||||||||||
Secured by junior-lien |
22,473 |
12,297 |
33,406 |
68,176 |
3,293,935 |
3,362,111 |
7,688 |
|||||||||||||||||||||
Total home equity |
37,509 |
20,382 |
66,420 |
124,311 |
8,366,604 |
8,490,915 |
12,159 |
|||||||||||||||||||||
Residential mortgage |
||||||||||||||||||||||||||||
Residential mortgage |
102,702 |
42,009 |
139,379 |
284,090 |
5,544,607 |
5,828,697 |
88,052 |
(5) |
||||||||||||||||||||
Purchased credit-impaired |
— |
— |
— |
— |
1,912 |
1,912 |
— |
|||||||||||||||||||||
Total residential mortgage |
102,702 |
42,009 |
139,379 |
284,090 |
5,546,519 |
5,830,609 |
88,052 |
|||||||||||||||||||||
Other consumer |
||||||||||||||||||||||||||||
Other consumer |
5,491 |
1,086 |
837 |
7,414 |
406,286 |
413,700 |
837 |
|||||||||||||||||||||
Purchased credit-impaired |
— |
— |
— |
— |
51 |
51 |
— |
|||||||||||||||||||||
Total other consumer |
5,491 |
1,086 |
837 |
7,414 |
406,337 |
413,751 |
837 |
|||||||||||||||||||||
Total loans and leases |
$ |
234,853 |
$ |
81,470 |
$ |
282,040 |
$ |
598,363 |
$ |
47,057,363 |
$ |
47,655,726 |
$ |
130,481 |
||||||||||||||
(1) |
NALs are included in this aging analysis based on the loan’s past due status. |
(2) |
Amounts include Huntington Technology Finance administrative lease delinquencies. |
(3) |
Amounts represent accruing purchased impaired loans related to acquisitions. Under the applicable accounting guidance (ASC 310-30), the loans were recorded at fair value upon acquisition and remain in accruing status. |
(4) |
Includes $56 million guaranteed by the U.S. government.
|
(5) |
Includes $55 million guaranteed by the U.S. government.
|
Allowance for Credit Losses
The ACL is increased through a provision for credit losses that is charged to earnings, based on Management’s quarterly evaluation of the factors disclosed in Note 1. Significant Accounting Policies and is reduced by charge-offs, net of recoveries, and the ACL associated with securitized or sold loans.
During the 2015 first quarter, we reviewed our existing commercial and consumer credit models and enhanced certain processes and methods of ACL estimation. During this review, we analyzed the loss emergence periods used for consumer receivables collectively evaluated for impairment and, as a result, extended our loss emergence periods for products within these portfolios. As part of these enhancements to our credit reserve process, we also evaluated the methods used to separately estimate economic risks inherent in our portfolios and decided to no longer utilize these separate estimation techniques. Rather, we now incorporate economic risks in our loss estimates elsewhere in our reserve calculation. The enhancements made to our credit reserve processes during the quarter allow for increased segmentation and analysis of the estimated incurred losses within our loan portfolios. The net ACL impact of these enhancements was immaterial.
119
During the 2015 third quarter, we reviewed our existing commercial and consumer credit models and completed a periodic reassessment of certain ACL assumptions. Specifically, we updated our analysis of the loss emergence periods used for commercial receivables collectively evaluated for impairment. Based on our observed portfolio experience, we extended our loss emergence periods for the C&I portfolio and CRE portfolios. We also updated loss factors in our consumer home equity and residential mortgage portfolios based on more recently observed portfolio experience. The net ACL impact of these enhancements was immaterial.
The following table presents ALLL and AULC activity by portfolio segment for the years ended December 31, 2015, 2014, and 2013:
(dollar amounts in thousands) |
Commercial
and Industrial
|
Commercial
Real Estate
|
Automobile |
Home
Equity
|
Residential
Mortgage
|
Other
Consumer
|
Total |
||||||||||||||||||||
Year ended December 31, 2015: |
|||||||||||||||||||||||||||
ALLL balance, beginning of period |
$ |
286,995 |
$ |
102,839 |
$ |
33,466 |
$ |
96,413 |
$ |
47,211 |
$ |
38,272 |
$ |
605,196 |
|||||||||||||
Loan charge-offs |
(79,724 |
) |
(18,076 |
) |
(36,489 |
) |
(36,481 |
) |
(15,696 |
) |
(31,415 |
) |
(217,881 |
) |
|||||||||||||
Recoveries of loans previously charged-off |
51,800 |
34,619 |
16,198 |
16,631 |
5,570 |
5,270 |
130,088 |
||||||||||||||||||||
Provision (reduction in allowance) for loan and lease losses |
39,675 |
(19,375 |
) |
38,621 |
12,173 |
5,443 |
12,142 |
88,679 |
|||||||||||||||||||
Write-downs of loans sold or transferred to loans held for sale |
— |
— |
(2,292 |
) |
(5,065 |
) |
(882 |
) |
— |
(8,239 |
) |
||||||||||||||||
ALLL balance, end of period |
$ |
298,746 |
$ |
100,007 |
$ |
49,504 |
$ |
83,671 |
$ |
41,646 |
$ |
24,269 |
$ |
597,843 |
|||||||||||||
AULC balance, beginning of period |
$ |
48,988 |
$ |
6,041 |
$ |
— |
$ |
1,924 |
$ |
8 |
$ |
3,845 |
$ |
60,806 |
|||||||||||||
Provision (reduction in allowance) for unfunded loan commitments and letters of credit |
6,898 |
1,521 |
— |
144 |
10 |
2,702 |
11,275 |
||||||||||||||||||||
AULC balance, end of period |
$ |
55,886 |
$ |
7,562 |
$ |
— |
$ |
2,068 |
$ |
18 |
$ |
6,547 |
$ |
72,081 |
|||||||||||||
ACL balance, end of period |
$ |
354,632 |
$ |
107,569 |
$ |
49,504 |
$ |
85,739 |
$ |
41,664 |
$ |
30,816 |
$ |
669,924 |
|||||||||||||
Year ended December 31, 2014: |
|||||||||||||||||||||||||||
ALLL balance, beginning of period |
$ |
265,801 |
$ |
162,557 |
$ |
31,053 |
$ |
111,131 |
$ |
39,577 |
$ |
37,751 |
$ |
647,870 |
|||||||||||||
Loan charge-offs |
(76,654 |
) |
(24,704 |
) |
(31,330 |
) |
(54,473 |
) |
(25,946 |
) |
(33,494 |
) |
(246,601 |
) |
|||||||||||||
Recoveries of loans previously charged-off |
44,531 |
34,071 |
13,762 |
17,526 |
6,194 |
5,890 |
121,974 |
||||||||||||||||||||
Provision (reduction in allowance) for loan and lease losses |
53,317 |
(69,085 |
) |
19,981 |
22,229 |
27,386 |
29,254 |
83,082 |
|||||||||||||||||||
Write-downs of loans sold or transferred to loans held for sale |
— |
— |
— |
— |
— |
(1,129 |
) |
(1,129 |
) |
||||||||||||||||||
ALLL balance, end of period |
$ |
286,995 |
$ |
102,839 |
$ |
33,466 |
$ |
96,413 |
$ |
47,211 |
$ |
38,272 |
$ |
605,196 |
|||||||||||||
AULC balance, beginning of period |
$ |
49,596 |
$ |
9,891 |
$ |
— |
$ |
1,763 |
$ |
9 |
$ |
1,640 |
$ |
62,899 |
|||||||||||||
Provision (reduction in allowance) for unfunded loan commitments and letters of credit |
(608 |
) |
(3,850 |
) |
— |
161 |
(1 |
) |
2,205 |
(2,093 |
) |
||||||||||||||||
AULC balance, end of period |
$ |
48,988 |
$ |
6,041 |
$ |
— |
$ |
1,924 |
$ |
8 |
$ |
3,845 |
$ |
60,806 |
|||||||||||||
ACL balance, end of period |
$ |
335,983 |
$ |
108,880 |
$ |
33,466 |
$ |
98,337 |
$ |
47,219 |
$ |
42,117 |
$ |
666,002 |
|||||||||||||
(dollar amounts in thousands) |
|||||||||||||||||||||||||||
Year Ended December 31, 2013: |
|||||||||||||||||||||||||||
ALLL balance, beginning of period |
$ |
241,051 |
$ |
285,369 |
$ |
34,979 |
$ |
118,764 |
$ |
61,658 |
$ |
27,254 |
$ |
769,075 |
|||||||||||||
Loan charge-offs |
(45,904 |
) |
(69,512 |
) |
(23,912 |
) |
(98,184 |
) |
(34,236 |
) |
(34,568 |
) |
(306,316 |
) |
|||||||||||||
Recoveries of loans previously charged-off |
29,514 |
44,658 |
13,375 |
15,921 |
7,074 |
7,108 |
117,650 |
||||||||||||||||||||
Provision (reduction in allowance) for loan and lease losses |
41,140 |
(97,958 |
) |
6,611 |
74,630 |
5,417 |
37,957 |
67,797 |
|||||||||||||||||||
Write-downs of loans sold or transferred to loans held for sale |
— |
— |
— |
— |
(336 |
) |
— |
(336 |
) |
||||||||||||||||||
ALLL balance, end of period |
$ |
265,801 |
$ |
162,557 |
$ |
31,053 |
$ |
111,131 |
$ |
39,577 |
$ |
37,751 |
$ |
647,870 |
|||||||||||||
AULC balance, beginning of period |
$ |
33,868 |
$ |
4,740 |
$ |
— |
$ |
1,356 |
$ |
3 |
$ |
684 |
$ |
40,651 |
|||||||||||||
Provision (reduction in allowance) for unfunded loan commitments and letters of credit |
15,728 |
5,151 |
— |
407 |
6 |
956 |
22,248 |
||||||||||||||||||||
AULC balance, end of period |
$ |
49,596 |
$ |
9,891 |
$ |
— |
$ |
1,763 |
$ |
9 |
$ |
1,640 |
$ |
62,899 |
|||||||||||||
ACL balance, end of period |
$ |
315,397 |
$ |
172,448 |
$ |
31,053 |
$ |
112,894 |
$ |
39,586 |
$ |
39,391 |
$ |
710,769 |
|||||||||||||
Credit Quality Indicators
To facilitate the monitoring of credit quality for C&I and CRE loans, and for purposes of determining an appropriate ACL level for these loans, Huntington utilizes the following categories of credit grades:
Pass - Higher quality loans that do not fit any of the other categories described below.
120
OLEM - The credit risk may be relatively minor yet represent a risk given certain specific circumstances. If the potential weaknesses are not monitored or mitigated, the loan may weaken or the collateral may be inadequate to protect Huntington’s position in the future. For these reasons, Huntington considers the loans to be potential problem loans.
Substandard - Inadequately protected loans by the borrower’s ability to repay, equity, and/or the collateral pledged to secure the loan. These loans have identified weaknesses that could hinder normal repayment or collection of the debt. It is likely Huntington will sustain some loss if any identified weaknesses are not mitigated.
Doubtful - Loans that have all of the weaknesses inherent in those loans classified as Substandard, with the added elements of the full collection of the loan is improbable and that the possibility of loss is high.
The categories above, which are derived from standard regulatory rating definitions, are assigned upon initial approval of the loan or lease and subsequently updated as appropriate.
Commercial loans categorized as OLEM, Substandard, or Doubtful are considered Criticized loans. Commercial loans categorized as Substandard or Doubtful are also considered Classified loans.
For all classes within all consumer loan portfolios, each loan is assigned a specific PD factor that is partially based on the borrower’s most recent credit bureau score, which we update quarterly. A credit bureau score is a credit score developed by Fair Isaac
Corporation based on data provided by the credit bureaus. The credit bureau score is widely accepted as the standard measure of consumer credit risk used by lenders, regulators, rating agencies, and consumers. The higher the credit bureau score, the higher likelihood of repayment and therefore, an indicator of higher credit quality.
Huntington assesses the risk in the loan portfolio by utilizing numerous risk characteristics. The classifications described above, and also presented in the table below, represent one of those characteristics that are closely monitored in the overall credit risk management processes.
121
The following table presents each loan and lease class by credit quality indicator for the years ended December 31, 2015 and 2014:
December 31, 2015 |
|||||||||||||||||||
Credit Risk Profile by UCS Classification |
|||||||||||||||||||
(dollar amounts in thousands) |
Pass |
OLEM |
Substandard |
Doubtful |
Total |
||||||||||||||
Commercial and industrial: |
|||||||||||||||||||
Owner occupied |
$ |
3,731,113 |
$ |
114,490 |
$ |
165,301 |
$ |
1,896 |
$ |
4,012,800 |
|||||||||
Purchased credit-impaired |
3,051 |
674 |
15,661 |
1,631 |
21,017 |
||||||||||||||
Other commercial and industrial |
15,523,625 |
284,175 |
714,615 |
3,602 |
16,526,017 |
||||||||||||||
Total commercial and industrial |
19,257,789 |
399,339 |
895,577 |
7,129 |
20,559,834 |
||||||||||||||
Commercial real estate: |
|||||||||||||||||||
Retail properties |
1,473,014 |
10,865 |
22,830 |
— |
1,506,709 |
||||||||||||||
Multi family |
1,029,138 |
28,862 |
19,898 |
320 |
1,078,218 |
||||||||||||||
Office |
822,824 |
35,350 |
36,011 |
440 |
894,625 |
||||||||||||||
Industrial and warehouse |
493,402 |
259 |
10,450 |
56 |
504,167 |
||||||||||||||
Purchased credit-impaired |
7,194 |
397 |
6,167 |
— |
13,758 |
||||||||||||||
Other commercial real estate |
1,240,482 |
4,054 |
25,811 |
827 |
1,271,174 |
||||||||||||||
Total commercial real estate |
$ |
5,066,054 |
$ |
79,787 |
$ |
121,167 |
$ |
1,643 |
$ |
5,268,651 |
|||||||||
Credit Risk Profile by FICO Score (1) |
|||||||||||||||||||
750+ |
650-749 |
<650 |
Other (2) |
Total |
|||||||||||||||
Automobile |
$ |
4,680,684 |
$ |
3,454,585 |
$ |
1,086,914 |
$ |
258,495 |
$ |
9,480,678 |
|||||||||
Home equity: |
|||||||||||||||||||
Secured by first-lien |
3,369,657 |
1,441,574 |
258,328 |
121,926 |
5,191,485 |
||||||||||||||
Secured by junior-lien |
1,841,084 |
1,024,851 |
323,998 |
89,064 |
3,278,997 |
||||||||||||||
Total home equity |
5,210,741 |
2,466,425 |
582,326 |
210,990 |
8,470,482 |
||||||||||||||
Residential mortgage: |
|||||||||||||||||||
Residential mortgage |
3,563,683 |
1,813,002 |
567,688 |
52,573 |
5,996,946 |
||||||||||||||
Purchased credit-impaired |
381 |
777 |
296 |
— |
1,454 |
||||||||||||||
Total residential mortgage |
3,564,064 |
1,813,779 |
567,984 |
52,573 |
5,998,400 |
||||||||||||||
Other consumer: |
|||||||||||||||||||
Other consumer |
233,969 |
269,694 |
49,650 |
9,689 |
563,002 |
||||||||||||||
Purchased credit-impaired |
— |
52 |
— |
— |
52 |
||||||||||||||
Total other consumer |
$ |
233,969 |
$ |
269,746 |
$ |
49,650 |
$ |
9,689 |
$ |
563,054 |
|||||||||
122
December 31, 2014 |
|||||||||||||||||||
Credit Risk Profile by UCS Classification |
|||||||||||||||||||
(dollar amounts in thousands) |
Pass |
OLEM |
Substandard |
Doubtful |
Total |
||||||||||||||
Commercial and industrial: |
|||||||||||||||||||
Owner occupied |
$ |
3,959,046 |
$ |
117,637 |
$ |
175,767 |
$ |
2,425 |
$ |
4,254,875 |
|||||||||
Purchased credit-impaired |
3,915 |
741 |
14,901 |
3,671 |
23,228 |
||||||||||||||
Other commercial and industrial |
13,925,334 |
386,666 |
440,036 |
3,007 |
14,755,043 |
||||||||||||||
Total commercial and industrial |
17,888,295 |
505,044 |
630,704 |
9,103 |
19,033,146 |
||||||||||||||
Commercial real estate: |
|||||||||||||||||||
Retail properties |
1,279,064 |
10,204 |
67,911 |
567 |
1,357,746 |
||||||||||||||
Multi family |
1,044,521 |
12,608 |
32,322 |
965 |
1,090,416 |
||||||||||||||
Office |
902,474 |
33,107 |
42,578 |
2,144 |
980,303 |
||||||||||||||
Industrial and warehouse |
487,454 |
7,877 |
17,781 |
289 |
513,401 |
||||||||||||||
Purchased credit-impaired |
6,914 |
803 |
25,460 |
5,194 |
38,371 |
||||||||||||||
Other commercial real estate |
1,166,293 |
9,635 |
40,019 |
1,219 |
1,217,166 |
||||||||||||||
Total commercial real estate |
$ |
4,886,720 |
$ |
74,234 |
$ |
226,071 |
$ |
10,378 |
$ |
5,197,403 |
|||||||||
Credit Risk Profile by FICO Score (1) |
|||||||||||||||||||
750+ |
650-749 |
<650 |
Other (2) |
Total |
|||||||||||||||
Automobile |
$ |
4,165,811 |
$ |
3,249,141 |
$ |
1,028,381 |
$ |
246,569 |
$ |
8,689,902 |
|||||||||
Home equity: |
|||||||||||||||||||
Secured by first-lien |
3,255,088 |
1,426,191 |
283,152 |
164,373 |
5,128,804 |
||||||||||||||
Secured by junior-lien |
1,832,663 |
1,095,332 |
348,825 |
85,291 |
3,362,111 |
||||||||||||||
Total home equity |
5,087,751 |
2,521,523 |
631,977 |
249,664 |
8,490,915 |
||||||||||||||
Residential mortgage |
|||||||||||||||||||
Residential mortgage |
3,285,310 |
1,785,137 |
666,562 |
91,688 |
5,828,697 |
||||||||||||||
Purchased credit-impaired |
594 |
1,135 |
183 |
— |
1,912 |
||||||||||||||
Total residential mortgage |
3,285,904 |
1,786,272 |
666,745 |
91,688 |
5,830,609 |
||||||||||||||
Other consumer |
|||||||||||||||||||
Other consumer |
195,128 |
187,781 |
30,582 |
209 |
413,700 |
||||||||||||||
Purchased credit-impaired |
— |
51 |
— |
— |
51 |
||||||||||||||
Total other consumer |
$ |
195,128 |
$ |
187,832 |
$ |
30,582 |
$ |
209 |
$ |
413,751 |
|||||||||
(1) |
Reflects most recent customer credit scores. |
(2) |
Reflects deferred fees and costs, loans in process, loans to legal entities, etc. |
Impaired Loans
For all classes within the C&I and CRE portfolios, all loans with an outstanding balance of $1 million or greater are considered for individual evaluation on a quarterly basis for impairment . Generally, consumer loans within any class are not individually evaluated on a regular basis for impairment. However, certain home equity and residential mortgage loans are measured for impairment based on the underlying collateral value. All TDRs, regardless of the outstanding balance amount, are also considered to be impaired. Loans acquired with evidence of deterioration of credit quality since origination for which it is probable at acquisition that all contractually required payments will not be collected are also considered to be impaired.
Once a loan has been identified for an assessment of impairment, the loan is considered impaired when, based on current information and events, it is probable that all amounts due according to the contractual terms of the loan agreement will not be collected. This determination requires significant judgment and use of estimates, and the eventual outcome may differ significantly from those estimates.
The following tables present the balance of the ALLL attributable to loans by portfolio segment individually and collectively evaluated for impairment and the related loan and lease balance for the years ended December 31, 2015 and 2014 (1):
123
(dollar amounts in thousands) |
Commercial
and
Industrial
|
Commercial
Real Estate
|
Automobile |
Home
Equity
|
Residential
Mortgage
|
Other
Consumer
|
Total |
||||||||||||||||||||
ALL at December 31, 2015: |
|||||||||||||||||||||||||||
Portion of ALLL balance: |
|||||||||||||||||||||||||||
Attributable to purchased credit-impaired loans |
$ |
2,602 |
$ |
— |
$ |
— |
$ |
— |
$ |
127 |
$ |
— |
$ |
2,729 |
|||||||||||||
Attributable to loans individually evaluated for impairment |
19,314 |
8,114 |
1,779 |
16,242 |
16,811 |
176 |
62,436 |
||||||||||||||||||||
Attributable to loans collectively evaluated for impairment |
276,830 |
91,893 |
47,725 |
67,429 |
24,708 |
24,093 |
532,678 |
||||||||||||||||||||
Total ALLL balance |
$ |
298,746 |
$ |
100,007 |
$ |
49,504 |
$ |
83,671 |
$ |
41,646 |
$ |
24,269 |
$ |
597,843 |
|||||||||||||
Loan and Lease Ending Balances at December 31, 2015: |
|||||||||||||||||||||||||||
Portion of loan and lease ending balance: |
|||||||||||||||||||||||||||
Attributable to purchased credit-impaired loans |
$ |
21,017 |
$ |
13,758 |
$ |
— |
$ |
— |
$ |
1,454 |
$ |
52 |
$ |
36,281 |
|||||||||||||
Individually evaluated for impairment |
481,033 |
144,977 |
31,304 |
248,839 |
366,995 |
4,640 |
1,277,788 |
||||||||||||||||||||
Collectively evaluated for impairment |
20,057,784 |
5,109,916 |
9,449,374 |
8,221,643 |
5,629,951 |
558,362 |
49,027,030 |
||||||||||||||||||||
Total loans and leases evaluated for impairment |
$ |
20,559,834 |
$ |
5,268,651 |
$ |
9,480,678 |
$ |
8,470,482 |
$ |
5,998,400 |
$ |
563,054 |
$ |
50,341,099 |
|||||||||||||
Portion of ending balance of impaired loans: |
|||||||||||||||||||||||||||
With allowance assigned to the loan and lease balances |
$ |
246,249 |
$ |
90,475 |
$ |
31,304 |
$ |
248,839 |
$ |
368,449 |
$ |
4,640 |
$ |
989,956 |
|||||||||||||
With no allowance assigned to the loan and lease balances |
255,801 |
68,260 |
— |
— |
— |
52 |
324,113 |
||||||||||||||||||||
Total |
$ |
502,050 |
$ |
158,735 |
$ |
31,304 |
$ |
248,839 |
$ |
368,449 |
$ |
4,692 |
$ |
1,314,069 |
|||||||||||||
Average balance of impaired loans |
$ |
382,051 |
$ |
202,192 |
$ |
30,163 |
$ |
292,014 |
$ |
373,573 |
$ |
4,726 |
$ |
1,284,719 |
|||||||||||||
ALLL on impaired loans |
21,916 |
8,114 |
1,779 |
16,242 |
16,938 |
176 |
65,165 |
||||||||||||||||||||
(dollar amounts in thousands) |
Commercial
and
Industrial
|
Commercial
Real Estate
|
Automobile |
Home
Equity
|
Residential
Mortgage
|
Other
Consumer
|
Total |
||||||||||||||||||||
ALLL at December 31, 2014 |
|||||||||||||||||||||||||||
Portion of ALLL balance: |
|||||||||||||||||||||||||||
Attributable to purchased credit-impaired loans |
$ |
3,846 |
$ |
— |
$ |
— |
$ |
— |
$ |
8 |
$ |
245 |
$ |
4,099 |
|||||||||||||
Attributable to loans individually evaluated for impairment |
11,049 |
18,887 |
1,531 |
26,027 |
16,535 |
214 |
74,243 |
||||||||||||||||||||
Attributable to loans collectively evaluated for impairment |
272,100 |
83,952 |
31,935 |
70,386 |
30,668 |
37,813 |
526,854 |
||||||||||||||||||||
Total ALLL balance: |
$ |
286,995 |
$ |
102,839 |
$ |
33,466 |
$ |
96,413 |
$ |
47,211 |
$ |
38,272 |
$ |
605,196 |
|||||||||||||
Loan and Lease Ending Balances at December 31, 2014 |
|||||||||||||||||||||||||||
Portion of loan and lease ending balances: |
|||||||||||||||||||||||||||
Attributable to purchased credit-impaired loans |
$ |
23,228 |
$ |
38,371 |
$ |
— |
$ |
— |
$ |
1,912 |
$ |
51 |
$ |
63,562 |
|||||||||||||
Individually evaluated for impairment |
216,993 |
217,262 |
30,612 |
310,446 |
369,577 |
4,088 |
1,148,978 |
||||||||||||||||||||
Collectively evaluated for impairment |
18,792,925 |
4,941,770 |
8,659,290 |
8,180,469 |
5,459,120 |
409,612 |
46,443,186 |
||||||||||||||||||||
Total loans and leases evaluated for impairment |
$ |
19,033,146 |
$ |
5,197,403 |
$ |
8,689,902 |
$ |
8,490,915 |
$ |
5,830,609 |
$ |
413,751 |
$ |
47,655,726 |
|||||||||||||
Portion of ending balance: |
|||||||||||||||||||||||||||
With allowance assigned to the loan and lease balances |
$ |
202,376 |
$ |
144,162 |
$ |
30,612 |
$ |
310,446 |
$ |
371,489 |
$ |
4,139 |
$ |
1,063,224 |
|||||||||||||
With no allowance assigned to the loan and lease balances |
37,845 |
111,471 |
— |
— |
— |
— |
149,316 |
||||||||||||||||||||
Total |
$ |
240,221 |
$ |
255,633 |
$ |
30,612 |
$ |
310,446 |
$ |
371,489 |
$ |
4,139 |
$ |
1,212,540 |
|||||||||||||
Average balance of impaired loans |
$ |
174,316 |
$ |
511,590 |
$ |
34,637 |
$ |
258,881 |
$ |
384,026 |
$ |
2,879 |
$ |
1,366,329 |
|||||||||||||
ALLL on impaired loans |
14,895 |
18,887 |
1,531 |
26,027 |
16,543 |
459 |
78,342 |
||||||||||||||||||||
The following tables present by class the ending, unpaid principal balance, and the related ALLL, along with the average balance and interest income recognized only for loans and leases individually evaluated for impairment and purchased credit-impaired loans for the years ended December 31, 2015 and 2014 (1), (2):
124
Year Ended |
|||||||||||||||||||
December 31, 2015 |
December 31, 2015 |
||||||||||||||||||
(dollar amounts in thousands) |
Ending
Balance
|
Unpaid
Principal
Balance (5)
|
Related
Allowance
|
Average
Balance
|
Interest
Income
Recognized
|
||||||||||||||
With no related allowance recorded: |
|||||||||||||||||||
Commercial and industrial: |
|||||||||||||||||||
Owner occupied |
$ |
57,832 |
$ |
65,812 |
$ |
— |
$ |
30,672 |
$ |
520 |
|||||||||
Purchased credit-impaired |
— |
— |
— |
— |
— |
||||||||||||||
Other commercial and industrial |
197,969 |
213,739 |
— |
83,717 |
2,064 |
||||||||||||||
Total commercial and industrial |
255,801 |
279,551 |
$ |
— |
114,389 |
2,584 |
|||||||||||||
Commercial real estate: |
|||||||||||||||||||
Retail properties |
42,009 |
54,021 |
— |
48,903 |
2,031 |
||||||||||||||
Multi family |
— |
— |
— |
— |
— |
||||||||||||||
Office |
9,030 |
12,919 |
— |
7,767 |
309 |
||||||||||||||
Industrial and warehouse |
1,720 |
1,741 |
— |
777 |
47 |
||||||||||||||
Purchased credit-impaired |
13,758 |
55,358 |
— |
28,168 |
4,707 |
||||||||||||||
Other commercial real estate |
1,743 |
1,775 |
— |
2,558 |
105 |
||||||||||||||
Total commercial real estate |
68,260 |
125,814 |
— |
88,173 |
7,199 |
||||||||||||||
Other consumer |
|||||||||||||||||||
Other consumer |
— |
— |
— |
— |
— |
||||||||||||||
Purchased credit-impaired |
52 |
101 |
— |
51 |
17 |
||||||||||||||
Total other consumer |
$ |
52 |
$ |
101 |
$ |
— |
$ |
51 |
$ |
17 |
|||||||||
With an allowance recorded: |
|||||||||||||||||||
Commercial and industrial: (3) |
|||||||||||||||||||
Owner occupied |
$ |
54,092 |
$ |
62,527 |
$ |
4,171 |
$ |
54,785 |
$ |
1,985 |
|||||||||
Purchased credit-impaired |
21,017 |
30,676 |
2,602 |
21,046 |
7,190 |
||||||||||||||
Other commercial and industrial |
171,140 |
181,000 |
15,143 |
191,831 |
5,935 |
||||||||||||||
Total commercial and industrial |
246,249 |
274,203 |
21,916 |
267,662 |
15,110 |
||||||||||||||
Commercial real estate: (4) |
|||||||||||||||||||
Retail properties |
9,096 |
11,121 |
1,190 |
31,636 |
1,204 |
||||||||||||||
Multi family |
34,349 |
37,208 |
1,593 |
17,043 |
740 |
||||||||||||||
Office |
14,365 |
17,350 |
1,177 |
31,148 |
1,301 |
||||||||||||||
Industrial and warehouse |
9,721 |
10,550 |
1,540 |
7,311 |
301 |
||||||||||||||
Purchased credit-impaired |
— |
— |
— |
— |
— |
||||||||||||||
Other commercial real estate |
22,944 |
28,701 |
2,614 |
26,881 |
1,287 |
||||||||||||||
Total commercial real estate |
90,475 |
104,930 |
8,114 |
114,019 |
4,833 |
||||||||||||||
Automobile |
31,304 |
31,878 |
1,779 |
30,163 |
2,224 |
||||||||||||||
Home equity: |
|||||||||||||||||||
Secured by first-lien |
52,672 |
57,224 |
4,359 |
108,942 |
4,186 |
||||||||||||||
Secured by junior-lien |
196,167 |
227,733 |
11,883 |
183,072 |
8,906 |
||||||||||||||
Total home equity |
248,839 |
284,957 |
16,242 |
292,014 |
13,092 |
||||||||||||||
Residential mortgage (6): |
|||||||||||||||||||
Residential mortgage |
366,995 |
408,925 |
16,811 |
371,756 |
12,391 |
||||||||||||||
Purchased credit-impaired |
1,454 |
2,189 |
127 |
1,817 |
498 |
||||||||||||||
Total residential mortgage |
368,449 |
411,114 |
16,938 |
373,573 |
12,889 |
||||||||||||||
Other consumer: |
|||||||||||||||||||
125
Other consumer |
4,640 |
4,649 |
176 |
4,675 |
254 |
||||||||||||||
Purchased credit-impaired |
— |
— |
— |
— |
— |
||||||||||||||
Total other consumer |
$ |
4,640 |
$ |
4,649 |
$ |
176 |
$ |
4,675 |
$ |
254 |
|||||||||
Year Ended |
|||||||||||||||||||
December 31, 2014 |
December 31, 2014 |
||||||||||||||||||
(dollar amounts in thousands) |
Ending
Balance
|
Unpaid
Principal
Balance (5)
|
Related
Allowance
|
Average
Balance
|
Interest
Income
Recognized
|
||||||||||||||
With no related allowance recorded: |
|||||||||||||||||||
Commercial and industrial: |
|||||||||||||||||||
Owner occupied |
$ |
13,536 |
$ |
13,536 |
$ |
— |
$ |
5,740 |
$ |
205 |
|||||||||
Purchased credit-impaired |
— |
— |
— |
— |
— |
||||||||||||||
Other commercial and industrial |
24,309 |
26,858 |
— |
7,536 |
375 |
||||||||||||||
Total commercial and industrial |
37,845 |
40,394 |
— |
13,276 |
580 |
||||||||||||||
Commercial real estate: |
|||||||||||||||||||
Retail properties |
61,915 |
91,627 |
— |
53,121 |
2,454 |
||||||||||||||
Multi family |
— |
— |
— |
— |
— |
||||||||||||||
Office |
1,130 |
3,574 |
— |
3,709 |
311 |
||||||||||||||
Industrial and warehouse |
3,447 |
3,506 |
— |
5,012 |
248 |
||||||||||||||
Purchased credit-impaired |
38,371 |
91,075 |
— |
59,424 |
11,519 |
||||||||||||||
Other commercial real estate |
6,608 |
6,815 |
— |
6,598 |
286 |
||||||||||||||
Total commercial real estate |
111,471 |
196,597 |
— |
127,864 |
14,818 |
||||||||||||||
Automobile |
— |
— |
— |
— |
— |
||||||||||||||
Home equity: |
|||||||||||||||||||
Secured by first-lien |
— |
— |
— |
— |
— |
||||||||||||||
Secured by junior-lien |
— |
— |
— |
— |
— |
||||||||||||||
Total home equity |
— |
— |
— |
— |
— |
||||||||||||||
Residential mortgage: |
|||||||||||||||||||
Residential mortgage |
— |
— |
— |
— |
— |
||||||||||||||
Purchased credit-impaired |
— |
— |
— |
— |
— |
||||||||||||||
Total residential mortgage |
— |
— |
— |
— |
— |
||||||||||||||
Other consumer: |
|||||||||||||||||||
Other consumer |
— |
— |
— |
— |
— |
||||||||||||||
Purchased credit-impaired |
— |
— |
— |
— |
— |
||||||||||||||
Total other consumer |
$ |
— |
$ |
— |
$ |
— |
$ |
— |
$ |
— |
|||||||||
With an allowance recorded: |
|||||||||||||||||||
Commercial and industrial: (3) |
|||||||||||||||||||
Owner occupied |
$ |
44,869 |
$ |
53,639 |
$ |
4,220 |
$ |
40,192 |
$ |
1,557 |
|||||||||
Purchased credit-impaired |
23,228 |
35,307 |
3,846 |
32,253 |
6,973 |
||||||||||||||
Other commercial and industrial |
134,279 |
162,908 |
6,829 |
88,595 |
2,686 |
||||||||||||||
Total commercial and industrial |
202,376 |
251,854 |
14,895 |
161,040 |
11,216 |
||||||||||||||
Commercial real estate: (4) |
|||||||||||||||||||
Retail properties |
37,081 |
38,397 |
3,536 |
63,393 |
1,983 |
||||||||||||||
Multi family |
17,277 |
23,725 |
2,339 |
16,897 |
659 |
||||||||||||||
Office |
52,953 |
56,268 |
8,399 |
52,831 |
2,381 |
||||||||||||||
Industrial and warehouse |
8,888 |
10,396 |
720 |
9,092 |
274 |
||||||||||||||
Purchased credit-impaired |
— |
— |
— |
— |
— |
||||||||||||||
126
Other commercial real estate |
27,963 |
33,472 |
3,893 |
241,513 |
1,831 |
||||||||||||||
Total commercial real estate |
144,162 |
162,258 |
18,887 |
383,726 |
7,128 |
||||||||||||||
Automobile |
30,612 |
32,483 |
1,531 |
34,637 |
2,637 |
||||||||||||||
Home equity: |
|||||||||||||||||||
Secured by first-lien |
145,566 |
157,978 |
8,296 |
126,602 |
5,496 |
||||||||||||||
Secured by junior-lien |
164,880 |
208,118 |
17,731 |
132,279 |
6,379 |
||||||||||||||
Total home equity |
310,446 |
366,096 |
26,027 |
258,881 |
11,875 |
||||||||||||||
Residential mortgage: (6) |
|||||||||||||||||||
Residential mortgage |
369,577 |
415,280 |
16,535 |
381,745 |
11,594 |
||||||||||||||
Purchased credit-impaired |
1,912 |
3,096 |
8 |
2,281 |
574 |
||||||||||||||
Total residential mortgage |
371,489 |
418,376 |
16,543 |
384,026 |
12,168 |
||||||||||||||
Other consumer: |
|||||||||||||||||||
Other consumer |
4,088 |
4,209 |
214 |
2,796 |
202 |
||||||||||||||
Purchased credit-impaired |
51 |
123 |
245 |
83 |
15 |
||||||||||||||
Total other consumer |
$ |
4,139 |
$ |
4,332 |
$ |
459 |
$ |
2,879 |
$ |
217 |
|||||||||
(1) |
These tables do not include loans fully charged-off. |
(2) |
All automobile, home equity, residential mortgage, and other consumer impaired loans included in these tables are considered impaired due to their status as a TDR. |
(3) |
At December 31, 2015, $91 million of the $246 million C&I loans with an allowance recorded were considered impaired due to their status as a TDR. At December 31, 2014, $63 million of the $202 million C&I loans with an allowance recorded were considered impaired due to their status as a TDR.
|
(4) |
At December 31, 2015, $35 million of the $90 million CRE loans with an allowance recorded were considered impaired due to their status as a TDR. At December 31, 2014, $27 million of the $144 million CRE loans with an allowance recorded were considered impaired due to their status as a TDR.
|
(5) |
The differences between the ending balance and unpaid principal balance amounts represent partial charge-offs. |
(6) |
At December 31, 2015, $29 million of the $368 million residential mortgage loans with an allowance recorded were guaranteed by the U.S. government. At December 31, 2014, $24 million of the $371 million residential mortgage loans with an allowance recorded were guaranteed by the U.S. government.
|
TDR Loans
The amount of interest that would have been recorded under the original terms for total accruing TDR loans was $46 million, $45 million, and $44 million for 2015, 2014, and 2013, respectively. The total amount of interest recorded to interest income for these loans was $41 million, $39 million, and $36 million for 2015, 2014, and 2013, respectively.
TDR Concession Types
The Company’s standards relating to loan modifications consider, among other factors, minimum verified income requirements, cash flow analyses, and collateral valuations. Each potential loan modification is reviewed individually and the terms of the loan are modified to meet a borrower’s specific circumstances at a point in time. All commercial TDRs are reviewed and approved by our SAD. The types of concessions provided to borrowers include:
• |
Interest rate reduction: A reduction of the stated interest rate to a nonmarket rate for the remaining original life of the debt. |
• |
Amortization or maturity date change beyond what the collateral supports, including any of the following: |
• |
Lengthens the amortization period of the amortized principal beyond market terms. This concession reduces the minimum monthly payment and could increase the amount of the balloon payment at the end of the term of the loan. Principal is generally not forgiven. |
• |
Reduces the amount of loan principal to be amortized and increases the amount of the balloon payment at the end of the term of the loan. This concession also reduces the minimum monthly payment. Principal is generally not forgiven. |
• |
Extends the maturity date or dates of the debt beyond what the collateral supports. This concession generally applies to loans without a balloon payment at the end of the term of the loan. |
• |
Chapter 7 bankruptcy: A bankruptcy court’s discharge of a borrower’s debt is considered a concession when the borrower does not reaffirm the discharged debt. |
127
• |
Other: A concession that is not categorized as one of the concessions described above. These concessions include, but are not limited to: principal forgiveness, collateral concessions, covenant concessions, and reduction of accrued interest. Principal forgiveness may result from any TDR modification of any concession type. However, the aggregate amount of principal forgiven as a result of loans modified as TDRs during the years ended December 31, 2015 and 2014, was not significant.
|
Following is a description of TDRs by the different loan types:
Commercial loan TDRs – Commercial accruing TDRs often result from loans receiving a concession with terms that are not considered a market transaction to Huntington. The TDR remains in accruing status as long as the customer is less than 90-days past due on payments per the restructured loan terms and no loss is expected.
Commercial nonaccrual TDRs result from either: (1) an accruing commercial TDR being placed on nonaccrual status, or (2) a workout where an existing commercial NAL is restructured and a concession is given. At times, these workouts restructure the NAL so that two or more new notes are created. The primary note is underwritten based upon our normal underwriting standards and is sized so projected cash flows are sufficient to repay contractual principal and interest. The terms on the secondary note(s) vary by situation, and may include notes that defer principal and interest payments until after the primary note is repaid. Creating two or more notes often allows the borrower to continue a project and allows Huntington to right-size a loan based upon the current expectations for a borrower’s or project’s performance.
Our strategy involving TDR borrowers includes working with these borrowers to allow them to refinance elsewhere, as well as allow them time to improve their financial position and remain our customer through refinancing their notes according to market terms and conditions in the future. A subsequent refinancing or modification of a loan may occur when either the loan matures according to the terms of the TDR-modified agreement or the borrower requests a change to the loan agreements. At that time, the loan is evaluated to determine if it is creditworthy. It is subjected to the normal underwriting standards and processes for other similar credit extensions, both new and existing. The refinanced note is evaluated to determine if it is considered a new loan or a continuation of the prior loan. A new loan is considered for removal of the TDR designation, whereas a continuation of the prior note requires a continuation of the TDR designation. In order for a TDR designation to be removed, the borrower must no longer be experiencing financial difficulties and the terms of the refinanced loan must not represent a concession.
Residential Mortgage loan TDRs – Residential mortgage TDRs represent loan modifications associated with traditional first-lien mortgage loans in which a concession has been provided to the borrower. The primary concessions given to residential mortgage borrowers are amortization or maturity date changes and interest rate reductions. Residential mortgages identified as TDRs involve borrowers unable to refinance their mortgages through the Company’s normal mortgage origination channels or through other independent sources. Some, but not all, of the loans may be delinquent.
Automobile, Home Equity, and Other Consumer loan TDRs – The Company may make similar interest rate, term, and principal concessions as with residential mortgage loan TDRs.
TDR Impact on Credit Quality
Huntington’s ALLL is largely determined by updated risk ratings assigned to commercial loans, updated borrower credit scores on consumer loans, and borrower delinquency history in both the commercial and consumer portfolios. These updated risk ratings and credit scores consider the default history of the borrower, including payment redefaults. As such, the provision for credit losses is impacted primarily by changes in borrower payment performance rather than the TDR classification. TDRs can be classified as either accrual or nonaccrual loans. Nonaccrual TDRs are included in NALs whereas accruing TDRs are excluded from NALs as it is probable that all contractual principal and interest due under the restructured terms will be collected.
Our TDRs may include multiple concessions and the disclosure classifications are presented based on the primary concession provided to the borrower. The majority of our concessions for the C&I and CRE portfolios are the extension of the maturity date , but could also include an increase in the interest rate. In these instances, the primary concession is the maturity date extension.
TDR concessions may also result in the reduction of the ALLL within the C&I and CRE portfolios. This reduction is derived from payments and the resulting application of the reserve calculation within the ALLL. The transaction reserve for non-TDR C&I and CRE loans is calculated based upon several estimated probability factors, such as PD and LGD, both of which were previously discussed. Upon the occurrence of a TDR in our C&I and CRE portfolios, the reserve is measured based on discounted expected cash flows or collateral value, less anticipated selling costs, of the modified loan in accordance with ASC 310-10. The resulting TDR ALLL calculation often results in a lower ALLL amount because (1) the discounted expected cash flows or collateral value, less anticipated selling costs, indicate a lower estimated loss, (2) if the modification includes a rate increase, the discounting of the cash flows on the modified loan, using the pre-modification interest rate, exceeds the carrying value of the loan, or (3) payments may occur as part of the modification. The ALLL for C&I and CRE loans may increase as a result of the modification, as the discounted cash flow analysis may indicate additional reserves are required.
TDR concessions on consumer loans may increase the ALLL. The concessions made to these borrowers often include interest rate reductions, and therefore, the TDR ALLL calculation results in a greater ALLL compared with the non-TDR calculation as the
128
reserve is measured based on the estimation of the discounted expected cash flows or collateral value, less anticipated selling costs, on the modified loan in accordance with ASC 310-10. The resulting TDR ALLL calculation often results in a higher ALLL amount because (1) the discounted expected cash flows or collateral value, less anticipated selling costs, indicate a higher estimated loss or, (2) due to the rate decrease, the discounting of the cash flows on the modified loan, using the pre-modification interest rate, indicates a reduction in the present value of expected cash flows or collateral value, less anticipated selling costs. In certain instances, the ALLL may decrease as a result of payments made in connection with the modification.
Commercial loan TDRs – In instances where the bank substantiates that it will collect its outstanding balance in full, the note is considered for return to accrual status upon the borrower showing a sustained period of repayment performance for a six-month period of time. This six-month period could extend before or after the restructure date. If a charge-off was taken as part of the restructuring, any interest or principal payments received on that note are applied to first reduce the bank’s outstanding book balance and then to recoveries of charged-off principal, unpaid interest, and/or fee expenses while the TDR is in nonaccrual status.
Residential Mortgage, Automobile, Home Equity, and Other Consumer loan TDRs – Modified loans identified as TDRs are aggregated into pools for analysis. Cash flows and weighted average interest rates are used to calculate impairment at the pooled-loan level. Once the loans are aggregated into the pool, they continue to be classified as TDRs until contractually repaid or charged-off.
Residential mortgage loans not guaranteed by a U.S. government agency such as the FHA, VA, and the USDA, including TDR loans, are reported as accrual or nonaccrual based upon delinquency status. Nonaccrual TDRs are those that are greater than 150-days contractually past due. Loans guaranteed by U.S. government organizations continue to accrue interest on guaranteed rates upon delinquency.
The following table presents by class and by the reason for the modification the number of contracts, post-modification outstanding balance, and the financial effects of the modification for the years ended December 31, 2015 and 2014:
New Troubled Debt Restructurings During The Year Ended (1) |
|||||||||||||||||||||
December 31, 2015 |
December 31, 2014 |
||||||||||||||||||||
(dollar amounts in thousands) |
Number of
Contracts
|
Post-modification
Outstanding
Ending
Balance
|
Financial effects
of modification(2)
|
Number of
Contracts
|
Post-modification
Outstanding
Balance
|
Financial effects
of modification(2)
|
|||||||||||||||
C&I—Owner occupied: (3) |
|||||||||||||||||||||
Interest rate reduction |
4 |
$ |
372 |
$ |
(3 |
) |
19 |
$ |
2,484 |
$ |
20 |
||||||||||
Amortization or maturity date change |
222 |
103,686 |
(2,089 |
) |
97 |
32,145 |
336 |
||||||||||||||
Other |
4 |
661 |
(22 |
) |
7 |
2,051 |
(36 |
) |
|||||||||||||
Total C&I—Owner occupied |
230 |
104,719 |
(2,114 |
) |
123 |
36,680 |
320 |
||||||||||||||
C&I—Other commercial and industrial: (3) |
|||||||||||||||||||||
Interest rate reduction |
9 |
7,871 |
(1,039 |
) |
25 |
50,534 |
(1,982 |
) |
|||||||||||||
Amortization or maturity date change |
543 |
420,670 |
(3,764 |
) |
285 |
149,339 |
(2,407 |
) |
|||||||||||||
Other |
12 |
29,181 |
(427 |
) |
21 |
7,613 |
(7 |
) |
|||||||||||||
Total C&I—Other commercial and industrial |
564 |
457,722 |
(5,230 |
) |
331 |
207,486 |
(4,396 |
) |
|||||||||||||
CRE—Retail properties: (3) |
|||||||||||||||||||||
Interest rate reduction |
2 |
1,803 |
(11 |
) |
5 |
11,381 |
420 |
||||||||||||||
Amortization or maturity date change |
23 |
16,377 |
(1,658 |
) |
24 |
27,415 |
(267 |
) |
|||||||||||||
Other |
— |
— |
— |
9 |
13,765 |
(35 |
) |
||||||||||||||
Total CRE—Retail properties |
25 |
18,180 |
(1,669 |
) |
38 |
52,561 |
118 |
||||||||||||||
CRE—Multi family: (3) |
|||||||||||||||||||||
Interest rate reduction |
1 |
90 |
— |
20 |
3,484 |
(75 |
) |
||||||||||||||
Amortization or maturity date change |
50 |
35,369 |
(1,843 |
) |
40 |
9,791 |
197 |
||||||||||||||
Other |
8 |
216 |
(6 |
) |
8 |
5,016 |
57 |
||||||||||||||
Total CRE—Multi family |
59 |
35,675 |
(1,849 |
) |
68 |
18,291 |
179 |
||||||||||||||
CRE—Office: (3) |
|||||||||||||||||||||
Interest rate reduction |
1 |
356 |
7 |
2 |
120 |
(1 |
) |
||||||||||||||
Amortization or maturity date change |
30 |
73,148 |
902 |
22 |
18,157 |
(424 |
) |
||||||||||||||
129
Other |
1 |
30 |
(2 |
) |
5 |
35,476 |
(3,153 |
) |
|||||||||||||
Total CRE—Office |
32 |
73,534 |
907 |
29 |
53,753 |
(3,578 |
) |
||||||||||||||
CRE—Industrial and warehouse: (3) |
|||||||||||||||||||||
Interest rate reduction |
— |
— |
— |
2 |
4,046 |
— |
|||||||||||||||
Amortization or maturity date change |
13 |
6,383 |
1,279 |
17 |
9,187 |
164 |
|||||||||||||||
Other |
— |
— |
— |
1 |
977 |
— |
|||||||||||||||
Total CRE—Industrial and Warehouse |
13 |
6,383 |
1,279 |
20 |
14,210 |
164 |
|||||||||||||||
CRE—Other commercial real estate: (3) |
|||||||||||||||||||||
Interest rate reduction |
— |
— |
— |
8 |
5,224 |
146 |
|||||||||||||||
Amortization or maturity date change |
27 |
9,961 |
71 |
55 |
76,353 |
(2,789 |
) |
||||||||||||||
Other |
2 |
234 |
(22 |
) |
4 |
1,809 |
(127 |
) |
|||||||||||||
Total CRE—Other commercial real estate |
29 |
10,195 |
49 |
67 |
83,386 |
(2,770 |
) |
||||||||||||||
Automobile: (3) |
|||||||||||||||||||||
Interest rate reduction |
41 |
121 |
5 |
92 |
758 |
15 |
|||||||||||||||
Amortization or maturity date change |
1,591 |
12,268 |
533 |
1,880 |
12,120 |
151 |
|||||||||||||||
Chapter 7 bankruptcy |
926 |
7,390 |
423 |
625 |
4,938 |
66 |
|||||||||||||||
Other |
— |
— |
— |
— |
— |
— |
|||||||||||||||
Total Automobile |
2,558 |
19,779 |
961 |
2,597 |
17,816 |
232 |
|||||||||||||||
Residential mortgage: (3) |
|||||||||||||||||||||
Interest rate reduction |
15 |
1,565 |
(61 |
) |
27 |
3,692 |
19 |
||||||||||||||
Amortization or maturity date change |
518 |
57,859 |
(455 |
) |
333 |
44,027 |
552 |
||||||||||||||
Chapter 7 bankruptcy |
139 |
14,183 |
(164 |
) |
182 |
18,635 |
715 |
||||||||||||||
Other |
11 |
1,266 |
— |
5 |
526 |
5 |
|||||||||||||||
Total Residential mortgage |
683 |
74,873 |
(680 |
) |
547 |
66,880 |
1,291 |
||||||||||||||
First-lien home equity: (3) |
|||||||||||||||||||||
Interest rate reduction |
37 |
3,665 |
112 |
193 |
15,172 |
764 |
|||||||||||||||
Amortization or maturity date change |
204 |
19,005 |
(953 |
) |
289 |
23,272 |
(1,051 |
) |
|||||||||||||
Chapter 7 bankruptcy |
117 |
7,350 |
428 |
105 |
7,296 |
727 |
|||||||||||||||
Other |
— |
— |
— |
— |
— |
— |
|||||||||||||||
Total First-lien home equity |
358 |
30,020 |
(413 |
) |
587 |
45,740 |
440 |
||||||||||||||
Junior-lien home equity: (3) |
|||||||||||||||||||||
Interest rate reduction |
18 |
734 |
49 |
187 |
6,960 |
296 |
|||||||||||||||
Amortization or maturity date change |
1,387 |
60,018 |
(9,686 |
) |
1,467 |
58,129 |
(6,955 |
) |
|||||||||||||
Chapter 7 bankruptcy |
213 |
2,505 |
3,843 |
201 |
3,014 |
3,141 |
|||||||||||||||
Other |
— |
— |
— |
— |
— |
— |
|||||||||||||||
Total Junior-lien home equity |
1,618 |
63,257 |
(5,794 |
) |
1,855 |
68,103 |
(3,518 |
) |
|||||||||||||
Other consumer: (3) |
|||||||||||||||||||||
Interest rate reduction |
1 |
96 |
3 |
7 |
123 |
3 |
|||||||||||||||
Amortization or maturity date change |
10 |
198 |
8 |
48 |
1,803 |
12 |
|||||||||||||||
Chapter 7 bankruptcy |
11 |
69 |
9 |
25 |
483 |
(50 |
) |
||||||||||||||
Other |
— |
— |
— |
— |
— |
— |
|||||||||||||||
Total Other consumer |
22 |
363 |
20 |
80 |
2,409 |
(35 |
) |
||||||||||||||
Total new troubled debt restructurings |
6,191 |
$ |
894,700 |
$ |
(14,533 |
) |
6,342 |
$ |
667,315 |
$ |
(11,553 |
) |
|||||||||
(1) |
TDRs may include multiple concessions and the disclosure classifications are based on the primary concession provided to the borrower. |
(2) |
Amounts represent the financial impact via provision (recovery) for loan and lease losses as a result of the modification. |
(3) |
Post-modification balances approximate pre-modification balances. The aggregate amount of charge-offs as a result of a restructuring are not significant. |
130
Any loan within any portfolio or class is considered as payment redefaulted at 90-days past due.
The following table presents TDRs that have redefaulted within one year of modification during the years ended December 31, 2015 and 2014:
|
Troubled Debt Restructurings That Have Redefaulted
Within One Year of Modification During The Year Ended
|
|||||||||||||
December 31, 2015 (1) |
December 31, 2014 (1) |
||||||||||||
(dollar amounts in thousands) |
Number of
Contracts
|
Ending
Balance
|
Number of
Contracts
|
Ending
Balance
|
|||||||||
C&I—Owner occupied: |
|||||||||||||
Interest rate reduction |
1 |
$ |
110 |
— |
$ |
— |
|||||||
Amortization or maturity date change |
7 |
1,440 |
6 |
946 |
|||||||||
Other |
— |
— |
1 |
230 |
|||||||||
Total C&I—Owner occupied |
8 |
1,550 |
7 |
1,176 |
|||||||||
C&I—Other commercial and industrial: |
|||||||||||||
Interest rate reduction |
1 |
27 |
1 |
30 |
|||||||||
Amortization or maturity date change |
29 |
3,566 |
14 |
1,555 |
|||||||||
Other |
— |
— |
3 |
37 |
|||||||||
Total C&I—Other commercial and industrial |
30 |
3,593 |
18 |
1,622 |
|||||||||
CRE—Retail Properties: |
|||||||||||||
Interest rate reduction |
1 |
47 |
— |
— |
|||||||||
Amortization or maturity date change |
3 |
8,020 |
1 |
483 |
|||||||||
Other |
— |
— |
— |
— |
|||||||||
Total CRE—Retail properties |
4 |
8,067 |
1 |
483 |
|||||||||
CRE—Multi family: |
|||||||||||||
Interest rate reduction |
— |
— |
— |
— |
|||||||||
Amortization or maturity date change |
10 |
1,354 |
4 |
2,827 |
|||||||||
Other |
1 |
140 |
1 |
176 |
|||||||||
Total CRE—Multi family |
11 |
1,494 |
5 |
3,003 |
|||||||||
CRE—Office: |
|||||||||||||
Interest rate reduction |
— |
— |
— |
— |
|||||||||
Amortization or maturity date change |
3 |
2,984 |
3 |
1,738 |
|||||||||
Other |
— |
— |
— |
— |
|||||||||
Total CRE—Office |
3 |
2,984 |
3 |
1,738 |
|||||||||
CRE—Industrial and Warehouse: |
|||||||||||||
Interest rate reduction |
— |
— |
1 |
1,339 |
|||||||||
Amortization or maturity date change |
2 |
822 |
1 |
756 |
|||||||||
Other |
— |
— |
— |
— |
|||||||||
Total CRE—Industrial and Warehouse |
2 |
822 |
2 |
2,095 |
|||||||||
CRE—Other commercial real estate: |
|||||||||||||
Interest rate reduction |
— |
— |
1 |
169 |
|||||||||
Amortization or maturity date change |
1 |
93 |
2 |
758 |
|||||||||
Other |
— |
— |
— |
— |
|||||||||
Total CRE—Other commercial real estate |
1 |
93 |
3 |
927 |
|||||||||
Automobile: |
|||||||||||||
Interest rate reduction |
1 |
4 |
— |
— |
|||||||||
Amortization or maturity date change |
41 |
423 |
40 |
328 |
|||||||||
Chapter 7 bankruptcy |
21 |
172 |
53 |
374 |
|||||||||
Other |
— |
— |
— |
— |
|||||||||
131
Total Automobile |
63 |
599 |
93 |
702 |
|||||||||
Residential mortgage: |
|||||||||||||
Interest rate reduction |
3 |
239 |
11 |
1,516 |
|||||||||
Amortization or maturity date change |
73 |
6,776 |
82 |
8,974 |
|||||||||
Chapter 7 bankruptcy |
8 |
843 |
37 |
3,187 |
|||||||||
Other |
— |
— |
— |
— |
|||||||||
Total Residential mortgage |
84 |
7,858 |
130 |
13,677 |
|||||||||
First-lien home equity: |
|||||||||||||
Interest rate reduction |
4 |
387 |
5 |
335 |
|||||||||
Amortization or maturity date change |
4 |
258 |
16 |
2,109 |
|||||||||
Chapter 7 bankruptcy |
28 |
2,283 |
16 |
1,005 |
|||||||||
Other |
— |
— |
— |
— |
|||||||||
Total First-lien home equity |
36 |
2,928 |
37 |
3,449 |
|||||||||
Junior-lien home equity: |
|||||||||||||
Interest rate reduction |
3 |
411 |
1 |
11 |
|||||||||
Amortization or maturity date change |
41 |
1,644 |
31 |
1,841 |
|||||||||
Chapter 7 bankruptcy |
18 |
401 |
39 |
620 |
|||||||||
Other |
— |
— |
— |
— |
|||||||||
Total Junior-lien home equity |
62 |
2,456 |
71 |
2,472 |
|||||||||
Other consumer: |
|||||||||||||
Interest rate reduction |
— |
— |
— |
— |
|||||||||
Amortization or maturity date change |
— |
— |
— |
— |
|||||||||
Chapter 7 bankruptcy |
— |
— |
— |
— |
|||||||||
Other |
— |
— |
— |
— |
|||||||||
Total Other consumer |
— |
— |
— |
— |
|||||||||
Total troubled debt restructurings with subsequent redefault |
304 |
$ |
32,444 |
370 |
$ |
31,344 |
|||||||
(1) |
Subsequent redefault is defined as a payment redefault within 12 months of the restructuring date. Payment redefault is defined as 90-days past due for any loan in any portfolio or class. Any loan in any portfolio may be considered to be in payment redefault prior to the guidelines noted above when collection of principal or interest is in doubt.
|
Pledged Loans and Leases
The Bank has access to the Federal Reserve’s discount window and advances from the FHLB – Cincinnati. As of December 31, 2015, these borrowings and advances are secured by $17.5 billion of loans and securities.
On March 31, 2015, Huntington completed its acquisition of Macquarie Equipment Finance, which we have re-branded Huntington Technology Finance. Huntington assumed debt associated with two securitizations. As of December 31, 2015, the debt is secured by $185 million of on balance sheet leases held by the trusts.
4. AVAILABLE-FOR-SALE AND OTHER SECURITIES
Contractual maturities of available-for-sale and other securities as of December 31, 2015 and 2014 were:
132
2015 |
2014 |
||||||||||||||
(dollar amounts in thousands) |
Amortized
Cost
|
Fair
Value
|
Amortized
Cost
|
Fair
Value
|
|||||||||||
Under 1 year |
$ |
333,891 |
$ |
332,980 |
$ |
355,486 |
$ |
355,465 |
|||||||
After 1 year through 5 years |
1,184,454 |
1,189,455 |
1,047,492 |
1,066,041 |
|||||||||||
After 5 years through 10 years |
1,648,808 |
1,645,759 |
1,517,974 |
1,527,195 |
|||||||||||
After 10 years |
5,259,855 |
5,263,063 |
6,090,688 |
6,086,980 |
|||||||||||
Other securities: |
|||||||||||||||
Nonmarketable equity securities |
332,786 |
332,786 |
331,559 |
331,559 |
|||||||||||
Mutual funds |
10,604 |
10,604 |
16,151 |
16,161 |
|||||||||||
Marketable equity securities |
525 |
794 |
536 |
1,269 |
|||||||||||
Total available-for-sale and other securities |
$ |
8,770,923 |
$ |
8,775,441 |
$ |
9,359,886 |
$ |
9,384,670 |
|||||||
Other securities at December 31, 2015 and 2014 include nonmarketable equity securities of $157 million and $157 million of stock issued by the FHLB of Cincinnati, and $176 million and $175 million of Federal Reserve Bank stock, respectively. Nonmarketable equity securities are recorded at amortized cost. Other securities also include marketable equity securities.
The following tables provide amortized cost, fair value, and gross unrealized gains and losses recognized in OCI by investment category at December 31, 2015 and 2014:
Unrealized |
|||||||||||||||
(dollar amounts in thousands) |
Amortized
Cost
|
Gross
Gains
|
Gross
Losses
|
Fair Value |
|||||||||||
December 31, 2015 |
|||||||||||||||
U.S. Treasury |
$ |
5,457 |
$ |
15 |
$ |
— |
$ |
5,472 |
|||||||
Federal agencies: |
|||||||||||||||
Mortgage-backed securities |
4,505,318 |
30,078 |
(13,708 |
) |
4,521,688 |
||||||||||
Other agencies |
115,076 |
888 |
(51 |
) |
115,913 |
||||||||||
Total U.S. Treasury, Federal agency securities |
4,625,851 |
30,981 |
(13,759 |
) |
4,643,073 |
||||||||||
Municipal securities |
2,431,943 |
51,558 |
(27,105 |
) |
2,456,396 |
||||||||||
Asset-backed securities |
901,059 |
535 |
(40,181 |
) |
861,413 |
||||||||||
Corporate debt |
464,207 |
4,824 |
(2,554 |
) |
466,477 |
||||||||||
Other securities |
347,863 |
271 |
(52 |
) |
348,082 |
||||||||||
Total available-for-sale and other securities |
$ |
8,770,923 |
$ |
88,169 |
$ |
(83,651 |
) |
$ |
8,775,441 |
||||||
Unrealized |
|||||||||||||||
(dollar amounts in thousands) |
Amortized Cost |
Gross Gains |
Gross Losses |
Fair Value |
|||||||||||
December 31, 2014 |
|||||||||||||||
U.S. Treasury |
$ |
5,435 |
$ |
17 |
$ |
— |
$ |
5,452 |
|||||||
Federal agencies: |
|||||||||||||||
Mortgage-backed securities |
5,273,899 |
63,906 |
(15,104 |
) |
5,322,701 |
||||||||||
Other agencies |
349,715 |
2,871 |
(1,043 |
) |
351,543 |
||||||||||
Total U.S. Treasury, Federal agency securities |
5,629,049 |
66,794 |
(16,147 |
) |
5,679,696 |
||||||||||
Municipal securities |
1,841,311 |
37,398 |
(10,140 |
) |
1,868,569 |
||||||||||
Private-label CMO |
43,730 |
1,116 |
(2,920 |
) |
41,926 |
||||||||||
Asset-backed securities |
1,014,999 |
2,061 |
(61,062 |
) |
955,998 |
||||||||||
Corporate debt |
479,151 |
9,442 |
(2,417 |
) |
486,176 |
||||||||||
Other securities |
351,646 |
743 |
(84 |
) |
352,305 |
||||||||||
Total available-for-sale and other securities |
$ |
9,359,886 |
$ |
117,554 |
$ |
(92,770 |
) |
$ |
9,384,670 |
||||||
133
The following tables provide detail on investment securities with unrealized losses aggregated by investment category and the length of time the individual securities have been in a continuous loss position at December 31, 2015 and 2014:
Less than 12 Months |
Over 12 Months |
Total |
|||||||||||||||||||||
(dollar amounts in thousands ) |
Fair Value |
Unrealized
Losses
|
Fair Value |
Unrealized
Losses
|
Fair Value |
Unrealized
Losses
|
|||||||||||||||||
December 31, 2015 |
|||||||||||||||||||||||
Federal agencies: |
|||||||||||||||||||||||
Mortgage-backed securities |
$ |
1,658,516 |
$ |
(11,341 |
) |
$ |
84,147 |
$ |
(2,367 |
) |
$ |
1,742,663 |
$ |
(13,708 |
) |
||||||||
Other agencies |
37,982 |
(51 |
) |
— |
— |
37,982 |
(51 |
) |
|||||||||||||||
Total Federal agency securities |
1,696,498 |
(11,392 |
) |
84,147 |
(2,367 |
) |
1,780,645 |
(13,759 |
) |
||||||||||||||
Municipal securities |
570,916 |
(15,992 |
) |
248,204 |
(11,113 |
) |
819,120 |
(27,105 |
) |
||||||||||||||
Asset-backed securities |
552,275 |
(5,791 |
) |
207,639 |
(34,390 |
) |
759,914 |
(40,181 |
) |
||||||||||||||
Corporate debt |
167,144 |
(1,673 |
) |
21,965 |
(881 |
) |
189,109 |
(2,554 |
) |
||||||||||||||
Other securities |
772 |
(28 |
) |
1,476 |
(24 |
) |
2,248 |
(52 |
) |
||||||||||||||
Total temporarily impaired securities |
$ |
2,987,605 |
$ |
(34,876 |
) |
$ |
563,431 |
$ |
(48,775 |
) |
$ |
3,551,036 |
$ |
(83,651 |
) |
||||||||
Less than 12 Months |
Over 12 Months |
Total |
|||||||||||||||||||||
(dollar amounts in thousands ) |
Fair Value |
Unrealized
Losses
|
Fair Value |
Unrealized
Losses
|
Fair Value |
Unrealized
Losses
|
|||||||||||||||||
December 31, 2014 |
|||||||||||||||||||||||
Federal agencies: |
|||||||||||||||||||||||
Mortgage-backed securities |
$ |
501,858 |
$ |
(1,909 |
) |
$ |
527,280 |
$ |
(13,195 |
) |
$ |
1,029,138 |
$ |
(15,104 |
) |
||||||||
Other agencies |
159,708 |
(1,020 |
) |
1,281 |
(23 |
) |
160,989 |
(1,043 |
) |
||||||||||||||
Total Federal agency securities |
661,566 |
(2,929 |
) |
528,561 |
(13,218 |
) |
1,190,127 |
(16,147 |
) |
||||||||||||||
Municipal securities |
568,619 |
(9,127 |
) |
96,426 |
(1,013 |
) |
665,045 |
(10,140 |
) |
||||||||||||||
Private-label CMO |
— |
— |
22,650 |
(2,920 |
) |
22,650 |
(2,920 |
) |
|||||||||||||||
Asset-backed securities |
157,613 |
(641 |
) |
325,691 |
(60,421 |
) |
483,304 |
(61,062 |
) |
||||||||||||||
Corporate debt |
49,562 |
(252 |
) |
88,398 |
(2,165 |
) |
137,960 |
(2,417 |
) |
||||||||||||||
Other securities |
— |
— |
1,416 |
(84 |
) |
1,416 |
(84 |
) |
|||||||||||||||
Total temporarily impaired securities |
$ |
1,437,360 |
$ |
(12,949 |
) |
$ |
1,063,142 |
$ |
(79,821 |
) |
$ |
2,500,502 |
$ |
(92,770 |
) |
||||||||
At December 31, 2015, the carrying value of investment securities pledged to secure public and trust deposits, trading account liabilities, U.S. Treasury demand notes, and security repurchase agreements totaled $2.6 billion. There were no securities of a single issuer, which are not governmental or government-sponsored, that exceeded 10% of shareholders’ equity at December 31, 2015.
The following table is a summary of realized securities gains and losses for the years ended December 31, 2015, 2014, and 2013:
Year ended December 31, |
|||||||||||
(dollar amounts in thousands) |
2015 |
2014 |
2013 |
||||||||
Gross gains on sales of securities |
$ |
6,730 |
$ |
17,729 |
$ |
2,932 |
|||||
Gross (losses) on sales of securities |
(3,546 |
) |
(175 |
) |
(712 |
) |
|||||
Net gain (loss) on sales of securities |
$ |
3,184 |
$ |
17,554 |
$ |
2,220 |
|||||
Security Impairment
Huntington evaluates the available-for-sale securities portfolio on a quarterly basis for impairment. We conduct a comprehensive security-level assessment on all available-for-sale securities. Impairment would exist when the present value of the expected cash flows are not sufficient to recover the entire amortized cost basis at the balance sheet date. Under these circumstances, any impairment would be recognized in earnings. The contractual terms and/or cash flows of the investments do not permit the issuer to settle the securities at a price less than the amortized cost. Huntington does not intend to sell, nor does it believe it will be required to sell these securities until the amortized cost is recovered, which may be maturity.
134
The highest risk segment in our investment portfolio is the trust preferred CDO securities which are in the asset-backed securities portfolio. This portfolio is in run off, and we have not purchased these types of securities since 2005. The fair values of the CDO assets have been impacted by various market conditions. The unrealized losses are primarily the result of wider liquidity spreads on asset-backed securities and the longer expected average lives of the trust-preferred CDO securities, due to changes in the expectations of when the underlying securities will be repaid.
Collateralized Debt Obligations are backed by a pool of debt securities issued by financial institutions. The collateral generally consists of trust-preferred securities and subordinated debt securities issued by banks, bank holding companies, and insurance companies. Many collateral issuers have the option of deferring interest payments on their debt for up to five years. A full cash flow analysis is used to estimate fair values and assess impairment for each security within this portfolio. A third-party pricing specialist with direct industry experience in pooled-trust-preferred security evaluations is engaged to provide assistance estimating the fair value and expected cash flows on this portfolio. The full cash flow analysis is completed by evaluating the relevant credit and structural aspects of each pooled-trust-preferred security in the portfolio, including collateral performance projections for each piece of collateral in the security and terms of the security’s structure. The credit review includes an analysis of profitability, credit quality, operating efficiency, leverage, and liquidity using available financial and regulatory information for each underlying collateral issuer. The analysis also includes a review of historical industry default data, current / near term operating conditions, and the impact of macroeconomic and regulatory changes. Using the results of our analysis, we estimate appropriate default and recovery probabilities for each piece of collateral then estimate the expected cash flows for each security. The fair value of each security is obtained by discounting the expected cash flows at a market discount rate. The market discount rate is determined by reference to yields observed in the market for similarly rated collateralized debt obligations, specifically high-yield collateralized loan obligations. The relatively high market discount rate is reflective of the uncertainty of the cash flows and illiquid nature of these securities. The large differential between the fair value and amortized cost of some of the securities reflects the high market discount rate and the expectation that the majority of the cash flows will not be received until near the final maturity of the security (the final maturities range from 2032 to 2035).
On December 10, 2013, the Federal Reserve, the OCC, the FDIC, the CFTC and the SEC issued final rules to implement the Volcker Rule contained in section 619 of the Dodd-Frank Act, generally to become effective on July 21, 2015. The Volcker Rule prohibits an insured depository institution and its affiliates (referred to as “banking entities”) from: (i) engaging in “proprietary trading” and (ii) investing in or sponsoring certain types of funds (“covered funds”) subject to certain limited exceptions. These prohibitions impact the ability of U.S. banking entities to provide investment management products and services that are competitive with nonbanking firms generally and with non-U.S. banking organizations in overseas markets. The rule also effectively prohibits short-term trading strategies by any U.S. banking entity if those strategies involve instruments other than those specifically permitted for trading.
On January 14, 2014, the five federal agencies approved an interim final rule to permit banking entities to retain interests in certain collateralized debt obligations backed primarily by trust preferred securities from the investment prohibitions of section 619 of the Volcker Rule. Under the interim final rule, the agencies permit the retention of an interest in or sponsorship of covered funds by banking entities if certain qualifications are met. In addition, the agencies released a non-exclusive list of issuers that meet the requirements of the interim final rule. At December 31, 2015, we had investments in eight different pools of trust preferred securities. Seven of our pools are included in the list of non-exclusive issuers. We have analyzed the ICONS pool that was not included on the list and believe that it is more likely than not that we will be able to hold the ICONS security to recovery under the final Volcker Rule regulations.
The following table summarizes the relevant characteristics of our CDO securities portfolio, which are included in asset-backed securities, at December 31, 2015 and 2014. Each security is part of a pool of issuers and supports a more senior tranche of securities except for the MM Comm III securities which are the most senior class.
135
Collateralized Debt Obligation Securities
(dollar amounts in thousands)
Deal Name |
Par Value |
Amortized
Cost
|
Fair
Value
|
Unrealized
Loss (2)
|
Lowest
Credit
Rating (3)
|
# of Issuers
Currently
Performing/
Remaining (4)
|
Actual
Deferrals
and
Defaults
as a % of
Original
Collateral
|
Expected
Defaults as
a % of
Remaining
Performing
Collateral
|
Excess
Subordination (5)
|
|||||||||||||||||||
Alesco II (1) |
$ |
41,646 |
$ |
28,022 |
$ |
25,296 |
$ |
(2,727 |
) |
C |
30/32 |
5 |
% |
7 |
% |
4 |
% |
|||||||||||
ICONS |
19,214 |
19,214 |
15,567 |
(3,647 |
) |
BB |
19/21 |
7 |
14 |
52 |
||||||||||||||||||
MM Comm III |
4,684 |
4,475 |
3,682 |
(793 |
) |
BB |
5/8 |
5 |
6 |
36 |
||||||||||||||||||
Pre TSL IX (1) |
5,000 |
3,955 |
3,009 |
(946 |
) |
C |
27/38 |
18 |
10 |
7 |
||||||||||||||||||
Pre TSL XI (1) |
25,000 |
20,155 |
15,418 |
(4,737 |
) |
C |
42/55 |
16 |
9 |
10 |
||||||||||||||||||
Pre TSL XIII (1) |
27,530 |
19,735 |
16,769 |
(2,966 |
) |
C |
47/56 |
9 |
10 |
24 |
||||||||||||||||||
Reg Diversified (1) |
25,500 |
5,435 |
1,994 |
(3,441 |
) |
D |
23/39 |
33 |
7 |
— |
||||||||||||||||||
Tropic III |
31,000 |
31,000 |
18,603 |
(12,397 |
) |
CCC+ |
30/40 |
19 |
9 |
40 |
||||||||||||||||||
Total at December 31, 2015 |
$ |
179,574 |
$ |
131,991 |
$ |
100,338 |
$ |
(31,654 |
) |
|||||||||||||||||||
Total at December 31, 2014 |
$ |
193,597 |
$ |
139,194 |
$ |
82,738 |
$ |
(56,456 |
) |
|||||||||||||||||||
(1) |
Security was determined to have OTTI. As such, the book value is net of recorded credit impairment. |
(2) |
The majority of securities have been in a continuous loss position for 12 months or longer. |
(3) |
For purposes of comparability, the lowest credit rating expressed is equivalent to Fitch ratings even where the lowest rating is based on another nationally recognized credit rating agency. |
(4) |
Includes both banks and/or insurance companies. |
(5) |
Excess subordination percentage represents the additional defaults in excess of both current and projected defaults that the CDO can absorb before the bond experiences credit impairment. Excess subordinated percentage is calculated by (a) determining what percentage of defaults a deal can experience before the bond has credit impairment, and (b) subtracting from this default breakage percentage both total current and expected future default percentages. |
For the periods ended December 31, 2015, 2014, and 2013, the following table summarizes by security type, the total OTTI losses recognized in the Consolidated Statements of Income for securities evaluated for impairment as described above:
Year ended December 31, |
|||||||||||
(dollar amounts in thousands) |
2015 |
2014 |
2013 |
||||||||
Available-for-sale and other securities: |
|||||||||||
Collateralized Debt Obligations |
$ |
(2,440 |
) |
$ |
— |
$ |
(1,466 |
) |
|||
Private label CMO |
— |
— |
(336 |
) |
|||||||
Total debt securities |
(2,440 |
) |
— |
(1,802 |
) |
||||||
Equity securities |
— |
— |
— |
||||||||
Total available-for-sale and other securities |
$ |
(2,440 |
) |
$ |
— |
$ |
(1,802 |
) |
|||
136
The following table rolls forward the OTTI recognized in earnings on debt securities held by Huntington for the years ended December 31, 2015, and 2014 as follows:
Year Ended December 31, |
|||||||
(dollar amounts in thousands) |
2015 |
2014 |
|||||
Balance, beginning of year |
$ |
30,869 |
$ |
30,869 |
|||
Reductions from sales |
(14,941 |
) |
— |
||||
Credit losses not previously recognized |
— |
— |
|||||
Additional credit losses |
2,440 |
— |
|||||
Balance, end of year |
$ |
18,368 |
$ |
30,869 |
|||
To reduce asset risk weighting and credit risk in the investment portfolio, the remainder of the private-label CMO portfolio was sold in the 2015 third quarter. Huntington recognized OTTI on this portfolio in prior periods.
5. HELD-TO-MATURITY SECURITIES
These are debt securities that Huntington has the intent and ability to hold until maturity. The debt securities are carried at amortized cost and adjusted for amortization of premiums and accretion of discounts using the interest method.
During 2015, Huntington transferred $3.0 billion of federal agencies, mortgage-backed securities and other agency securities from the available-for-sale securities portfolio to the held-to-maturity securities portfolio. At the time of the transfer, $6 million of unrealized net gains were recognized in OCI. The amounts in OCI will be recognized in earnings over the remaining life of the securities as an offset to the adjustment of yield in a manner consistent with the amortization of the premium on the same transferred securities, resulting in an immaterial impact on net income.
Listed below are the contractual maturities (under 1 year, 1-5 years, 6-10 years, and over 10 years) of held-to-maturity securities at December 31, 2015 and December 31, 2014:
137
December 31, 2015 |
December 31, 2014 |
||||||||||||||
(dollar amounts in thousands) |
Amortized
Cost
|
Fair
Value
|
Amortized
Cost
|
Fair
Value
|
|||||||||||
Federal agencies: mortgage-backed securities: |
|||||||||||||||
1 year or less |
$ |
— |
$ |
— |
$ |
— |
$ |
— |
|||||||
After 1 year through 5 years |
— |
— |
— |
— |
|||||||||||
After 5 years through 10 years |
25,909 |
25,227 |
24,901 |
24,263 |
|||||||||||
After 10 years |
5,506,592 |
5,484,407 |
3,136,460 |
3,140,194 |
|||||||||||
Total Federal agencies: mortgage-backed securities |
5,532,501 |
5,509,634 |
3,161,361 |
3,164,457 |
|||||||||||
Other agencies: |
|||||||||||||||
1 year or less |
— |
— |
— |
— |
|||||||||||
After 1 year through 5 years |
— |
— |
— |
— |
|||||||||||
After 5 years through 10 years |
283,960 |
284,907 |
54,010 |
54,843 |
|||||||||||
After 10 years |
336,092 |
334,004 |
156,553 |
155,821 |
|||||||||||
Total other agencies |
620,052 |
618,911 |
210,563 |
210,664 |
|||||||||||
Total U.S. Government backed agencies |
6,152,553 |
6,128,545 |
3,371,924 |
3,375,121 |
|||||||||||
Municipal securities: |
|||||||||||||||
1 year or less |
— |
— |
— |
— |
|||||||||||
After 1 year through 5 years |
— |
— |
— |
— |
|||||||||||
After 5 years through 10 years |
— |
— |
— |
— |
|||||||||||
After 10 years |
7,037 |
6,913 |
7,981 |
7,594 |
|||||||||||
Total municipal securities |
7,037 |
6,913 |
7,981 |
7,594 |
|||||||||||
Total held-to-maturity securities |
$ |
6,159,590 |
$ |
6,135,458 |
$ |
3,379,905 |
$ |
3,382,715 |
|||||||
The following table provides amortized cost, gross unrealized gains and losses, and fair value by investment category at December 31, 2015 and 2014:
Unrealized |
|||||||||||||||
(dollar amounts in thousands) |
Amortized
Cost
|
Gross
Gains
|
Gross
Losses
|
Fair Value |
|||||||||||
December 31, 2015 |
|||||||||||||||
Federal Agencies: |
|||||||||||||||
Mortgage-backed securities |
$ |
5,532,501 |
$ |
14,637 |
$ |
(37,504 |
) |
$ |
5,509,634 |
||||||
Other agencies |
620,052 |
1,645 |
(2,786 |
) |
618,911 |
||||||||||
Total U.S. Government backed agencies |
6,152,553 |
16,282 |
(40,290 |
) |
6,128,545 |
||||||||||
Municipal securities |
7,037 |
— |
(124 |
) |
6,913 |
||||||||||
Total held-to-maturity securities |
$ |
6,159,590 |
$ |
16,282 |
$ |
(40,414 |
) |
$ |
6,135,458 |
||||||
Unrealized |
|||||||||||||||
(dollar amounts in thousands) |
Amortized Cost |
Gross Gains |
Gross Losses |
Fair Value |
|||||||||||
December 31, 2014 |
|||||||||||||||
Federal Agencies: |
|||||||||||||||
Mortgage-backed securities |
$ |
3,161,361 |
$ |
24,832 |
$ |
(21,736 |
) |
$ |
3,164,457 |
||||||
Other agencies |
210,563 |
1,251 |
(1,150 |
) |
210,664 |
||||||||||
Total U.S. Government backed agencies |
3,371,924 |
26,083 |
(22,886 |
) |
3,375,121 |
||||||||||
Municipal securities |
7,981 |
— |
(387 |
) |
7,594 |
||||||||||
Total held-to-maturity securities |
$ |
3,379,905 |
$ |
26,083 |
$ |
(23,273 |
) |
$ |
3,382,715 |
||||||
138
The following tables provide detail on HTM securities with unrealized losses aggregated by investment category and the length of time the individual securities have been in a continuous loss position at December 31, 2015 and 2014:
Less than 12 Months |
Over 12 Months |
Total |
|||||||||||||||||||||
(dollar amounts in thousands ) |
Fair Value |
Unrealized Losses |
Fair Value |
Unrealized Losses |
Fair Value |
Unrealized Losses |
|||||||||||||||||
December 31, 2015 |
|||||||||||||||||||||||
Federal Agencies: |
|||||||||||||||||||||||
Mortgage-backed securities |
$ |
3,692,890 |
$ |
(25,418 |
) |
$ |
519,872 |
$ |
(12,086 |
) |
$ |
4,212,762 |
$ |
(37,504 |
) |
||||||||
Other agencies |
425,410 |
(2,689 |
) |
6,647 |
(97 |
) |
432,057 |
(2,786 |
) |
||||||||||||||
Total U.S. Government backed securities |
4,118,300 |
(28,107 |
) |
526,519 |
(12,183 |
) |
4,644,819 |
(40,290 |
) |
||||||||||||||
Municipal securities |
— |
— |
6,913 |
(124 |
) |
6,913 |
(124 |
) |
|||||||||||||||
Total temporarily impaired securities |
$ |
4,118,300 |
$ |
(28,107 |
) |
$ |
533,432 |
$ |
(12,307 |
) |
$ |
4,651,732 |
$ |
(40,414 |
) |
||||||||
Less than 12 Months |
Over 12 Months |
Total |
|||||||||||||||||||||
(dollar amounts in thousands ) |
Fair
Value
|
Unrealized
Losses
|
Fair
Value
|
Unrealized
Losses
|
Fair
Value
|
Unrealized
Losses
|
|||||||||||||||||
December 31, 2014 |
|||||||||||||||||||||||
Federal Agencies: |
|||||||||||||||||||||||
Mortgage-backed securities |
$ |
707,934 |
$ |
(5,550 |
) |
$ |
622,026 |
$ |
(16,186 |
) |
$ |
1,329,960 |
$ |
(21,736 |
) |
||||||||
Other agencies |
36,956 |
(198 |
) |
71,731 |
(952 |
) |
108,687 |
(1,150 |
) |
||||||||||||||
Total U.S. Government backed securities |
744,890 |
(5,748 |
) |
693,757 |
(17,138 |
) |
1,438,647 |
(22,886 |
) |
||||||||||||||
Municipal securities |
7,594 |
(387 |
) |
— |
— |
7,594 |
(387 |
) |
|||||||||||||||
Total temporarily impaired securities |
$ |
752,484 |
$ |
(6,135 |
) |
$ |
693,757 |
$ |
(17,138 |
) |
$ |
1,446,241 |
$ |
(23,273 |
) |
||||||||
Security Impairment
Huntington evaluates the held-to-maturity securities portfolio on a quarterly basis for impairment. Impairment would exist when the present value of the expected cash flows is not sufficient to recover the entire amortized cost basis at the balance sheet date. Under these circumstances, any impairment would be recognized in earnings. As of December 31, 2015 and 2014, Management evaluated held-to-maturity securities with unrealized losses for impairment and concluded no OTTI is required.
6. LOAN SALES AND SECURITIZATIONS
Residential Mortgage Portfolio
The following table summarizes activity relating to residential mortgage loans sold with servicing retained for the years ended December 31, 2015, 2014, and 2013:
Year Ended December 31, |
|||||||||||
(dollar amounts in thousands) |
2015 |
2014 |
2013 |
||||||||
Residential mortgage loans sold with servicing retained |
$ |
3,322,723 |
$ |
2,330,060 |
$ |
3,221,239 |
|||||
Pretax gains resulting from above loan sales (1) |
83,148 |
57,590 |
102,935 |
||||||||
(1) |
Recorded in mortgage banking income. |
The following tables summarize the changes in MSRs recorded using either the fair value method or the amortization method for the years ended December 31, 2015 and 2014:
139
Fair Value Method
(dollar amounts in thousands) |
2015 |
2014 |
|||||
Fair value, beginning of year |
$ |
22,786 |
$ |
34,236 |
|||
Change in fair value during the period due to: |
|||||||
Time decay (1) |
(1,295 |
) |
(2,232 |
) |
|||
Payoffs (2) |
(3,031 |
) |
(5,814 |
) |
|||
Changes in valuation inputs or assumptions (3) |
(875 |
) |
(3,404 |
) |
|||
Fair value, end of year |
$ |
17,585 |
$ |
22,786 |
|||
Weighted-average contractual life (years) |
4.6 |
4.6 |
|||||
(1) |
Represents decrease in value due to passage of time, including the impact from both regularly scheduled loan principal payments and partial loan paydowns. |
(2) |
Represents decrease in value associated with loans that paid off during the period. |
(3) |
Represents change in value resulting primarily from market-driven changes in interest rates and prepayment speeds. |
Amortization Method
(dollar amounts in thousands) |
2015 |
2014 |
|||||
Carrying value, beginning of year |
$ |
132,812 |
$ |
128,064 |
|||
New servicing assets created |
35,407 |
24,629 |
|||||
Servicing assets acquired |
— |
3,505 |
|||||
Impairment recovery (charge) |
(2,732 |
) |
(7,330 |
) |
|||
Amortization and other |
(22,354 |
) |
(16,056 |
) |
|||
Carrying value, end of year |
$ |
143,133 |
$ |
132,812 |
|||
Fair value, end of year |
$ |
143,435 |
$ |
133,049 |
|||
Weighted-average contractual life (years) |
5.9 |
5.9 |
|||||
MSRs do not trade in an active, open market with readily observable prices. While sales of MSRs occur, the precise terms and conditions are typically not readily available. Therefore, the fair value of MSRs is estimated using a discounted future cash flow model. The model considers portfolio characteristics, contractually specified servicing fees and assumptions related to prepayments, delinquency rates, late charges, other ancillary revenues, costs to service, and other economic factors. Changes in the assumptions used may have a significant impact on the valuation of MSRs.
MSR values are very sensitive to movements in interest rates as expected future net servicing income depends on the projected outstanding principal balances of the underlying loans, which can be greatly impacted by the level of prepayments. Huntington hedges the value of certain MSRs against changes in value attributable to changes in interest rates using a combination of derivative instruments and trading securities.
For MSRs under the fair value method, a summary of key assumptions and the sensitivity of the MSR value to changes in these assumptions at December 31, 2015, and 2014 follows:
December 31, 2015 |
December 31, 2014 |
||||||||||||||||||||
Decline in fair value due to |
Decline in fair value due to |
||||||||||||||||||||
(dollar amounts in thousands) |
Actual |
10%
adverse
change
|
20%
adverse
change
|
Actual |
10%
adverse
change
|
20%
adverse
change
|
|||||||||||||||
Constant prepayment rate (annualized)
|
14.70 |
% |
$ |
(864 |
) |
$ |
(1,653 |
) |
15.60 |
% |
$ |
(1,176 |
) |
$ |
(2,248 |
) |
|||||
Spread over forward interest rate swap rates |
539 bps |
(559 |
) |
(1,083 |
) |
546 bps |
(699 |
) |
(1,355 |
) |
|||||||||||
For MSRs under the amortization method, a summary of key assumptions and the sensitivity of the MSR value to changes in these assumptions at December 31, 2015, and 2014 follows:
140
December 31, 2015 |
December 31, 2014 |
||||||||||||||||||||
Decline in fair value due to |
Decline in fair value due to |
||||||||||||||||||||
(dollar amounts in thousands) |
Actual |
10%
adverse
change
|
20%
adverse
change
|
Actual |
10%
adverse
change
|
20%
adverse
change
|
|||||||||||||||
Constant prepayment rate (annualized)
|
11.10 |
% |
$ |
(5,543 |
) |
$ |
(10,648 |
) |
11.40 |
% |
$ |
(5,289 |
) |
$ |
(10,164 |
) |
|||||
Spread over forward interest rate swap rates |
875 bps |
(4,662 |
) |
(9,017 |
) |
856 bps |
(4,343 |
) |
(8,403 |
) |
|||||||||||
Total servicing, late and other ancillary fees included in mortgage banking income was $47 million, $44 million, and $44 million for the years ended December 31, 2015, 2014, and 2013, respectively. Total amortization and impairment of capitalized servicing assets included in mortgage banking income was $27 million, $24 million, and $29 million for the years ended December 31, 2015, 2014, and 2013, respectively. The unpaid principal balance of residential mortgage loans serviced for third parties was $16.2 billion, $15.6 billion, and $15.2 billion at December 31, 2015, 2014, and 2013, respectively.
Automobile Loans and Leases
The following table summarizes activity relating to automobile loans sold and/or securitized with servicing retained for the years ended December 31, 2015, 2014, and 2013:
Year Ended December 31, |
|||||||||
(dollar amounts in thousands) |
2015 |
2014 (1) |
2013 (1) |
||||||
Automobile loans securitized with servicing retained |
$ |
750,000 |
— |
— |
|||||
Pretax gains resulting from above loan sales (2) |
5,333 |
— |
— |
||||||
(1) |
Huntington did not sell or securitize any automobile loans in 2014 or 2013. |
(2) |
Recorded in gain on sale of loans |
In the 2015 second quarter, the UPB of automobile loans totaling $750 million were transferred to a trust in a securitization transaction in exchange for $780 million of net proceeds. The securitization and resulting sale of all underlying securities qualified for sale accounting. As a result of this transaction, Huntington recognized a $5 million gain which is reflected in gain on sale of loans on the Consolidated Statements of Income and recorded an $11 million servicing asset which is reflected in accrued income and other assets on the Consolidated Balance Sheets.
Huntington has retained servicing responsibilities on sold automobile loans and receives annual servicing fees and other ancillary fees on the outstanding loan balances. Automobile loan servicing rights are accounted for using the amortization method. A servicing asset is established at fair value at the time of the sale. The servicing asset is then amortized against servicing income. Impairment, if any, is recognized when carrying value exceeds the fair value as determined by calculating the present value of expected net future cash flows. The primary risk characteristic for measuring servicing assets is payoff rates of the underlying loan pools. Valuation calculations rely on the predicted payoff assumption and, if actual payoff is quicker than expected, then future value would be impaired.
Changes in the carrying value of automobile loan servicing rights for the years ended December 31, 2015, and 2014, and the fair value at the end of each period were as follows:
(dollar amounts in thousands) |
2015 |
2014 |
|||||
Carrying value, beginning of year |
$ |
6,898 |
$ |
17,672 |
|||
New servicing assets created |
11,180 |
— |
|||||
Amortization and other |
(9,307 |
) |
(10,774 |
) |
|||
Carrying value, end of year |
$ |
8,771 |
$ |
6,898 |
|||
Fair value, end of year |
$ |
9,127 |
$ |
6,948 |
|||
Weighted-average contractual life (years) |
3.2 |
2.6 |
|||||
A summary of key assumptions and the sensitivity of the automobile loan servicing rights value to changes in these assumptions at December 31, 2015, and 2014 follows:
141
December 31, 2015 |
December 31, 2014 |
||||||||||||||||||||
Decline in fair value due to |
Decline in fair value due to |
||||||||||||||||||||
(dollar amounts in thousands) |
Actual |
10%
adverse
change
|
20%
adverse
change
|
Actual |
10%
adverse
change
|
20%
adverse
change
|
|||||||||||||||
Constant prepayment rate (annualized)
|
18.36 |
% |
$ |
(500 |
) |
$ |
(895 |
) |
14.62 |
% |
$ |
(305 |
) |
$ |
(496 |
) |
|||||
Spread over forward interest rate swap rates |
500 bps |
(10 |
) |
(19 |
) |
500 bps |
(2 |
) |
(4 |
) |
|||||||||||
Servicing income, net of amortization of capitalized servicing assets was $5 million, $8 million, and $10 million for the years ended December 31, 2015, 2014, and 2013, respectively. The unpaid principal balance of automobile loans serviced for third parties was $0.9 billion, $0.8 billion, and $1.6 billion at December 31, 2015, 2014, and 2013, respectively.
Small Business Association (SBA) Portfolio
The following table summarizes activity relating to SBA loans sold with servicing retained for the years ended December 31, 2015, 2014, and 2013:
Year Ended December 31, |
|||||||||||
(dollar amounts in thousands) |
2015 |
2014 |
2013 |
||||||||
SBA loans sold with servicing retained |
$ |
232,848 |
$ |
214,760 |
$ |
178,874 |
|||||
Pretax gains resulting from above loan sales (1) |
18,626 |
24,579 |
19,556 |
||||||||
(1) |
Recorded in gain on sale of loans. |
Huntington has retained servicing responsibilities on sold SBA loans and receives annual servicing fees on the outstanding loan balances. SBA loan servicing rights are accounted for using the amortization method. A servicing asset is established at fair value at the time of the sale using a discounted future cash flow model. The servicing asset is then amortized against servicing income. Impairment, if any, is recognized when carrying value exceeds the fair value as determined by calculating the present value of expected net future cash flows.
The following tables summarize the changes in the carrying value of the servicing asset for the years ended December 31, 2015, and 2014:
(dollar amounts in thousands) |
2015 |
2014 |
|||||
Carrying value, beginning of year |
$ |
18,536 |
$ |
16,865 |
|||
New servicing assets created |
8,012 |
7,269 |
|||||
Amortization and other |
(6,801 |
) |
(5,598 |
) |
|||
Carrying value, end of year |
$ |
19,747 |
$ |
18,536 |
|||
Fair value, end of year |
$ |
22,649 |
$ |
20,495 |
|||
Weighted-average contractual life (years) |
3.3 |
3.5 |
|||||
A summary of key assumptions and the sensitivity of the SBA loan servicing rights value to changes in these assumptions at December 31, 2015, and 2014 follows:
December 31, 2015 |
December 31, 2014 |
||||||||||||||||||||
Decline in fair value due to |
Decline in fair value due to |
||||||||||||||||||||
(dollar amounts in thousands) |
Actual |
10%
adverse
change
|
20%
adverse
change
|
Actual |
10%
adverse
change
|
20%
adverse
change
|
|||||||||||||||
Constant prepayment rate (annualized)
|
7.60 |
% |
$ |
(313 |
) |
$ |
(622 |
) |
5.60 |
% |
$ |
(211 |
) |
$ |
(419 |
) |
|||||
Discount rate |
15.00 |
(610 |
) |
(1,194 |
) |
15.00 |
(563 |
) |
(1,102 |
) |
|||||||||||
142
Servicing income, net of amortization of capitalized servicing assets was $8 million, $7 million, and $6 million for the years ended December 31, 2015, 2014, and 2013, respectively. The unpaid principal balance of SBA loans serviced for third parties was $1.0 billion, $0.9 billion and $0.9 billion at December 31, 2015, 2014, and 2013, respectively.
7. GOODWILL AND OTHER INTANGIBLE ASSETS
Business segments are based on segment leadership structure, which reflects how segment performance is monitored and assessed. We have five major business segments: Retail and Business Banking, Commercial Banking, Automobile Finance and Commercial Real Estate (AFCRE), Regional Banking and The Huntington Private Client Group (RBHPCG), and Home Lending. A Treasury / Other function includes, along with technology and operations, other unallocated assets, liabilities, revenue, and expense. All periods presented have been reclassified to conform to the current period classification. During 2014, we realigned our business segments to drive our ongoing growth and leverage the knowledge of our highly experienced team. Amounts relating to the realignment are disclosed in the table below.
A rollforward of goodwill by business segment for the years ended December 31, 2015 and 2014, is presented in the table below:
Retail & |
|||||||||||||||||||||||||||
Business |
Commercial |
Home |
Treasury/ |
Huntington |
|||||||||||||||||||||||
(dollar amounts in thousands) |
Banking |
Banking |
AFCRE |
RBHPCG |
Lending |
Other |
Consolidated |
||||||||||||||||||||
Balance, January 1, 2014 |
$ |
286,824 |
$ |
22,108 |
$ |
— |
$ |
93,012 |
$ |
— |
$ |
42,324 |
$ |
444,268 |
|||||||||||||
Goodwill acquired during the period |
81,273 |
— |
— |
— |
— |
— |
81,273 |
||||||||||||||||||||
Adjustments |
— |
37,486 |
— |
(3,000 |
) |
3,000 |
(37,486 |
) |
— |
||||||||||||||||||
Impairment |
— |
— |
— |
— |
(3,000 |
) |
— |
(3,000 |
) |
||||||||||||||||||
Balance, December 31, 2014 |
368,097 |
59,594 |
— |
90,012 |
— |
4,838 |
522,541 |
||||||||||||||||||||
Goodwill acquired during the period |
— |
155,828 |
— |
— |
— |
— |
155,828 |
||||||||||||||||||||
Adjustments |
— |
— |
— |
(1,500 |
) |
— |
— |
(1,500 |
) |
||||||||||||||||||
Impairment |
— |
— |
— |
— |
— |
— |
— |
||||||||||||||||||||
Balance, December 31, 2015 |
$ |
368,097 |
$ |
215,422 |
$ |
— |
$ |
88,512 |
$ |
— |
$ |
4,838 |
$ |
676,869 |
|||||||||||||
On March 31, 2015, Huntington completed its acquisition of Macquarie Equipment Finance, which was re-branded Huntington Technology Finance. As part of the transaction, Huntington recorded $156 million of goodwill and $8 million of other intangible assets. For additional information on the acquisition, see Note 23 Business Combinations.
During 2015, Huntington adjusted the goodwill in the RBHPCG segment related to a sale of HASI and HAA. The amount was adjusted based on relative fair value methodology.
In 2014, Huntington completed an acquisition of 24 Bank of America branches in Michigan and recorded $17 million of goodwill. The remaining $64 million of goodwill acquired during 2014 was the result of the Camco Financial acquisition, which was also completed in 2014.
Goodwill is not amortized but is evaluated for impairment on an annual basis at October 1 of each year or whenever events or changes in circumstances indicate the carrying value may not be recoverable. As a result of the 2014 first quarter reorganization in our reported business segments, goodwill was reallocated among the business segments. Immediately following the reallocation, impairment of $3 million was recorded in the Home Lending reporting segment. No impairment was recorded in 2015 or 2013.
Also in 2014, we moved our insurance brokerage business from Treasury / Other to Commercial Banking to align with a change in management responsibilities. Amounts relating to the realignment are disclosed in the table above.
At December 31, 2015 and 2014, Huntington’s other intangible assets consisted of the following:
143
(dollar amounts in thousands) |
Gross Carrying Amount |
Accumulated Amortization |
Net Carrying Value |
||||||||
December 31, 2015 |
|||||||||||
Core deposit intangible |
$ |
400,058 |
$ |
(384,606 |
) |
$ |
15,452 |
||||
Customer relationship |
116,094 |
(76,656 |
) |
39,438 |
|||||||
Other |
25,164 |
(25,076 |
) |
88 |
|||||||
Total other intangible assets |
$ |
541,316 |
$ |
(486,338 |
) |
$ |
54,978 |
||||
December 31, 2014 |
|||||||||||
Core deposit intangible |
$ |
400,058 |
$ |
(366,907 |
) |
$ |
33,151 |
||||
Customer relationship |
107,920 |
(66,534 |
) |
41,386 |
|||||||
Other |
25,164 |
(25,030 |
) |
134 |
|||||||
Total other intangible assets |
$ |
533,142 |
$ |
(458,471 |
) |
$ |
74,671 |
||||
The estimated amortization expense of other intangible assets for the next five years is as follows:
(dollar amounts in thousands) |
Amortization
Expense
|
||
2016 |
$ |
14,290 |
|
2017 |
12,908 |
||
2018 |
11,135 |
||
2019 |
9,825 |
||
2020 |
3,076 |
||
8. PREMISES AND EQUIPMENT
Premises and equipment were comprised of the following at December 31, 2015 and 2014:
At December 31, |
|||||||
(dollar amounts in thousands) |
2015 |
2014 |
|||||
Land and land improvements |
$ |
140,414 |
$ |
137,702 |
|||
Buildings |
366,963 |
367,225 |
|||||
Leasehold improvements |
246,222 |
235,279 |
|||||
Equipment |
647,769 |
627,307 |
|||||
Total premises and equipment |
1,401,368 |
1,367,513 |
|||||
Less accumulated depreciation and amortization |
(780,828 |
) |
(751,106 |
) |
|||
Net premises and equipment |
$ |
620,540 |
$ |
616,407 |
|||
Depreciation and amortization charged to expense and rental income credited to net occupancy expense for the three years ended December 31, 2015, 2014, and 2013 were:
(dollar amounts in thousands) |
2015 |
2014 |
2013 |
||||||||
Total depreciation and amortization of premises and equipment |
$ |
85,805 |
$ |
82,296 |
$ |
78,601 |
|||||
Rental income credited to occupancy expense |
12,563 |
11,556 |
12,542 |
||||||||
144
9. SHORT-TERM BORROWINGS
Borrowings with original maturities of one year or less are classified as short-term and were comprised of the following at December 31, 2015 and 2014:
At December 31, |
|||||||
(dollar amounts in thousands) |
2015 |
2014 |
|||||
Federal funds purchased and securities sold under agreements to repurchase |
$ |
601,272 |
$ |
1,058,096 |
|||
Federal Home Loan Bank advances |
— |
1,325,000 |
|||||
Other borrowings |
14,007 |
14,005 |
|||||
Total short-term borrowings |
$ |
615,279 |
$ |
2,397,101 |
|||
Other borrowings consist of borrowings from the Treasury and other notes payable.
145
10. LONG-TERM DEBT
Huntington’s long-term debt consisted of the following:
At December 31, |
|||||||
(dollar amounts in thousands) |
2015 |
2014 |
|||||
The Parent Company: |
|||||||
Senior Notes: |
|||||||
2.64% Huntington Bancshares Incorporated senior note due 2018 |
$ |
400,544 |
$ |
398,924 |
|||
Subordinated Notes: |
|||||||
Fixed 7.00% subordinated notes due 2020 |
328,185 |
330,105 |
|||||
Huntington Capital I Trust Preferred 1.03% junior subordinated debentures due 2027 (1) |
111,816 |
111,816 |
|||||
Sky Financial Capital Trust IV 1.73% junior subordinated debentures due 2036 (3) |
74,320 |
74,320 |
|||||
Sky Financial Capital Trust III 2.01% junior subordinated debentures due 2036 (3) |
72,165 |
72,165 |
|||||
Huntington Capital II Trust Preferred 1.14% junior subordinated debentures due 2028 (2) |
54,593 |
54,593 |
|||||
Camco Statutory Trust I 2.95% due 2037 (4) |
4,212 |
4,181 |
|||||
Total notes issued by the parent |
1,045,835 |
1,046,104 |
|||||
The Bank: |
|||||||
Senior Notes: |
|||||||
2.24% Huntington National Bank senior note due 2018 |
845,016 |
— |
|||||
2.10% Huntington National Bank senior note due 2018 |
750,035 |
— |
|||||
1.75% Huntington National Bank senior note due 2018 |
502,822 |
— |
|||||
2.23% Huntington National Bank senior note due 2017 |
502,549 |
499,759 |
|||||
2.43% Huntington National Bank senior note due 2020 |
500,646 |
— |
|||||
2.97% Huntington National Bank senior note due 2020 |
500,489 |
— |
|||||
1.43% Huntington National Bank senior note due 2019 |
500,292 |
499,760 |
|||||
1.31% Huntington National Bank senior note due 2016 |
498,925 |
497,477 |
|||||
1.40% Huntington National Bank senior note due 2016 |
349,793 |
349,499 |
|||||
0.74% Huntington National Bank senior note due 2017 (5) |
250,000 |
250,000 |
|||||
5.04% Huntington National Bank medium-term notes due 2018 |
37,535 |
38,541 |
|||||
Subordinated Notes: |
|||||||
6.67% subordinated notes due 2018 |
136,237 |
140,115 |
|||||
5.59% subordinated notes due 2016 |
103,357 |
105,731 |
|||||
5.45% subordinated notes due 2019 |
83,833 |
85,783 |
|||||
Total notes issued by the bank |
5,561,529 |
2,466,665 |
|||||
FHLB Advances: |
|||||||
3.46% weighted average rate, varying maturities greater than one year |
7,802 |
758,052 |
|||||
Other: |
|||||||
Huntington Technology Finance nonrecourse debt, 4.21% effective interest rate, varying maturities |
301,577 |
— |
|||||
Huntington Technology Finance ABS Trust 2014 1.35% due 2020 |
123,577 |
— |
|||||
Huntington Technology Finance ABS Trust 2012 1.79% due 2017 |
27,153 |
— |
|||||
Other |
141 |
65,141 |
|||||
Total other |
452,448 |
65,141 |
|||||
Total long-term debt |
$ |
7,067,614 |
$ |
4,335,962 |
|||
(1) |
Variable effective rate at December 31, 2015, based on three-month LIBOR +0.70%.
|
(2) |
Variable effective rate at December 31, 2015, based on three-month LIBOR +0.625%.
|
(3) |
Variable effective rate at December 31, 2015, based on three-month LIBOR +1.40%.
|
(4) |
Variable effective rate at December 31, 2015, based on three-month LIBOR +1.33%.
|
146
(5) |
Variable effective rate at December 31, 2015, based on three-month LIBOR +0.425%.
|
Amounts above are net of unamortized discounts and adjustments related to hedging with derivative financial instruments. The derivative instruments, principally interest rate swaps, are used to hedge the fair values of certain fixed-rate debt by converting the debt to a variable rate. See Note 18 for more information regarding such financial instruments.
In November 2015, the Bank issued $850 million of senior notes at 99.88% of face value. The senior bank note issuances mature on November 6, 2018 and have a fixed coupon rate of 2.20%. The senior notes may be redeemed one month prior to maturity date at 100% of principal plus accrued and unpaid interest.
In August 2015, the Bank issued $500 million of senior notes at 99.58% of face value. The senior bank note issuances mature on August 20, 2020 and have a fixed coupon rate of 2.88%.
In June 2015, the Bank issued $750 million of senior notes at 99.71% of face value. The senior bank note issuances mature on June 30, 2018 and have a fixed coupon rate of 2.00%.
On March 31, 2015, Huntington completed its acquisition of Huntington Technology Finance. As part of the acquisition, Huntington assumed $293 million of non-recourse debt with various financial institutions and maturity dates. The effective interest rate on the non-recourse debt is 3.20%. Huntington also assumed $255 million of debt associated with two securitizations. The securitization debt has various classes and associated maturity dates and has an effective interest rate of 1.70%.
In February 2015, the Bank issued $500 million of senior notes at 99.86% of face value. The senior bank note issuances mature on February 26, 2018 and have a fixed coupon rate of 1.70%. Also, in February 2015, the Bank issued $500 million of senior notes at 99.87% of face value. The senior bank note issuances mature on April 1, 2020 and have a fixed coupon rate of 2.40%. Both senior note issuances may be redeemed one month prior to the maturity date at 100% of principal plus accrued and unpaid interest.
In April 2014, the Bank issued $500 million of senior notes at 99.842% of face value. The senior note issuances mature on April 24, 2017 and have a fixed coupon rate of 1.375%. In April 2014, the Bank also issued $250 million of senior notes at 100% of face value. The senior bank note issuances mature on April 24, 2017 and have a variable coupon rate equal to the three-month LIBOR plus 0.425%. Both senior note issuances may be redeemed one month prior to their maturity date at 100% of principal plus accrued and unpaid interest.
In February 2014, the Bank issued $500.0 million of senior notes at 99.842% of face value. The senior bank note issuances mature on April 1, 2019 and have a fixed coupon rate of 2.20%. The senior note issuance may be redeemed one month prior to the maturity date at 100% of principal plus accrued and unpaid interest.
Long-term debt maturities for the next five years and thereafter are as follows:
dollar amounts in thousands |
2016 |
2017 |
2018 |
2019 |
2020 |
Thereafter |
Total |
||||||||||||||||||||
The Parent Company: |
|||||||||||||||||||||||||||
Senior notes |
$ |
— |
$ |
— |
$ |
400,000 |
$ |
— |
$ |
— |
$ |
— |
$ |
400,000 |
|||||||||||||
Subordinated notes |
— |
— |
— |
— |
300,000 |
318,049 |
618,049 |
||||||||||||||||||||
The Bank: |
|||||||||||||||||||||||||||
Senior notes |
850,000 |
750,000 |
2,135,000 |
500,000 |
1,000,000 |
— |
5,235,000 |
||||||||||||||||||||
Subordinated notes |
103,009 |
— |
125,539 |
75,716 |
— |
— |
304,264 |
||||||||||||||||||||
FHLB Advances |
— |
100 |
1,163 |
348 |
2,458 |
3,921 |
7,990 |
||||||||||||||||||||
Other |
144,095 |
96,715 |
110,116 |
43,340 |
51,537 |
10,595 |
456,398 |
||||||||||||||||||||
Total |
$ |
1,097,104 |
$ |
846,815 |
$ |
2,771,818 |
$ |
619,404 |
$ |
1,353,995 |
$ |
332,565 |
$ |
7,021,701 |
|||||||||||||
These maturities are based upon the par values of the long-term debt.
The terms of the long-term debt obligations contain various restrictive covenants including limitations on the acquisition of additional debt in excess of specified levels, dividend payments, and the disposition of subsidiaries. As of December 31, 2015, Huntington was in compliance with all such covenants.
147
11. OTHER COMPREHENSIVE INCOME
The components of Huntington’s OCI in the three years ended December 31, 2015, 2014, and 2013, were as follows:
2015 |
|||||||||||
Tax (expense) |
|||||||||||
(dollar amounts in thousands) |
Pretax |
Benefit |
After-tax |
||||||||
Noncredit-related impairment recoveries (losses) on debt securities not expected to be sold |
$ |
19,606 |
$ |
(6,933 |
) |
$ |
12,673 |
||||
Unrealized holding gains (losses) on available-for-sale debt securities arising during the period |
(26,021 |
) |
9,108 |
(16,913 |
) |
||||||
Less: Reclassification adjustment for net losses (gains) included in net income |
(3,901 |
) |
1,365 |
(2,536 |
) |
||||||
Net change in unrealized holding gains (losses) on available-for-sale debt securities |
(10,316 |
) |
3,540 |
(6,776 |
) |
||||||
Net change in unrealized holding gains (losses) on available-for-sale equity securities |
(474 |
) |
166 |
(308 |
) |
||||||
Unrealized gains (losses) on derivatives used in cash flow hedging relationships arising during the period |
12,966 |
(4,538 |
) |
8,428 |
|||||||
Less: Reclassification adjustment for net (gains) losses included in net income |
(220 |
) |
77 |
(143 |
) |
||||||
Net change in unrealized gains (losses) on derivatives used in cash flow hedging relationships |
12,746 |
(4,461 |
) |
8,285 |
|||||||
Net change in pension and other post-retirement obligations |
(7,795 |
) |
2,728 |
(5,067 |
) |
||||||
Total other comprehensive income (loss) |
$ |
(5,839 |
) |
$ |
1,973 |
$ |
(3,866 |
) |
|||
2014 |
|||||||||||
Tax (expense) |
|||||||||||
(dollar amounts in thousands) |
Pretax |
Benefit |
After-tax |
||||||||
Noncredit-related impairment recoveries (losses) on debt securities not expected to be sold |
$ |
13,583 |
$ |
(4,803 |
) |
$ |
8,780 |
||||
Unrealized holding gains (losses) on available-for-sale debt securities arising during the period |
86,618 |
(30,914 |
) |
55,704 |
|||||||
Less: Reclassification adjustment for net losses (gains) included in net income |
(15,559 |
) |
5,446 |
(10,113 |
) |
||||||
Net change in unrealized holding gains (losses) on available-for-sale debt securities |
84,642 |
(30,271 |
) |
54,371 |
|||||||
Net change in unrealized holding gains (losses) on available-for-sale equity securities |
295 |
(103 |
) |
192 |
|||||||
Unrealized gains (losses) on derivatives used in cash flow hedging relationships arising during the period |
14,141 |
(4,949 |
) |
9,192 |
|||||||
Less: Reclassification adjustment for net (gains) losses included in net income |
(3,971 |
) |
1,390 |
(2,581 |
) |
||||||
Net change in unrealized gains (losses) on derivatives used in cash flow hedging relationships |
10,170 |
(3,559 |
) |
6,611 |
|||||||
Net change in pension and other post-retirement obligations |
(106,857 |
) |
37,400 |
(69,457 |
) |
||||||
Total other comprehensive income (loss) |
$ |
(11,750 |
) |
$ |
3,467 |
$ |
(8,283 |
) |
|||
2013 |
|||||||||||
Tax (expense) |
|||||||||||
(dollar amounts in thousands) |
Pretax |
Benefit |
After-tax |
||||||||
Noncredit-related impairment recoveries (losses) on debt securities not expected to be sold |
$ |
235 |
$ |
(82 |
) |
$ |
153 |
||||
Unrealized holding gains (losses) on available-for-sale debt securities arising during the period |
(125,919 |
) |
44,191 |
(81,728 |
) |
||||||
Less: Reclassification adjustment for net gains (losses) included in net income |
6,211 |
(2,174 |
) |
4,037 |
|||||||
Net change in unrealized holding gains (losses) on available-for-sale debt securities |
(119,473 |
) |
41,935 |
(77,538 |
) |
||||||
Net change in unrealized holding gains (losses) on available-for-sale equity securities |
151 |
(53 |
) |
98 |
|||||||
Unrealized gains and losses on derivatives used in cash flow hedging relationships arising during the period |
(86,240 |
) |
30,184 |
(56,056 |
) |
||||||
Less: Reclassification adjustment for net losses (gains) losses included in net income |
(15,188 |
) |
5,316 |
(9,872 |
) |
||||||
Net change in unrealized gains (losses) on derivatives used in cash flow hedging relationships |
(101,428 |
) |
35,500 |
(65,928 |
) |
||||||
Re-measurement obligation |
136,452 |
(47,758 |
) |
88,694 |
|||||||
Defined benefit pension items |
(13,106 |
) |
4,588 |
(8,518 |
) |
||||||
Net change in pension and post-retirement obligations |
123,346 |
(43,170 |
) |
80,176 |
|||||||
Total other comprehensive income (loss) |
$ |
(97,404 |
) |
$ |
34,212 |
$ |
(63,192 |
) |
|||
Activity in accumulated OCI for the two years ended December 31, were as follows:
148
(dollar amounts in thousands) |
Unrealized
gains and
(losses) on
debt
securities (1)
|
Unrealized
gains and
(losses) on
equity
securities
|
Unrealized
gains and
(losses) on
cash flow
hedging
derivatives
|
Unrealized
gains
(losses) for
pension and
other post-
retirement
obligations
|
Total |
||||||||||||||
December 31, 2013 |
$ |
(39,234 |
) |
$ |
292 |
$ |
(18,844 |
) |
$ |
(156,223 |
) |
$ |
(214,009 |
) |
|||||
Other comprehensive income before reclassifications |
64,484 |
192 |
9,192 |
— |
73,868 |
||||||||||||||
Amounts reclassified from accumulated OCI to earnings |
(10,113 |
) |
— |
(2,581 |
) |
(69,457 |
) |
(82,151 |
) |
||||||||||
Period change |
54,371 |
192 |
6,611 |
(69,457 |
) |
(8,283 |
) |
||||||||||||
December 31, 2014 |
15,137 |
484 |
(12,233 |
) |
(225,680 |
) |
(222,292 |
) |
|||||||||||
Other comprehensive income before reclassifications |
(4,240 |
) |
(308 |
) |
8,428 |
— |
3,880 |
||||||||||||
Amounts reclassified from accumulated OCI to earnings |
(2,536 |
) |
— |
(143 |
) |
(5,067 |
) |
(7,746 |
) |
||||||||||
Period change |
(6,776 |
) |
(308 |
) |
8,285 |
(5,067 |
) |
(3,866 |
) |
||||||||||
December 31, 2015 |
$ |
8,361 |
$ |
176 |
$ |
(3,948 |
) |
$ |
(230,747 |
) |
$ |
(226,158 |
) |
||||||
(1) |
Amount at December 31, 2015 includes $9 million of net unrealized gains on securities transferred from the available-for-sale securities portfolio to the held-to-maturity securities portfolio. The net unrealized gains will be recognized in earnings over the remaining life of the security using the effective interest method.
|
The following table presents the reclassification adjustments out of accumulated OCI included in net income and the impacted line items as listed on the Consolidated Statements of Income for the years ended December 31, 2015 and 2014:
Reclassifications out of accumulated OCI |
|||||||||
Accumulated OCI components |
Amounts reclassed
from accumulated OCI
|
Location of net gain (loss)
reclassified from accumulated OCI into earnings
|
|||||||
(dollar amounts in thousands) |
2015 |
2014 |
|||||||
Gains (losses) on debt securities: |
|||||||||
Amortization of unrealized gains (losses) |
$ |
(144 |
) |
$ |
597 |
Interest income—held-to-maturity securities—taxable |
|||
Realized gain (loss) on sale of securities |
6,485 |
14,962 |
Noninterest income—net gains (losses) on sale of securities |
||||||
OTTI recorded |
(2,440 |
) |
— |
Noninterest income—net gains (losses) on sale of securities |
|||||
Total before tax |
3,901 |
15,559 |
|||||||
Tax (expense) benefit |
(1,365 |
) |
(5,446 |
) |
|||||
Net of tax |
$ |
2,536 |
$ |
10,113 |
|||||
Gains (losses) on cash flow hedging relationships: |
|||||||||
Interest rate contracts |
$ |
210 |
$ |
4,064 |
Interest and fee income—loans and leases |
||||
Interest rate contracts |
10 |
(93 |
) |
Noninterest expense—other income |
|||||
Total before tax |
220 |
3,971 |
|||||||
Tax (expense) benefit |
(77 |
) |
(1,390 |
) |
|||||
Net of tax |
$ |
143 |
$ |
2,581 |
|||||
Amortization of defined benefit pension and post-retirement items: |
|||||||||
Actuarial gains (losses) |
$ |
5,827 |
$ |
106,857 |
Noninterest expense—personnel costs |
||||
Net periodic benefit costs |
1,968 |
— |
Noninterest expense—personnel costs |
||||||
Total before tax |
7,795 |
106,857 |
|||||||
Tax (expense) benefit |
(2,728 |
) |
(37,400 |
) |
|||||
Net of tax |
$ |
5,067 |
$ |
69,457 |
|||||
149
12. SHAREHOLDERS’ EQUITY
Preferred Stock issued and outstanding
In 2008, Huntington issued 569,000 shares of 8.50% Series A Non-Cumulative Perpetual Convertible Preferred Stock (Series A Preferred Stock) with a liquidation preference of $1,000 per share. Each share of the Series A Preferred Stock is non-voting and may be converted at any time, at the option of the holder, into 83.668 shares of common stock of Huntington, which represents an approximate initial conversion price of $11.95 per share of common stock. Since April 15, 2013, at the option of Huntington, the Series A Preferred Stock is subject to mandatory conversion into Huntington’s common stock at the prevailing conversion rate if the closing price of Huntington’s common stock exceeds 130% of the conversion price for 20 trading days during any 30 consecutive trading-day period. At the option of the holder, one share was converted to common stock during the fourth quarter of 2015.
In 2011, Huntington issued $36 million par value Floating Rate Series B Non-Cumulative Perpetual Preferred Stock with a liquidation preference of $1,000 per share (the Series B Preferred Stock) and, in certain cases, an additional amount of cash consideration, in exchange for $36 million of (1) Huntington Capital I Floating Rate Capital Securities, (2) Huntington Capital II Floating Rate Capital Securities, (3) Sky Financial Capital Trust III Floating Rate Capital Securities and (4) Sky Financial Capital Trust IV Floating Rate Capital Securities.
As part of the exchange offer, Huntington issued depositary shares. Each depositary share represents a 1/40th ownership interest in a share of the Series B Preferred Stock. Each holder of a depositary share will be entitled, in proportion to the applicable fraction of a share of Series B Preferred Stock and all the related rights and preferences. Huntington will pay dividends on the Series B Preferred Stock at a floating rate equal to three-month LIBOR plus a spread of 2.70%. The preferred stock was recorded at the par amount of $36 million, with the difference between par amount of the shares and their fair value of $24 million recorded as a discount.
2015 Share Repurchase Program
On March 11, 2015, Huntington announced that the Federal Reserve did not object to the proposed capital actions included in Huntington’s capital plan submitted to the Federal Reserve in January 2015. These actions included a potential repurchase of up to $366 million of common stock from the second quarter of 2015 through the second quarter of 2016. Purchases of common stock may include open market purchases, privately negotiated transactions, and accelerated repurchase programs. Huntington’s board of directors authorized a share repurchase program consistent with Huntington’s capital plan. This program replaced the previously authorized share repurchase program authorized by Huntington’s board of directors in 2014.
During 2015, Huntington repurchased a total of 23.0 million shares of common stock at a weighted average price of $10.93. Huntington has the ability to repurchase up to $166 million of additional common stock through the second quarter of 2016.
On January 26, 2016, Huntington announced the signing of a definitive merger agreement under which Ohio-based FirstMerit Corporation, the parent company of FirstMerit Bank, will merge into Huntington in a stock and cash transaction. The transaction is expected to be completed in the 2016 third quarter, subject to the satisfaction of customary closing conditions, including regulatory approvals and the approval of the shareholders of Huntington and FirstMerit Corporation. As a result, Huntington no longer has the intent to repurchase shares under the current authorization.
2014 Share Repurchase Program
During 2014, Huntington repurchased a total of 35.7 million shares of common stock at a weighted average price of $9.37.
13. EARNINGS PER SHARE
Basic earnings per share is the amount of earnings (adjusted for dividends declared on preferred stock) available to each share of common stock outstanding during the reporting period. Diluted earnings per share is the amount of earnings available to each share of common stock outstanding during the reporting period adjusted to include the effect of potentially dilutive common shares. Potentially dilutive common shares include incremental shares issued for stock options, restricted stock units and awards, distributions from deferred compensation plans, and the conversion of the Company’s convertible preferred stock (See Note 12). Potentially dilutive common shares are excluded from the computation of diluted earnings per share in periods in which the effect would be antidilutive. For diluted earnings per share, net income available to common shares can be affected by the conversion of the Company’s convertible preferred stock. Where the effect of this conversion would be dilutive, net income available to common shareholders is adjusted by the associated preferred dividends and deemed dividend. The calculation of basic and diluted earnings per share for each of the three years ended December 31 was as follows:
150
Year ended December 31, |
|||||||||||
(dollar amounts in thousands, except per share amounts) |
2015 |
2014 |
2013 |
||||||||
Basic earnings per common share: |
|||||||||||
Net income |
$ |
692,957 |
$ |
632,392 |
$ |
641,282 |
|||||
Preferred stock dividends |
(31,873 |
) |
(31,854 |
) |
(31,869 |
) |
|||||
Net income available to common shareholders |
$ |
661,084 |
$ |
600,538 |
$ |
609,413 |
|||||
Average common shares issued and outstanding |
803,412 |
819,917 |
834,205 |
||||||||
Basic earnings per common share: |
$ |
0.82 |
$ |
0.73 |
$ |
0.73 |
|||||
Diluted earnings per common share |
|||||||||||
Net income available to common shareholders |
$ |
661,084 |
$ |
600,538 |
$ |
609,413 |
|||||
Effect of assumed preferred stock conversion |
— |
— |
— |
||||||||
Net income applicable to diluted earnings per share |
$ |
661,084 |
$ |
600,538 |
$ |
609,413 |
|||||
Average common shares issued and outstanding |
803,412 |
819,917 |
834,205 |
||||||||
Dilutive potential common shares: |
|||||||||||
Stock options and restricted stock units and awards |
11,633 |
11,421 |
8,418 |
||||||||
Shares held in deferred compensation plans |
1,912 |
1,420 |
1,351 |
||||||||
Other |
172 |
323 |
— |
||||||||
Dilutive potential common shares: |
13,717 |
13,164 |
9,769 |
||||||||
Total diluted average common shares issued and outstanding |
817,129 |
833,081 |
843,974 |
||||||||
Diluted earnings per common share |
$ |
0.81 |
$ |
0.72 |
$ |
0.72 |
|||||
Approximately 1.6 million, 2.6 million, and 6.6 million options to purchase shares of common stock outstanding at the end of December 31, 2015, 2014, and 2013, respectively, were not included in the computation of diluted earnings per share because the effect would be antidilutive.
14. SHARE-BASED COMPENSATION
Huntington sponsors nonqualified and incentive share based compensation plans. These plans provide for the granting of stock options and other awards to officers, directors, and other employees. Compensation costs are included in personnel costs on the Consolidated Statements of Income. Stock options are granted at the closing market price on the date of the grant. Options granted typically vest ratably over four years or when other conditions are met. Stock options, which represented a portion of our grant values, have no intrinsic value until the stock price increases. Options granted on or after May 1, 2015 have a contractual term of ten years. All options granted on or before April 30, 2015 have a contractual term of seven years.
2015 Long-Term Incentive Plan
In 2015, shareholders approved the Huntington Bancshares Incorporated 2015 Long-Term Incentive Plan (the 2015 Plan). Shares remaining under the 2012 Plan have been incorporated into the 2015 Plan and reduced the full number of shares covered by all awards. Accordingly, the total number of shares authorized for awards under the 2015 Plan is 30 million shares. At December 31, 2015, 25 million shares from the Plan were available for future grants. Huntington issues shares to fulfill stock option exercises and restricted stock unit and award vesting from available authorized common shares. At December 31, 2015, Huntington believes there are adequate authorized common shares to satisfy anticipated stock option exercises and restricted stock unit and award vesting in 2016.
Huntington uses the Black-Scholes option pricing model to value options in determining our share-based compensation expense. Forfeitures are estimated at the date of grant based on historical rates, and updated as necessary, and reduce the compensation expense recognized. The risk-free interest rate is based on the U.S. Treasury yield curve in effect at the date of grant. The expected dividend yield is based on the dividend rate and stock price at the date of the grant. Expected volatility is based on the estimated volatility of Huntington’s stock over the expected term of the option.
The following table presents the weighted average assumptions used in the option-pricing model for options granted in the three years ended December 31, 2015, 2014, and 2013:
151
2015 |
2014 |
2013 |
||||||||||||
Assumptions |
||||||||||||||
Risk-free interest rate |
2.13 |
% |
1.69 |
% |
0.79 |
% |
||||||||
Expected dividend yield |
2.57 |
2.61 |
2.83 |
|||||||||||
Expected volatility of Huntington’s common stock |
29.0 |
32.3 |
35.0 |
|||||||||||
Expected option term (years) |
6.5 |
5.0 |
5.5 |
|||||||||||
Weighted-average grant date fair value per share |
$ |
2.57 |
$ |
2.13 |
$ |
1.71 |
||||||||
The following table presents total share-based compensation expense and related tax benefit for the three years ended December 31, 2015, 2014, and 2013:
(dollar amounts in thousands) |
2015 |
2014 |
2013 |
|||||||||||
Share-based compensation expense |
$ |
51,415 |
$ |
43,666 |
$ |
37,007 |
||||||||
Tax benefit |
17,618 |
14,779 |
12,472 |
|||||||||||
Huntington’s stock option activity and related information for the year ended December 31, 2015, was as follows:
(amounts in thousands, except years and per share amounts) |
Options |
Weighted- Average Exercise Price |
Weighted- Average Remaining Contractual Life (Years) |
Aggregate Intrinsic Value |
||||||||
Outstanding at January 1, 2015 |
19,619 |
$ |
6.99 |
|||||||||
Granted |
1,249 |
10.89 |
||||||||||
Assumed |
— |
|||||||||||
Exercised |
(4,269 |
) |
6.01 |
|||||||||
Forfeited/expired |
(478 |
) |
17.31 |
|||||||||
Outstanding at December 31, 2015 |
16,121 |
$ |
7.25 |
3.7 |
$ |
64,180 |
||||||
Expected to vest (1) |
3,499 |
$ |
9.02 |
6.3 |
$ |
7,154 |
||||||
Exercisable at December 31, 2015 |
12,299 |
$ |
6.69 |
2.9 |
$ |
56,450 |
||||||
(1) |
The number of options expected to vest includes an estimate of 323 thousand shares expected to be forfeited.
|
The aggregate intrinsic value represents the amount by which the fair value of underlying stock exceeds the “in-the-money” option exercise price. For the years ended December 31, 2015, 2014, and 2013, cash received for the exercises of stock options was $26 million, $21 million and $14 million, respectively. The tax benefit realized for the tax deductions from option exercises totaled $7 million, $4 million and $2 million in 2015, 2014, and 2013, respectively.
The weighted-average grant date fair value of nonvested shares granted for the years ended December 31, 2015, 2014, and 2013 were $10.86, $9.09, and $7.12, respectively. The total fair value of awards vested during the years ended December 31, 2015, 2014, and 2013 was $30 million, $26 million, and $14 million, respectively. As of December 31, 2015, the total unrecognized compensation cost related to nonvested awards was $71 million with a weighted-average expense recognition period of 2.4 years.
152
The following table presents additional information regarding options outstanding as of December 31, 2015:
(amounts in thousands, except years and per share amounts) |
Options Outstanding |
Exercisable Options |
|||||||||||||
|
Weighted-
Range of
Exercise Prices
|
Shares |
Weighted-
Average
Remaining
Contractual
Life (Years)
|
Weighted-
Average
Exercise
Price
|
Shares |
Weighted-
Average
Exercise
Price
|
||||||||||
$0 to $5.63 |
704 |
1.2 |
$ |
4.30 |
704 |
$ |
4.30 |
||||||||
$5.64 to $6.02 |
5,666 |
2.6 |
6.02 |
5,666 |
6.02 |
||||||||||
$6.03 to $15.95 |
9,482 |
4.6 |
6.98 |
5,660 |
6.98 |
||||||||||
$15.96 and over |
269 |
0.3 |
21.07 |
269 |
21.07 |
||||||||||
Total |
16,121 |
3.7 |
$ |
7.25 |
12,299 |
$ |
6.69 |
||||||||
Huntington also grants restricted stock, restricted stock units, performance share awards, and other stock-based awards. Restricted stock units and awards are issued at no cost to the recipient, and can be settled only in shares at the end of the vesting period. Restricted stock awards provide the holder with full voting rights and cash dividends during the vesting period. Restricted stock units do not provide the holder with voting rights or cash dividends during the vesting period, but do accrue a dividend equivalent that is paid upon vesting, and are subject to certain service restrictions. Performance share awards are payable contingent upon Huntington achieving certain predefined performance objectives over the three-year measurement period. The fair value of these awards is the closing market price of Huntington’s common stock on the grant date.
The following table summarizes the status of Huntington’s restricted stock units and performance share awards as of December 31, 2015, and activity for the year ended December 31, 2015:
Restricted Stock Awards |
Restricted Stock Units |
Performance Share Awards |
||||||||||||||||||
(amounts in thousands, except per share amounts) |
Quantity |
Weighted-
Average
Grant Date
Fair Value
Per Share
|
Quantity |
Weighted-
Average
Grant Date
Fair Value
Per Share
|
Quantity |
Weighted-
Average
Grant Date
Fair Value
Per Share
|
||||||||||||||
Nonvested at January 1, 2015 |
12 |
$ |
9.53 |
11,904 |
$ |
7.79 |
2,579 |
$ |
7.76 |
|||||||||||
Granted |
— |
— |
4,550 |
10.84 |
883 |
10.94 |
||||||||||||||
Assumed |
— |
— |
— |
— |
— |
— |
||||||||||||||
Vested |
(3 |
) |
9.53 |
(3,785 |
) |
7.11 |
(513 |
) |
6.77 |
|||||||||||
Forfeited |
(2 |
) |
9.53 |
(499 |
) |
8.53 |
(56 |
) |
6.88 |
|||||||||||
Nonvested at December 31, 2015 |
7 |
$ |
9.53 |
12,170 |
$ |
9.11 |
2,893 |
$ |
8.99 |
|||||||||||
15. BENEFIT PLANS
Huntington sponsors the Plan, a non-contributory defined benefit pension plan covering substantially all employees hired or rehired prior to January 1, 2010. The Plan, which was modified in 2013 and no longer accrues service benefits to participants, provides benefits based upon length of service and compensation levels. The funding policy of Huntington is to contribute an annual amount that is at least equal to the minimum funding requirements but not more than the amount deductible under the Internal Revenue Code. There were no required minimum contributions during 2015. During the 2013 third quarter, the board of directors approved, and management communicated, a curtailment of the Company’s pension plan effective December 31, 2013.
In addition, Huntington has an unfunded defined benefit post-retirement plan that provides certain healthcare and life insurance benefits to retired employees who have attained the age of 55 and have at least 10 years of vesting service under this plan. For any employee retiring on or after January 1, 1993, post-retirement healthcare benefits are based upon the employee’s number of months of service and are limited to the actual cost of coverage. Life insurance benefits are a percentage of the employee’s base salary at the time of retirement, with a maximum of $50,000 of coverage. The employer paid portion of the post-retirement health and life insurance plan was eliminated for employees retiring on and after March 1, 2010. Eligible employees retiring on and after March 1, 2010, who elect retiree medical coverage, will pay the full cost of this coverage. Huntington will not provide any employer paid life insurance to employees retiring on and after March 1, 2010. Eligible employees will be able to convert or port their existing life insurance at their own expense under the same terms that are available to all terminated employees.
On January 1, 2015, Huntington terminated the company sponsored retiree health care plan for Medicare eligible retirees and their dependents. Instead, Huntington will partner with a third-party to assist the retirees and their dependents in selecting individual
153
policies from a variety of carriers on a private exchange. This plan amendment resulted in a measurement of the liability at the approval date. The result of the measurement was a $5 million reduction of the liability and increase in accumulated other comprehensive income. It will also result in a reduction of expense over the estimated life of plan participants.
The following table shows the weighted-average assumptions used to determine the benefit obligation at December 31, 2015 and 2014, and the net periodic benefit cost for the years then ended:
Pension Benefits |
Post-Retirement Benefits |
||||||||||
2015 |
2014 |
2015 |
2014 |
||||||||
Weighted-average assumptions used to determine benefit obligations |
|||||||||||
Discount rate |
4.54 |
% |
4.12 |
% |
3.81 |
% |
3.72 |
% |
|||
Rate of compensation increase |
N/A |
N/A |
N/A |
N/A |
|||||||
Weighted-average assumptions used to determine net periodic benefit cost |
|||||||||||
Discount rate (1)(2)(3) |
4.12 |
4.89 |
3.73 |
4.11 |
|||||||
Expected return on plan assets |
7.00 |
7.25 |
N/A |
N/A |
|||||||
Rate of compensation increase |
N/A |
N/A |
N/A |
N/A |
|||||||
N/A—Not Applicable |
|||||||||||
(1) |
The 2014 post-retirement benefit expense was remeasured as of July 31, 2014. The discount rate was 4.27% from January 1, 2014 to July 31, 2014, and was changed to 3.89% for the period from July 31, 2014 to December 31, 2014.
|
(2) |
The 2015 post-retirement benefit expense was remeasured as of September 30, 2015. The discount rate was 3.72% from January 1, 2015 to September 30, 2015, and was changed to 3.77% for the period from September 30, 2015 to December 31, 2015.
|
The expected long-term rate of return on plan assets is an assumption reflecting the average rate of earnings expected on the funds invested or to be invested to provide for the benefits included in the projected benefit obligation. The expected long-term rate of return is established at the beginning of the plan year based upon historical returns and projected returns on the underlying mix of invested assets.
The following table reconciles the beginning and ending balances of the benefit obligation of the Plan and the post-retirement benefit plan with the amounts recognized in the consolidated balance sheets at December 31:
|
Pension
Benefits
|
Post-Retirement
Benefits
|
||||||||||||||
(dollar amounts in thousands) |
2015 |
2014 |
2015 |
2014 |
|||||||||||
Projected benefit obligation at beginning of measurement year |
$ |
799,594 |
$ |
684,999 |
$ |
15,963 |
$ |
25,669 |
|||||||
Changes due to: |
|||||||||||||||
Service cost |
1,830 |
1,740 |
— |
— |
|||||||||||
Interest cost |
31,937 |
32,398 |
506 |
856 |
|||||||||||
Benefits paid |
(17,246 |
) |
(16,221 |
) |
(2,211 |
) |
(3,401 |
) |
|||||||
Settlements |
(27,976 |
) |
(27,045 |
) |
(6,993 |
) |
— |
||||||||
Plan amendments |
— |
— |
— |
(8,782 |
) |
||||||||||
Plan curtailments |
— |
— |
— |
— |
|||||||||||
Medicare subsidies |
— |
— |
117 |
462 |
|||||||||||
Actuarial assumptions and gains and losses (1) |
(33,425 |
) |
123,723 |
643 |
1,159 |
||||||||||
Total changes |
(44,880 |
) |
114,595 |
(7,938 |
) |
(9,706 |
) |
||||||||
Projected benefit obligation at end of measurement year |
$ |
754,714 |
$ |
799,594 |
$ |
8,025 |
$ |
15,963 |
|||||||
(1) |
The 2014 actuarial assumptions include revised mortality tables. |
Benefits paid for post-retirement are net of retiree contributions collected by Huntington. The actual contributions received in 2015 and 2014 by Huntington for the retiree medical program were less than $1 million and $3 million, respectively.
154
The following table reconciles the beginning and ending balances of the fair value of Plan assets at the December 31, 2015 and 2014 measurement dates:
|
Pension
Benefits
|
|||||||
(dollar amounts in thousands) |
2015 |
2014 |
|||||
Fair value of plan assets at beginning of measurement year |
$ |
653,013 |
$ |
649,020 |
|||
Changes due to: |
|||||||
Actual return on plan assets |
(16,122 |
) |
44,312 |
||||
Settlements |
(25,428 |
) |
(24,098 |
) |
|||
Benefits paid |
(17,246 |
) |
(16,221 |
) |
|||
Total changes |
(58,796 |
) |
3,993 |
||||
Fair value of plan assets at end of measurement year |
$ |
594,217 |
$ |
653,013 |
|||
Huntington’s accumulated benefit obligation under the Plan was $755 million and $800 million at December 31, 2015 and 2014. As of December 31, 2015, the accumulated benefit obligation exceeded the fair value of Huntington’s plan assets by $160 million and is recorded in accrued expenses and other liabilities. The projected benefit obligation exceeded the fair value of Huntington’s plan assets by $160 million.
The following table shows the components of net periodic benefit costs recognized in the three years ended December 31, 2015:
Pension Benefits |
Post-Retirement Benefits |
||||||||||||||||||||||
(dollar amounts in thousands) |
2015 |
2014 |
2013 |
2015 |
2014 |
2013 |
|||||||||||||||||
Service cost |
$ |
1,830 |
$ |
1,740 |
$ |
25,122 |
$ |
— |
$ |
— |
$ |
— |
|||||||||||
Interest cost |
31,937 |
32,398 |
30,112 |
506 |
856 |
862 |
|||||||||||||||||
Expected return on plan assets |
(44,175 |
) |
(45,783 |
) |
(47,716 |
) |
— |
— |
— |
||||||||||||||
Amortization of prior service cost |
— |
— |
(2,883 |
) |
(1,968 |
) |
(1,609 |
) |
(1,353 |
) |
|||||||||||||
Amortization of loss |
7,934 |
5,767 |
23,044 |
(401 |
) |
(571 |
) |
(600 |
) |
||||||||||||||
Curtailment |
— |
— |
(34,613 |
) |
— |
— |
— |
||||||||||||||||
Settlements |
12,645 |
11,200 |
8,116 |
(3,090 |
) |
— |
— |
||||||||||||||||
Benefit costs |
$ |
10,171 |
$ |
5,322 |
$ |
1,182 |
$ |
(4,953 |
) |
$ |
(1,324 |
) |
$ |
(1,091 |
) |
||||||||
Included in benefit costs are $4 million, $2 million, and $2 million of plan expenses that were recognized in the three years ended December 31, 2015, 2014, and 2013. It is Huntington’s policy to recognize settlement gains and losses as incurred. Assuming no cash contributions are made to the Plan during 2016, Management expects net periodic pension benefit, excluding any expense of settlements, to approximate $2 million for 2016. The postretirement medical and life subsidy was eliminated for anyone who retires on or after March 1, 2010. As such, there were no incremental net periodic post-retirement benefits costs associated with this plan.
The estimated transition obligation, prior service credit, and net actuarial loss for the plans that will be amortized from OCI into net periodic benefit cost over the next fiscal year is zero, $2 million, and a $8 million benefit, respectively.
At December 31, 2015 and 2014, The Huntington National Bank, as trustee, held all Plan assets. The Plan assets consisted of investments in a variety of corporate and government fixed income investments, money market funds, and Huntington mutual funds as follows:
155
Fair Value |
|||||||||||||
(dollar amounts in thousands) |
2015 |
2014 |
|||||||||||
Cash equivalents: |
|||||||||||||
Federated-money market |
$ |
15,590 |
3 |
% |
$ |
— |
— |
% |
|||||
Huntington funds—money market |
— |
— |
16,136 |
2 |
|||||||||
Fixed income: |
|||||||||||||
Corporate obligations |
205,081 |
34 |
218,077 |
33 |
|||||||||
U.S. Government Obligations |
64,456 |
11 |
62,627 |
10 |
|||||||||
Mutual funds-fixed income |
32,874 |
6 |
34,761 |
5 |
|||||||||
U.S. Government Agencies |
6,979 |
1 |
7,445 |
1 |
|||||||||
Equities: |
|||||||||||||
Mutual funds-equities |
136,026 |
23 |
147,191 |
23 |
|||||||||
Other common stock |
120,046 |
20 |
118,970 |
18 |
|||||||||
Huntington funds |
— |
— |
37,920 |
6 |
|||||||||
Exchange Traded Funds |
6,530 |
1 |
6,840 |
1 |
|||||||||
Limited Partnerships |
6,635 |
1 |
3,046 |
1 |
|||||||||
Fair value of plan assets |
$ |
594,217 |
100 |
% |
$ |
653,013 |
100 |
% |
|||||
Investments of the Plan are accounted for at cost on the trade date and are reported at fair value. The valuation methodologies used to measure the fair value of pension plan assets vary depending on the type of asset. For an explanation of the fair value hierarchy, refer to Note 1 “Significant Accounting Policies” under the heading “Fair Value Measurements”. At December 31, 2015, equities and money market funds are classified as Level 1; mutual funds-fixed income, corporate obligations, U.S. government obligations, and U.S. government agencies are classified as Level 2; and limited partnerships are classified as Level 3.
In general, investments of the Plan are exposed to various risks such as interest rate risk, credit risk, and overall market volatility. Due to the level of risk associated with certain investments, it is reasonably possible changes in the values of investments will occur in the near term and such changes could materially affect the amounts reported in the Plan assets.
The investment objective of the Plan is to maximize the return on Plan assets over a long-time period, while meeting the Plan obligations. At December 31, 2015, Plan assets were invested 3% in cash and cash equivalents, 45% in equity investments, and 52% in bonds, with an average duration of 12.2 years on bond investments. The estimated life of benefit obligations was 11.9 years. Although it may fluctuate with market conditions, Management has targeted a long-term allocation of Plan assets of 20% to 50% in equity investments and 80% to 50% in bond investments. The allocation of Plan assets between equity investments and fixed income investments will change from time to time with the allocation to fixed income investments increasing as the funding level increases.
The following table shows the number of shares and dividends received on shares of Huntington stock held by the Plan:
December 31, |
|||||||
(dollar amounts in thousands, except share amounts) |
2015 |
2014 |
|||||
Dividends received on shares of Huntington stock |
$ |
— |
$ |
267 |
|||
At December 31, 2015, the following table shows when benefit payments were expected to be paid:
(dollar amounts in thousands) |
Pension
Benefits
|
Post-
Retirement
Benefits
|
|||||
2016 |
$ |
51,333 |
$ |
986 |
|||
2017 |
50,323 |
823 |
|||||
2018 |
48,457 |
743 |
|||||
2019 |
47,435 |
686 |
|||||
2020 |
46,629 |
644 |
|||||
2021 through 2025 |
221,569 |
2,738 |
|||||
Although not required, a cash contribution can be made to the Plan up to the maximum deductible limit in the plan year. Anticipated contributions for 2016 to the post-retirement benefit plan are zero.
156
The 2016 healthcare cost trend rate is projected to be 7.0% for participants. This rate is assumed to decrease gradually until it reaches 4.5% in the year 2028 and remain at that level thereafter. Huntington updated the immediate healthcare cost trend rate assumption based on current market data and Huntington’s claims experience. This trend rate is expected to decline over time to a trend level consistent with medical inflation and long-term economic assumptions.
Huntington also sponsors other nonqualified retirement plans, the most significant being the SERP and the SRIP. The SERP provides certain former officers and directors, and the SRIP provides certain current and former officers and directors of Huntington and its subsidiaries with defined pension benefits in excess of limits imposed by federal tax law. At December 31, 2015 and 2014, Huntington has an accrued pension liability of $34 million and $35 million, respectively, associated with these plans. Pension expense for the plans was $1 million, $1 million, and $4 million in 2015, 2014, and 2013, respectively. During the 2013 third quarter, the board of directors approved, and management communicated, a curtailment of the Company’s SRIP plan effective December 31, 2013.
The following table presents the amounts recognized in the Consolidated Balance Sheets at December 31, 2015 and 2014, for all of Huntington's defined benefit plans:
(dollar amounts in thousands) |
2015 |
2014 |
|||||
Accrued expenses and other liabilities (1) |
$ |
192,734 |
$ |
198,947 |
|||
(1) |
A current liability of $2 million is included in the amounts above at December 31, 2015 and 2014; the remaining amount is classified as a noncurrent liability.
|
The following tables present the amounts recognized in OCI as of December 31, 2015, 2014, and 2013, and the changes in accumulated OCI for the years ended December 31, 2015, 2014, and 2013:
(dollar amounts in thousands) |
2015 |
2014 |
2013 |
||||||||
Net actuarial loss |
$ |
(243,984 |
) |
$ |
(240,197 |
) |
$ |
(166,078 |
) |
||
Prior service cost |
13,237 |
14,517 |
9,855 |
||||||||
Defined benefit pension plans |
$ |
(230,747 |
) |
$ |
(225,680 |
) |
$ |
(156,223 |
) |
||
2015 |
|||||||||||
(dollar amounts in thousands) |
Pretax |
Benefit |
After-tax |
||||||||
Balance, beginning of year |
$ |
(347,202 |
) |
$ |
121,522 |
$ |
(225,680 |
) |
|||
Net actuarial (loss) gain: |
|||||||||||
Amounts arising during the year |
(25,520 |
) |
8,931 |
(16,589 |
) |
||||||
Amortization included in net periodic benefit costs |
19,693 |
(6,892 |
) |
12,801 |
|||||||
Prior service cost: |
|||||||||||
Amounts arising during the year |
— |
— |
— |
||||||||
Amortization included in net periodic benefit costs |
(1,968 |
) |
689 |
(1,279 |
) |
||||||
Balance, end of year |
$ |
(354,997 |
) |
$ |
124,250 |
$ |
(230,747 |
) |
|||
2014 |
|||||||||||
(dollar amounts in thousands) |
Pretax |
Benefit |
After-tax |
||||||||
Balance, beginning of year |
$ |
(240,345 |
) |
$ |
84,122 |
$ |
(156,223 |
) |
|||
Net actuarial (loss) gain: |
|||||||||||
Amounts arising during the year |
(133,085 |
) |
46,580 |
(86,505 |
) |
||||||
Amortization included in net periodic benefit costs |
19,056 |
(6,670 |
) |
12,386 |
|||||||
Prior service cost: |
|||||||||||
Amounts arising during the year |
8,781 |
(3,073 |
) |
5,708 |
|||||||
Amortization included in net periodic benefit costs |
(1,609 |
) |
563 |
(1,046 |
) |
||||||
Balance, end of year |
$ |
(347,202 |
) |
$ |
121,522 |
$ |
(225,680 |
) |
|||
157
2013 |
|||||||||||
(dollar amounts in thousands) |
Pretax |
Benefit |
After-tax |
||||||||
Balance, beginning of year |
$ |
(363,691 |
) |
$ |
127,292 |
$ |
(236,399 |
) |
|||
Net actuarial (loss) gain: |
|||||||||||
Amounts arising during the year |
118,666 |
(41,532 |
) |
77,134 |
|||||||
Amortization included in net periodic benefit costs |
29,194 |
(10,218 |
) |
18,976 |
|||||||
Prior service cost: |
|||||||||||
Amounts arising during the year |
— |
— |
— |
||||||||
Amortization included in net periodic benefit costs |
(24,514 |
) |
8,580 |
(15,934 |
) |
||||||
Balance, end of year |
$ |
(240,345 |
) |
$ |
84,122 |
$ |
(156,223 |
) |
|||
Huntington has a defined contribution plan that is available to eligible employees. Huntington matches participant contributions, up to the first 4% of base pay contributed to the Plan. For 2014 and 2015, a discretionary profit-sharing contribution equal to 1% of eligible participants’ annual base pay was awarded.
The following table shows the costs of providing the defined contribution plan:
Year ended December 31, |
|||||||||||
(dollar amounts in thousands) |
2015 |
2014 |
2013 |
||||||||
Defined contribution plan |
$ |
31,896 |
$ |
31,110 |
$ |
18,238 |
|||||
The following table shows the number of shares, market value, and dividends received on shares of Huntington stock held by the defined contribution plan:
December 31, |
|||||||
(dollar amounts in thousands, except share amounts) |
2015 |
2014 |
|||||
Shares in Huntington common stock |
13,076,164 |
12,883,333 |
|||||
Market value of Huntington common stock |
$ |
144,622 |
$ |
135,533 |
|||
Dividends received on shares of Huntington stock |
3,076 |
2,694 |
|||||
16. INCOME TAXES
The Company and its subsidiaries file income tax returns in the U.S. federal jurisdiction and various state, city, and foreign jurisdictions. Federal income tax audits have been completed through 2009. The IRS is currently examining our 2010 and 2011 consolidated federal income tax returns. Various state and other jurisdictions remain open to examination, including Ohio, Kentucky, Indiana, Michigan, Pennsylvania, West Virginia, and Illinois.
Huntington accounts for uncertainties in income taxes in accordance with ASC 740, Income Taxes. At December 31, 2015, Huntington had gross unrecognized tax benefits of $23 million in income tax liability related to uncertain tax positions. Due to the complexities of some of these uncertainties, the ultimate resolution may result in a payment that is materially different from the current estimate of the tax liabilities. Huntington does not anticipate the total amount of gross unrecognized tax benefits to significantly change within the next 12 months.
The following table provides a reconciliation of the beginning and ending amounts of gross unrecognized tax benefits:
(dollar amounts in thousands) |
2015 |
2014 |
|||||
Unrecognized tax benefits at beginning of year |
$ |
1,172 |
$ |
704 |
|||
Gross increases for tax positions taken during current period |
23,104 |
— |
|||||
Gross increases for tax positions taken during prior years |
— |
468 |
|||||
Gross decreases for tax positions taken during prior years |
(1,172 |
) |
— |
||||
Unrecognized tax benefits at end of year |
$ |
23,104 |
$ |
1,172 |
|||
Any interest and penalties on income tax assessments or income tax refunds are recognized in the Consolidated Statements of Income as a component of provision for income taxes. Huntington recognized, $0.1 million of interest benefit, $0.1 million of interest expense, and $0.2 million of interest benefit for the years ended December 31, 2015, 2014 and 2013, respectively. Total interest
158
accrued was $0.1 million and $0.2 million at December 31, 2015 and 2014, respectively. All of the gross unrecognized tax benefits would impact the Company’s effective tax rate if recognized.
The following is a summary of the provision (benefit) for income taxes:
Year Ended December 31, |
|||||||||||
(dollar amounts in thousands) |
2015 |
2014 |
2013 |
||||||||
Current tax provision (benefit) |
|||||||||||
Federal |
$ |
146,195 |
$ |
186,436 |
$ |
117,174 |
|||||
State |
5,677 |
(1,017 |
) |
4,278 |
|||||||
Total current tax provision (benefit) |
151,872 |
185,419 |
121,452 |
||||||||
Deferred tax provision (benefit) |
|||||||||||
Federal |
66,823 |
41,167 |
112,681 |
||||||||
State |
1,953 |
(5,993 |
) |
(6,659 |
) |
||||||
Total deferred tax provision (benefit) |
68,776 |
35,174 |
106,022 |
||||||||
Provision for income taxes |
$ |
220,648 |
$ |
220,593 |
$ |
227,474 |
|||||
The following is a reconcilement of provision for income taxes:
Year Ended December 31, |
|||||||||||
(dollar amounts in thousands) |
2015 |
2014 |
2013 |
||||||||
Provision for income taxes computed at the statutory rate |
$ |
319,762 |
$ |
298,545 |
$ |
304,065 |
|||||
Increases (decreases): |
|||||||||||
Tax-exempt income |
(20,839 |
) |
(17,971 |
) |
(34,378 |
) |
|||||
Tax-exempt bank owned life insurance income |
(18,340 |
) |
(19,967 |
) |
(19,747 |
) |
|||||
General business credits |
(47,894 |
) |
(46,047 |
) |
(39,868 |
) |
|||||
State deferred tax asset valuation allowance adjustment, net |
— |
(7,430 |
) |
(6,020 |
) |
||||||
Capital loss |
(46,288 |
) |
(26,948 |
) |
(961 |
) |
|||||
Affordable housing investment amortization, net of tax benefits |
31,741 |
33,752 |
16,851 |
||||||||
State income taxes, net |
4,960 |
2,873 |
4,472 |
||||||||
Other |
(2,454 |
) |
3,786 |
3,060 |
|||||||
Provision for income taxes |
$ |
220,648 |
$ |
220,593 |
$ |
227,474 |
|||||
159
The significant components of deferred tax assets and liabilities at December 31, were as follows:
At December 31, |
|||||||
(dollar amounts in thousands) |
2015 |
2014 |
|||||
Deferred tax assets: |
|||||||
Allowances for credit losses |
$ |
238,415 |
$ |
233,656 |
|||
Fair value adjustments |
121,642 |
119,512 |
|||||
Net operating and other loss carryforward |
61,492 |
161,548 |
|||||
Accrued expense/prepaid |
44,733 |
48,656 |
|||||
Purchase accounting adjustments |
41,917 |
13,839 |
|||||
Partnership investments |
21,614 |
24,123 |
|||||
Market discount |
11,781 |
12,215 |
|||||
Pension and other employee benefits |
2,405 |
— |
|||||
Tax credit carryforward |
1,823 |
30,825 |
|||||
Other |
11,645 |
9,477 |
|||||
Total deferred tax assets |
557,467 |
653,851 |
|||||
Deferred tax liabilities: |
|||||||
Lease financing |
261,078 |
202,298 |
|||||
Loan origination costs |
114,488 |
103,025 |
|||||
Mortgage servicing rights |
48,514 |
47,748 |
|||||
Operating assets |
46,685 |
50,266 |
|||||
Securities adjustments |
19,952 |
27,856 |
|||||
Purchase accounting adjustments |
6,944 |
17,299 |
|||||
Pension and other employee benefits |
— |
9,677 |
|||||
Other |
5,463 |
5,178 |
|||||
Total deferred tax liabilities |
503,124 |
463,347 |
|||||
Net deferred tax asset before valuation allowance |
54,343 |
190,504 |
|||||
Valuation allowance |
(3,620 |
) |
(73,057 |
) |
|||
Net deferred tax asset |
$ |
50,723 |
$ |
117,447 |
|||
At December 31, 2015, Huntington’s net deferred tax asset related to loss and other carryforwards was $63 million. This was comprised of federal net operating loss carryforwards of $3 million, which will begin expiring in 2023, $45 million of state net operating loss carryforwards, which will begin expiring in 2016, an alternative minimum tax credit carryforward of $1 million, which may be carried forward indefinitely, a general business credit carryforward of $1 million, which will begin expiring in 2031, and a capital loss carryforward of $13 million, which expires in 2018.
In prior periods, Huntington established a valuation allowance against deferred tax assets for federal capital loss carryforwards, state deferred tax assets, and state net operating loss carryforwards. The federal valuation allowance was based on the uncertainty of forecasted federal taxable income expected of the required character in order to utilize the capital loss carryforward. The state valuation allowance was based on the uncertainty of forecasted state taxable income expected in applicable jurisdictions in order to utilize the state deferred tax assets and state net operating loss carryforwards. Based on current analysis of both positive and negative evidence and projected forecasted taxable income of the appropriate character and/or within applicable jurisdictions, the Company believes that it is more likely than not the federal capital loss carryforward, and portions of the state deferred tax assets and state net operating loss carryforwards will be realized. As a result of this analysis, there is no federal capital loss carryforward valuation allowance remaining at December 31, 2015 compared to $69 million at December 31, 2014, and the state valuation allowance of $4 million at December 31, 2015 was essentially unchanged compared to $4 million at December 31, 2014.
At December 31, 2015 retained earnings included approximately $12 million of base year reserves of acquired thrift institutions, for which no deferred federal income tax liability has been recognized. Under current law, if these bad debt reserves are used for purposes other than to absorb bad debt losses, they will be subject to federal income tax at the current corporate rate. The amount of unrecognized deferred tax liability relating to the cumulative bad debt deduction was approximately $4 million at December 31, 2015.
160
17. FAIR VALUES OF ASSETS AND LIABILITIES
Following is a description of the valuation methodologies used for instruments measured at fair value, as well as the general classification of such instruments pursuant to the valuation hierarchy.
Mortgage loans held for sale
Huntington has elected to apply the fair value option for mortgage loans originated with the intent to sell which are included in loans held for sale. Mortgage loans held for sale are classified as Level 2 and are estimated using security prices for similar product types.
Mortgage loans held for investment
Mortgages are loans originated with the intent to sell and are measured at fair value with adjustments recognized through the Consolidated Statements of Income. During the year, certain mortgage loans have been reclassified to mortgage loans held for investment. These loans continue to be measured at fair value. The fair value is determined using fair value of mortgage-backed securities adjusted for loan specific variables.
Available-for-sale securities and trading account securities
Securities accounted for at fair value include both the available-for-sale and trading portfolios. Huntington uses prices obtained from third-party pricing services and recent trades to determine the fair value of securities. AFS and trading securities are classified as Level 1 using quoted market prices (unadjusted) in active markets for identical securities that Huntington has the ability to access at the measurement date. Less than 1% of the positions in these portfolios are Level 1, and consist of U.S. Treasury securities and money market mutual funds. When quoted market prices are not available, fair values are classified as Level 2 using quoted prices for similar assets in active markets, quoted prices of identical or similar assets in markets that are not active, and inputs that are observable for the asset, either directly or indirectly, for substantially the full term of the financial instrument. 74% of the positions in these portfolios are Level 2, and consist of U.S. Government and agency debt securities, agency mortgage backed securities, asset-backed securities, municipal securities and other securities. For Level 2 securities management uses various methods and techniques to corroborate prices obtained from the pricing service, including references to dealer or other market quotes, and by reviewing valuations of comparable instruments. If relevant market prices are limited or unavailable, valuations may require significant management judgment or estimation to determine fair value, in which case the fair values are classified as Level 3. 26% of our positions are Level 3, and consist of private-label CMO securities, CDO-preferred securities and municipal securities. A significant change in the unobservable inputs for these securities may result in a significant change in the ending fair value measurement of these securities.
The municipal securities portion that is classified as Level 3 uses significant estimates to determine the fair value of these securities which results in greater subjectivity. The fair value is determined by utilizing third-party valuation services. The third-party service provider reviews credit worthiness, prevailing market rates, analysis of similar securities, and projected cash flows. The third-party service provider also incorporates industry and general economic conditions into their analysis. Huntington evaluates the analysis provided for reasonableness.
The private label CMO and CDO-preferred securities portfolios are classified as Level 3 and as such use significant estimates to determine the fair value of these securities which results in greater subjectivity. The private label CMO securities portfolios are subjected to a monthly review of the projected cash flows, while the cash flows of the CDO-preferred securities portfolio are reviewed quarterly. These reviews are supported with analysis from independent third parties, and are used as a basis for impairment analysis.
Private-label CMO securities are collateralized by first-lien residential mortgage loans. The securities valuation methodology incorporates values obtained from a third-party pricing specialist using a discounted cash flow approach and a proprietary pricing model and includes assumptions management believes market participants would use to value the securities under current market conditions. The model uses inputs such as estimated prepayment speeds, losses, recoveries, default rates that are implied by the underlying performance of collateral in the structure or similar structures, house price depreciation / appreciation rates that are based upon macroeconomic forecasts and discount rates that are implied by market prices for similar securities with similar collateral structures. The Private-label CMO securities were sold during the 2015 third quarter.
CDO-preferred securities are CDOs backed by a pool of debt securities issued by financial institutions. The collateral generally consists of trust-preferred securities and subordinated debt securities issued by banks, bank holding companies, and insurance companies. A cash flow analysis is used to estimate fair values and assess impairment for each security within this portfolio. We engage a third-party pricing specialist with direct industry experience in CDO-preferred securities valuations to provide assistance in estimating the fair value and expected cash flows for each security in this portfolio. The PD of each issuer
161
and the market discount rate are the most significant inputs in determining fair value. Management evaluates the PD assumptions provided by the third-party pricing specialist by comparing the current PD to the assumptions used the previous quarter, actual defaults and deferrals in the current period, and trend data on certain financial ratios of the issuers. Huntington also evaluates the assumptions related to discount rates. Relying on cash flows is necessary because there was a lack of observable transactions in the market and many of the original sponsors or dealers for these securities are no longer able to provide a fair value.
Automobile loans
Effective January 1, 2010, Huntington consolidated an automobile loan securitization that previously had been accounted for as an off-balance sheet transaction. As a result, Huntington elected to account for these automobile loan receivables at fair value per guidance supplied in ASC 825. The automobile loan receivables are classified as Level 3. The key assumptions used to determine the fair value of the automobile loan receivables included projections of expected losses and prepayment of the underlying loans in the portfolio and a market assumption of interest rate spreads. Certain interest rates are available from similarly traded securities while other interest rates are developed internally based on similar asset-backed security transactions in the market. During the first quarter of 2014, Huntington canceled the 2009 and 2006 Automobile Trusts. Huntington continues to report the associated automobile loan receivables at fair value due to its 2010 election.
MSRs
MSRs do not trade in an active market with readily observable prices. Accordingly, the fair value of these assets is classified as Level 3. Huntington determines the fair value of MSRs using an income approach model based upon our month-end interest rate curve and prepayment assumptions. The model utilizes assumptions to estimate future net servicing income cash flows, including estimates of time decay, payoffs, and changes in valuation inputs and assumptions. Servicing brokers and other sources of information (e.g. discussion with other mortgage servicers and industry surveys) are used to obtain information on market practice and assumptions. On at least a quarterly basis, third-party marks are obtained from at least one servicing broker. Huntington reviews the valuation assumptions against this market data for reasonableness and adjusts the assumptions if deemed appropriate. Any recommended change in assumptions and/or inputs are presented for review to the Mortgage Price Risk Subcommittee for final approval.
Derivative assets and liabilities
Derivatives classified as Level 2 consist of foreign exchange and commodity contracts, which are valued using exchange traded swaps and futures market data. In addition, Level 2 includes interest rate contracts, which are valued using a discounted cash flow method that incorporates current market interest rates. Level 2 also includes exchange traded options and forward commitments to deliver mortgage-backed securities, which are valued using quoted prices.
Derivatives classified as Level 3 consist of interest rate lock agreements related to mortgage loan commitments. The determination of fair value includes assumptions related to the likelihood that a commitment will ultimately result in a closed loan, which is a significant unobservable assumption. A significant increase or decrease in the external market price would result in a significantly higher or lower fair value measurement.
Short-term borrowings
Short-term borrowings classified as Level 2 consist primarily of U.S. treasury bond securities sold under agreement to repurchase. These securities are borrowed from other institutions and must be repaid by purchasing the securities in the open market.
Assets and Liabilities measured at fair value on a recurring basis
Assets and liabilities measured at fair value on a recurring basis at December 31, 2015 and 2014 are summarized below:
162
Fair Value Measurements at Reporting Date Using |
Netting Adjustments (1) |
December 31, 2015 |
|||||||||||||||||
(dollar amounts in thousands) |
Level 1 |
Level 2 |
Level 3 |
||||||||||||||||
Assets |
|||||||||||||||||||
Loans held for sale |
$ |
— |
$ |
337,577 |
$ |
— |
$ |
— |
$ |
337,577 |
|||||||||
Loans held for investment |
— |
32,889 |
— |
— |
32,889 |
||||||||||||||
Trading account securities: |
|||||||||||||||||||
Municipal securities |
— |
4,159 |
— |
— |
4,159 |
||||||||||||||
Other securities |
32,475 |
363 |
— |
— |
32,838 |
||||||||||||||
32,475 |
4,522 |
— |
— |
36,997 |
|||||||||||||||
Available-for-sale and other securities: |
|||||||||||||||||||
U.S. Treasury securities |
5,472 |
— |
— |
— |
5,472 |
||||||||||||||
Federal agencies: Mortgage-backed |
— |
4,521,688 |
— |
— |
4,521,688 |
||||||||||||||
Federal agencies: Other agencies |
— |
115,913 |
— |
— |
115,913 |
||||||||||||||
Municipal securities |
— |
360,845 |
2,095,551 |
— |
2,456,396 |
||||||||||||||
Asset-backed securities |
— |
761,076 |
100,337 |
— |
861,413 |
||||||||||||||
Corporate debt |
— |
466,477 |
— |
— |
466,477 |
||||||||||||||
Other securities |
11,397 |
3,899 |
— |
— |
15,296 |
||||||||||||||
16,869 |
6,229,898 |
2,195,888 |
— |
8,442,655 |
|||||||||||||||
Automobile loans |
— |
— |
1,748 |
— |
1,748 |
||||||||||||||
MSRs |
— |
— |
17,585 |
— |
17,585 |
||||||||||||||
Derivative assets |
— |
429,448 |
6,721 |
(161,297 |
) |
274,872 |
|||||||||||||
Liabilities |
|||||||||||||||||||
Derivative liabilities |
— |
287,994 |
665 |
(144,309 |
) |
144,350 |
|||||||||||||
Short-term borrowings |
— |
1,770 |
— |
— |
1,770 |
||||||||||||||
163
Fair Value Measurements at Reporting Date Using |
Netting Adjustments (1) |
December 31, 2014 |
|||||||||||||||||
(dollar amounts in thousands) |
Level 1 |
Level 2 |
Level 3 |
||||||||||||||||
Assets |
|||||||||||||||||||
Loans held for sale |
$ |
— |
$ |
354,888 |
$ |
— |
$ |
— |
$ |
354,888 |
|||||||||
Loans held for investment |
— |
40,027 |
— |
— |
40,027 |
||||||||||||||
Trading account securities: |
|||||||||||||||||||
Federal agencies: Other agencies |
— |
2,857 |
— |
— |
2,857 |
||||||||||||||
Municipal securities |
— |
5,098 |
— |
— |
5,098 |
||||||||||||||
Other securities |
33,121 |
1,115 |
— |
— |
34,236 |
||||||||||||||
33,121 |
9,070 |
— |
— |
42,191 |
|||||||||||||||
Available-for-sale and other securities: |
|||||||||||||||||||
U.S. Treasury securities |
5,452 |
— |
— |
— |
5,452 |
||||||||||||||
Federal agencies: Mortgage-backed |
— |
5,322,701 |
— |
— |
5,322,701 |
||||||||||||||
Federal agencies: Other agencies |
— |
351,543 |
— |
— |
351,543 |
||||||||||||||
Municipal securities |
— |
450,976 |
1,417,593 |
— |
1,868,569 |
||||||||||||||
Private-label CMO |
— |
11,462 |
30,464 |
— |
41,926 |
||||||||||||||
Asset-backed securities |
— |
873,260 |
82,738 |
— |
955,998 |
||||||||||||||
Corporate debt |
— |
486,176 |
— |
— |
486,176 |
||||||||||||||
Other securities |
17,430 |
3,316 |
— |
— |
20,746 |
||||||||||||||
22,882 |
7,499,434 |
1,530,795 |
— |
9,053,111 |
|||||||||||||||
Automobile loans |
— |
— |
10,590 |
— |
10,590 |
||||||||||||||
MSRs |
— |
— |
22,786 |
— |
22,786 |
||||||||||||||
Derivative assets |
— |
449,775 |
4,064 |
(101,197 |
) |
352,642 |
|||||||||||||
Liabilities |
|||||||||||||||||||
Derivative liabilities |
— |
335,524 |
704 |
(51,973 |
) |
284,255 |
|||||||||||||
Short-term borrowings |
— |
2,295 |
— |
— |
2,295 |
||||||||||||||
(1) |
Amounts represent the impact of legally enforceable master netting agreements that allow the Company to settle positive and negative positions and cash collateral held or placed with the same counterparties. |
The tables below present a rollforward of the balance sheet amounts for the years ended December 31, 2015, 2014, and 2013 for financial instruments measured on a recurring basis and classified as Level 3. The classification of an item as Level 3 is based on the significance of the unobservable inputs to the overall fair value measurement. However, Level 3 measurements may also include observable components of value that can be validated externally. Accordingly, the gains and losses in the table below include changes in fair value due in part to observable factors that are part of the valuation methodology.
164
Level 3 Fair Value Measurements Year ended December 31, 2015 |
|||||||||||||||||||||||
Available-for-sale securities |
|||||||||||||||||||||||
(dollar amounts in thousands) |
MSRs |
Derivative
instruments
|
Municipal
securities
|
Private-
label
CMO
|
Asset-
backed
securities
|
Automobile
loans
|
|||||||||||||||||
Opening balance |
$ |
22,786 |
$ |
3,360 |
$ |
1,417,593 |
$ |
30,464 |
$ |
82,738 |
$ |
10,590 |
|||||||||||
Transfers into Level 3 |
— |
— |
— |
— |
— |
— |
|||||||||||||||||
Transfers out of Level 3 (1) |
— |
(2,793 |
) |
— |
— |
— |
— |
||||||||||||||||
Total gains/losses for the period: |
|||||||||||||||||||||||
Included in earnings |
(5,201 |
) |
5,489 |
149 |
47 |
(2,400 |
) |
(497 |
) |
||||||||||||||
Included in OCI |
— |
— |
(3,652 |
) |
1,832 |
24,802 |
— |
||||||||||||||||
Purchases/originations |
— |
— |
1,002,153 |
— |
— |
— |
|||||||||||||||||
Sales |
— |
— |
(9,656 |
) |
(30,077 |
) |
— |
— |
|||||||||||||||
Repayments |
— |
— |
— |
— |
— |
(8,345 |
) |
||||||||||||||||
Issues |
— |
— |
— |
— |
— |
— |
|||||||||||||||||
Settlements |
— |
— |
(311,036 |
) |
(2,266 |
) |
(4,803 |
) |
— |
||||||||||||||
Closing balance |
$ |
17,585 |
$ |
6,056 |
$ |
2,095,551 |
$ |
— |
$ |
100,337 |
$ |
1,748 |
|||||||||||
Change in unrealized gains or losses for the period included in earnings (or changes in net assets) for assets held at end of the reporting date |
$ |
(5,201 |
) |
$ |
5,489 |
$ |
— |
$ |
— |
$ |
(2,440 |
) |
$ |
(497 |
) |
||||||||
(1) Transfers out of Level 3 represent the settlement value of the derivative instruments (i.e. interest rate lock agreements) that is transferred to loans held for sale, which is classified as Level 2.
Level 3 Fair Value Measurements Year ended December 31, 2014 |
|||||||||||||||||||||||
Available-for-sale securities |
|||||||||||||||||||||||
(dollar amounts in thousands) |
MSRs |
Derivative
instruments
|
Municipal
securities
|
Private-
label
CMO
|
Asset-
backed
securities
|
Automobile
loans
|
|||||||||||||||||
Opening balance |
$ |
34,236 |
$ |
2,390 |
$ |
654,537 |
$ |
32,140 |
$ |
107,419 |
$ |
52,286 |
|||||||||||
Transfers into Level 3 |
— |
— |
— |
— |
— |
— |
|||||||||||||||||
Transfers out of Level 3 |
— |
— |
— |
— |
— |
— |
|||||||||||||||||
Total gains/losses for the period: |
|||||||||||||||||||||||
Included in earnings |
(11,450 |
) |
3,047 |
— |
36 |
226 |
(918 |
) |
|||||||||||||||
Included in OCI |
— |
— |
14,776 |
452 |
21,839 |
— |
|||||||||||||||||
Purchases/originations |
— |
— |
1,038,348 |
— |
— |
— |
|||||||||||||||||
Sales |
— |
— |
— |
— |
(22,870 |
) |
— |
||||||||||||||||
Repayments |
— |
— |
— |
— |
— |
(40,778 |
) |
||||||||||||||||
Issues |
— |
— |
— |
— |
— |
— |
|||||||||||||||||
Settlements |
— |
(2,077 |
) |
(290,068 |
) |
(2,164 |
) |
(23,876 |
) |
— |
|||||||||||||
Closing balance |
$ |
22,786 |
$ |
3,360 |
$ |
1,417,593 |
$ |
30,464 |
$ |
82,738 |
$ |
10,590 |
|||||||||||
Change in unrealized gains or losses for the period included in earnings (or changes in net assets) for assets held at end of the reporting date |
$ |
(11,450 |
) |
$ |
3,047 |
$ |
14,776 |
$ |
452 |
$ |
21,137 |
$ |
(1,624 |
) |
|||||||||
165
Level 3 Fair Value Measurements Year ended December 31, 2013 |
|||||||||||||||||||||||
Available-for-sale securities |
|||||||||||||||||||||||
(dollar amounts in thousands) |
MSRs |
Derivative
instruments
|
Municipal
securities
|
Private
label CMO
|
Asset-
backed
securities
|
Automobile
loans
|
|||||||||||||||||
Balance, beginning of year |
$ |
35,202 |
$ |
12,702 |
$ |
61,228 |
$ |
48,775 |
$ |
110,037 |
$ |
142,762 |
|||||||||||
Total gains / losses: |
|||||||||||||||||||||||
Included in earnings |
(966 |
) |
(5,944 |
) |
2,129 |
(180 |
) |
(2,244 |
) |
(358 |
) |
||||||||||||
Included in OCI |
— |
— |
9,075 |
1,703 |
35,139 |
— |
|||||||||||||||||
Other (1) |
— |
— |
600,435 |
— |
— |
— |
|||||||||||||||||
Sales |
— |
— |
— |
(10,254 |
) |
(16,711 |
) |
— |
|||||||||||||||
Repayments |
— |
— |
— |
— |
— |
(90,118 |
) |
||||||||||||||||
Settlements |
— |
(4,368 |
) |
(18,330 |
) |
(7,904 |
) |
(18,802 |
) |
— |
|||||||||||||
Balance, end of year |
$ |
34,236 |
$ |
2,390 |
$ |
654,537 |
$ |
32,140 |
$ |
107,419 |
$ |
52,286 |
|||||||||||
Change in unrealized gains or losses for the period included in earnings (or changes in net assets) for assets held at end of the reporting date |
$ |
(966 |
) |
$ |
(5,944 |
) |
$ |
9,075 |
$ |
1,703 |
$ |
35,139 |
$ |
(358 |
) |
||||||||
(1) |
Effective December 31, 2013 approximately $600 million of direct purchase municipal instruments were reclassified from C&I loans to available-for-sale securities.
|
The tables below summarize the classification of gains and losses due to changes in fair value, recorded in earnings for Level 3 assets and liabilities for the years ended December 31, 2015, 2014, and 2013:
Level 3 Fair Value Measurements Year ended December 31, 2015 |
|||||||||||||||||||||||
Available-for-sale securities |
|||||||||||||||||||||||
(dollar amounts in thousands) |
MSRs |
Derivative
instruments
|
Municipal
securities
|
Private-
label CMO
|
Asset-
backed
securities
|
Automobile
loans
|
|||||||||||||||||
Classification of gains and losses in earnings: |
|||||||||||||||||||||||
Mortgage banking income |
$ |
(5,201 |
) |
$ |
5,489 |
$ |
— |
$ |
— |
$ |
— |
$ |
— |
||||||||||
Securities gains (losses) |
— |
— |
149 |
— |
(2,440 |
) |
— |
||||||||||||||||
Interest and fee income |
— |
— |
— |
47 |
40 |
(497 |
) |
||||||||||||||||
Noninterest income |
— |
— |
— |
— |
— |
— |
|||||||||||||||||
Total |
$ |
(5,201 |
) |
$ |
5,489 |
$ |
149 |
$ |
47 |
$ |
(2,400 |
) |
$ |
(497 |
) |
||||||||
Level 3 Fair Value Measurements Year ended December 31, 2014 |
|||||||||||||||||||||||
Available-for-sale securities |
|||||||||||||||||||||||
(dollar amounts in thousands) |
MSRs |
Derivative
instruments
|
Municipal
securities
|
Private-
label CMO
|
Asset-
backed
securities
|
Automobile
loans
|
|||||||||||||||||
Classification of gains and losses in earnings: |
|||||||||||||||||||||||
Mortgage banking income |
$ |
(11,450 |
) |
$ |
3,047 |
$ |
— |
$ |
— |
$ |
— |
$ |
— |
||||||||||
Securities gains (losses) |
— |
— |
— |
— |
170 |
— |
|||||||||||||||||
Interest and fee income |
— |
— |
— |
36 |
56 |
(1,032 |
) |
||||||||||||||||
Noninterest income |
— |
— |
— |
— |
— |
114 |
|||||||||||||||||
Total |
$ |
(11,450 |
) |
$ |
3,047 |
$ |
— |
$ |
36 |
$ |
226 |
$ |
(918 |
) |
|||||||||
166
Level 3 Fair Value Measurements Year ended December 31, 2013 |
|||||||||||||||||||||||
Available-for-sale securities |
|||||||||||||||||||||||
(dollar amounts in thousands) |
MSRs |
Derivative
instruments
|
Municipal
securities
|
Private
label
CMO
|
Asset-
backed
securities
|
Automobile
loans
|
|||||||||||||||||
Classification of gains and losses in earnings: |
|||||||||||||||||||||||
Mortgage banking income (loss) |
$ |
(966 |
) |
$ |
(5,944 |
) |
$ |
— |
$ |
— |
$ |
— |
$ |
— |
|||||||||
Securities gains (losses) |
— |
— |
— |
(336 |
) |
(1,466 |
) |
— |
|||||||||||||||
Interest and fee income |
— |
— |
2,129 |
156 |
(778 |
) |
(3,569 |
) |
|||||||||||||||
Noninterest income |
— |
— |
— |
— |
— |
3,211 |
|||||||||||||||||
Total |
$ |
(966 |
) |
$ |
(5,944 |
) |
$ |
2,129 |
$ |
(180 |
) |
$ |
(2,244 |
) |
$ |
(358 |
) |
||||||
Assets and liabilities under the fair value option
The following table presents the fair value and aggregate principal balance of certain assets and liabilities under the fair value option:
December 31, 2015 |
December 31, 2014 |
||||||||||||||||||||||
(dollar amounts in thousands) |
Fair value carrying amount |
Aggregate unpaid principal |
Difference |
Fair value carrying amount |
Aggregate unpaid principal |
Difference |
|||||||||||||||||
Assets |
|||||||||||||||||||||||
Loans held for sale |
$ |
337,577 |
$ |
326,802 |
$ |
10,775 |
$ |
354,888 |
$ |
340,070 |
$ |
14,818 |
|||||||||||
Loans held for investment |
32,889 |
33,637 |
(748 |
) |
40,027 |
40,938 |
(911 |
) |
|||||||||||||||
Automobile loans |
1,748 |
1,748 |
— |
10,590 |
10,022 |
568 |
|||||||||||||||||
The following tables present the net gains (losses) from fair value changes, including net gains (losses) associated with instrument specific credit risk for the years ended December 31, 2015, 2014, and 2013:
|
Net gains (losses) from fair value
changes Year ended December 31,
|
|||||||||||
(dollar amounts in thousands) |
2015 |
2014 |
2013 |
||||||||
Assets |
|||||||||||
Mortgage loans held for sale |
$ |
(2,342 |
) |
$ |
(1,978 |
) |
$ |
(12,711 |
) |
||
Automobile loans |
(568 |
) |
(918 |
) |
(360 |
) |
|||||
|
Gains (losses) included in fair value changes
associated with instrument specific credit risk
Year ended December 31,
|
|||||||||||
(dollar amounts in thousands) |
2015 |
2014 |
2013 |
||||||||
Assets |
|||||||||||
Automobile loans |
$ |
199 |
$ |
911 |
$ |
2,207 |
|||||
Assets and Liabilities measured at fair value on a nonrecurring basis
Certain assets and liabilities may be required to be measured at fair value on a nonrecurring basis in periods subsequent to their initial recognition. These assets and liabilities are not measured at fair value on an ongoing basis; however, they are subject to fair value adjustments in certain circumstances, such as when there is evidence of impairment. For the year ended December 31, 2015, assets measured at fair value on a nonrecurring basis were as follows:
167
Fair Value Measurements Using |
|||||||||||||||||||
(dollar amounts in thousands) |
Fair Value |
Quoted Prices
In Active
Markets for
Identical Assets
(Level 1)
|
Significant
Other
Observable
Inputs
(Level 2)
|
Significant
Other
Unobservable
Inputs
(Level 3)
|
Total Gains/(Losses) Year ended December 31, 2015 |
||||||||||||||
MSRs |
$ |
141,726 |
$ |
— |
$ |
— |
$ |
141,726 |
$ |
(2,732 |
) |
||||||||
Impaired loans |
62,029 |
— |
— |
62,029 |
(20,762 |
) |
|||||||||||||
Other real estate owned |
27,342 |
— |
— |
27,342 |
(4,005 |
) |
|||||||||||||
MSRs accounted for under the amortization method are subject to nonrecurring fair value measurement when the fair value is lower than the carrying amount.
Periodically, Huntington records nonrecurring adjustments of collateral-dependent loans measured for impairment when establishing the ACL. Such amounts are generally based on the fair value of the underlying collateral supporting the loan. Appraisals are generally obtained to support the fair value of the collateral and incorporate measures such as recent sales prices for comparable properties and cost of construction. In cases where the carrying value exceeds the fair value of the collateral less cost to sell, an impairment charge is recognized.
Other real estate owned properties are included in accrued income and other assets and valued based on appraisals and third-party price opinions, less estimated selling costs.
The appraisals supporting the fair value of the collateral to recognize loan impairment or unrealized loss on other real estate owned properties may not have been obtained as of December 31, 2015.
Significant unobservable inputs for assets and liabilities measured at fair value on a recurring and nonrecurring basis
The table below presents quantitative information about the significant unobservable inputs for assets and liabilities measured at fair value on a recurring and nonrecurring basis at December 31, 2015:
Quantitative Information about Level 3 Fair Value Measurements at December 31, 2015 |
||||||||||
(dollar amounts in thousands) |
Fair Value |
Valuation Technique |
Significant Unobservable Input |
Range (Weighted Average) |
||||||
MSRs |
$ |
17,585 |
Discounted cash flow |
Constant prepayment rate |
7.9% - 25.7% (14.7%) |
|||||
Spread over forward interest rate swap rates |
3.3% - 9.2% (5.4%) |
|||||||||
Derivative assets |
6,721 |
Consensus Pricing |
Net market price |
-3.2% - 20.9% (1.9%) |
||||||
Derivative liabilities |
665 |
Estimated Pull through % |
11.9% - 99.8% (76.7%) |
|||||||
Municipal securities |
2,095,551 |
Discounted cash flow |
Discount rate |
0.3% - 7.2% (3.1%) |
||||||
Cumulative default |
0.1% - 50.0% (2.1%) |
|||||||||
Loss given default |
5.0% - 80.0% (20.5%) |
|||||||||
Asset-backed securities |
100,337 |
Discounted cash flow |
Discount rate |
4.6% - 10.9% (6.2%) |
||||||
Cumulative prepayment rate |
0.0% - 100.% (9.6%) |
|||||||||
Cumulative default |
1.6% - 100% (11.1%) |
|||||||||
Loss given default |
85% - 100% (96.6%) |
|||||||||
Cure given deferral |
0.0% - 75.0% (36.8%) |
|||||||||
Automobile loans |
1,748 |
Discounted cash flow |
Constant prepayment rate |
154.2 |
% |
|||||
Discount rate |
0.2% - 5.0% (2.3%) |
|||||||||
Life of pool cumulative losses |
2.1 |
% |
||||||||
Impaired loans |
62,029 |
Appraisal value |
NA |
NA |
||||||
Other real estate owned |
27,342 |
Appraisal value |
NA |
NA |
||||||
The following provides a general description of the impact of a change in an unobservable input on the fair value measurement and the interrelationship between unobservable inputs, where relevant/significant. Interrelationships may also exist between observable and unobservable inputs. Such relationships have not been included in the discussion below.
168
A significant change in the unobservable inputs may result in a significant change in the ending fair value measurement of Level 3 instruments. In general, prepayment rates increase when market interest rates decline and decrease when market interest rates rise and higher prepayment rates generally result in lower fair values for MSR assets, Private-label CMO securities, Asset-backed securities, and Automobile loans.
Credit loss estimates, such as probability of default, constant default, cumulative default, loss given default, cure given deferral, and loss severity, are driven by the ability of the borrowers to pay their loans and the value of the underlying collateral and are impacted by changes in macroeconomic conditions, typically increasing when economic conditions worsen and decreasing when conditions improve. An increase in the estimated prepayment rate typically results in a decrease in estimated credit losses and vice versa. Higher credit loss estimates generally result in lower fair values. Credit spreads generally increase when liquidity risks and market volatility increase and decrease when liquidity conditions and market volatility improve.
Discount rates and spread over forward interest rate swap rates typically increase when market interest rates increase and/or credit and liquidity risks increase and decrease when market interest rates decline and/or credit and liquidity conditions improve. Higher discount rates and credit spreads generally result in lower fair market values.
Net market price and pull through percentages generally increase when market interest rates increase and decline when market interest rates decline. Higher net market price and pull through percentages generally result in higher fair values.
Fair values of financial instruments
The following table provides the carrying amounts and estimated fair values of Huntington’s financial instruments that are carried either at fair value or cost at December 31, 2015 and December 31, 2014:
December 31, 2015 |
December 31, 2014 |
||||||||||||||
Carrying |
Fair |
Carrying |
Fair |
||||||||||||
(dollar amounts in thousands) |
Amount |
Value |
Amount |
Value |
|||||||||||
Financial Assets: |
|||||||||||||||
Cash and short-term assets |
$ |
898,994 |
$ |
898,994 |
$ |
1,285,124 |
$ |
1,285,124 |
|||||||
Trading account securities |
36,997 |
36,997 |
42,191 |
42,191 |
|||||||||||
Loans held for sale |
474,621 |
484,511 |
416,327 |
416,327 |
|||||||||||
Available-for-sale and other securities |
8,775,441 |
8,775,441 |
9,384,670 |
9,384,670 |
|||||||||||
Held-to-maturity securities |
6,159,590 |
6,135,458 |
3,379,905 |
3,382,715 |
|||||||||||
Net loans and direct financing leases |
49,743,256 |
48,024,998 |
47,050,530 |
45,110,406 |
|||||||||||
Derivatives |
274,872 |
274,872 |
352,642 |
352,642 |
|||||||||||
Financial Liabilities: |
|||||||||||||||
Deposits |
55,294,979 |
55,299,435 |
51,732,151 |
52,454,804 |
|||||||||||
Short-term borrowings |
615,279 |
615,279 |
2,397,101 |
2,397,101 |
|||||||||||
Long-term debt |
7,067,614 |
7,043,014 |
4,335,962 |
4,286,304 |
|||||||||||
Derivatives |
144,350 |
144,350 |
284,255 |
284,255 |
|||||||||||
The following table presents the level in the fair value hierarchy for the estimated fair values of only Huntington’s financial instruments that are not already on the Consolidated Balance Sheets at fair value at December 31, 2015 and December 31, 2014:
Estimated Fair Value Measurements at Reporting Date Using |
December 31, 2015 |
||||||||||||||
(dollar amounts in thousands) |
Level 1 |
Level 2 |
Level 3 |
||||||||||||
Financial Assets |
|||||||||||||||
Held-to-maturity securities |
$ |
— |
$ |
6,135,458 |
$ |
— |
$ |
6,135,458 |
|||||||
Net loans and direct financing leases |
— |
— |
48,024,998 |
48,024,998 |
|||||||||||
Financial Liabilities |
|||||||||||||||
Deposits |
— |
51,869,105 |
3,430,330 |
55,299,435 |
|||||||||||
Short-term borrowings |
— |
1,770 |
613,509 |
615,279 |
|||||||||||
Long-term debt |
— |
— |
7,043,014 |
7,043,014 |
|||||||||||
169
Estimated Fair Value Measurements at Reporting Date Using |
December 31, 2014 |
||||||||||||||
(dollar amounts in thousands) |
Level 1 |
Level 2 |
Level 3 |
||||||||||||
Financial Assets |
|||||||||||||||
Held-to-maturity securities |
$ |
— |
$ |
3,382,715 |
$ |
— |
$ |
3,382,715 |
|||||||
Net loans and direct financing leases |
— |
— |
45,110,406 |
45,110,406 |
|||||||||||
Financial Liabilities |
|||||||||||||||
Deposits |
— |
48,183,798 |
4,271,006 |
52,454,804 |
|||||||||||
Short-term borrowings |
— |
— |
2,397,101 |
2,397,101 |
|||||||||||
Long-term debt |
— |
— |
4,286,304 |
4,286,304 |
|||||||||||
The short-term nature of certain assets and liabilities result in their carrying value approximating fair value. These include trading account securities, customers’ acceptance liabilities, short-term borrowings, bank acceptances outstanding, FHLB advances, and cash and short-term assets, which include cash and due from banks, interest-bearing deposits in banks, and federal funds sold and securities purchased under resale agreements. Loan commitments and letters-of-credit generally have short-term, variable-rate features and contain clauses that limit Huntington’s exposure to changes in customer credit quality. Accordingly, their carrying values, which are immaterial at the respective balance sheet dates, are reasonable estimates of fair value.
Certain assets, the most significant being operating lease assets, bank owned life insurance, and premises and equipment, do not meet the definition of a financial instrument and are excluded from this disclosure. Similarly, mortgage and nonmortgage servicing rights, deposit base, and other customer relationship intangibles are not considered financial instruments and are not included above. Accordingly, this fair value information is not intended to, and does not, represent Huntington’s underlying value. Many of the assets and liabilities subject to the disclosure requirements are not actively traded, requiring fair values to be estimated by Management. These estimations necessarily involve the use of judgment about a wide variety of factors, including but not limited to, relevancy of market prices of comparable instruments, expected future cash flows, and appropriate discount rates.
The following methods and assumptions were used by Huntington to estimate the fair value of the remaining classes of financial instruments:
Held-to-maturity securities
Fair values are determined by using models that are based on security-specific details, as well as relevant industry and economic factors. The most significant of these inputs are quoted market prices, and interest rate spreads on relevant benchmark securities.
Loans and Direct Financing Leases
Variable-rate loans that reprice frequently are based on carrying amounts, as adjusted for estimated credit losses. The fair values for other loans and leases are estimated using discounted cash flow analyses and employ interest rates currently being offered for loans and leases with similar terms. The rates take into account the position of the yield curve, as well as an adjustment for prepayment risk, operating costs, and profit. This value is also reduced by an estimate of expected losses and the credit risk associated in the loan and lease portfolio. The valuation of the loan portfolio reflected discounts that Huntington believed are consistent with transactions occurring in the marketplace.
Deposits
Demand deposits, savings accounts, and money market deposits are, by definition, equal to the amount payable on demand. The fair values of fixed-rate time deposits are estimated by discounting cash flows using interest rates currently being offered on certificates with similar maturities.
Debt
Long-term debt is based upon quoted market prices, which are inclusive of Huntington’s credit risk. In the absence of quoted market prices, discounted cash flows using market rates for similar debt with the same maturities are used in the determination of fair value.
18. DERIVATIVE FINANCIAL INSTRUMENTS
170
Derivative financial instruments are recorded in the Consolidated Balance Sheet as either an asset or a liability (in accrued income and other assets or accrued expenses and other liabilities, respectively) and measured at fair value.
Derivative financial instruments can be designated as accounting hedges under GAAP. Designating a derivative as an accounting hedge allows Huntington to recognize gains and losses, less any ineffectiveness, in the income statement within the same period that the hedged item affects earnings. Gains and losses on derivatives that are not designated to an effective hedge relationship under GAAP immediately impact earnings within the period they occur.
Derivatives used in Asset and Liability Management Activities
Huntington engages in balance sheet hedging activity, principally for asset liability management purposes, to convert fixed rate assets or liabilities into floating rate or vice versa. Balance sheet hedging activity is arranged to receive hedge accounting treatment and is classified as either fair value or cash flow hedges. Fair value hedges are purchased to convert deposits and subordinated and other long-term debt from fixed-rate obligations to floating rate. Cash flow hedges are also used to convert floating rate loans made to customers into fixed rate loans.
The following table presents the gross notional values of derivatives used in Huntington’s asset and liability management activities at December 31, 2015, identified by the underlying interest rate-sensitive instruments:
(dollar amounts in thousands) |
Fair Value Hedges |
Cash Flow Hedges |
Total |
||||||||
Instruments associated with: |
|||||||||||
Loans |
$ |
— |
$ |
8,223,000 |
$ |
8,223,000 |
|||||
Deposits |
69,100 |
— |
69,100 |
||||||||
Subordinated notes |
475,000 |
— |
475,000 |
||||||||
Long-term debt |
5,385,000 |
— |
5,385,000 |
||||||||
Total notional value at December 31, 2015 |
$ |
5,929,100 |
$ |
8,223,000 |
$ |
14,152,100 |
|||||
The following table presents additional information about the interest rate swaps used in Huntington’s asset and liability management activities at December 31, 2015:
Weighted-Average Rate |
|||||||||||||||
(dollar amounts in thousands ) |
Notional Value |
Average Maturity (years) |
Fair Value |
Receive |
Pay |
||||||||||
Asset conversion swaps |
|||||||||||||||
Receive fixed—generic |
$ |
8,223,000 |
1.1 |
$ |
(3,103 |
) |
0.83 |
% |
0.43 |
% |
|||||
Total asset conversion swaps |
8,223,000 |
1.1 |
(3,103 |
) |
0.83 |
0.43 |
|||||||||
Liability conversion swaps |
|||||||||||||||
Receive fixed—generic |
5,929,100 |
2.7 |
68,401 |
1.55 |
0.40 |
||||||||||
Total liability conversion swaps |
5,929,100 |
2.7 |
68,401 |
1.55 |
0.40 |
||||||||||
Total swap portfolio at December 31, 2015 |
$ |
14,152,100 |
1.8 |
$ |
65,298 |
1.13 |
% |
0.42 |
% |
||||||
These derivative financial instruments were entered into for the purpose of managing the interest rate risk of assets and liabilities. Consequently, net amounts receivable or payable on contracts hedging either interest earning assets or interest bearing liabilities were accrued as an adjustment to either interest income or interest expense. The net amounts resulted in an increase to net interest income of $108 million, $98 million, and $95 million for the years ended December 31, 2015, 2014, and 2013, respectively.
In connection with the sale of Huntington’s Class B Visa® shares, Huntington entered into a swap agreement with the purchaser of the shares. The swap agreement adjusts for dilution in the conversion ratio of Class B shares resulting from the Visa® litigation. At December 31, 2015, the fair value of the swap liability of less than $1 million is an estimate of the exposure liability based upon Huntington’s assessment of the potential Visa® litigation losses.
The following table presents the fair values at December 31, 2015 and 2014 of Huntington’s derivatives that are designated and not designated as hedging instruments. Amounts in the table below are presented gross without the impact of any net collateral arrangements:
Asset derivatives included in accrued income and other assets:
171
(dollar amounts in thousands) |
December 31, 2015 |
December 31, 2014 |
|||||
Interest rate contracts designated as hedging instruments |
$ |
80,513 |
$ |
53,114 |
|||
Interest rate contracts not designated as hedging instruments |
190,846 |
183,610 |
|||||
Foreign exchange contracts not designated as hedging instruments |
37,727 |
32,798 |
|||||
Commodity contracts not designated as hedging instruments |
117,894 |
180,218 |
|||||
Total contracts |
$ |
426,980 |
$ |
449,740 |
|||
Liability derivatives included in accrued expenses and other liabilities:
(dollar amounts in thousands) |
December 31, 2015 |
December 31, 2014 |
|||||
Interest rate contracts designated as hedging instruments |
$ |
15,215 |
$ |
12,648 |
|||
Interest rate contracts not designated as hedging instruments |
121,815 |
110,627 |
|||||
Foreign exchange contracts not designated as hedging instruments |
35,283 |
29,754 |
|||||
Commodity contracts not designated as hedging instruments |
114,887 |
179,180 |
|||||
Total contracts |
$ |
287,200 |
$ |
332,209 |
|||
The changes in fair value of the fair value hedges are, to the extent that the hedging relationship is effective, recorded through earnings and offset against changes in the fair value of the hedged item.
The following table presents the change in fair value for derivatives designated as fair value hedges as well as the offsetting change in fair value on the hedged item:
Year ended December 31, |
|||||||||||
(dollar amounts in thousands) |
2015 |
2014 |
2013 |
||||||||
Interest rate contracts |
|||||||||||
Change in fair value of interest rate swaps hedging deposits (1) |
$ |
(996 |
) |
$ |
(1,045 |
) |
$ |
(4,006 |
) |
||
Change in fair value of hedged deposits (1) |
992 |
1,025 |
4,003 |
||||||||
Change in fair value of interest rate swaps hedging subordinated notes (2) |
(8,237 |
) |
476 |
(44,699 |
) |
||||||
Change in fair value of hedged subordinated notes (2) |
8,237 |
(476 |
) |
44,699 |
|||||||
Change in fair value of interest rate swaps hedging long-term debt (2) |
3,903 |
1,990 |
(5,716 |
) |
|||||||
Change in fair value of hedged other long-term debt (2) |
(3,602 |
) |
828 |
6,843 |
|||||||
(1) |
Effective portion of the hedging relationship is recognized in Interest expense—deposits in the Consolidated Statements of Income. Any resulting ineffective portion of the hedging relationship is recognized in noninterest income in the Consolidated Statements of Income. |
(2) |
Effective portion of the hedging relationship is recognized in Interest expense—subordinated notes and other long-term debt in the Consolidated Statements of Income. Any resulting ineffective portion of the hedging relationship is recognized in noninterest income in the Consolidated Statements of Income. |
The following table presents the gains and (losses) recognized in OCI and the location in the Consolidated Statements of Income of gains and (losses) reclassified from OCI into earnings for derivatives designated as effective cash flow hedges:
|
Derivatives in cash
flow hedging
relationships
|
Amount of gain or (loss)
recognized in OCI on
derivatives (effective portion)
|
Location of gain or (loss)
reclassified from accumulated OCI
into earnings (effective portion)
|
Amount of (gain) or loss
reclassified from accumulated OCI
into earnings (effective portion)
(pre-tax)
|
||||||||||||||||||||||
(dollar amounts in thousands) |
2015 |
2014 |
2013 |
2015 |
2014 |
2013 |
|||||||||||||||||||
Interest rate contracts |
|||||||||||||||||||||||||
Loans |
$ |
8,428 |
$ |
9,192 |
$ |
(56,056 |
) |
Interest and fee income—loans and leases |
$ |
(210 |
) |
$ |
(4,064 |
) |
$ |
(14,979 |
) |
||||||||
Loans |
— |
— |
— |
Noninterest income - other income |
(10 |
) |
93 |
(209 |
) |
||||||||||||||||
Total |
$ |
8,428 |
$ |
9,192 |
$ |
(56,056 |
) |
$ |
(220 |
) |
$ |
(3,971 |
) |
$ |
(15,188 |
) |
|||||||||
172
Reclassified gains and losses on swaps related to loans and investment securities and swaps related to subordinated debt are recorded within interest income and interest expense, respectively. During the next twelve months, Huntington expects to reclassify to earnings approximately $3 million after-tax, of unrealized gains on cash flow hedging derivatives currently in OCI.
To the extent these derivatives are effective in offsetting the variability of the hedged cash flows, changes in the derivatives’ fair value will not be included in current earnings but are reported as a component of OCI in the Consolidated Statements of Shareholders’ Equity. These changes in fair value will be included in earnings of future periods when earnings are also affected by the changes in the hedged cash flows. To the extent these derivatives are not effective, changes in their fair values are immediately included in noninterest income.
The following table presents the gains and (losses) recognized in noninterest income for the ineffective portion of interest rate contracts for derivatives designated as cash flow hedges for the years ending December 31, 2015, 2014, and 2013:
December 31, |
|||||||||||
(dollar amounts in thousands) |
2015 |
2014 |
2013 |
||||||||
Derivatives in cash flow hedging relationships |
|||||||||||
Interest rate contracts: |
|||||||||||
Loans |
$ |
(763 |
) |
$ |
74 |
$ |
878 |
||||
Derivatives used in mortgage banking activities
Mortgage loan origination hedging activity
Huntington’s mortgage origination hedging activity is related to the hedging of the mortgage pricing commitments to customers and the secondary sale to third parties. The value of a newly originated mortgage is not firm until the interest rate is committed or locked. The interest rate lock commitments are derivative positions offset by forward commitments to sell loans.
Huntington uses two types of mortgage-backed securities in its forward commitment to sell loans. The first type of forward commitment is a “To Be Announced” (or TBA), the second is a “Specified Pool” mortgage-backed security. Huntington uses these derivatives to hedge the value of mortgage-backed securities until they are sold.
The following table summarizes the derivative assets and liabilities used in mortgage banking activities:
(dollar amounts in thousands) |
December 31, 2015 |
December 31, 2014 |
|||||
Derivative assets: |
|||||||
Interest rate lock agreements |
$ |
6,721 |
$ |
4,064 |
|||
Forward trades and options |
2,468 |
35 |
|||||
Total derivative assets |
9,189 |
4,099 |
|||||
Derivative liabilities: |
|||||||
Interest rate lock agreements |
(220 |
) |
(259 |
) |
|||
Forward trades and options |
(1,239 |
) |
(3,760 |
) |
|||
Total derivative liabilities |
(1,459 |
) |
(4,019 |
) |
|||
Net derivative asset |
$ |
7,730 |
$ |
80 |
|||
MSR hedging activity
Huntington’s MSR economic hedging activity uses securities and derivatives to manage the value of the MSR asset and to mitigate the various types of risk inherent in the MSR asset, including risks related to duration, basis, convexity, volatility, and yield curve. The hedging instruments include forward commitments, interest rate swaps, and options on interest rate swaps.
The total notional value of these derivative financial instruments at December 31, 2015 and 2014, was $0.5 billion and $0.6 billion, respectively. The total notional amount at December 31, 2015 corresponds to trading assets with a fair value of less than $1 million and trading liabilities with a fair value of $1 million. Net trading gains (losses) related to MSR hedging for the years ended December 31, 2015, 2014, and 2013, were $(2) million, $7 million, and $(25) million, respectively. These amounts are included in mortgage banking income in the Consolidated Statements of Income.
173
Derivatives used in trading activities
Various derivative financial instruments are offered to enable customers to meet their financing and investing objectives and for their risk management purposes. Derivative financial instruments used in trading activities consisted of commodity, interest rate, and foreign exchange contracts. The derivative contracts grant the option holder the right to buy or sell an underlying financial instrument for a predetermined price before the contract expires. Huntington may enter into offsetting third-party contracts with approved, reputable counterparties with substantially matching terms and currencies in order to economically hedge significant exposure related to derivatives used in trading activities.
The interest rate risk of customer derivatives is mitigated by entering into similar derivatives having offsetting terms with other counterparties. The credit risk to these customers is evaluated and included in the calculation of fair value. Foreign currency derivatives help the customer hedge risk and reduce exposure to fluctuations in exchange rates. Transactions are primarily in liquid currencies with Canadian dollars and Euros comprising a majority of all transactions.
The net fair values of these derivative financial instruments, for which the gross amounts are included in accrued income and other assets or accrued expenses and other liabilities at December 31, 2015 and December 31, 2014, were $76 million and $74 million, respectively. The total notional values of derivative financial instruments used by Huntington on behalf of customers, including offsetting derivatives, were $14.6 billion and $14.4 billion at December 31, 2015 and December 31, 2014, respectively. Huntington’s credit risks from interest rate swaps used for trading purposes were $224 million and $219 million at the same dates, respectively.
Risk Participation Agreements
Huntington periodically enters into risk participation agreement in order to manage credit risk of its derivative positions. These agreements transfer counterparty credit risk related to interest rate swaps to and from other financial institutions. Huntington can mitigate exposure to certain counterparties or take on exposure to generate additional income. Huntington’s notional exposure for interest rate swaps originated by other financial institutions was $344 million and $457 million at December 31, 2015 and December 31, 2014, respectively. Huntington will make payments under these agreements if a customer defaults on its obligation to perform under the terms of the underlying interest rate derivative contract. The amount Huntington will have to pay if all counterparties defaulted on their swap contracts is the fair value of these risk participations, which was $6 million and $7 million at December 31, 2015 and December 31, 2014, respectively. These contracts mature between 2015 and 2043 and are deemed investment grade.
Financial assets and liabilities that are offset in the Consolidated Balance Sheets
Huntington records derivatives at fair value as further described in Note 17. Huntington records these derivatives net of any master netting arrangement in the Consolidated Balance Sheets. Collateral agreements are regularly entered into as part of the underlying derivative agreements with Huntington’s counterparties to mitigate counterparty credit risk.
All derivatives are carried on the Consolidated Balance Sheets at fair value. Derivative balances are presented on a net basis taking into consideration the effects of legally enforceable master netting agreements. Cash collateral exchanged with counterparties is also netted against the applicable derivative fair values. Huntington enters into derivative transactions with two primary groups: broker-dealers and banks, and Huntington’s customers. Different methods are utilized for managing counterparty credit exposure and credit risk for each of these groups.
Huntington enters into transactions with broker-dealers and banks for various risk management purposes. These types of transactions generally are high dollar volume. Huntington enters into bilateral collateral and master netting agreements with these counterparties, and routinely exchange cash and high quality securities collateral with these counterparties. Huntington enters into transactions with customers to meet their financing, investing, payment and risk management needs. These types of transactions generally are low dollar volume. Huntington generally enters into master netting agreements with customer counterparties, however collateral is generally not exchanged with customer counterparties.
At December 31, 2015 and December 31, 2014, aggregate credit risk associated with these derivatives, net of collateral that has been pledged by the counterparty, was $15 million and $20 million, respectively. The credit risk associated with interest rate swaps is calculated after considering master netting agreements with broker-dealers and banks.
At December 31, 2015, Huntington pledged $110 million of investment securities and cash collateral to counterparties, while other counterparties pledged $107 million of investment securities and cash collateral to Huntington to satisfy collateral netting agreements. In the event of credit downgrades, Huntington would not be required to provide additional collateral.
The following tables present the gross amounts of these assets and liabilities with any offsets to arrive at the net amounts recognized in the Consolidated Balance Sheets at December 31, 2015 and December 31, 2014:
174
Offsetting of Financial Assets and Derivative Assets | ||||||||||||||||||||||||
|
Gross amounts not offset in
the consolidated balance
sheets
|
||||||||||||||||||||||||
(dollar amounts in thousands) |
Gross amounts
of recognized
assets
|
Gross amounts
offset in the
consolidated
balance sheets
|
Net amounts of
assets
presented in
the
consolidated
balance sheets
|
Financial
instruments
|
Cash collateral
received
|
Net amount |
||||||||||||||||||
Offsetting of Financial Assets and Derivative Assets |
||||||||||||||||||||||||
December 31, 2015 |
Derivatives |
$ |
436,169 |
$ |
(161,297 |
) |
$ |
274,872 |
$ |
(39,305 |
) |
$ |
(3,462 |
) |
$ |
232,105 |
||||||||
December 31, 2014 |
Derivatives |
480,803 |
(128,161 |
) |
352,642 |
(27,744 |
) |
(1,095 |
) |
323,803 |
||||||||||||||
Offsetting of Financial Liabilities and Derivative Liabilities | ||||||||||||||||||||||||
|
Gross amounts not offset in
the consolidated balance
sheets
|
||||||||||||||||||||||||
(dollar amounts in thousands) |
Gross amounts
of recognized
liabilities
|
Gross amounts
offset in the
consolidated
balance sheets
|
Net amounts of
assets
presented in
the
consolidated
balance sheets
|
Financial
instruments
|
Cash collateral
delivered
|
Net amount |
||||||||||||||||||
Offsetting of Financial Liabilities and Derivative Liabilities |
||||||||||||||||||||||||
December 31, 2015 |
Derivatives |
$ |
288,659 |
$ |
(144,309 |
) |
$ |
144,350 |
$ |
(62,460 |
) |
$ |
(20 |
) |
$ |
81,870 |
||||||||
December 31, 2014 |
Derivatives |
363,192 |
(78,937 |
) |
284,255 |
(78,654 |
) |
(111 |
) |
205,490 |
||||||||||||||
19. VIEs
Consolidated VIEs
Consolidated VIEs at December 31, 2015, consisted of certain loan and lease securitization trusts. Huntington has determined the trusts are VIEs. Huntington has concluded that it is the primary beneficiary of these trusts because it has the power to direct the activities of the entity that most significantly affect the entity’s economic performance and it has either the obligation to absorb losses of the entity that could potentially be significant to the VIE or the right to receive benefits from the entity that could potentially be significant to the VIE. During the 2015 first quarter, Huntington acquired two securitization trusts with its acquisition of Huntington Technology Finance.
The following tables present the carrying amount and classification of the consolidated trusts’ assets and liabilities that were included in the Consolidated Balance Sheets at December 31, 2015 and 2014:
175
December 31, 2015 |
|||||||||||||||
Huntington Technology Funding Trust |
Other Consolidated Trusts |
Total |
|||||||||||||
(dollar amounts in thousands) |
Series 2012A |
Series 2014A |
|||||||||||||
Assets: |
|||||||||||||||
Cash |
$ |
1,377 |
$ |
1,561 |
$ |
— |
$ |
2,938 |
|||||||
Net loans and leases |
32,180 |
152,331 |
— |
184,511 |
|||||||||||
Accrued income and other assets |
— |
— |
229 |
229 |
|||||||||||
Total assets |
$ |
33,557 |
$ |
153,892 |
$ |
229 |
$ |
187,678 |
|||||||
Liabilities: |
|||||||||||||||
Other long-term debt |
$ |
27,153 |
$ |
123,577 |
$ |
— |
$ |
150,730 |
|||||||
Accrued interest and other liabilities |
— |
— |
229 |
229 |
|||||||||||
Total liabilities |
27,153 |
123,577 |
229 |
150,959 |
|||||||||||
Equity: |
|||||||||||||||
Beneficial Interest owned by third party |
6,404 |
30,315 |
— |
36,719 |
|||||||||||
Total liabilities and equity |
$ |
33,557 |
$ |
153,892 |
$ |
229 |
$ |
187,678 |
|||||||
December 31, 2014 |
|||||||||||
(dollar amounts in thousands) |
Other Consolidated Trusts |
Total |
|||||||||
Assets: |
|||||||||||
Cash |
$ |
— |
$ |
— |
|||||||
Net loans and leases |
— |
— |
|||||||||
Accrued income and other assets |
243 |
243 |
|||||||||
Total assets |
$ |
243 |
$ |
243 |
|||||||
Liabilities: |
|||||||||||
Other long-term debt |
$ |
— |
$ |
— |
|||||||
Accrued interest and other liabilities |
243 |
243 |
|||||||||
Total liabilities |
243 |
243 |
|||||||||
Equity: |
|||||||||||
Beneficial Interest owned by third party |
— |
— |
|||||||||
Total liabilities and equity |
$ |
243 |
$ |
243 |
|||||||
The loans and leases were designated to repay the securitized notes. Huntington services the loans and leases and uses the proceeds from principal and interest payments to pay the securitized notes during the amortization period. Huntington has not provided financial or other support that was not previously contractually required.
Unconsolidated VIEs
The following tables provide a summary of the assets and liabilities included in Huntington’s Consolidated Financial Statements, as well as the maximum exposure to losses, associated with its interests related to unconsolidated VIEs for which Huntington holds an interest, but is not the primary beneficiary, to the VIE at December 31, 2015, and 2014:
176
December 31, 2015 |
|||||||||||
(dollar amounts in thousands) |
Total Assets |
Total Liabilities |
Maximum Exposure to Loss |
||||||||
2015-1 Automobile Trust |
$ |
7,695 |
$ |
— |
$ |
7,695 |
|||||
2012-1 Automobile Trust |
94 |
— |
94 |
||||||||
2012-2 Automobile Trust |
771 |
— |
771 |
||||||||
Trust Preferred Securities |
13,919 |
317,106 |
— |
||||||||
Low Income Housing Tax Credit Partnerships |
425,500 |
196,001 |
425,500 |
||||||||
Other Investments |
68,746 |
25,762 |
68,746 |
||||||||
Total |
$ |
516,725 |
$ |
538,869 |
$ |
502,806 |
|||||
December 31, 2014 |
|||||||||||
(dollar amounts in thousands) |
Total Assets |
Total Liabilities |
Maximum Exposure to Loss |
||||||||
2012-1 Automobile Trust |
$ |
2,136 |
$ |
— |
$ |
2,136 |
|||||
2012-2 Automobile Trust |
3,220 |
— |
3,220 |
||||||||
2011 Automobile Trust |
944 |
— |
944 |
||||||||
Tower Hill Securities, Inc. |
55,611 |
65,000 |
55,611 |
||||||||
Trust Preferred Securities |
13,919 |
317,075 |
— |
||||||||
Low Income Housing Tax Credit Partnerships |
368,283 |
154,861 |
368,283 |
||||||||
Other Investments |
83,400 |
20,760 |
83,400 |
||||||||
Total |
$ |
527,513 |
$ |
557,696 |
$ |
513,594 |
|||||
2015-1, 2012-1, 2012-2 , and 2011 AUTOMOBILE TRUST
During 2015 second quarter, 2012 first and fourth quarters, and 2011 third quarter, we transferred automobile loans totaling $0.8 billion, $1.3 billion, $1.0 billion, and $1.0 billion, respectively to trusts in separate securitization transactions. The securitizations and the resulting sale of all underlying securities qualified for sale accounting. Huntington has concluded that it is not the primary beneficiary of these trusts because it has neither the obligation to absorb losses of the entities that could potentially be significant to the VIEs nor the right to receive benefits from the entities that could potentially be significant to the VIEs. Huntington is not required and does not currently intend to provide any additional financial support to the trusts. Investors and creditors only have recourse to the assets held by the trusts. The interest Huntington holds in the VIEs relates to servicing rights which are included within accrued income and other assets of Huntington’s Consolidated Balance Sheets. The maximum exposure to loss is equal to the carrying value of the servicing asset.
During the 2015 third quarter, Huntington canceled the 2011 Automobile Trust. As a result, any remaining assets at the time of the cancellation were no longer part of the trust.
TOWER HILL SECURITIES, INC.
In 2010, we transferred approximately $92 million of municipal securities, $86 million in Huntington Preferred Capital, Inc. (Real Estate Investment Trust) Class E Preferred Stock and cash of $6 million to Tower Hill Securities, Inc. in exchange for $184 million of Common and Preferred Stock of Tower Hill Securities, Inc.
In 2015, the mandatorily redeemable securities issued by Tower Hill Securities, Inc. were redeemed in full. As of November 16, 2015, Tower Hill Securities, Inc. is a 100% owned consolidated entity.
TRUST-PREFERRED SECURITIES
Huntington has certain wholly-owned trusts whose assets, liabilities, equity, income, and expenses are not included within Huntington’s Consolidated Financial Statements. These trusts have been formed for the sole purpose of issuing trust-preferred securities, from which the proceeds are then invested in Huntington junior subordinated debentures, which are reflected in Huntington’s Consolidated Balance Sheet as subordinated notes. The trust securities are the obligations of the trusts, and as such, are not consolidated within Huntington’s Consolidated Financial Statements. A list of trust-preferred securities outstanding at December 31, 2015 follows:
177
(dollar amounts in thousands) |
Rate |
Principal amount of
subordinated note/
debenture issued to trust (1)
|
Investment in
unconsolidated
subsidiary
|
|||||||
Huntington Capital I |
1.03 |
% |
(2) |
$ |
111,816 |
$ |
6,186 |
|||
Huntington Capital II |
1.14 |
(3) |
54,593 |
3,093 |
||||||
Sky Financial Capital Trust III |
2.01 |
(4) |
72,165 |
2,165 |
||||||
Sky Financial Capital Trust IV |
1.73 |
(4) |
74,320 |
2,320 |
||||||
Camco Financial Trust |
2.95 |
(5) |
4,212 |
155 |
||||||
Total |
$ |
317,106 |
$ |
13,919 |
||||||
(1) |
Represents the principal amount of debentures issued to each trust, including unamortized original issue discount. |
(2) |
Variable effective rate at December 31, 2015, based on three-month LIBOR + 0.70.
|
(3) |
Variable effective rate at December 31, 2015, based on three-month LIBOR + 62.5.
|
(4) |
Variable effective rate at December 31, 2015, based on three-month LIBOR + 1.40.
|
(5) |
Variable effective rate (including impact of purchase accounting accretion) at December 31, 2015, based on three month LIBOR + 1.33.
|
Each issue of the junior subordinated debentures has an interest rate equal to the corresponding trust securities distribution rate. Huntington has the right to defer payment of interest on the debentures at any time, or from time-to-time for a period not exceeding five years provided that no extension period may extend beyond the stated maturity of the related debentures. During any such extension period, distributions to the trust securities will also be deferred and Huntington’s ability to pay dividends on its common stock will be restricted. Periodic cash payments and payments upon liquidation or redemption with respect to trust securities are guaranteed by Huntington to the extent of funds held by the trusts. The guarantee ranks subordinate and junior in right of payment to all indebtedness of the Company to the same extent as the junior subordinated debt. The guarantee does not place a limitation on the amount of additional indebtedness that may be incurred by Huntington.
LOW INCOME HOUSING TAX CREDIT PARTNERSHIPS
Huntington makes certain equity investments in various limited partnerships that sponsor affordable housing projects utilizing the Low Income Housing Tax Credit (LIHTC) pursuant to Section 42 of the Internal Revenue Code. The purpose of these investments is to achieve a satisfactory return on capital, to facilitate the sale of additional affordable housing product offerings, and to assist in achieving goals associated with the Community Reinvestment Act. The primary activities of the limited partnerships include the identification, development, and operation of multi family housing that is leased to qualifying residential tenants. Generally, these types of investments are funded through a combination of debt and equity.
Huntington is a limited partner in each Low Income Housing Tax Credit Partnership. A separate unrelated third-party is the general partner. Each limited partnership is managed by the general partner, who exercises full and exclusive control over the affairs of the limited partnership. The general partner has all the rights, powers and authority granted or permitted to be granted to a general partner of a limited partnership under the Ohio Revised Uniform Limited Partnership Act. Duties entrusted to the general partner of each limited partnership include, but are not limited to: investment in operating companies, company expenditures, investment of excess funds, borrowing funds, employment of agents, disposition of fund property, prepayment and refinancing of liabilities, votes and consents, contract authority, disbursement of funds, accounting methods, tax elections, bank accounts, insurance, litigation, cash reserve, and use of working capital reserve funds. Except for limited rights granted to consent to certain transactions, the limited partner(s) may not participate in the operation, management, or control of the limited partnership’s business, transact any business in the limited partnership’s name or have any power to sign documents for or otherwise bind the limited partnership. In addition, the general partner may only be removed by the limited partner(s) in the event the general partner fails to comply with the terms of the agreement and/or is negligent in performing its duties.
Huntington believes the general partner of each limited partnership has the power to direct the activities which most significantly affect the performance of each partnership, therefore, Huntington has determined that it is not the primary beneficiary of any LIHTC partnership. Huntington uses the proportional amortization method to account for a majority of its investments in these entities. These investments are included in accrued income and other assets. Investments that do not meet the requirements of the proportional amortization method are recognized using the equity method. Investment losses related to these investments are included in noninterest income in the Consolidated Statements of Income.
The following table presents the balances of Huntington’s affordable housing tax credit investments and related unfunded commitments at December 31, 2015 and 2014.
178
(dollar amounts in thousands) |
December 31, 2015 |
December 31, 2014 |
|||||
Affordable housing tax credit investments |
$ |
674,157 |
$ |
576,381 |
|||
Less: amortization |
(248,657 |
) |
(208,098 |
) |
|||
Net affordable housing tax credit investments |
$ |
425,500 |
$ |
368,283 |
|||
Unfunded commitments |
$ |
196,001 |
$ |
154,861 |
|||
The following table presents other information relating to Huntington’s affordable housing tax credit investments for the years ended December 31, 2015, 2014, and 2013:
Year Ended December 31, |
|||||||||||
(dollar amounts in thousands) |
2015 |
2014 |
2013 |
||||||||
Tax credits and other tax benefits recognized |
$ |
59,614 |
$ |
51,317 |
$ |
55,819 |
|||||
Proportional amortization method |
|||||||||||
Tax credit amortization expense included in provision for income taxes |
42,951 |
39,021 |
32,789 |
||||||||
Equity method |
|||||||||||
Tax credit investment losses included in noninterest income |
355 |
434 |
1,176 |
||||||||
There were no sales of LIHTC investments in 2015 or 2014. During the year ended December 31, 2013, Huntington sold LIHTC investments resulting in gains of $9 million. The gains were recorded in noninterest income in the Consolidated Statements of Income.
Huntington recognized immaterial impairment losses for the years ended December 31, 2015, 2014 and 2013. The impairment losses recognized related to the fair value of the tax credit investments that were less than carrying value.
OTHER INVESTMENTS
Other investments determined to be VIE’s include investments in New Market Tax Credit Investments, Historic Tax Credit Investments, Small Business Investment Companies, Rural Business Investment Companies, certain equity method investments and other miscellaneous investments.
20. COMMITMENTS AND CONTINGENT LIABILITIES
Commitments to extend credit
In the ordinary course of business, Huntington makes various commitments to extend credit that are not reflected in the Consolidated Financial Statements. The contract amounts of these financial agreements at December 31, 2015, and December 31, 2014 were as follows:
At December 31, |
|||||||
(dollar amounts in thousands) |
2015 |
2014 |
|||||
Contract amount represents credit risk |
|||||||
Commitments to extend credit: |
|||||||
Commercial |
$ |
11,448,927 |
$ |
11,181,522 |
|||
Consumer |
8,574,093 |
7,579,632 |
|||||
Commercial real estate |
813,271 |
908,112 |
|||||
Standby letters of credit |
511,706 |
497,457 |
|||||
Commitments to extend credit generally have fixed expiration dates, are variable-rate, and contain clauses that permit Huntington to terminate or otherwise renegotiate the contracts in the event of a significant deterioration in the customer’s credit quality. These arrangements normally require the payment of a fee by the customer, the pricing of which is based on prevailing market conditions, credit quality, probability of funding, and other relevant factors. Since many of these commitments are expected to expire without being drawn upon, the contract amounts are not necessarily indicative of future cash requirements. The interest rate risk arising from these financial instruments is insignificant as a result of their predominantly short-term, variable-rate nature.
Standby letters-of-credit are conditional commitments issued to guarantee the performance of a customer to a third-party. These guarantees are primarily issued to support public and private borrowing arrangements, including commercial paper, bond financing,
179
and similar transactions. Most of these arrangements mature within two years. The carrying amount of deferred revenue associated with these guarantees was $7 million and $4 million at December 31, 2015 and 2014, respectively.
Through the Company’s credit process, Huntington monitors the credit risks of outstanding standby letters-of-credit. When it is probable that a standby letter-of-credit will be drawn and not repaid in full, losses are recognized in the provision for credit losses. At December 31, 2015, Huntington had $512 million of standby letters-of-credit outstanding, of which 80% were collateralized. Included in this $512 million total are letters-of-credit issued by the Bank that support securities that were issued by customers and remarketed by The Huntington Investment Company, the Company’s broker-dealer subsidiary.
Huntington uses an internal grading system to assess an estimate of loss on its loan and lease portfolio. This same loan grading system is used to monitor credit risk associated with standby letters-of-credit. Under this risk rating system as of December 31, 2015, approximately $186 million of the standby letters-of-credit were rated strong with sufficient asset quality, liquidity, and good debt capacity and coverage, approximately $326 million were rated average with acceptable asset quality, liquidity, and modest debt capacity; and less than $1 million were rated substandard with negative financial trends, structural weaknesses, operating difficulties, and higher leverage.
Commercial letters-of-credit represent short-term, self-liquidating instruments that facilitate customer trade transactions and generally have maturities of no longer than 90 days. The goods or cargo being traded normally secures these instruments. As of December 31, 2015, Huntington had $56 million of commercial letters-of-credit outstanding.
Commitments to sell loans
Activity related to our mortgage origination activity supports the hedging of the mortgage pricing commitments to customers and the secondary sale to third parties. At December 31, 2015 and 2014, Huntington had commitments to sell residential real estate loans of $659 million and $545 million, respectively. These contracts mature in less than one year.
Litigation
The nature of Huntington’s business ordinarily results in a certain amount of pending as well as threatened claims, litigation, investigations, regulatory and legal and administrative cases, matters and proceedings, all of which are considered incidental to the normal conduct of business. When the Company determines it has meritorious defenses to the claims asserted, it vigorously defends itself. The Company considers settlement of cases when, in management’s judgment, it is in the best interests of both the Company and its shareholders to do so.
On at least a quarterly basis, Huntington assesses its liabilities and contingencies in connection with threatened and outstanding legal cases, matters and proceedings, utilizing the latest information available. For cases, matters and proceedings where it is both probable the Company will incur a loss and the amount can be reasonably estimated, Huntington establishes an accrual for the loss. Once established, the accrual is adjusted as appropriate to reflect any relevant developments. For cases, matters or proceedings where a loss is not probable or the amount of the loss cannot be estimated, no accrual is established.
In certain cases, matters and proceedings, exposure to loss exists in excess of the accrual to the extent such loss is reasonably possible, but not probable. Management believes an estimate of the aggregate range of reasonably possible losses, in excess of amounts accrued, for current legal proceedings is from $0 to approximately $80 million at December 31, 2015. For certain other cases, and matters, Management cannot reasonably estimate the possible loss at this time. Any estimate involves significant judgment, given the varying stages of the proceedings (including the fact that many of them are currently in preliminary stages), the existence of multiple defendants in several of the current proceedings whose share of liability has yet to be determined, the numerous unresolved issues in many of the proceedings, and the inherent uncertainty of the various potential outcomes of such proceedings. Accordingly, Management’s estimate will change from time-to-time, and actual losses may be more or less than the current estimate.
While the final outcome of legal cases, matters, and proceedings is inherently uncertain, based on information currently available, advice of counsel, and available insurance coverage, Management believes that the amount it has already accrued is adequate and any incremental liability arising from the Company’s legal cases, matters, or proceedings will not have a material negative adverse effect on the Company’s consolidated financial position as a whole. However, in the event of unexpected future developments, it is possible that the ultimate resolution of these cases, matters, and proceedings, if unfavorable, may be material to the Company’s consolidated financial position in a particular period.
Cyberco Litigation. The Bank has been named a defendant in two lawsuits, arising from the Bank’s commercial lending, depository, and equipment leasing relationships with Cyberco Holdings, Inc. (Cyberco), based in Grand Rapids, Michigan. In November 2004, the Federal Bureau of Investigation and the Internal Revenue Service raided Cyberco’s facilities and Cyberco’s operations ceased. An equipment leasing fraud was uncovered, whereby Cyberco sought financing from equipment lessors and financial institutions, including the Bank, allegedly to purchase computer equipment from Teleservices Group, Inc. (Teleservices).
180
Cyberco created fraudulent documentation to close the financing transactions when, in fact, no computer equipment was ever purchased or leased from Teleservices, which later proved to be a shell corporation.
Cyberco filed a Chapter 7 bankruptcy petition on December 9, 2004, and a state court receiver for Teleservices then filed a Chapter 7 bankruptcy petition for Teleservices on January 21, 2005. In an adversary proceeding commenced against the Bank on December 8, 2006, the Cyberco bankruptcy trustee sought recovery of over $70 million he alleged was transferred to the Bank. The Cyberco bankruptcy trustee also alleged preferential transfers were made to the Bank in the amount of approximately $1 million. The Bank moved to dismiss the complaint and all but the preference claims were dismissed on January 29, 2008. The Bankruptcy Court ordered the case to be tried in July 2012, and entered an order governing all pretrial conduct. The Bank filed a motion for summary judgment on the basis that the Cyberco trustee sought recovery of the same alleged transfers as the Teleservices trustee in a separate case described below. The Bankruptcy Court granted the motion in principal part and the parties stipulated to a full dismissal which was entered on June 19, 2012.
The Teleservices bankruptcy trustee filed a separate adversary proceeding against the Bank on January 19, 2007, seeking to avoid and recover alleged transfers that occurred in two ways: (1) checks made payable to the Bank for application to Cyberco’s indebtedness to the Bank, and (2) deposits into Cyberco’s bank accounts with the Bank. A trial was held as to only the Bank’s defenses. Subsequently, the trustee filed a summary judgment motion on the affirmative case, alleging the fraudulent transfers to the Bank totaled approximately $73 million and seeking judgment in that amount (which includes the $1 million alleged to be preferential transfers by the Cyberco bankruptcy trustee). On March 17, 2011, the Bankruptcy Court issued an Opinion determining that the alleged transfers made to the Bank during the period from April 30, 2004 through November 2004 were not received in good faith and that the Bank failed to show a lack of knowledge of the avoidability of the alleged transfers made from September 2003 through November 2004. The trustee then filed an amended motion for summary judgment in the affirmative case and a hearing was held on July 1, 2011.
On March 30, 2012, the Bankruptcy Court issued an Opinion on the Teleservices trustee’s motion determining the Bank was the initial transferee of the checks made payable to it and was a subsequent transferee of all deposits into Cyberco’s accounts. The Bankruptcy Court ruled Cyberco’s deposits were themselves transfers to the Bank under the Bankruptcy Code, and the Bank was liable for both the checks and the deposits, totaling approximately $73 million. The Bankruptcy Court delivered its report and recommendation to the District Court for the Western District of Michigan, recommending that the District Court enter a final judgment against the Bank in the principal amount of $72 million, plus interest through July 27, 2012, in the amount of $9 million. The parties filed their respective objections and responses to the Bankruptcy Court’s report and recommendation. The District Court held a hearing in September 2014 and conducted a de novo review of the fact findings and legal conclusions in the Bankruptcy Court’s report and recommendation.
On September 28, 2015, the District Court entered a judgment against the Bank in the amount of $72 million plus costs and pre- and post-judgment interest. While Huntington has appealed the decision and plans to continue to aggressively contest the claims of this complex case, Huntington increased its legal reserves by approximately $38 million in the 2015 third quarter to fully accrue for the amount of the judgment.
MERSCORP Litigation. The Bank is a defendant in an action filed on January 17, 2012 against MERSCORP, Inc. and numerous other financial institutions that participate in the mortgage electronic registration system (MERS). The putative class action was filed on behalf of all 88 counties in Ohio. The plaintiffs allege that the recording of mortgages and assignments thereof is mandatory under Ohio law and seek a declaratory judgment that the defendants are required to record every mortgage and assignment on real property located in Ohio and pay the attendant statutory recording fees. The complaint also seeks damages, attorney’s fees and costs. Huntington filed a motion to dismiss the complaint, which has been fully briefed, but no ruling has been issued by the Geauga County, Ohio Court of Common Pleas. Similar litigation has been initiated against MERSCORP, Inc. and other financial institutions in other jurisdictions throughout the country, however, the Bank has not been named a defendant in those other cases.
Powell v. Huntington National Bank. The Bank is a defendant in a putative class action filed on October 15, 2013. The plaintiffs filed the action in West Virginia state court on behalf of themselves and other West Virginia mortgage loan borrowers who allege they were charged late fees in violation of West Virginia law and the loan documents. Plaintiffs seek statutory civil penalties, compensatory damages and attorney’s fees. The Bank removed the case to federal court, answered the complaint, and, on January 17, 2014, filed a motion for judgment on the pleadings, asserting that West Virginia law is preempted by federal law and therefore does not apply to the Bank. Following further briefing by the parties, the federal district court denied the Bank’s motion for judgment on the pleadings on September 26, 2014. On June 8, 2015, the Fourth Circuit Court of Appeals granted the Bank’s motion for an interlocutory appeal of the district court’s decision. The matter was briefed and oral argument held, but after the oral argument, the Fourth Circuit dismissed the appeal as improvidently granted and remanded the case back to the district court for further proceedings.
Commitments Under Operating Lease Obligations
181
At December 31, 2015, Huntington and its subsidiaries were obligated under noncancelable leases for land, buildings, and equipment. Many of these leases contain renewal options and certain leases provide options to purchase the leased property during or at the expiration of the lease period at specified prices. Some leases contain escalation clauses calling for rentals to be adjusted for increased real estate taxes and other operating expenses or proportionately adjusted for increases in the consumer or other price indices.
The future minimum rental payments required under operating leases that have initial or remaining noncancelable lease terms in excess of one year as of December 31, 2015, were as follows: $53 million in 2016, $49 million in 2017, $46 million in 2018, $42 million in 2019, $41 million in 2020, and $191 million thereafter. At December 31, 2015, total minimum lease payments have not been reduced by minimum sublease rentals of $11 million due in the future under noncancelable subleases. At December 31, 2015, the future minimum sublease rental payments that Huntington expects to receive were as follows: $4 million in 2016, $2 million in 2017, $2 million in 2018, $1 million in 2019, $1 million in 2020, and $1 million thereafter. The rental expense for all operating leases was $58 million, $57 million, and $55 million for 2015, 2014, and 2013, respectively. Huntington had no material obligations under capital leases.
21. OTHER REGULATORY MATTERS
Huntington and its bank subsidiary, The Huntington National Bank (the Bank), are subject to various regulatory capital requirements administered banking regulators. These requirements involve qualitative judgments and quantitative measures of assets, liabilities, capital amounts, and certain off-balance sheet items as calculated under regulatory accounting practices. Failure to meet minimum capital requirements can initiate certain actions by regulators that, if undertaken, could have a material adverse effect on Huntington’s and the Bank’s financial statements.
Beginning in the 2015 first quarter, we became subject to the Basel III capital requirements including the standardized approach for calculating risk-weighted assets in accordance with subpart D of the final capital rule. The Basel III capital requirements emphasize CET1 capital, the most loss-absorbing form of capital, and implement strict eligibility criteria for regulatory capital instruments. CET1 capital primarily includes common shareholders’ equity less certain deductions for goodwill and other intangibles net of related taxes, and DTAs that arise from tax loss and credit carryforwards. Tier 1 capital is primarily comprised of CET1 capital, perpetual preferred stock and certain qualifying capital instruments (TRUPS) that are subject to phase-out from tier 1 capital. Tier 2 capital primarily includes qualifying subordinated debt and qualifying ALLL. We are also subject to CCAR and must submit annual capital plans to our banking regulators. We may pay dividends and repurchase stock up to the levels submitted in our capital plan to which the FRB did not object.
As of December 31, 2015, Huntington and the Bank met all capital adequacy requirements and had regulatory capital ratios in excess of the levels established for well-capitalized institutions. The period-end capital amounts and capital ratios of Huntington and the Bank are as follows, including the CET1 ratio on a Basel III basis. The implementation of the Basel III capital requirements is transitional and phases-in from January 1, 2015 through the end of 2018. Amounts presented prior to January 1, 2015 are calculated using the Basel I capital requirements.
Well- |
December 31, |
|||||||||||||||||||
capitalized |
Minimum |
2015 |
2014 |
|||||||||||||||||
Capital |
Capital |
Basel III |
Basel I |
|||||||||||||||||
(dollar amounts in thousands) |
Ratios |
Ratios |
Ratio |
Amount |
Ratio |
Amount |
||||||||||||||
Common equity tier 1 risk-based capital |
Consolidated |
N.A. |
4.50 |
% |
9.79 |
% |
$ |
5,721,028 |
N.A. |
N.A. |
||||||||||
Bank |
6.50 |
% |
4.50 |
9.46 |
5,518,748 |
N.A. |
N.A. |
|||||||||||||
Tier 1 risk-based capital |
Consolidated |
6.00 |
6.00 |
10.53 |
6,154,000 |
11.50 |
% |
$ |
6,265,900 |
|||||||||||
Bank |
8.00 |
6.00 |
9.83 |
5,735,274 |
11.28 |
6,136,190 |
||||||||||||||
Total risk-based capital |
Consolidated |
10.00 |
8.00 |
12.64 |
7,386,936 |
13.56 |
7,388,336 |
|||||||||||||
Bank |
10.00 |
8.00 |
11.74 |
6,850,596 |
12.79 |
6,956,242 |
||||||||||||||
Tier 1 leverage capital |
Consolidated |
N.A. |
4.00 |
8.79 |
6,154,000 |
9.74 |
6,265,900 |
|||||||||||||
Bank |
5.00 |
4.00 |
8.21 |
5,735,274 |
9.56 |
6,136,190 |
||||||||||||||
Huntington has the ability to provide additional capital to the Bank to maintain the Bank’s risk-based capital ratios at levels at which would be considered well-capitalized.
Huntington and its subsidiaries are also subject to various regulatory requirements that impose restrictions on cash, debt, and dividends. The Bank is required to maintain cash reserves based on the level of certain of its deposits. This reserve requirement may
182
be met by holding cash in banking offices or on deposit at the Federal Reserve Bank. During 2015 and 2014, the average balances of these deposits were $0.5 billion and $0.2 billion, respectively.
Under current Federal Reserve regulations, the Bank is limited as to the amount and type of loans it may make to the parent company and nonbank subsidiaries. At December 31, 2015, the Bank could lend $678 million to a single affiliate, subject to the qualifying collateral requirements defined in the regulations.
Dividends from the Bank are one of the major sources of funds for the Company. These funds aid the Company in the payment of dividends to shareholders, expenses, and other obligations. Payment of dividends to the parent company is subject to various legal and regulatory limitations. During 2015, the Bank paid dividends of $822 million to the holding company. Also, there are statutory and regulatory limitations on the ability of national banks to pay dividends or make other capital distributions. The amount available for dividend payments to the parent company by Huntington National Bank without prior regulatory approval was approximately $179 million at December 31, 2015.
22. PARENT COMPANY FINANCIAL STATEMENTS
The parent company financial statements, which include transactions with subsidiaries, are as follows:
Balance Sheets |
December 31, |
||||||
(dollar amounts in thousands) |
2015 |
2014 |
|||||
Assets |
|||||||
Cash and cash equivalents |
$ |
917,368 |
$ |
662,768 |
|||
Due from The Huntington National Bank |
406,253 |
276,851 |
|||||
Due from non-bank subsidiaries |
48,151 |
51,129 |
|||||
Investment in The Huntington National Bank |
5,966,783 |
6,073,408 |
|||||
Investment in non-bank subsidiaries |
489,205 |
509,114 |
|||||
Accrued interest receivable and other assets |
192,444 |
279,366 |
|||||
Total assets |
$ |
8,020,204 |
$ |
7,852,636 |
|||
Liabilities and shareholders’ equity |
|||||||
Long-term borrowings |
$ |
1,045,835 |
$ |
1,046,104 |
|||
Dividends payable, accrued expenses, and other liabilities |
379,763 |
478,361 |
|||||
Total liabilities |
1,425,598 |
1,524,465 |
|||||
Shareholders’ equity (1) |
6,594,606 |
6,328,170 |
|||||
Total liabilities and shareholders’ equity |
$ |
8,020,204 |
$ |
7,852,635 |
|||
(1) |
See Consolidated Statements of Changes in Shareholders’ Equity. |
183
Statements of Income |
Year Ended December 31, |
||||||||||
(dollar amounts in thousands) |
2015 |
2014 |
2013 |
||||||||
Income |
|||||||||||
Dividends from |
|||||||||||
The Huntington National Bank |
$ |
822,000 |
$ |
244,000 |
$ |
— |
|||||
Non-bank subsidiaries |
38,883 |
27,773 |
55,473 |
||||||||
Interest from |
|||||||||||
The Huntington National Bank |
5,954 |
3,906 |
6,598 |
||||||||
Non-bank subsidiaries |
2,317 |
2,613 |
3,129 |
||||||||
Other |
4,529 |
2,994 |
2,148 |
||||||||
Total income |
873,683 |
281,286 |
67,348 |
||||||||
Expense |
|||||||||||
Personnel costs |
4,770 |
53,359 |
52,846 |
||||||||
Interest on borrowings |
17,428 |
17,031 |
20,739 |
||||||||
Other |
92,735 |
52,662 |
36,728 |
||||||||
Total expense |
114,933 |
123,052 |
110,313 |
||||||||
Income (loss) before income taxes and equity in undistributed net income of subsidiaries |
758,750 |
158,234 |
(42,965 |
) |
|||||||
Provision (benefit) for income taxes |
(109,867 |
) |
(62,897 |
) |
(22,298 |
) |
|||||
Income (loss) before equity in undistributed net income of subsidiaries |
868,617 |
221,131 |
(20,667 |
) |
|||||||
Increase (decrease) in undistributed net income (loss) of: |
|||||||||||
The Huntington National Bank |
(160,567 |
) |
414,049 |
692,392 |
|||||||
Non-bank subsidiaries |
(15,093 |
) |
(2,788 |
) |
(30,443 |
) |
|||||
Net income |
$ |
692,957 |
$ |
632,392 |
$ |
641,282 |
|||||
Other comprehensive income (loss) (1) |
(3,866 |
) |
(8,283 |
) |
(63,192 |
) |
|||||
Comprehensive income |
$ |
689,091 |
$ |
624,109 |
$ |
578,090 |
|||||
(1) |
See Consolidated Statements of Comprehensive Income for other comprehensive income (loss) detail. |
184
Statements of Cash Flows |
Year Ended December 31, |
||||||||||
(dollar amounts in thousands) |
2015 |
2014 |
2013 |
||||||||
Operating activities |
|||||||||||
Net income |
$ |
692,957 |
$ |
632,392 |
$ |
641,282 |
|||||
Adjustments to reconcile net income to net cash provided by operating activities: |
|||||||||||
Equity in undistributed net income of subsidiaries |
175,660 |
(411,261 |
) |
(718,144 |
) |
||||||
Depreciation and amortization |
609 |
548 |
513 |
||||||||
Loss on sales of securities available-for-sale |
540 |
— |
— |
||||||||
Other, net |
(44,197 |
) |
26,685 |
15,965 |
|||||||
Net cash (used for) provided by operating activities |
825,569 |
248,364 |
(60,384 |
) |
|||||||
Investing activities |
|||||||||||
Repayments from subsidiaries |
494,905 |
9,250 |
285,792 |
||||||||
Advances to subsidiaries |
(612,610 |
) |
(32,350 |
) |
(249,050 |
) |
|||||
Proceeds from sale of securities available-for-sale |
449 |
— |
— |
||||||||
Cash paid for acquisitions, net of cash received |
— |
(13,452 |
) |
— |
|||||||
Proceeds from business divestitures |
9,029 |
— |
— |
||||||||
Net cash (used for) provided by investing activities |
(108,227 |
) |
(36,552 |
) |
36,742 |
||||||
Financing activities |
|||||||||||
Proceeds from issuance of long-term borrowings |
— |
— |
400,000 |
||||||||
Payment of borrowings |
— |
— |
(50,000 |
) |
|||||||
Dividends paid on stock |
(224,390 |
) |
(198,789 |
) |
(182,476 |
) |
|||||
Net proceeds from issuance of common stock |
— |
2,597 |
— |
||||||||
Repurchases of common stock |
(251,844 |
) |
(334,429 |
) |
(124,995 |
) |
|||||
Other, net |
13,492 |
15,512 |
25,707 |
||||||||
Net cash provided by (used for) financing activities |
(462,742 |
) |
(515,109 |
) |
68,236 |
||||||
Change in cash and cash equivalents |
254,600 |
(303,297 |
) |
44,594 |
|||||||
Cash and cash equivalents at beginning of year |
662,768 |
966,065 |
921,471 |
||||||||
Cash and cash equivalents at end of year |
$ |
917,368 |
$ |
662,768 |
$ |
966,065 |
|||||
Supplemental disclosure: |
|||||||||||
Interest paid |
$ |
17,384 |
$ |
21,321 |
$ |
20,739 |
|||||
23. BUSINESS COMBINATIONS
MACQUARIE EQUIPMENT FINANCE
On March 31, 2015, Huntington completed its acquisition of Macquarie, subsequently rebranded Huntington Technology Finance, in a cash transaction valued at $458 million. The acquisition gives us the ability to drive added growth to our national equipment finance business as well as additional small business finance capabilities.
As a result of the acquisition, Huntington recorded approximately $1.1 billion of assets and assumed $617 million of debt, securitizations, and other liabilities. Assets acquired and liabilities assumed were recorded at fair value in accordance with ASC 805, “Business Combinations”. The fair values for assets were estimated using discounted cash flow analyses using interest rates currently being offered for leases with similar terms (Level 3). This value was reduced by an estimate of probable losses and the credit risk associated with leased assets. The fair values of debt, securitizations, and other liabilities were estimated by discounting cash flows using interest rates currently being offered with similar maturities (Level 3). As part of the acquisition, Huntington recorded $156 million of goodwill, all of which is deductible for tax purposes.
Pro forma results have not been disclosed, as those amounts are not significant to the audited consolidated financial statements.
24. SEGMENT REPORTING
Our business segments are based on our internally-aligned segment leadership structure, which is how we monitor results and assess performance. We have five major business segments: Retail and Business Banking, Commercial Banking, Automobile Finance
185
and Commercial Real Estate (AFCRE), Regional Banking and The Huntington Private Client Group (RBHPCG), and Home Lending. The Treasury / Other function includes our technology and operations, other unallocated assets, liabilities, revenue, and expense.
Business segment results are determined based upon our management reporting system, which assigns balance sheet and income statement items to each of the business segments. The process is designed around our organizational and management structure and, accordingly, the results derived are not necessarily comparable with similar information published by other financial institutions. Additionally, because of the interrelationships of the various segments, the information presented is not indicative of how the segments would perform if they operated as independent entities
Revenue is recorded in the business segment responsible for the related product or service. Fee sharing is recorded to allocate portions of such revenue to other business segments involved in selling to, or providing service to customers. Results of operations for the business segments reflect these fee sharing allocations.
The management accounting process that develops the business segment reporting utilizes various estimates and allocation methodologies to measure the performance of the business segments. Expenses are allocated to business segments using a two-phase approach. The first phase consists of measuring and assigning unit costs (activity-based costs) to activities related to product origination and servicing. These activity-based costs are then extended, based on volumes, with the resulting amount allocated to business segments that own the related products. The second phase consists of the allocation of overhead costs to all five business segments from Treasury / Other. We utilize a full-allocation methodology, where all Treasury / Other expenses, except reported Significant Items, and a small amount of other residual unallocated expenses, are allocated to the five business segments.
We use an active and centralized Funds Transfer Pricing (FTP) methodology to attribute appropriate income to the business segments. The intent of the FTP methodology is to transfer interest rate risk from the business segments by providing matched duration funding of assets and liabilities. The result is to centralize the financial impact, management, and reporting of interest rate risk in the Treasury / Other function where it can be centrally monitored and managed. The Treasury / Other function charges (credits) an internal cost of funds for assets held in (or pays for funding provided by) each business segment. The FTP rate is based on prevailing market interest rates for comparable duration assets (or liabilities).
Retail and Business Banking - The Retail and Business Banking segment provides a wide array of financial products and services to consumer and small business customers including but not limited to checking accounts, savings accounts, money market accounts, certificates of deposit, consumer loans, and small business loans. Other financial services available to consumer and small business customers include investments, insurance, interest rate risk protection, foreign exchange, and treasury management. Business Banking is defined as serving companies with revenues up to $20 million and consists of approximately 165,000 businesses
Commercial Banking - Through a relationship banking model, this segment provides a wide array of products and services to the middle market, large corporate, and government public sector customers located primarily within our geographic footprint. The segment is divided into seven business units: middle market, large corporate, specialty banking, asset finance, capital markets, treasury management, and insurance.
Automobile Finance and Commercial Real Estate - : This segment provides lending and other banking products and services to customers outside of our traditional retail and commercial banking segments. Our products and services include providing financing for the purchase of vehicles by customers at franchised automotive dealerships, financing the acquisition of new and used vehicle inventory of franchised automotive dealerships, and financing for land, buildings, and other commercial real estate owned or constructed by real estate developers, automobile dealerships, or other customers with real estate project financing needs. Products and services are delivered through highly specialized relationship-focused bankers and product partners.
Regional Banking and The Huntington Private Client Group - Regional Banking and The Huntington Private Client Group is closely aligned with our eleven regional banking markets. The Huntington Private Client Group is organized into units consisting of The Huntington Private Bank, The Huntington Trust, and The Huntington Investment Company. Our private banking, trust, and investment functions focus their efforts in our Midwest footprint and Florida.
Huntington sold Huntington Asset Advisors, Huntington Asset Services and Unified Financial Securities in the 2015 fourth quarter.
Home Lending - Home Lending originates and services consumer loans and mortgages for customers who are generally located in our primary banking markets. Consumer and mortgage lending products are primarily distributed through the Retail and Business Banking segment, as well as through commissioned loan originators. Home lending earns interest on loans held in the warehouse and portfolio, earns fee income from the origination and servicing of mortgage loans, and recognizes gains or losses from the sale of mortgage loans. Home Lending supports the origination and servicing of mortgage loans across all segments.
Listed below is certain financial information reconciled to Huntington’s December 31, 2015, December 31, 2014, and December 31, 2013, reported results by business segment:
186
|
Income Statements
(dollar amounts in thousands)
|
Retail & Business
Banking
|
Commercial
Banking
|
AFCRE |
RBHPCG |
Home
Lending
|
Treasury /
Other
|
Huntington
Consolidated
|
||||||||||||||||||||
2015 |
|||||||||||||||||||||||||||
Net interest income |
$ |
1,030,238 |
$ |
365,181 |
$ |
381,189 |
$ |
115,608 |
$ |
65,884 |
$ |
(7,363 |
) |
$ |
1,950,737 |
||||||||||||
Provision for credit losses |
42,828 |
49,460 |
4,931 |
65 |
2,670 |
— |
99,954 |
||||||||||||||||||||
Noninterest income |
440,261 |
258,191 |
29,257 |
153,160 |
87,021 |
70,840 |
1,038,730 |
||||||||||||||||||||
Noninterest expense |
1,029,727 |
283,448 |
152,010 |
254,380 |
157,266 |
99,077 |
1,975,908 |
||||||||||||||||||||
Provision (benefit) for income taxes |
139,280 |
101,662 |
88,727 |
5,013 |
(2,461 |
) |
(111,573 |
) |
220,648 |
||||||||||||||||||
Net income (loss) |
$ |
258,664 |
$ |
188,802 |
$ |
164,778 |
$ |
9,310 |
$ |
(4,570 |
) |
$ |
75,973 |
$ |
692,957 |
||||||||||||
2014 |
|||||||||||||||||||||||||||
Net interest income |
$ |
912,992 |
$ |
306,434 |
$ |
379,363 |
$ |
101,839 |
$ |
58,015 |
$ |
78,498 |
$ |
1,837,141 |
|||||||||||||
Provision (Benefit) for credit losses |
75,529 |
31,521 |
(52,843 |
) |
4,893 |
21,889 |
— |
80,989 |
|||||||||||||||||||
Noninterest income |
409,746 |
209,238 |
26,628 |
173,550 |
69,899 |
90,118 |
979,179 |
||||||||||||||||||||
Noninterest expense |
982,288 |
249,300 |
156,715 |
236,634 |
136,374 |
121,035 |
1,882,346 |
||||||||||||||||||||
Provision (benefit) for income taxes |
92,722 |
82,198 |
105,742 |
11,852 |
(10,622 |
) |
(61,299 |
) |
220,593 |
||||||||||||||||||
Net income (loss) |
$ |
172,199 |
$ |
152,653 |
$ |
196,377 |
$ |
22,010 |
$ |
(19,727 |
) |
$ |
108,880 |
$ |
632,392 |
||||||||||||
2013 |
|||||||||||||||||||||||||||
Net interest income |
$ |
902,526 |
$ |
281,461 |
$ |
366,508 |
$ |
105,862 |
$ |
51,839 |
$ |
(3,588 |
) |
$ |
1,704,608 |
||||||||||||
Provision (Benefit) for credit losses |
137,978 |
27,464 |
(82,269 |
) |
(5,376 |
) |
12,249 |
(1 |
) |
90,045 |
|||||||||||||||||
Noninterest income |
398,065 |
200,573 |
46,819 |
186,430 |
106,006 |
74,303 |
1,012,196 |
||||||||||||||||||||
Noninterest expense |
964,193 |
254,629 |
156,469 |
236,895 |
141,489 |
4,328 |
1,758,003 |
||||||||||||||||||||
Provision (benefit) for income taxes |
69,447 |
69,979 |
118,694 |
21,271 |
1,437 |
(53,354 |
) |
227,474 |
|||||||||||||||||||
Net income |
$ |
128,973 |
$ |
129,962 |
$ |
220,433 |
$ |
39,502 |
$ |
2,670 |
$ |
119,742 |
$ |
641,282 |
|||||||||||||
|
Assets at
December 31,
|
Deposits at
December 31,
|
||||||||||||||
(dollar amounts in thousands) |
2015 |
2014 |
2015 |
2014 |
|||||||||||
Retail & Business Banking |
$ |
15,822,568 |
$ |
15,146,857 |
$ |
30,875,607 |
$ |
29,350,255 |
|||||||
Commercial Banking |
16,943,458 |
15,043,477 |
11,424,778 |
11,184,566 |
|||||||||||
AFCRE |
17,855,600 |
16,027,910 |
1,651,702 |
1,377,921 |
|||||||||||
RBHPCG |
3,458,847 |
3,871,020 |
7,690,581 |
6,727,892 |
|||||||||||
Home Lending |
3,917,198 |
3,949,247 |
361,881 |
326,841 |
|||||||||||
Treasury / Other |
13,046,880 |
12,259,499 |
3,290,430 |
2,764,676 |
|||||||||||
Total |
$ |
71,044,551 |
$ |
66,298,010 |
$ |
55,294,979 |
$ |
51,732,151 |
|||||||
187
25. QUARTERLY RESULTS OF OPERATIONS (UNAUDITED)
The following is a summary of the quarterly results of operations, for the years ended December 31, 2015 and 2014:
Three months ended |
|||||||||||||||
December 31, |
September 30, |
June 30, |
March 31, |
||||||||||||
(dollar amounts in thousands, except per share data) |
2015 |
2015 |
2015 |
2015 |
|||||||||||
Interest income |
$ |
544,153 |
$ |
538,477 |
$ |
529,795 |
$ |
502,096 |
|||||||
Interest expense |
47,242 |
43,022 |
39,109 |
34,411 |
|||||||||||
Net interest income |
496,911 |
495,455 |
490,686 |
467,685 |
|||||||||||
Provision for credit losses |
36,468 |
22,476 |
20,419 |
20,591 |
|||||||||||
Noninterest income |
272,215 |
253,119 |
281,773 |
231,623 |
|||||||||||
Noninterest expense |
498,766 |
526,508 |
491,777 |
458,857 |
|||||||||||
Income before income taxes |
233,892 |
199,590 |
260,263 |
219,860 |
|||||||||||
Provision for income taxes |
55,583 |
47,002 |
64,057 |
54,006 |
|||||||||||
Net income |
178,309 |
152,588 |
196,206 |
165,854 |
|||||||||||
Dividends on preferred shares |
7,972 |
7,968 |
7,968 |
7,965 |
|||||||||||
Net income applicable to common shares |
$ |
170,337 |
$ |
144,620 |
$ |
188,238 |
$ |
157,889 |
|||||||
Net income per common share — Basic |
$ |
0.21 |
$ |
0.18 |
$ |
0.23 |
$ |
0.19 |
|||||||
Net income per common share — Diluted |
0.21 |
0.18 |
0.23 |
0.19 |
|||||||||||
Three months ended |
|||||||||||||||
December 31, |
September 30, |
June 30, |
March 31, |
||||||||||||
(dollar amounts in thousands, except per share data) |
2014 |
2014 |
2014 |
2014 |
|||||||||||
Interest income |
$ |
507,625 |
$ |
501,060 |
$ |
495,322 |
$ |
472,455 |
|||||||
Interest expense |
34,373 |
34,725 |
35,274 |
34,949 |
|||||||||||
Net interest income |
473,252 |
466,335 |
460,048 |
437,506 |
|||||||||||
Provision for credit losses |
2,494 |
24,480 |
29,385 |
24,630 |
|||||||||||
Noninterest income |
233,278 |
247,349 |
250,067 |
248,485 |
|||||||||||
Noninterest expense |
483,271 |
480,318 |
458,636 |
460,121 |
|||||||||||
Income before income taxes |
220,765 |
208,886 |
222,094 |
201,240 |
|||||||||||
Provision for income taxes |
57,151 |
53,870 |
57,475 |
52,097 |
|||||||||||
Net income |
163,614 |
155,016 |
164,619 |
149,143 |
|||||||||||
Dividends on preferred shares |
7,963 |
7,964 |
7,963 |
7,964 |
|||||||||||
Net income applicable to common shares |
$ |
155,651 |
$ |
147,052 |
$ |
156,656 |
$ |
141,179 |
|||||||
Net income per common share — Basic |
$ |
0.19 |
$ |
0.18 |
$ |
0.19 |
$ |
0.17 |
|||||||
Net income per common share — Diluted |
0.19 |
0.18 |
0.19 |
0.17 |
|||||||||||
26. SUBSEQUENT EVENTS
On January 26, 2016, Huntington announced the signing of a definitive merger agreement under which Ohio-based FirstMerit Corporation, the parent company of FirstMerit Bank, will merge into Huntington in a stock and cash transaction valued at approximately $3.4 billion based on the closing stock price on the day preceding the announcement. FirstMerit Corporation is a diversified financial services company headquartered in Akron, Ohio, which reported assets of approximately $25.5 billion based on their December 31, 2015 unaudited balance sheet.
Under the terms of the agreement, shareholders of FirstMerit Corporation will receive 1.72 shares of Huntington common stock, and $5.00 in cash, for each share of FirstMerit Corporation common stock. The transaction is expected to be completed in the 2016 third quarter, subject to the satisfaction of customary closing conditions, including regulatory approvals and the approval of the shareholders of Huntington and FirstMerit Corporation.
188
Item 9: Changes In and Disagreements With Accountants on Accounting and Financial Disclosure
Information required by this item is set forth under the caption Ratification of the Appointment of the Independent Registered Public Accounting Firm in our 2016 Proxy Statement, which is incorporated by reference into this item.
Item 9A: Controls and Procedures
Disclosure Controls and Procedures
Huntington maintains disclosure controls and procedures designed to ensure that the information required to be disclosed in the reports that it files or submits under the Securities Exchange Act of 1934, as amended (the Exchange Act), are recorded, processed, summarized, and reported within the time periods specified in the Commission’s rules and forms. Disclosure controls and procedures include, without limitation, controls and procedures designed to ensure that information required to be disclosed by an issuer in the reports that it files or submits under the Exchange Act is accumulated and communicated to the issuer’s management, including its principal executive and principal financial officers, or persons performing similar functions, as appropriate to allow timely decisions regarding required disclosure. Huntington’s Management, with the participation of its Chief Executive Officer and the Chief Financial Officer, evaluated the effectiveness of Huntington’s disclosure controls and procedures (as such term is defined in Rules 13a-15(e) and 15d-15(e) under the Exchange Act) as of December 31, 2015. Based upon such evaluation, Huntington’s Chief Executive Officer and Chief Financial Officer have concluded that, as of December 31, 2015, Huntington’s disclosure controls and procedures were effective.
Internal Control Over Financial Reporting
Information required by this item is set forth in the Report of Management's Assessment of Internal Control over Financial Reporting and the Report of Independent Registered Public Accounting Firm which are incorporated by reference into this item.
Changes in Internal Control Over Financial Reporting
There have not been any changes in our internal control over financial reporting (as such term is defined in Rules 13a-15(f) and 15d-15(f) under the Exchange Act) during the quarter ended December 31, 2015, to which this report relates, that have materially affected, or are reasonably likely to materially affect, internal control over financial reporting.
Item 9B: Other Information
Not applicable.
PART III
We refer in Part III of this report to relevant sections of our 2016 Proxy Statement for the 2016 annual meeting of shareholders, which will be filed with the SEC pursuant to Regulation 14A within 120 days of the close of our 2015 fiscal year. Portions of our 2016 Proxy Statement, including the sections we refer to in this report, are incorporated by reference into this report.
Item 10: Directors, Executive Officers and Corporate Governance
Information required by this item is set forth under the captions Election of Directors, Corporate Governance, Our Executive Officers, Board Meetings and Committee Information, Report of the Audit Committee, and Section 16(a) Beneficial Ownership Reporting Compliance of our 2016 Proxy Statement, which is incorporated by reference into this item.
Item 11: Executive Compensation
Information required by this item is set forth under the captions Compensation of Executive Officers of our 2016 Proxy Statement, which is incorporated by reference into this item.
Item 12: Security Ownership of Certain Beneficial Owners and Management and Related Stockholder Matters Equity Compensation Plan Information
The following table sets forth information about Huntington common stock authorized for issuance under Huntington’s existing equity compensation plans as of December 31, 2015.
189
Plan Category (1) |
Number of
securities to be
issued upon
exercise of
outstanding
options, warrants,
and rights (2)
(a)
|
Weighted-average
exercise price of
outstanding
options, warrants,
and rights (3)
(b)
|
Number of
securities
remaining available
for future issuance
under equity
compensation
plans (excluding
securities reflected
in column (a)) (4)
(c)
|
|||||||
Equity compensation plans approved by security holders |
30,886,998 |
$ |
3.59 |
24,664,198 |
||||||
Equity compensation plans not approved by security holders |
305,093 |
19.68 |
— |
|||||||
Total |
31,192,091 |
$ |
3.75 |
24,664,198 |
||||||
(1) |
All equity compensation plan authorizations for shares of common stock provide for the number of shares to be adjusted for stock splits, stock dividends, and other changes in capitalization. The Huntington Investment and Tax Savings Plan, a broad-based plan qualified under Code Section 401(a) which includes Huntington common stock as one of a number of investment options available to participants, is excluded from the table. |
(2) |
The numbers in this column (a) reflect shares of common stock to be issued upon exercise of outstanding stock options and the vesting of outstanding awards of RSUs, RSAs and PSUs and the release of DSUs. The shares of common stock to be issued upon exercise or vesting under equity compensation plans not approved by shareholders include an inducement grant issued outside of the Company’s stock plans, and awards granted under the following plans which are no longer active and for which Huntington has not reserved the right to make subsequent grants or awards: employee and director stock plans of Unizan Financial Corp., Sky Financial Group, Inc. and Camco Financial Corporation assumed in the acquisitions of these companies. |
(3) |
The weighted-average exercise prices in this column are based on outstanding options and do not take into account unvested awards of RSUs, RSAs and PSUs and unreleased DSUs as these awards do not have an exercise price. |
(4) |
The number of shares in this column (c) reflects the number of shares remaining available for future issuance under Huntington’s 2015 Plan, excluding shares reflected in column (a). The number of shares in this column (c) does not include shares of common stock to be issued under the following compensation plans: the Executive Deferred Compensation Plan, which provides senior officers designated by the Compensation Committee the opportunity to defer up to 90% of base salary, annual bonus compensation and certain equity awards, and up to 90% of long-term incentive awards; the Supplemental Plan under which voluntary participant contributions made by payroll deduction are used to purchase shares; the Deferred Compensation for Huntington Bancshares Incorporated Directors under which directors may defer their director compensation and such amounts may be invested in shares of common stock; and the Deferred Compensation Plan for directors (now inactive) under which directors of selected subsidiaries may defer their director compensation and such amounts may be invested in shares of Huntington common stock. These plans do not contain a limit on the number of shares that may be issued under them. |
Item 13: Certain Relationships and Related Transactions, and Director Independence
Information required by this item is set forth under the captions Indebtedness of Management and Certain other Transactions of our 2016 Proxy Statement, which is incorporated by reference into this item.
Item 14: Principal Accountant Fees and Services
Information required by this item is set forth under the caption Proposal to Ratify the Appointment of Independent Registered Public Accounting Firm of our 2016 Proxy Statement which is incorporated by reference into this item.
PART IV
Item 15: Exhibits and Financial Statement Schedules
Financial Statements and Financial Statement Schedules
Our consolidated financial statements required in response to this Item are incorporated by reference from Item 8 of this Report.
Exhibits
Our exhibits listed on the Exhibit Index of this Form 10-K are filed with this Report or are incorporated herein by reference.
190
Signatures
Pursuant to the requirements of Section 13 or 15(d) of the Securities Exchange Act of 1934, the Registrant has duly caused this report to be signed on its behalf by the undersigned, thereunto duly authorized, on the 17th day of February, 2016.
HUNTINGTON BANCSHARES INCORPORATED
(Registrant)
By: |
/s/ Stephen D. Steinour |
By: |
/s/ Howell D. McCullough III |
|||
Stephen D. Steinour |
Howell D. McCullough III |
|||||
Chairman, President, Chief Executive |
Chief Financial Officer |
|||||
Officer, and Director (Principal Executive |
(Principal Financial Officer) |
|||||
Officer) |
||||||
By: |
/s/ David S. Anderson |
|||||
David S. Anderson |
||||||
Executive Vice President, Controller |
||||||
(Principal Accounting Officer) |
||||||
Pursuant to the requirements of the Securities Exchange Act of 1934, this report has been signed below by the following persons on behalf of the Registrant and in the capacities indicated on the 17th day of February, 2016.
Ann B. Crane * |
Jonathan A. Levy * |
|
Ann B. Crane |
Jonathan A. Levy |
|
Director |
Director |
|
Steven G. Elliott * |
Eddie R. Munson * |
|
Steven G. Elliott |
Eddie R. Munson |
|
Director |
Director |
|
Michael J. Endres * |
Richard W. Neu * |
|
Michael J. Endres |
Richard W. Neu |
|
Director |
Director |
|
John B. Gerlach, Jr. * |
David L. Porteous * |
|
John B. Gerlach, Jr. |
David L. Porteous |
|
Director |
Director |
|
Peter J. Kight * |
Kathleen H. Ransier * |
|
Peter J. Kight |
Kathleen H. Ransier |
|
Director |
Director |
|
*/s/ Richard A. Cheap |
||
Richard A. Cheap |
||
Attorney-in-fact for each of the persons indicated |
||
191
Exhibit Index
This report incorporates by reference the documents listed below that we have previously filed with the SEC. The SEC allows us to incorporate by reference information in this document. The information incorporated by reference is considered to be a part of this document, except for any information that is superseded by information that is included directly in this document.
This information may be read and copied at the Public Reference Room of the SEC at 100 F Street, N.E., Washington, D.C. 20549. The SEC also maintains an Internet web site that contains reports, proxy statements, and other information about issuers, like us, who file electronically with the SEC. The address of the site is http://www.sec.gov. The reports and other information filed by us with the SEC are also available free of charge at our Internet web site. The address of the site is http://www.huntington.com. Except as specifically incorporated by reference into this Annual Report on Form 10-K, information on those web sites is not part of this report. You also should be able to inspect reports, proxy statements, and other information about us at the offices of the NASDAQ National Market at 33 Whitehall Street, New York, New York.
|
Exhibit
Number
|
Document Description |
Report or Registration Statement |
SEC File or
Registration
Number
|
Exhibit
Reference
|
|
2.1 |
Agreement and Plan of Merger, dated as of January 25, 2016, by and among Huntington Bancshares Incorporated, FirstMerit Corporation, and West Subsidiary Corporation. |
Current Report on Form 8-K dated January 28, 2016. |
001-34073 |
2.1 |
|
3.1 |
Articles of Restatement of Charter. |
Annual Report on Form 10-K for the year ended December 31, 1993. |
000-02525 |
3(i) |
|
3.2 |
Articles of Amendment to Articles of Restatement of Charter. |
Current Report on Form 8-K dated May 31, 2007 |
000-02525 |
3.1 |
|
3.3 |
Articles of Amendment to Articles of Restatement of Charter |
Current Report on Form 8-K dated May 7, 2008 |
000-02525 |
3.1 |
|
3.4 |
Articles of Amendment to Articles of Restatement of Charter |
Current Report on Form 8-K dated April 27, 2010 |
001-34073 |
3.1 |
|
3.5 |
Articles Supplementary of Huntington Bancshares Incorporated, as of April 22, 2008. |
Current Report on Form 8-K dated April 22, 2008 |
000-02525 |
3.1 |
|
3.6 |
Articles Supplementary of Huntington Bancshares Incorporated, as of April 22, 2008. |
Current Report on Form 8-K dated April 22, 2008 |
000-02525 |
3.2 |
|
3.7 |
Articles Supplementary of Huntington Bancshares Incorporated, as of November 12, 2008. |
Current Report on Form 8-K dated November 12, 2008 |
001-34073 |
3.1 |
|
3.8 |
Articles Supplementary of Huntington Bancshares Incorporated, as of December 31, 2006. |
Annual Report on Form 10-K for the year ended December 31, 2006 |
000-02525 |
3.4 |
|
3.9 |
Articles Supplementary of Huntington Bancshares Incorporated, as of December 28, 2011 |
Current Report on Form 8-K dated December 28, 2011 |
001-34073 |
3.1 |
|
3.10 |
Bylaws of Huntington Bancshares Incorporated, as amended and restated, as of July 16, 2014. |
Current Report on Form 8-K dated July 17, 2014. |
001-34073 |
3.1 |
|
4.1 |
Instruments defining the Rights of Security Holders — reference is made to Articles Fifth, Eighth, and Tenth of Articles of Restatement of Charter, as amended and supplemented. Instruments defining the rights of holders of long-term debt will be furnished to the Securities and Exchange Commission upon request. |
||||
10.1 |
* Form of Executive Agreement for certain executive officers. |
Annual Report on Form 10-K for the year ended December 31, 2014. |
001-34073 |
10.1 |
|
10.2 |
* Management Incentive Plan for Covered Officers as amended and restated effective for plan years beginning on or after January 1, 2011. |
Definitive Proxy Statement for the 2011 Annual Meeting of Shareholders |
001-34073 |
A |
|
10.3 |
* Huntington Supplemental Retirement Income Plan, amended and restated, effective December 31, 2013. |
Annual Report on Form 10-K for the year ended December 31, 2013. |
001-34073 |
10.3 |
|
10.4 |
* Deferred Compensation Plan and Trust for Directors |
Post-Effective Amendment No. 2 to Registration Statement on Form S-8 filed on January 28, 1991. |
33-10546 |
4(a) |
|
10.5 |
* Deferred Compensation Plan and Trust for Huntington Bancshares Incorporated Directors |
Registration Statement on Form S-8 filed on July 19, 1991. |
33-41774 |
4(a) |
|
10.6 |
* First Amendment to Huntington Bancshares Incorporated Deferred Compensation Plan and Trust for Huntington Bancshares Incorporated Directors |
Quarterly Report on 10-Q for the quarter ended March 31, 2001 |
000-02525 |
10(q) |
|
10.7 |
* Executive Deferred Compensation Plan, as amended and restated on January 1, 2012. |
Annual Report on Form 10-K for the year ended December 31, 2012 |
001-34073 |
10.8 |
|
10.8 |
* The Huntington Supplemental Stock Purchase and Tax Savings Plan and Trust, amended and restated, effective January 1,2014 |
Annual Report on Form 10-K for the year ended December 31, 2013. |
001-34073 |
10.8 |
|
10.9 |
* Form of Employment Agreement between Stephen D. Steinour and Huntington Bancshares Incorporated effective December 1, 2012. |
Current Report on Form 8-K dated November 28, 2012. |
001-34073 |
10.1 |
|
10.10 |
* Form of Executive Agreement between Stephen D. Steinour and Huntington Bancshares Incorporated effective December 1, 2012. |
Current Report on Form 8-K dated November 28, 2012. |
001-34073 |
10.2 |
|
192
10.11 |
* Restricted Stock Unit Grant Notice with three year vesting |
Current Report on Form 8-K dated
July 24, 2006
|
000-02525 |
99.1 |
|
10.12 |
* Restricted Stock Unit Grant Notice with six month vesting |
Current Report on Form 8-K dated
July 24, 2006
|
000-02525 |
99.2 |
|
10.13 |
* Restricted Stock Unit Deferral Agreement |
Current Report on Form 8-K dated
July 24, 2006
|
000-02525 |
99.3 |
|
10.14 |
* Director Deferred Stock Award Notice |
Current Report on Form 8-K dated
July 24, 2006
|
000-02525 |
99.4 |
|
10.15 |
* Huntington Bancshares Incorporated 2007 Stock and Long-Term Incentive Plan |
Definitive Proxy Statement for the 2007 Annual Meeting of Stockholders |
000-02525 |
G |
|
10.16 |
* First Amendment to the 2007 Stock and Long-Term Incentive Plan |
Quarterly report on Form 10-Q for the quarter ended September 30, 2007 |
000-02525 |
10.7 |
|
10.17 |
* Second Amendment to the 2007 Stock and Long-Term Incentive Plan |
Definitive Proxy Statement for the 2010 Annual Meeting of Shareholders |
001-34073 |
A |
|
10.18 |
* 2009 Stock Option Grant Notice to Stephen D. Steinour. |
Quarterly Report on Form 10-Q for the quarter ended March 31, 2009. |
001-34073 |
10.1 |
|
10.19 |
* Form of Consolidated 2012 Stock Grant Agreement for Executive Officers Pursuant to Huntington’s 2012 Long-Term Incentive Plan. |
Quarterly Report on Form 10-Q for the quarter ended June 30, 2012. |
001-34073 |
10.2 |
|
10.20 |
* Form of 2014 Restricted Stock Unit Grant Agreement for Executive Officers |
Quarterly Report on Form 10-Q dated July 30, 2014 |
001-34073 |
10.1 |
|
10.21 |
* Form of 2014 Stock Option Grant Agreement for Executive Officers |
Quarterly Report on Form 10-Q dated July 30, 2014 |
001-34073 |
10.2 |
|
10.22 |
* Form of 2014 Performance Stock Unit Grant Agreement for Executive Officers |
Quarterly Report on Form 10-Q dated July 30, 2014 |
001-34073 |
10.3 |
|
10.23 |
* Form of 2014 Restricted Stock Unit Grant Agreement for Executive Officers Version II |
Quarterly Report on Form 10-Q dated July 30, 2014 |
001-34073 |
10.4 |
|
10.24 |
* Form of 2014 Stock Option Grant Agreement for Executive Officers Version II |
Quarterly Report on Form 10-Q dated July 30, 2014 |
001-34073 |
10.5 |
|
10.25 |
*Form of 2014 Performance Stock Unit Grant Agreement for Executive Officers Version II |
Quarterly Report on Form 10-Q dated July 30, 2014 |
001-34073 |
10.6 |
|
10.26 |
*Huntington Bancshares Incorporated 2012 Long-Term Incentive Plan. Definitive Proxy Statement for the 2012 Annual Meeting of Shareholders. |
Definitive Proxy Statement for the 2012 Annual Meeting of Shareholders. |
001-34073 |
A |
|
10.27 |
*Huntington Bancshares Incorporated 2015 Long-Term Incentive Plan. Definitive Proxy Statement for the 2015 Annual Meeting of Shareholders |
Definitive Proxy Statement for the 2015 Annual Meeting of Shareholders |
001-34073 |
A |
|
10.28 |
*Form of 2015 Stock Option Grant Agreement |
Quarterly Report for the quarter ended June 30, 2015. |
001-34073 |
10.2 |
|
10.29 |
*Form of 2015 Restricted Stock Unit Grant Agreement. |
Quarterly Report for the quarter ended June 30, 2015. |
001-34073 |
10.3 |
|
10.30 |
*Form of 2015 Performance Share Unit Grant Agreement. |
Quarterly Report for the quarter ended June 30, 2015. |
001-34073 |
10.4 |
|
10.31 |
*Huntington Bancshares Incorporated Restricted Stock Unit Grant Agreement. |
Quarterly Report for the quarter ended March 31, 2015. |
001-34073 |
10.1 |
|
12.1 |
Ratio of Earnings to Fixed Charges. |
||||
12.2 |
Ratio of Earnings to Fixed Charges and Preferred Dividends. |
||||
14.1 |
Code of Business Conduct and Ethics dated January 14, 2003 and revised on January 15, 2013 and Financial Code of Ethics for Chief Executive Officer and Senior Financial Officers, adopted January 18, 2003 and revised on October 15, 2014, are available on our website at https://www.huntington.com/us/corp_governance.htm |
||||
21.1 |
Subsidiaries of the Registrant |
||||
23.1 |
Consent of PricewaterhouseCoopers LLP, Independent Registered Public Accounting Firm. |
||||
23.2 |
Consent of Deloitte & Touche LLP, Independent Registered Public Accounting Firm. |
||||
24.1 |
Power of Attorney |
||||
31.1 |
Rule 13a-14(a) Certification – Chief Executive Officer. |
||||
31.2 |
Rule 13a-14(a) Certification – Chief Financial Officer. |
||||
32.1 |
Section 1350 Certification – Chief Executive Officer. |
||||
32.2 |
Section 1350 Certification – Chief Financial Officer. |
||||
101 |
The following material from Huntington’s Form 10-K Report for the year ended December 31, 2015, formatted in XBRL: (1) Consolidated Balance Sheets, (2) Consolidated Statements of Income, (3), Consolidated Statements of Comprehensive Income, (4) Consolidated Statements of Changes in Shareholders’ Equity, (5) Consolidated Statements of Cash Flows, and (6) the Notes to the Consolidated Financial Statements. |
||||
* Denotes management contract or compensatory plan or arrangement. |
|||||
193